
Changes in Hydrophobic Interactions among Gluten Proteins during Dough Formation


1
Cereal Science Research Center of Tsukuba, Nisshin Flour Milling Inc., 13 Ohkubo Tsukuba, Ibaraki 300-2611, Japan
2
Degree Programs in Life and Earth Science, Graduate School of Science and Technology, University of Tsukuba, 1-1-1 Tennodai Tsukuba, Ibaraki 305-8577, Japan
3
Grain Research Laboratory, Canadian Grain Commission, 303 Main Street, Winnipeg, MB R3C 3G8, Canada
4
Institute of Crop Science, National Agriculture and Food Research Organization, 2-1-2 Kannondai Tsukuba, Ibaraki 305-8518, Japan
*
Author to whom correspondence should be addressed.
Processes 2021, 9(7), 1244; https://0-doi-org.brum.beds.ac.uk/10.3390/pr9071244
Submission received: 10 June 2021
/
Revised: 16 July 2021
/
Accepted: 16 July 2021
/
Published: 19 July 2021
(This article belongs to the Special Issue Processing and Properties Analysis of Grain Foods)
Abstract
:In this study, changes in hydrophobic interactions among gluten proteins were analyzed during dough mixing. Size-exclusion high-performance chromatography and two-dimensional fluorescence difference gel electrophoresis were performed on proteins extracted with 1-propanol by weakening the hydrophobic interaction. The amount of proteins extracted with 30% 1-propanol increased from the start of mixing to peak consistency, suggesting that the hydrophobic interactions among the strongly aggregated proteins weakened and resulted in disaggregation. The amount of proteins extracted with 10% 1-propanol decreased during hydration, indicating that these proteins aggregated through relatively weak hydrophobic interactions. The proteins that extractability decreased were mainly low molecular weight glutenin, α-gliadin, and γ-gliadin. The amount of monomeric proteins extracted with 30% 1-propanol decreased after peak consistency. The decreased protein was mainly ω-gliadin, indicating that ω-gliadin aggregated with other proteins through hydrophobic interactions. A front-face fluorescence analysis was performed on the dough with the addition of 8-anilino-1-naphthalenesulfonic acid or thioflavin T. The fluorescence intensity increased as a result of exposure to the hydrophobic groups of the gluten proteins and the formation of protein aggregates during dough mixing. These results indicate the importance of hydrophobic interactions in dough formation.
1. Introduction
Bread-making involves various processes, such as mixing, fermentation, proofing, and baking. Dough mixing is an important process that can affect the quality of the bread substantially, as viscoelastic gluten is formed during the mixing process. Many studies have been conducted to elucidate the mechanisms underlying gluten formation and structure [1,2,3]. Some early models emphasized the importance of intermolecular disulfide bonds [4,5,6]. However, since the late 1990s, most proposed gluten structures, such as the loop-train model [7] and hyper-aggregation model [8], have focused on noncovalent bonds. A recent study proposed a model in which different bonds or interactions play a role depending on the ratio of glutenin to gliadin during mixing [9]. Much debate remains in regard to the structure and formation of the gluten network [1,10,11,12]. This research theme has been one of the major issues that have continued until the present.
In terms of changes in protein during dough mixing, a decrease in glutenin macropolymer [13,14], a decrease in unextractable polymeric protein (UPP) by sodium dodecyl sulfate (SDS), and a decrease in the molecular weight of UPP have been reported [15]. These results have been attributed to protein depolymerization [13,14,15]. Additionally, a decrease [16] or increase [17,18] in free sulfhydryl groups during mixing has been reported. In addition, recent studies have reported data showing that SS binding does not continue to increase or decrease during mixing but increases in the early stage and then decreases significantly [9,19] or slightly [20] as the mixing intensity increases and then decreases. Thus, there were many reports on changes in SS bonds during dough formation. However, as no method has been established to measure noncovalent bonds directly, little remains known about changes in noncovalent bonds during mixing.
Noncovalent bonds include electrostatic interactions, hydrophobic interactions, and hydrogen bonds. In our previous investigation [21], we reported that noncovalent bonds weaken and the molecular size of polymeric proteins decrease during dough mixing, while ω-gliadin aggregates with other proteins through noncovalent bonds. However, we did not elucidate the behavior of each type of noncovalent bond, so which noncovalent bond was responsible for the aggregation of ω-gliadin during mixing remained unclear. Therefore, in this study, we focused on hydrophobic interactions, which is a kind of noncovalent bond, and studied changes in hydrophobic interactions during dough formation.
Wheat gluten proteins contain few ionizing groups but more than 35% hydrophobic amino acids [2] and, thus, promote hydrophobic interactions. The impact of salt on the properties of dough is often explained by gluten aggregation resulting from hydrophobic interactions [22]. Kinsella et al. [23] showed that, in the presence of F− or Cl−, the hydrophobic interaction becomes stronger, and the proteins remain aggregated, making hydration difficult. Melnyk et al. [24] demonstrated that kosmotropes, such as NaCl, reduce the water absorption of gluten and strengthen hydrophobic interactions.
Assessing the strength of hydrophobic interactions among proteins remains very challenging. Chen et al. [25] used the SDS-binding capacity [26] as an indicator for evaluating hydrophobic interactions and examined the effect of a NaCl addition but did not find a significant difference. Hydrophobic interactions have also been evaluated based on data from dough surface hydrophobicity generated by the front-face fluorescence method [27,28]. Bonomi et al. [27] pointed out that the variation in front-face fluorescence is large and discussed surface hydrophobicity without evaluating any significant differences, but Jazaeri et al. [28] discussed the data at a significance level of 10% (p < 0.1). In our previous report [21], we evaluated the strength of noncovalent bonds by extracting proteins with a series of SDS solutions, which weaken noncovalent bonds, at various concentrations. In this study, we analyzed hydrophobic interactions by extracting proteins in different concentrations of 1-proponol solutions, which weaken hydrophobic interactions. Furthermore, we used the front-face fluorescence method to examine the changes in the hydrophobic interactions during dough formation.
2. Materials and Methods
2.1. Wheat Flour
In the present study, we used the same two commercial flour samples (Nisshin Flour Milling Inc., Tokyo, Japan) as those used in a previous report [21]: one milled from hard wheat with a protein content of 14.5% (referred to as “HF” (high-protein flour)) and the other from semi-hard wheat with a protein content of 11.7% (referred to as “LF” (low- protein flour)) (dry basis).
2.2. Dough Sampling during Mixing
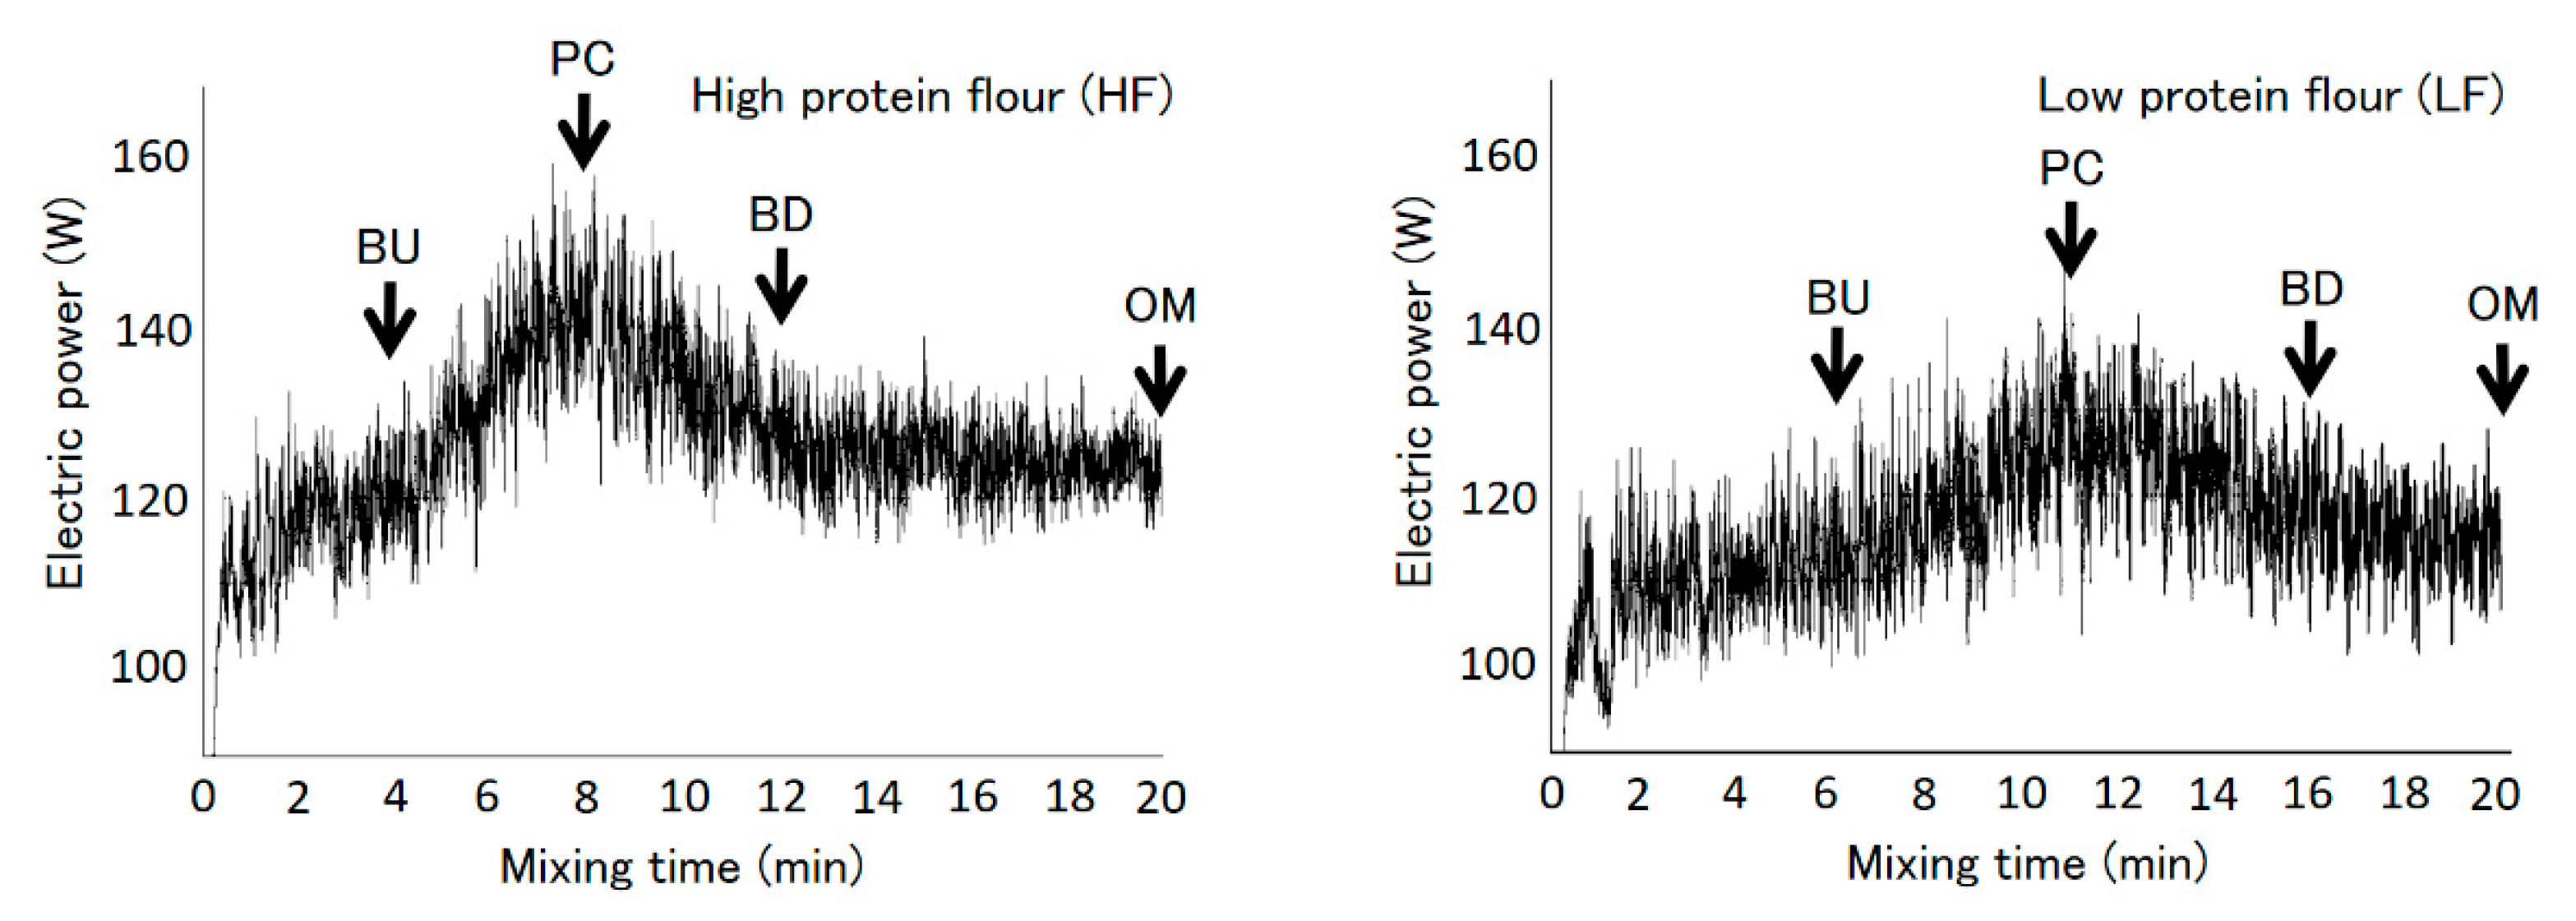
The dough was sampled as described in a previous report [21]. First, flour (200 g), distilled water (HF: 128.8 mL, LF: 117.4 mL; mean water absorption for the farinograph), and NaCl (4 g) were mixed at a constant temperature of 27 °C using a Swanson mixer (National Mfg. Co., Lincoln, NE, USA). All dough samples were mixed at 120 rpm (Association for Cereal Chemistry International standard mixing method 54-70.01) [29] for 20 min to reach overmixing conditions. A data logger (AF-1700; ATTO Co., Tokyo, Japan) was used to monitor the change in electric power during mixing. Figure 1 shows the mixing curves. Dough samples were collected at the following time points: dough buildup (HF: 4 min, LF: 6 min), peak consistency (HF: 8 min, LF: 11 min), dough breakdown (HF: 12 min, LF: 16 min), and overmixing (20 min).
2.3. Protein Extraction
Regarding the protein extraction, 30% or 10% 1-propanol was used as a solvent to weaken the relatively strong or weak hydrophobic interaction, and the proteins were extracted as described in a previous report [21]. Immediately after sampling, the dough sample (1 g) was homogenized with 20 mL of 30% or 10% 1-propanol (hereafter “extraction solvent”) at 10,000 rpm for 5 min (Ace-AM10; Nihonseiki Kaisha Ltd., Tokyo, Japan). After centrifugation at 5000× g for 10 min, the supernatant was collected, and extraction solvent (1 mL) was added to the residue. The suspension was centrifuged after stirring, and the supernatant was collected. The two supernatants were then combined and mixed, and an automated protein analyzer (Kjeltech 8400; FOSS, Hillerød, Denmark) was used to determine the amount of protein (N × 5.7). Each extraction procedure was repeated six times.
2.4. Analysis of Protein Size Distribution by Size-Exclusion High-Performance Liquid Chromatography (SE-HPLC)
Size-exclusion high-performance liquid chromatography (SE-HPLC) was performed in accordance with a previous report [21]. The extracted protein solutions were made up to 100 mL with extraction solvent and then diluted twice with extraction solvent and passed through a 0.45-μm filter. An SE-HPLC system composed of an HPLC system (Chromaster; Hitachi High-tech Science, Tokyo, Japan) consisting of an online degasser, gradient pump, auto injector, column oven, and ultraviolet (UV) detector was used to analyze the molecular size distribution of the proteins. A size-exclusion column (300 × 7.8 mm i.d., 3 μm, Yarra SEC-4000; Phenomenex, Torrance, CA, USA) was used for separation. Phosphate buffer (50 mM, pH 7.0) containing 0.5% SDS was used as the mobile phase. All samples (50 μL) were then eluted at 35 °C at a flow rate of 0.5 mL/min.
Open LAB software (Hitachi High-tech Science) was used to integrate the UV signal (214 nm). We then multiplied the amount of extracted protein by the area ratio in the HPLC chromatogram to calculate the amount of protein in each fraction.
2.5. Analysis of Protein Composition by SDS-Polyacrylamide Gel Electrophoresis (SDS-PAGE)
The individual protein fractions separated by SE-HPLC in four independent runs were then combined, and trichloroacetic acid was added to make a final concentration of 20%, followed by vortexing. After 30 min of immersion in ice, the sample was centrifuged at 12,000× g for 5 min to precipitate proteins. After, the supernatant was discarded, and 2 mL of cold acetone was added. Then, the mixture was vortexed and centrifuged at 12,000× g for 5 min to remove nonprotein contaminants. This operation was repeated. After discarding the supernatant, the precipitated protein was dissolved in the sample buffer (20 μL; 1% SDS, 0.1-M Tris HCl, 20% glycerol, and an appropriate amount of bromophenol blue) for SDS-PAGE. Both with and without 2-mercaptoethanol (3 μL), the samples were heated at 95 °C for 3 min, cooled at room temperature, and then analyzed by SDS-PAGE on a Mini Protean Tetra System (Bio-Rad Laboratories, Hercules, CA, USA) at 200 A for 30 min using a mini protean 7.5% TGX gel and electrophoresis buffer (25-mM Tris-HCl, 192-mM glycine, and 0.1% SDS).
The gel was removed from the plate after electrophoresis, dyed with Oriole Fluorescent Gel Stain (Bio-Rad Laboratories) for 90 min, and scanned (ImageQuant LAS 4000; Cytiva, Tokyo, Japan).
2.6. Protein Identification by Two-Dimensional Fluorescence Difference Gel Electrophoresis (2D-DIGE)
Two-dimensional fluorescence difference gel electrophoresis (2D-DIGE) was performed as described in a previous report [21]. The mixtures of protein aggregates (A) or monomeric proteins (B) in Figure 2 collected twice were concentrated to 200 μL using a 10-kDa or 3-kDa cutoff ultrafiltration column (Vivaspin 20; Sartorius Lab Instruments, Göttingen, Germany). Next, 1.8 mL of cold acetone containing 10% trichloroacetic acid was added to the concentrated protein solution, which was then stored at −20 °C for 4 h. Following centrifugation at 14,000× g for 8 min to precipitate proteins, the supernatant was discarded. Then, 1 mL of cold acetone was added and stored at −20 °C for 10 min. Following centrifugation at 14,000× g for 8 min, the supernatant was discarded, and the residue was air-dried for 5 min. Next, 15 μL of swelling solution in the Glycine system reagent set for Auto2D (Merck, Tokyo, Japan) was added, followed by vortexing for 10 min. Then, 1 μL of 200 pmol fluorescent dye (IC3-Osu; Dojindo Laboratories, Kumamoto, Japan) or 1 μL of 200 pmol fluorescent dye (IC5-Osu; Dojindo Laboratories) dissolved in N,N-dimethylformamide, and 0.5 μL of 1.5-M Tris-HCl buffer (pH 8.8) was added to 10 μL of each sample at each mixing time. As an internal standard, 2 μL of each sample at each mixing time was mixed, followed by the addition of 1 μL of 200 pmol cyDye DIGE Fluor Cy2 minimal dye (Cytiva) and 0.5 μL of 1.5-M Tris- hydrochloric acid buffer (pH 8.8). Each sample and the internal standard were stored in the dark at 4 °C for 1 h for labeling; after which, 1 μL of 10-mM lysine was added to each sample and the labeled internal standard, and the mixture was stored at 4 °C for 10 min. Then, 2 μL of internal standard labeled with Cy2, 2 μL of sample labeled with IC3, 2 μL of sample labeled with IC5, and 7 μL of swelling fluid (swelling fluid:1-M dithiothreitol:ampholyte = 113.4:6:0.6) were mixed. The prepared mixture was then loaded for 2D-DIGE using Auto-2D plus (Merck). The electrophoresis conditions were set based on the desalting mode recommended by the manufacturer. An isoelectric focusing chip (pH 3–10) and a 10% PAGE chip (Merck) were used for the Auto-2D electrophoresis. Next, the gel was removed from the plate and scanned using Amersham Typhoon (Cytiva), and then, an Ettan DIGE analysis was carried out using Melanie 9 software (Cytiva).
2.7. Front-Face Fluorescence Method
The water was replaced with 400-μM 8-anilinonaphthalene sulfonic acid (8-ANS) and 50-μM thioflavin T to analyze the dough surface hydrophobicity and protein aggregation, respectively. The dough used for the front-face fluorescence analysis was prepared as described in Section 2.2. HF and LF samples were collected from the start of the mixing after 2, 4, 6, 8, 10, 12, 16, and 20 min. Immediately after sampling, the dough was covered with plastic wrap, and an optical fiber from the fluorescence spectrometer (F-7000; Hitachi High-tech Science) was pushed into the samples to measure the fluorescence intensity. Next, 8-ANS and thioflavin T fluorescence were monitored by the emission spectra from 350 to 600 nm, with excitation at 384 nm and 435 nm, respectively, and the height of the peaks in the emission spectra was assumed to correspond to the fluorescence intensity, which was then compared between samples.
2.8. Statistics
Tukey’s method was applied to determine significant differences in the SE-HPLC (p < 0.05, n = 6) and front-face fluorescence analyses (p < 0.1, n = 6) using JMP software (SAS Institute Inc., Cary, NC, USA), and analysis of variance was applied to determine significant differences (p < 0.05, n = 4) in the 2D-DIGE analysis using Melanie 9 software (Cytiva).
3. Results and Discussion
3.1. Definition of Protein Fractions
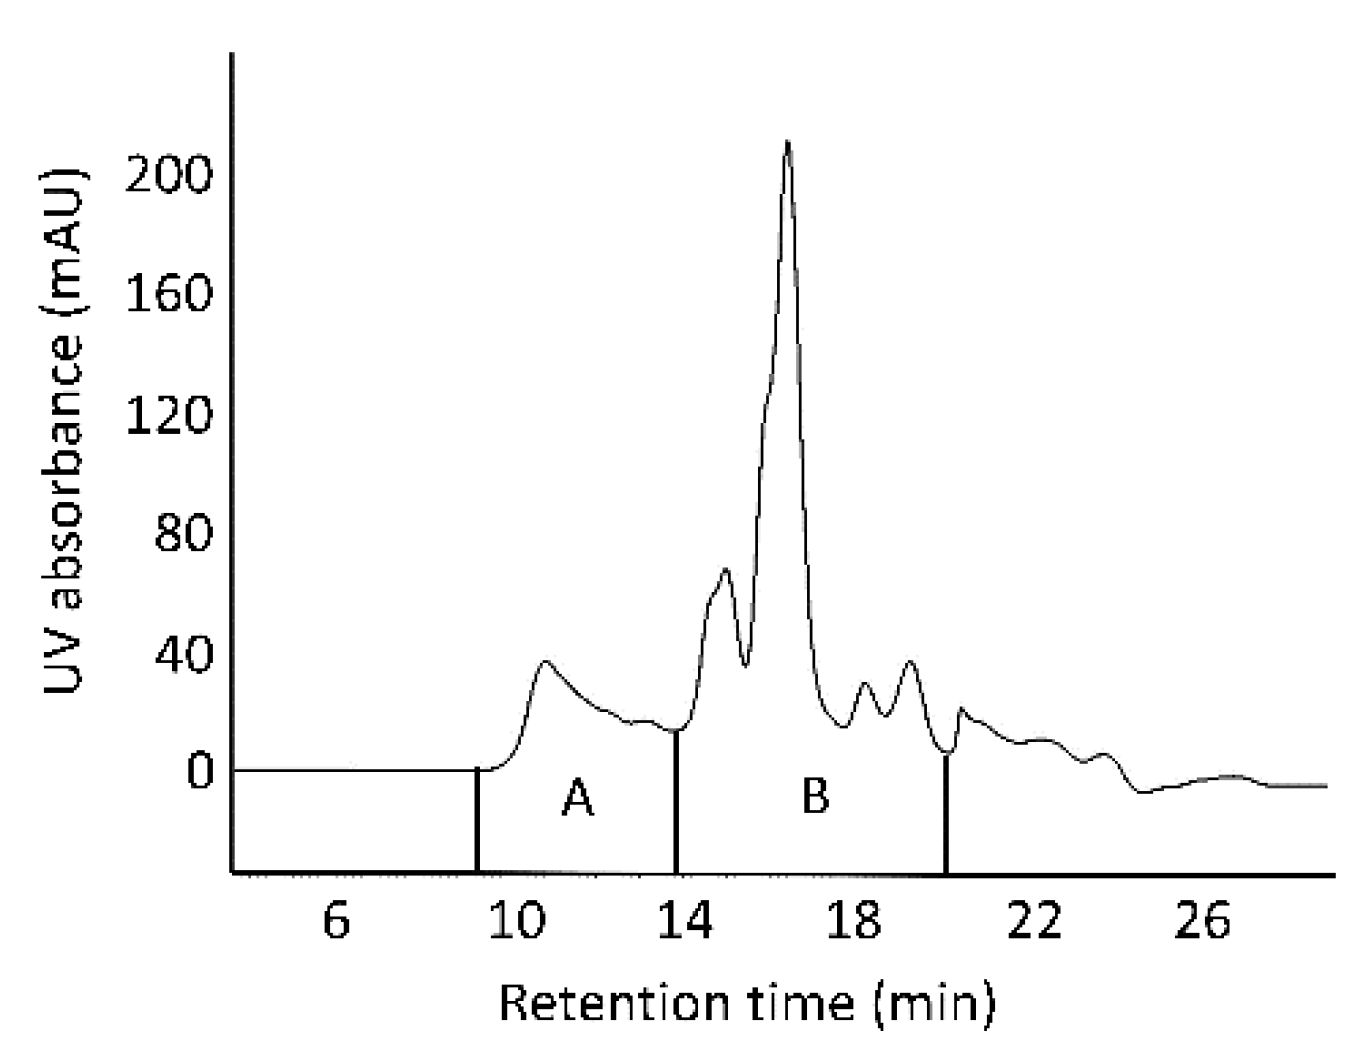
Figure 2 shows an SE-HPLC chromatogram of the protein extracted with 30% 1-propanol, with two fractions (A and B) collected for analysis.
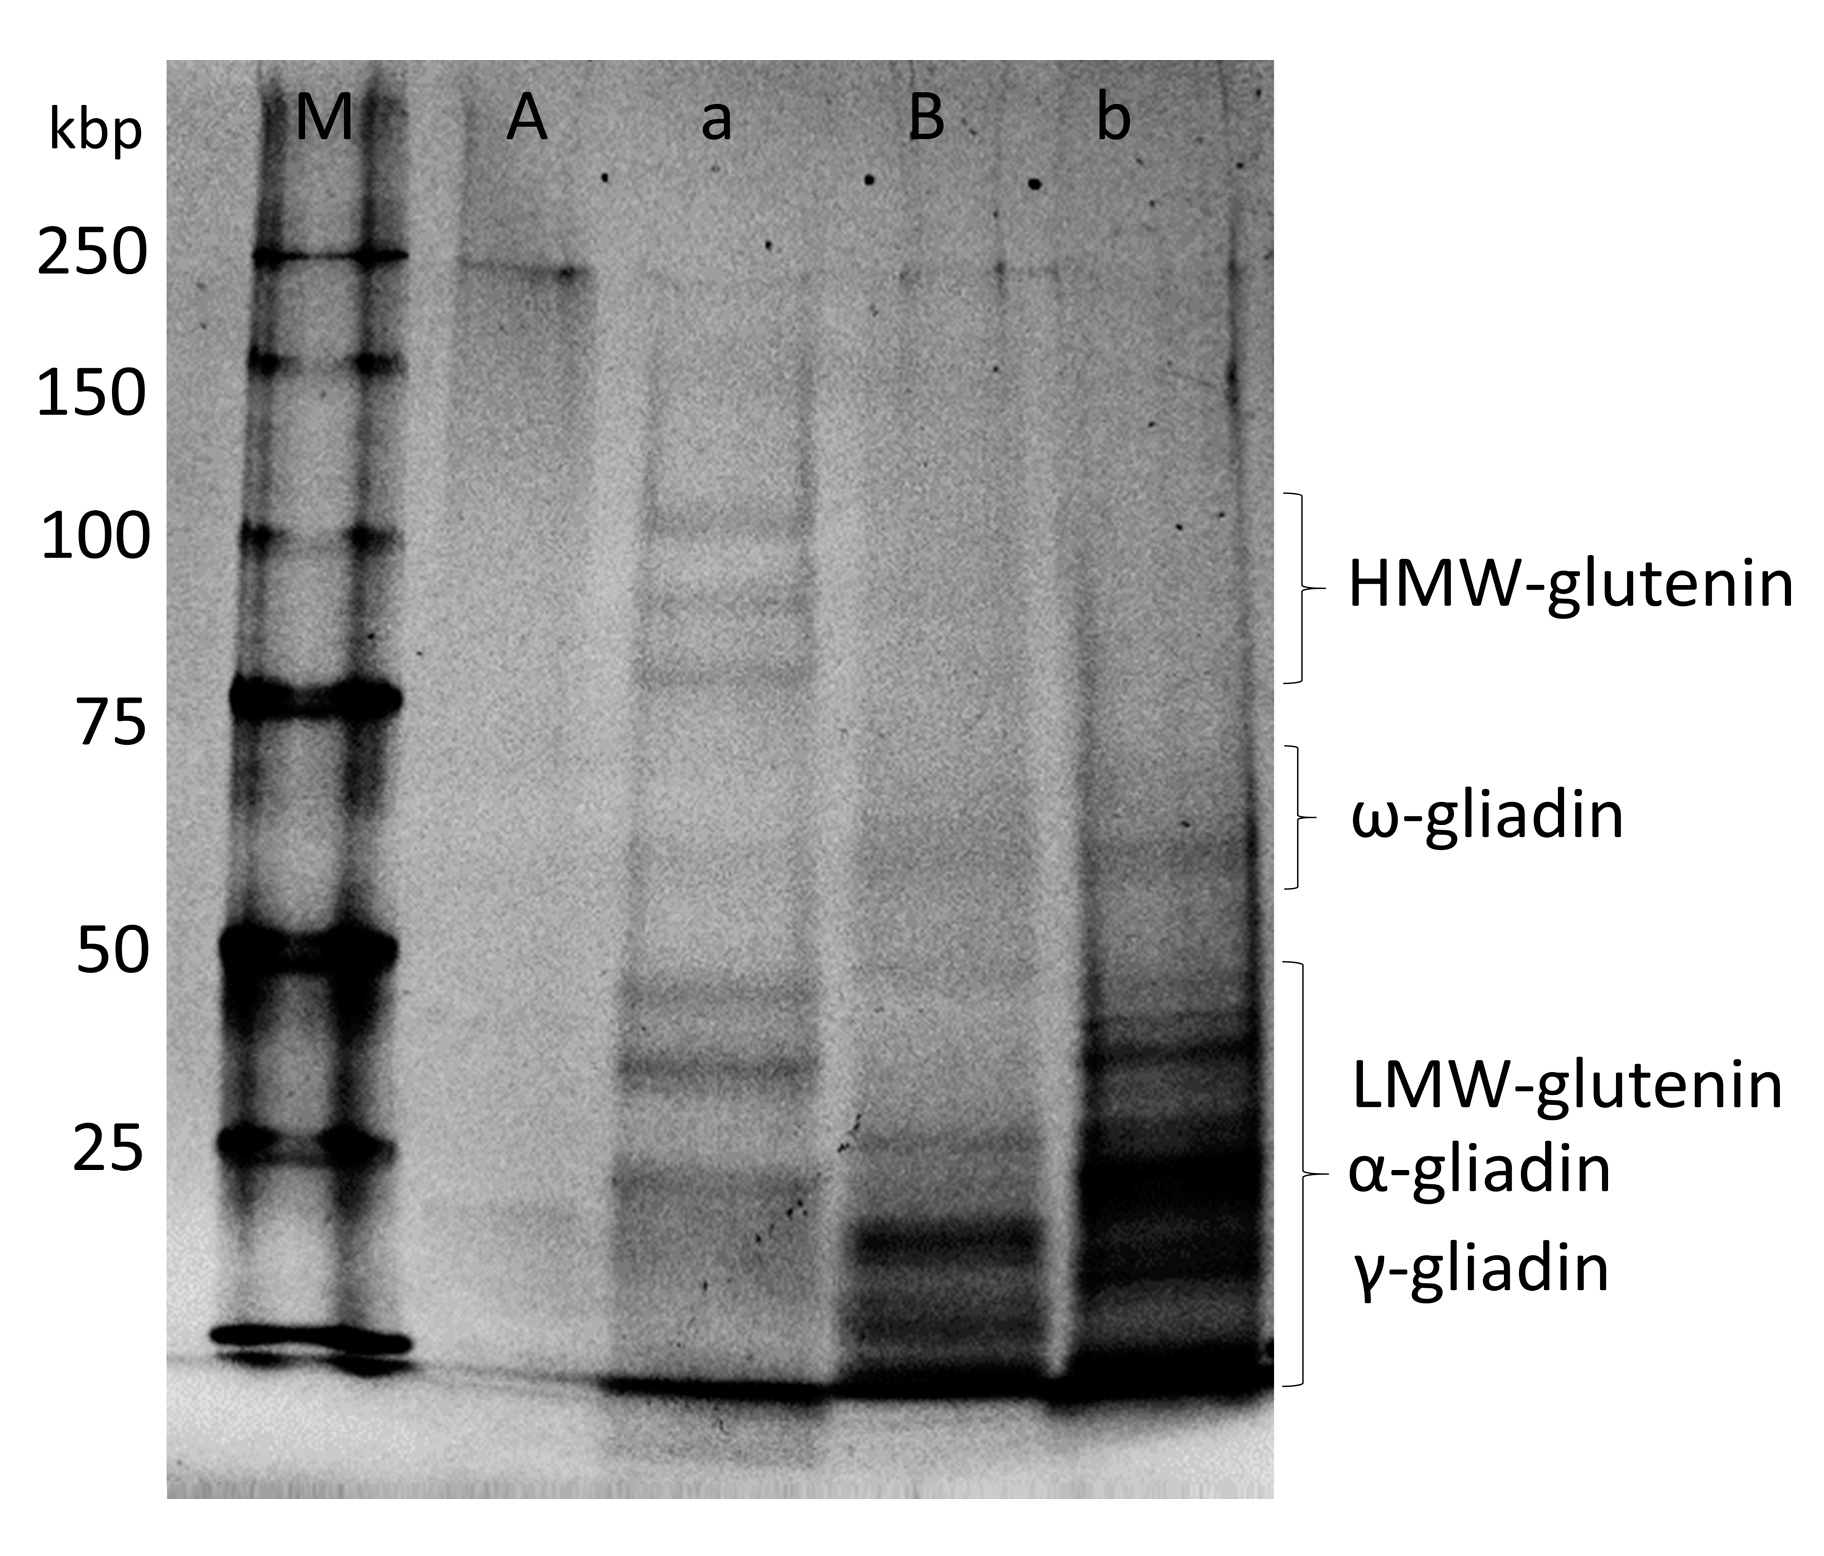
Each of the fractions was concentrated, and SDS-PAGE was performed. The results are shown in Figure 3. Under nonreducing conditions (A and B), some of proteins in fraction A were stacked in the end part of the gel, and others appeared to be smeared in the high molecular region, because they existed as “polymers” and/or “aggregates”, whereas the proteins in fraction B existed only as “monomers” because no stacked or smeared proteins were observed. Fraction B did not show any high molecular glutenin subunits under the reducing condition, which indicates that this fraction did not contain any polymeric proteins. Fraction A was defined and discussed as “polymeric proteins” in previous reports [30,31]. However, a small amount of ω-gliadins appeared to be present in this polymeric protein fraction. Since ω-gliadins do not have cysteines and cannot form disulfide bonds, they are most likely bonded to the polymeric glutenin proteins through strong, noncovalent bonds. Fraction A consisted largely of polymeric proteins of glutenin subunits linked through disulfide bonds, with some protein aggregates of monomeric proteins linked by noncovalent bonds. As this report focuses on hydrophobic interactions, fraction A is defined as “protein aggregates”.
3.2. Changes in Hydrophobic Interactions during Mixing
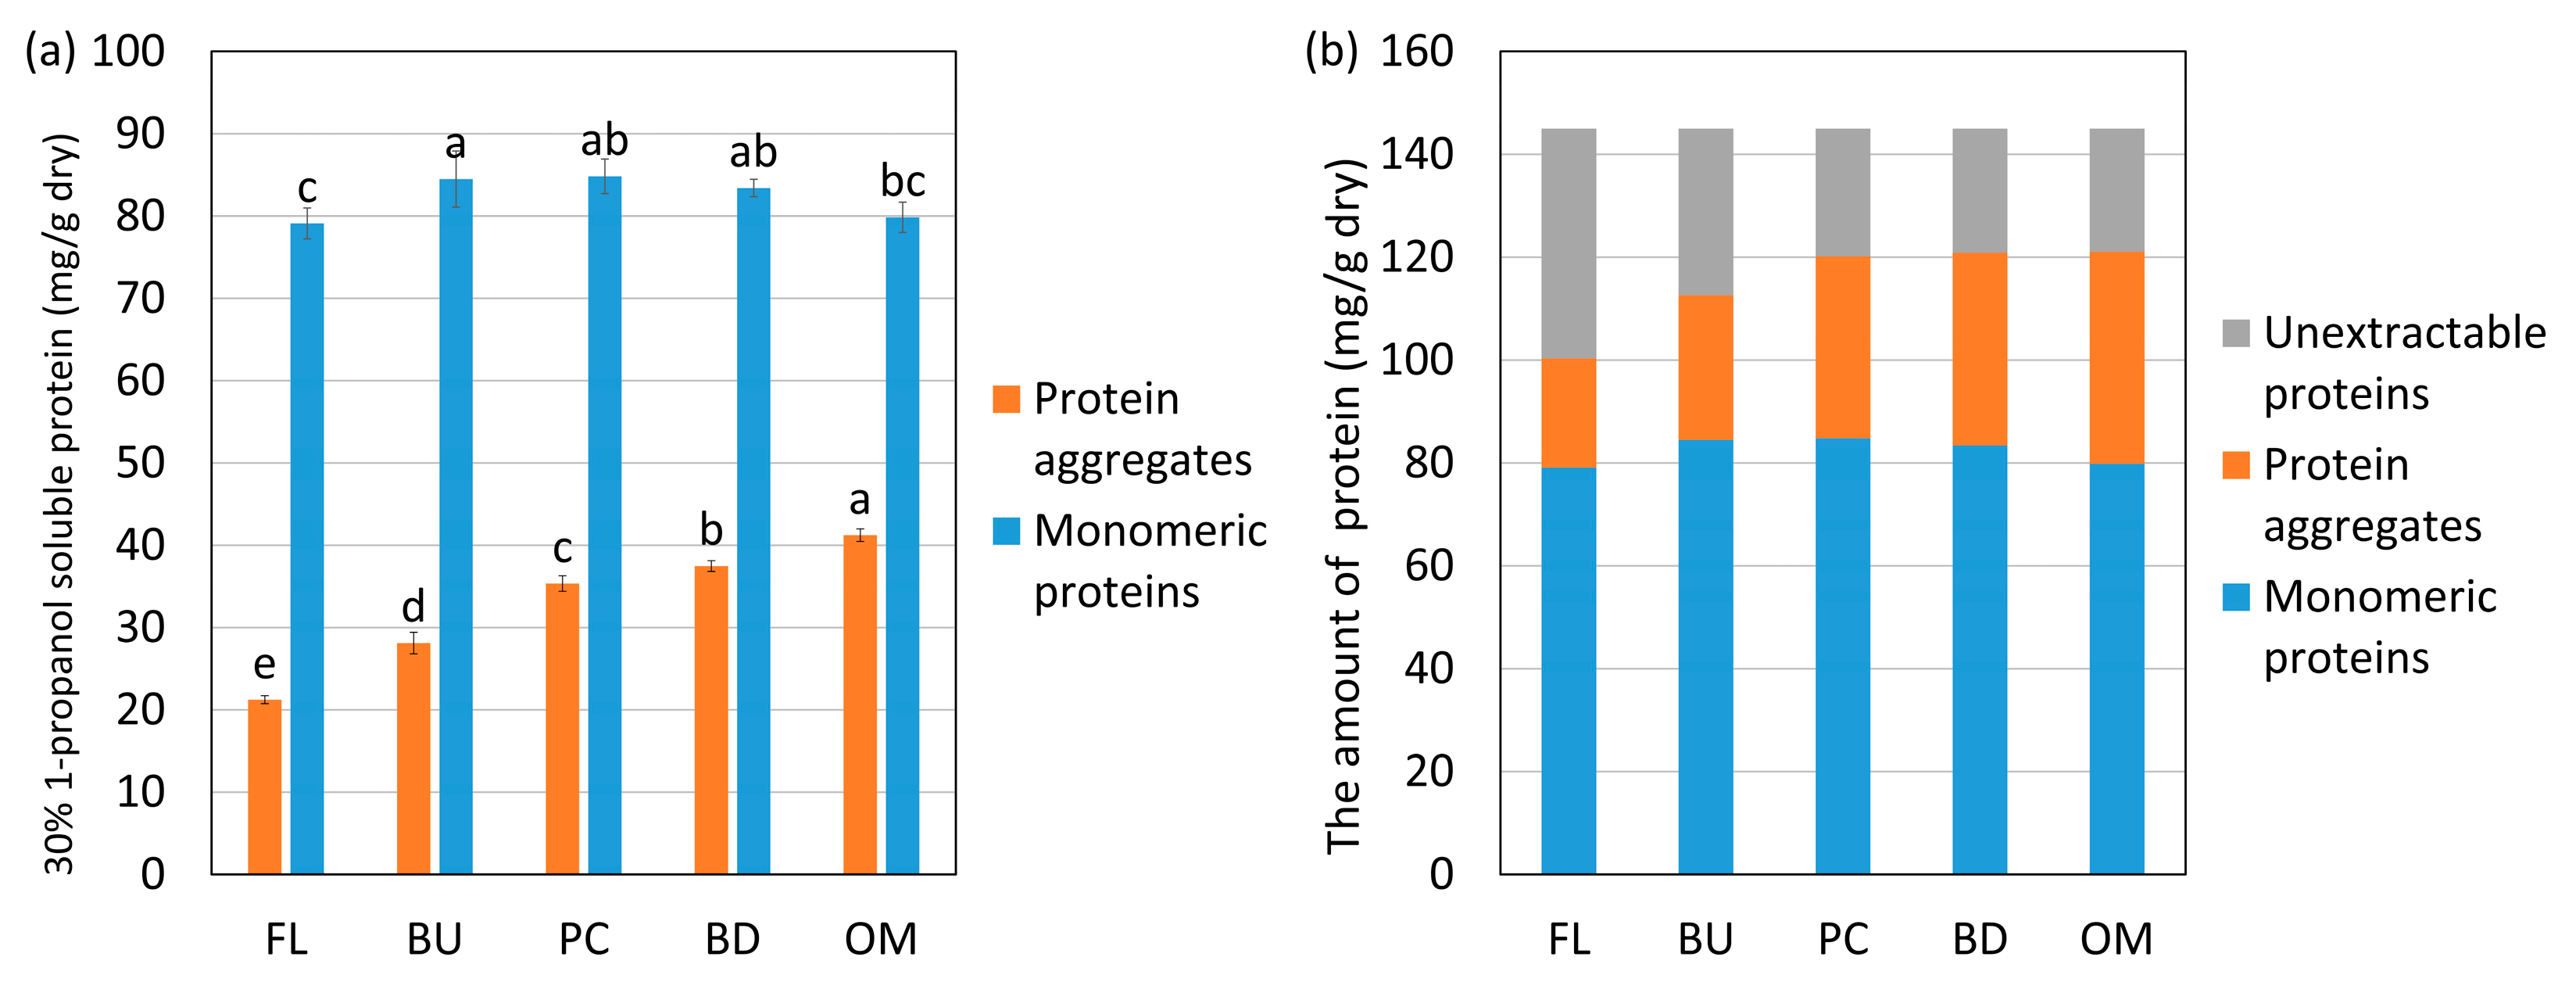
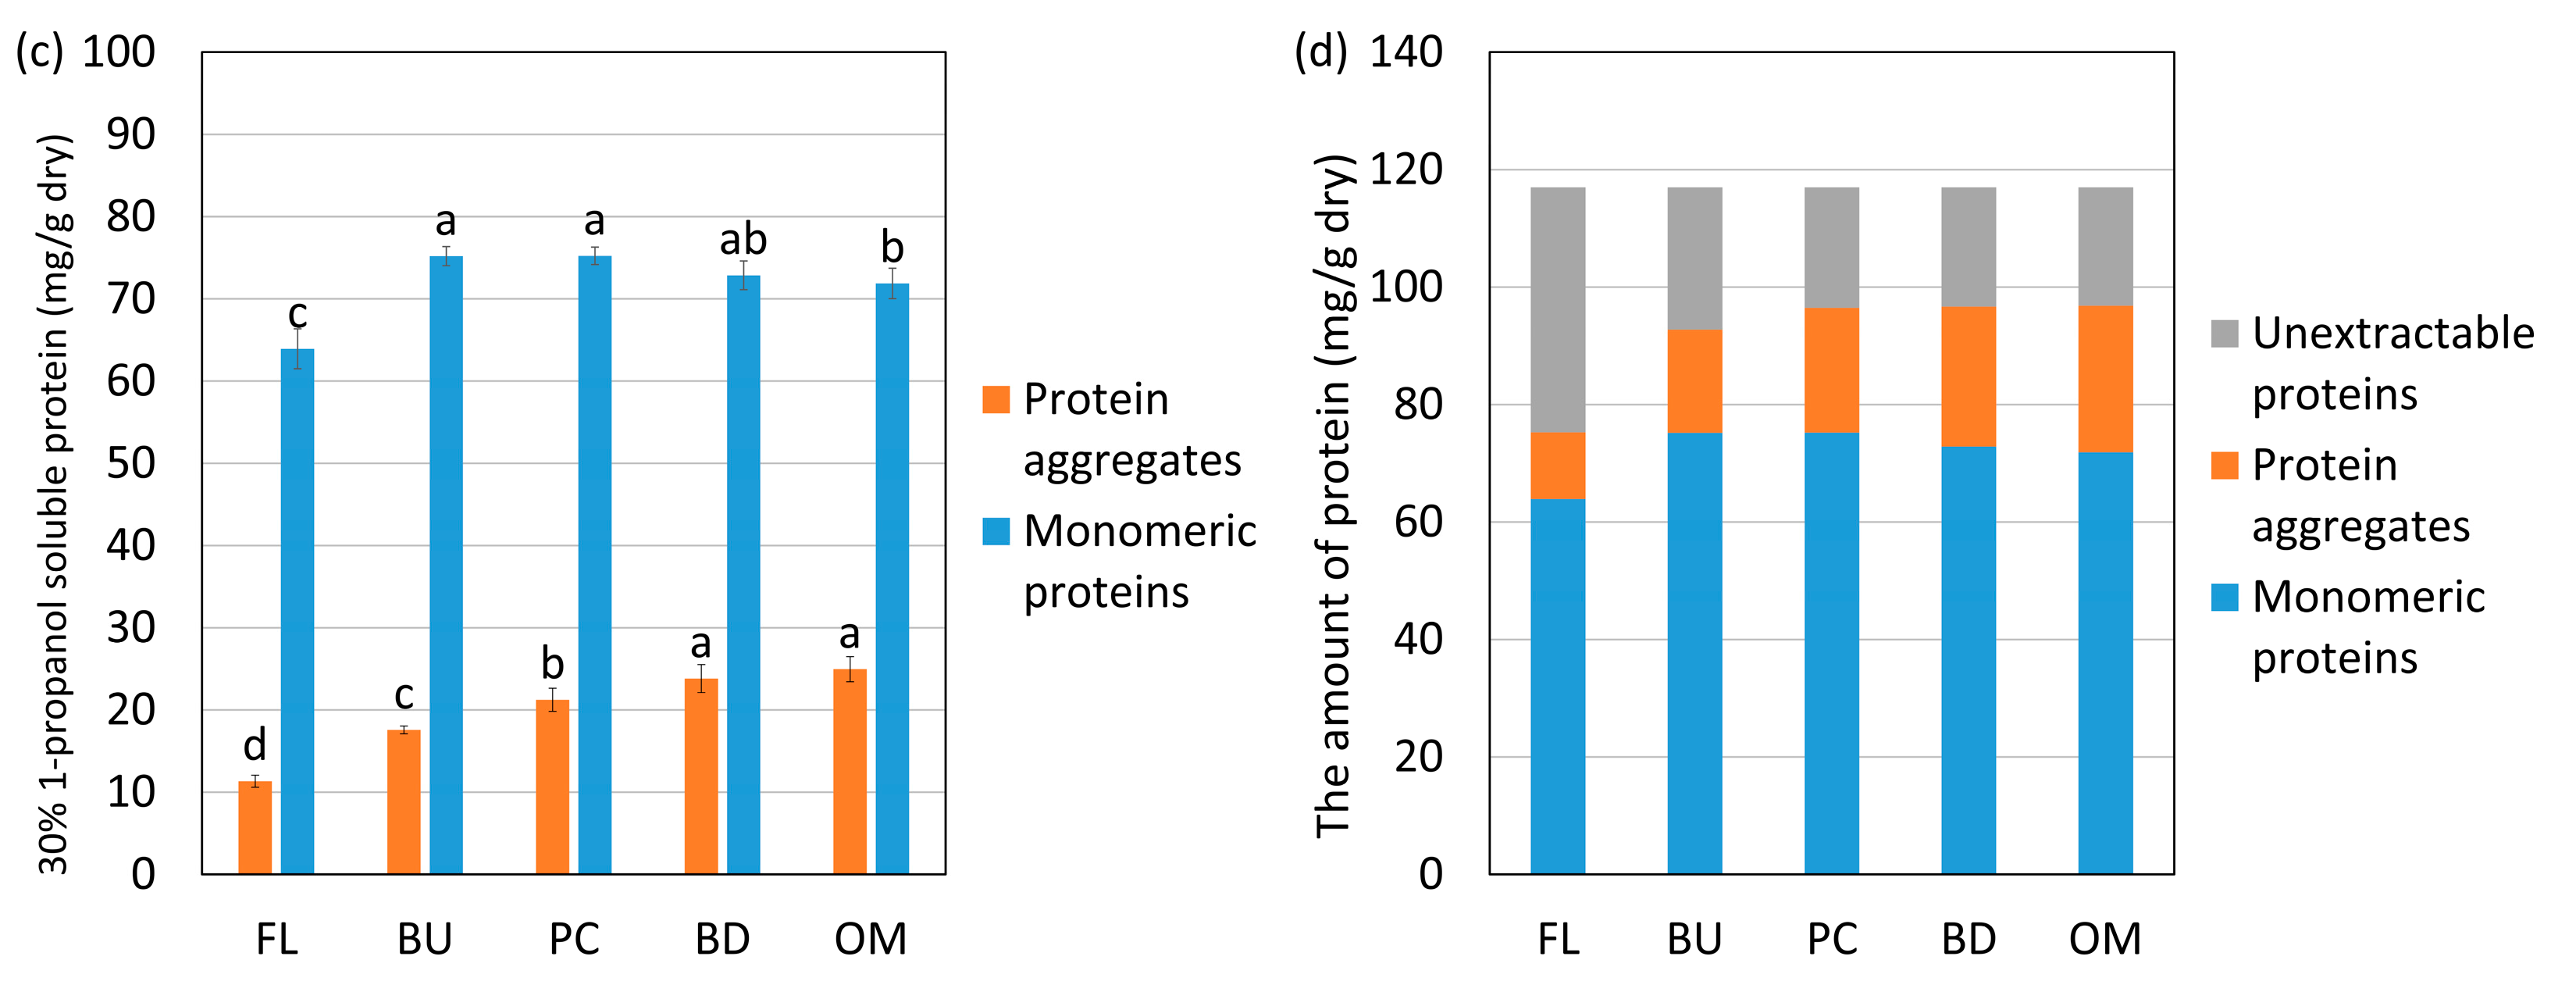
The changes in the amounts of monomeric proteins and protein aggregates—respectively, “A” and “B”, as defined in Figure 2—extracted with 30% 1-propanol are shown in Figure 4. The solvent 30% 1-propanol weakens relatively strong hydrophobic interactions. In Figure 4, the protein aggregates and monomeric proteins extracted with 30% propanol are shown in orange and blue, respectively. The amount of proteins extracted with 30% 1-propanol was subtracted from the total amount of proteins and is shown in gray as unextractable proteins. The hydrophobic interactions in the unextractable proteins are so strong that they cannot be extracted with 30% 1-propanol. The monomeric proteins and protein aggregates increased and unextractable proteins decreased until reaching the peak consistency in HF and LF. These results indicate that the hydrophobic interactions were weakened up to the peak consistency, so the unextractable proteins disaggregated and became extractable. After reaching the peak consistency, the monomeric proteins decreased, protein aggregates increased, and the amount of unextractable proteins did not change in HF or LF. Thus, the aggregation of the monomeric proteins due to hydrophobic interactions was stronger than the disaggregation after reaching the peak consistency.
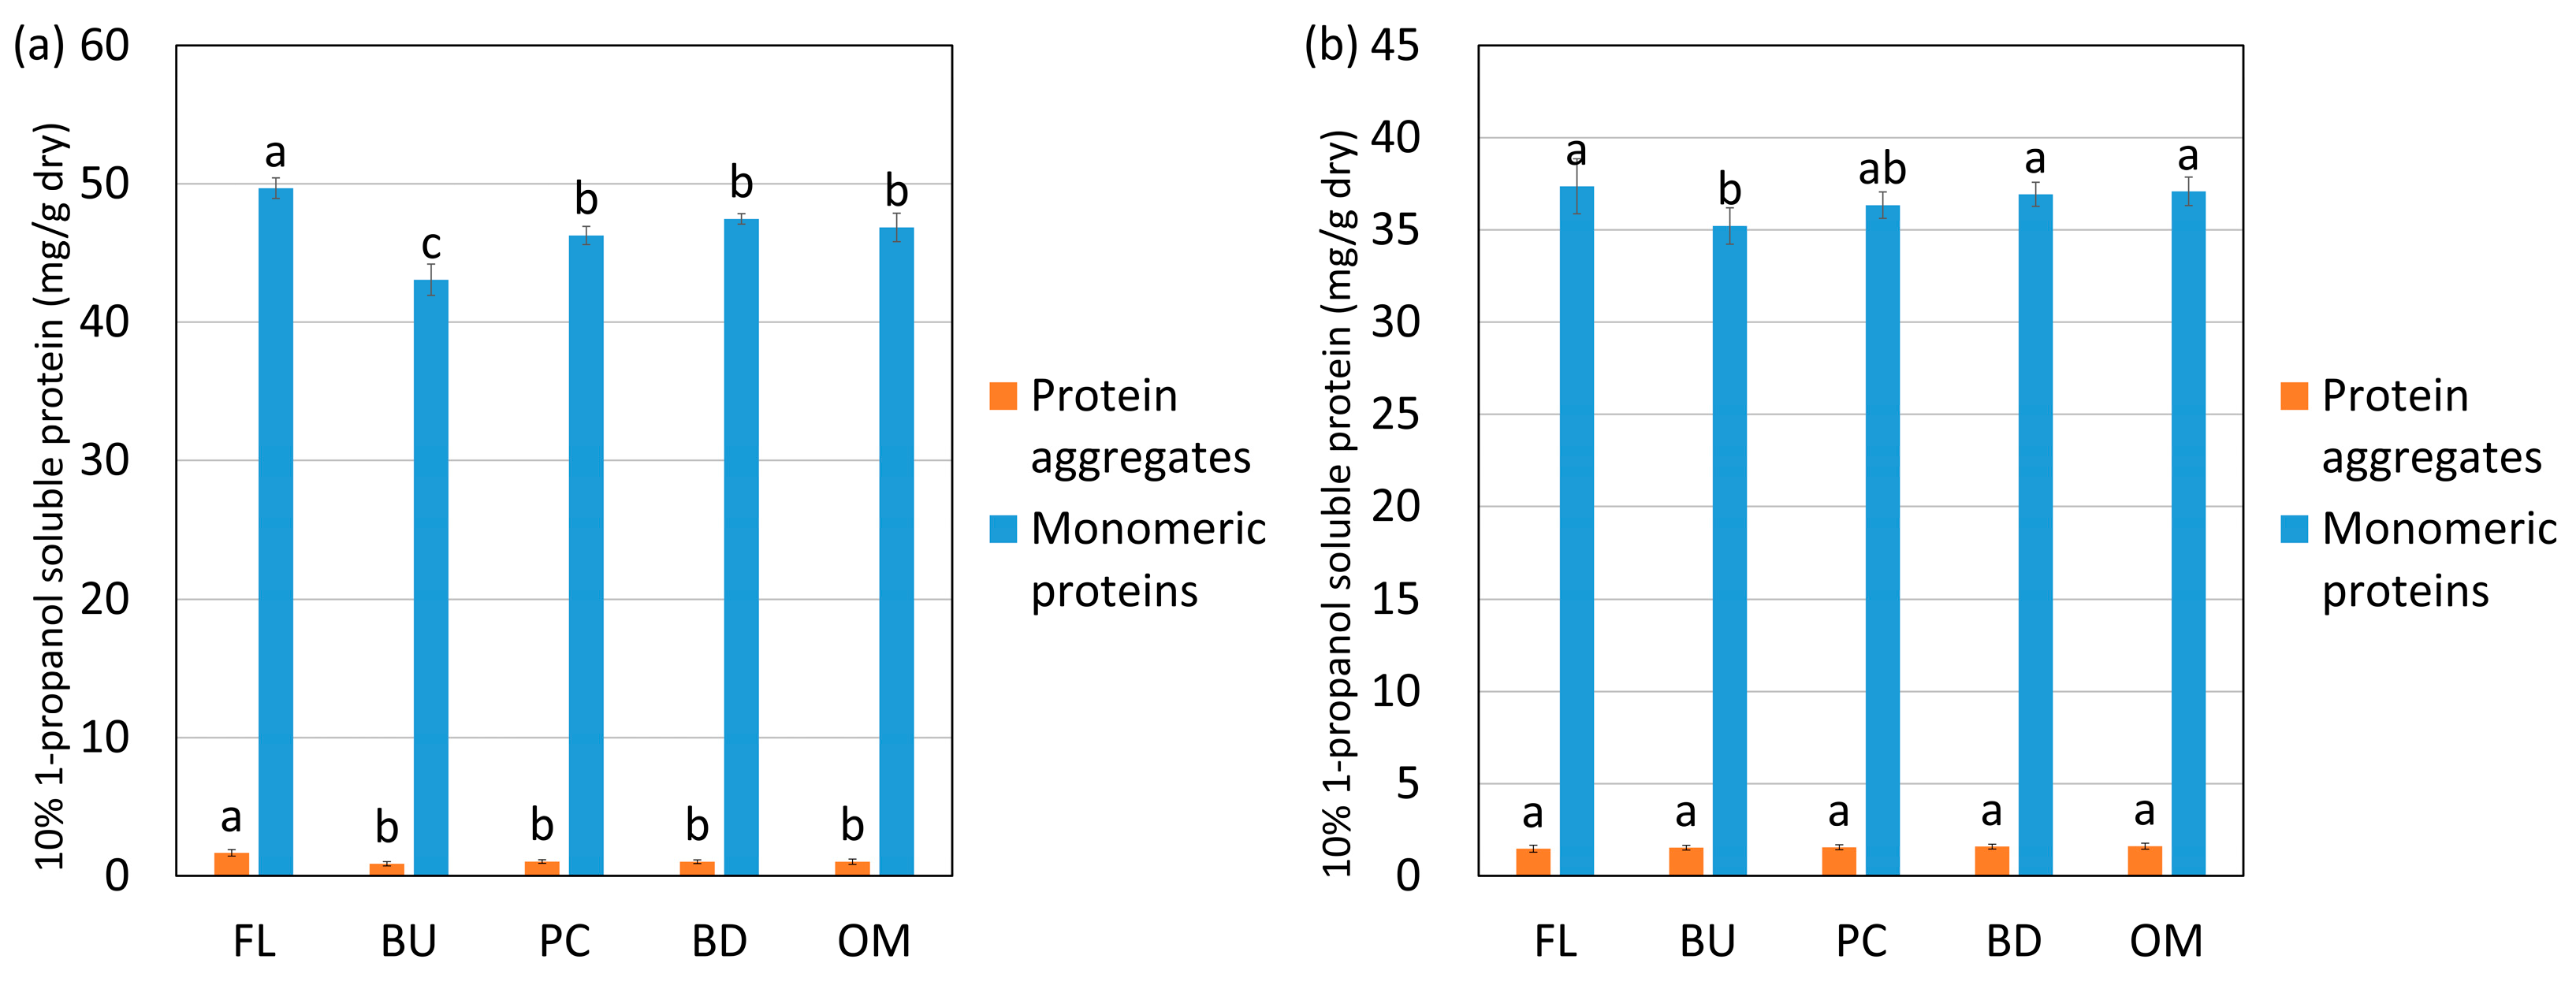
The changes in the amount of monomeric proteins and protein aggregates extracted with 10% 1-propanol are shown in Figure 5. The solvent 10% 1-propanol weakens the relatively weak hydrophobic interactions. The monomeric proteins and protein aggregates extracted with 10% 1-propanol decreased significantly when water was added (from flour to buildup) in HF, whereas only the monomeric proteins decreased in LF. These data suggested that monomeric proteins aggregated through relatively weak hydrophobic interactions during hydration and could not be extracted with 10% 1-propanol.
Gluten proteins in dough are aggregated through noncovalent bonds and are hardly soluble in water but soluble in organic solvents [32,33,34]. The reason why proteins are solubilized in organic solvents is that the hydrophobic groups of the organic solvent weaken the hydrophobic interactions of the proteins. High concentrations of organic solvents are highly hydrophobic and, therefore, weaken almost all hydrophobic interactions of proteins, including relatively strong ones, whereas low concentrations of organic solvents weaken only relatively weak ones. It is possible to evaluate the hydrophobic interactions of different strengths by quantifying the proteins extracted in each concentration of organic solvent.
A solvent with high hydrophobicity should be effective in weakening strong hydrophobic interactions; however, it is difficult to solubilize highly hydrophobic solvents, such as hexane, in an aqueous environment. This is because highly hydrophobic solvents repel the water in the dough, making it difficult for the solvent to enter. Therefore, lower alcohols with an appropriate degree of hydrophilicity are advantageous for the evaluation of hydrophobic interactions. Bean et al. [35] reported that the amount of protein extracted with 30–50% 1-propanol was the highest among various concentrations of lower alcohols. In the present study, we defined hydrophobic interactions that could be weakened by 10% propanol as “relatively weak” and those that could be weakened by 30% but not 10% 1-propanol as “relatively strong”.
3.3. Identification of Monomeric Proteins Incorporated in Protein Aggregates during Mixing
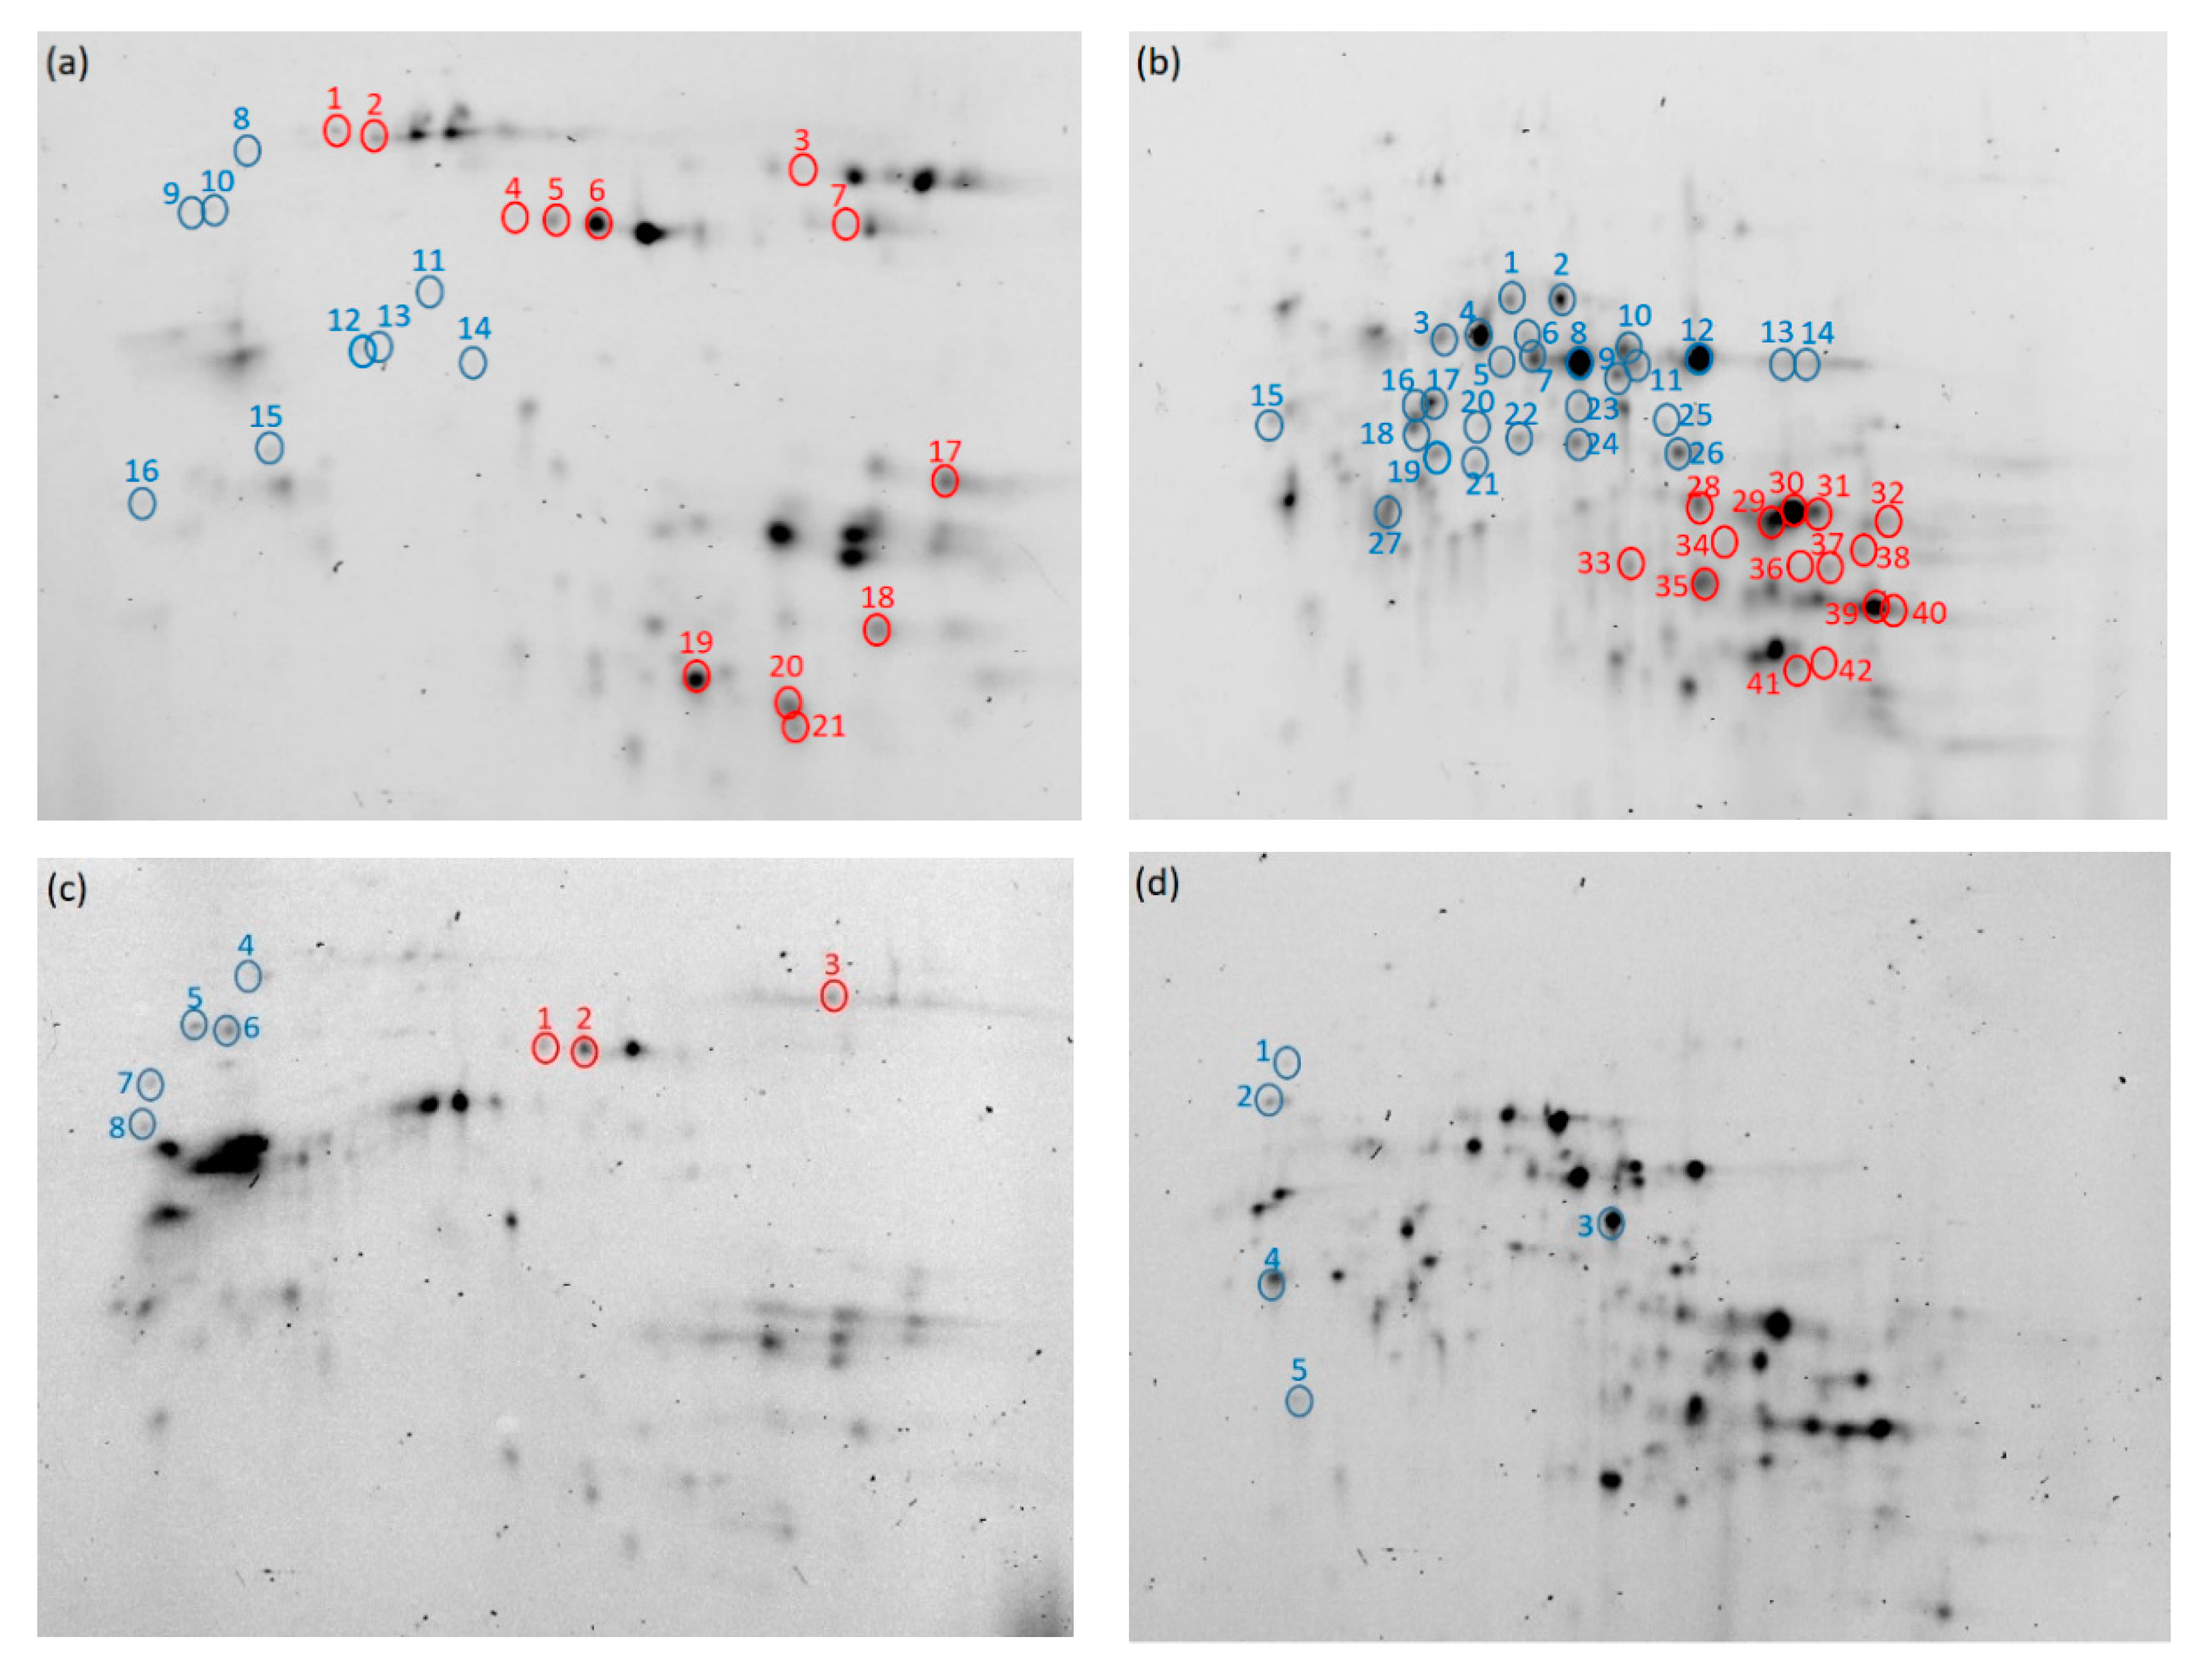
Figure 6 shows electrophoretic images of monomeric proteins and protein aggregates extracted with 30% 1-propanol. The blue circles indicate decreased protein, and the red circles indicate increased protein after the dough buildup stage (n = 4, p < 0.05). Each protein was identified based on Dupont et al. [36]. The results are shown in Table 1 and Table 2 (HF) and in Table 3 and Table 4 (LF).
Omega-gliadin in the monomeric proteins in HF increased when hydrated (from flour to buildup) and decreased after buildup (Figure 6b and Table 2). Omega-gliadin in the protein aggregates in HF decreased during mixing (Figure 6a and Table 1). These results suggest that the hydrophobic interactions weakened and ω-gliadin disaggregated during hydration; after which, the hydrophobic interactions between ω-gliadin and the other proteins became stronger and aggregated, and then, ω-gliadin in the protein aggregates aggregated further and insolubilized. Omega-gliadin in the monomeric proteins (Figure 6d and Table 4) and protein aggregates (Figure 6c and Table 3) in LF decreased during mixing, suggesting that ω-gliadin aggregates with other proteins.
HMW-glutenin, LMW-glutenin, α-gliadin, and γ-gliadin in the protein aggregates in HF (Figure 6a and Table 1) and HMW-glutenin in the protein aggregates in LF (Figure 6c and Table 3) all increased during mixing. These data indicate that the hydrophobic interactions of unextractable proteins weakened during mixing. LMW-glutenin, α-gliadin, and γ-gliadin in the monomeric proteins in HF (Figure 6b and Table 2) increased after buildup, indicating that these proteins disaggregate to release monomeric proteins.
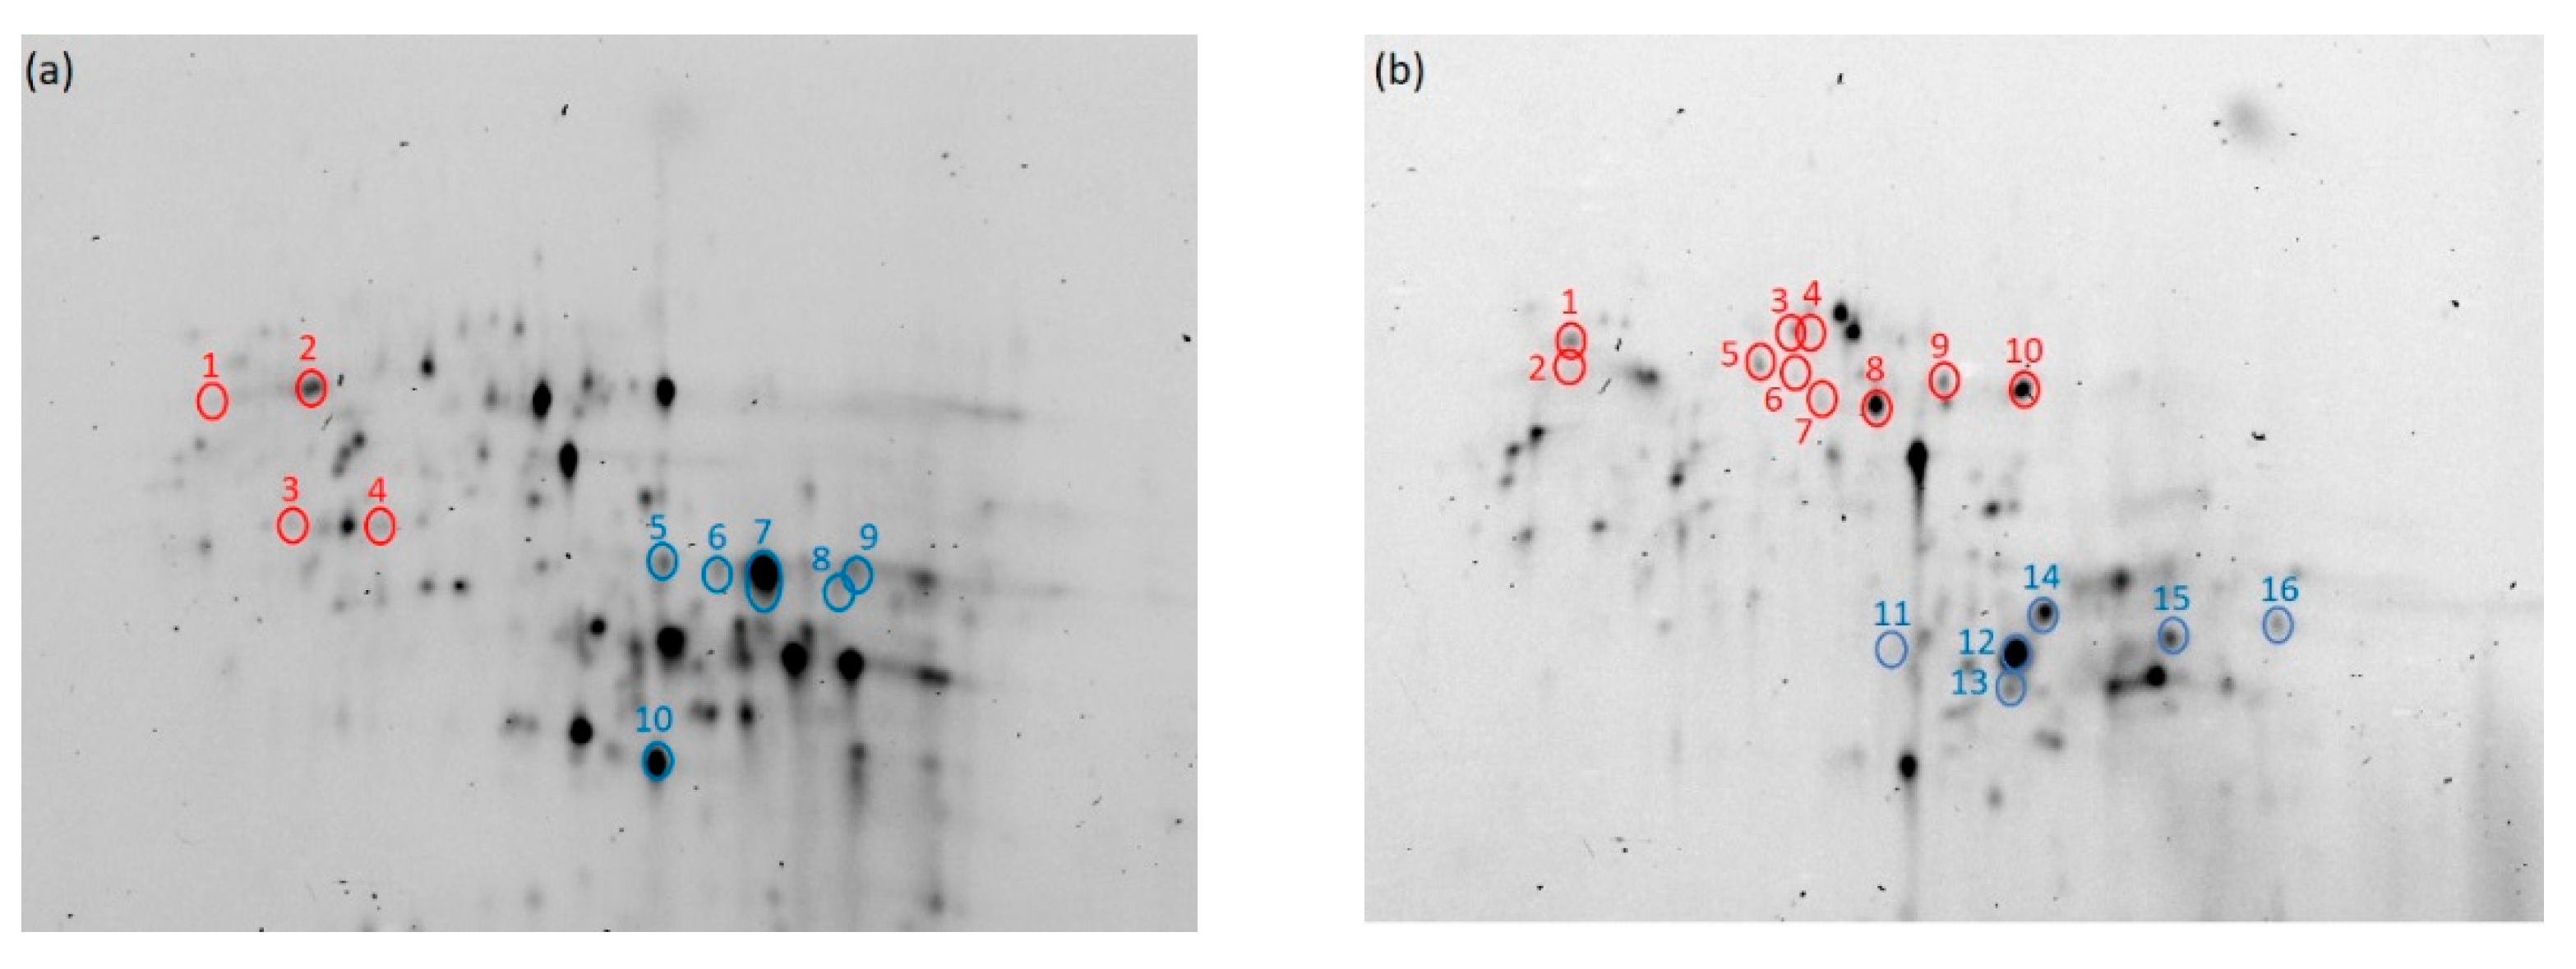
Figure 7 shows an electrophoretic image of the monomeric proteins and protein aggregates extracted with 10% 1-propanol. The blue circles indicate spots whose intensities decreased during hydration (from flour to buildup), and the red circles show spots whose intensities increased during hydration. Each protein was identified based on Dupont et al. [36], and these are shown in Table 5 (HF) and Table 6 (LF).
LMW-glutenin and α-gliadin in HF (Figure 7a and Table 5) and LMW-glutenin, α-gliadin, and γ-gliadin in LF (Figure 7b and Table 6) decreased during hydration. These data indicate that these proteins aggregate through relatively weak hydrophobic interactions. It was also found that LMW-glutenin, α-gliadin, and γ-gliadin aggregated during hydration (Figure 5). On the other hand, ω-gliadin in the monomeric protein fraction increased during hydration (Figure 7 and Table 5 and Table 6). This is likely due to the disaggregation of ω-gliadin extracted with 30% 1-propanol in HF during hydration (Figure 6 and Table 5).
While gliadins are thought to act as a plasticizer or diluent [37], they are also thought to play a role in extensibility and viscosity [38]. Gliadins are also considered to be involved in dough formation and swelling during baking, but their detailed role remains unclear [37]. Considering the fact that ω-gliadin is incorporated into protein aggregates through hydrophobic interactions, they may act as an adhesive between glutenin and other proteins, thereby contributing to the viscosity of the dough. On the other hand, it is interesting that α-gliadin and γ-gliadin disaggregate during mixing. Thus, the distance between α-gliadin or γ-gliadin and the other molecules may determine the extensibility of the dough.
3.4. Changes in the Hydrophobicity of the Dough Surface and Aggregation during Mixing
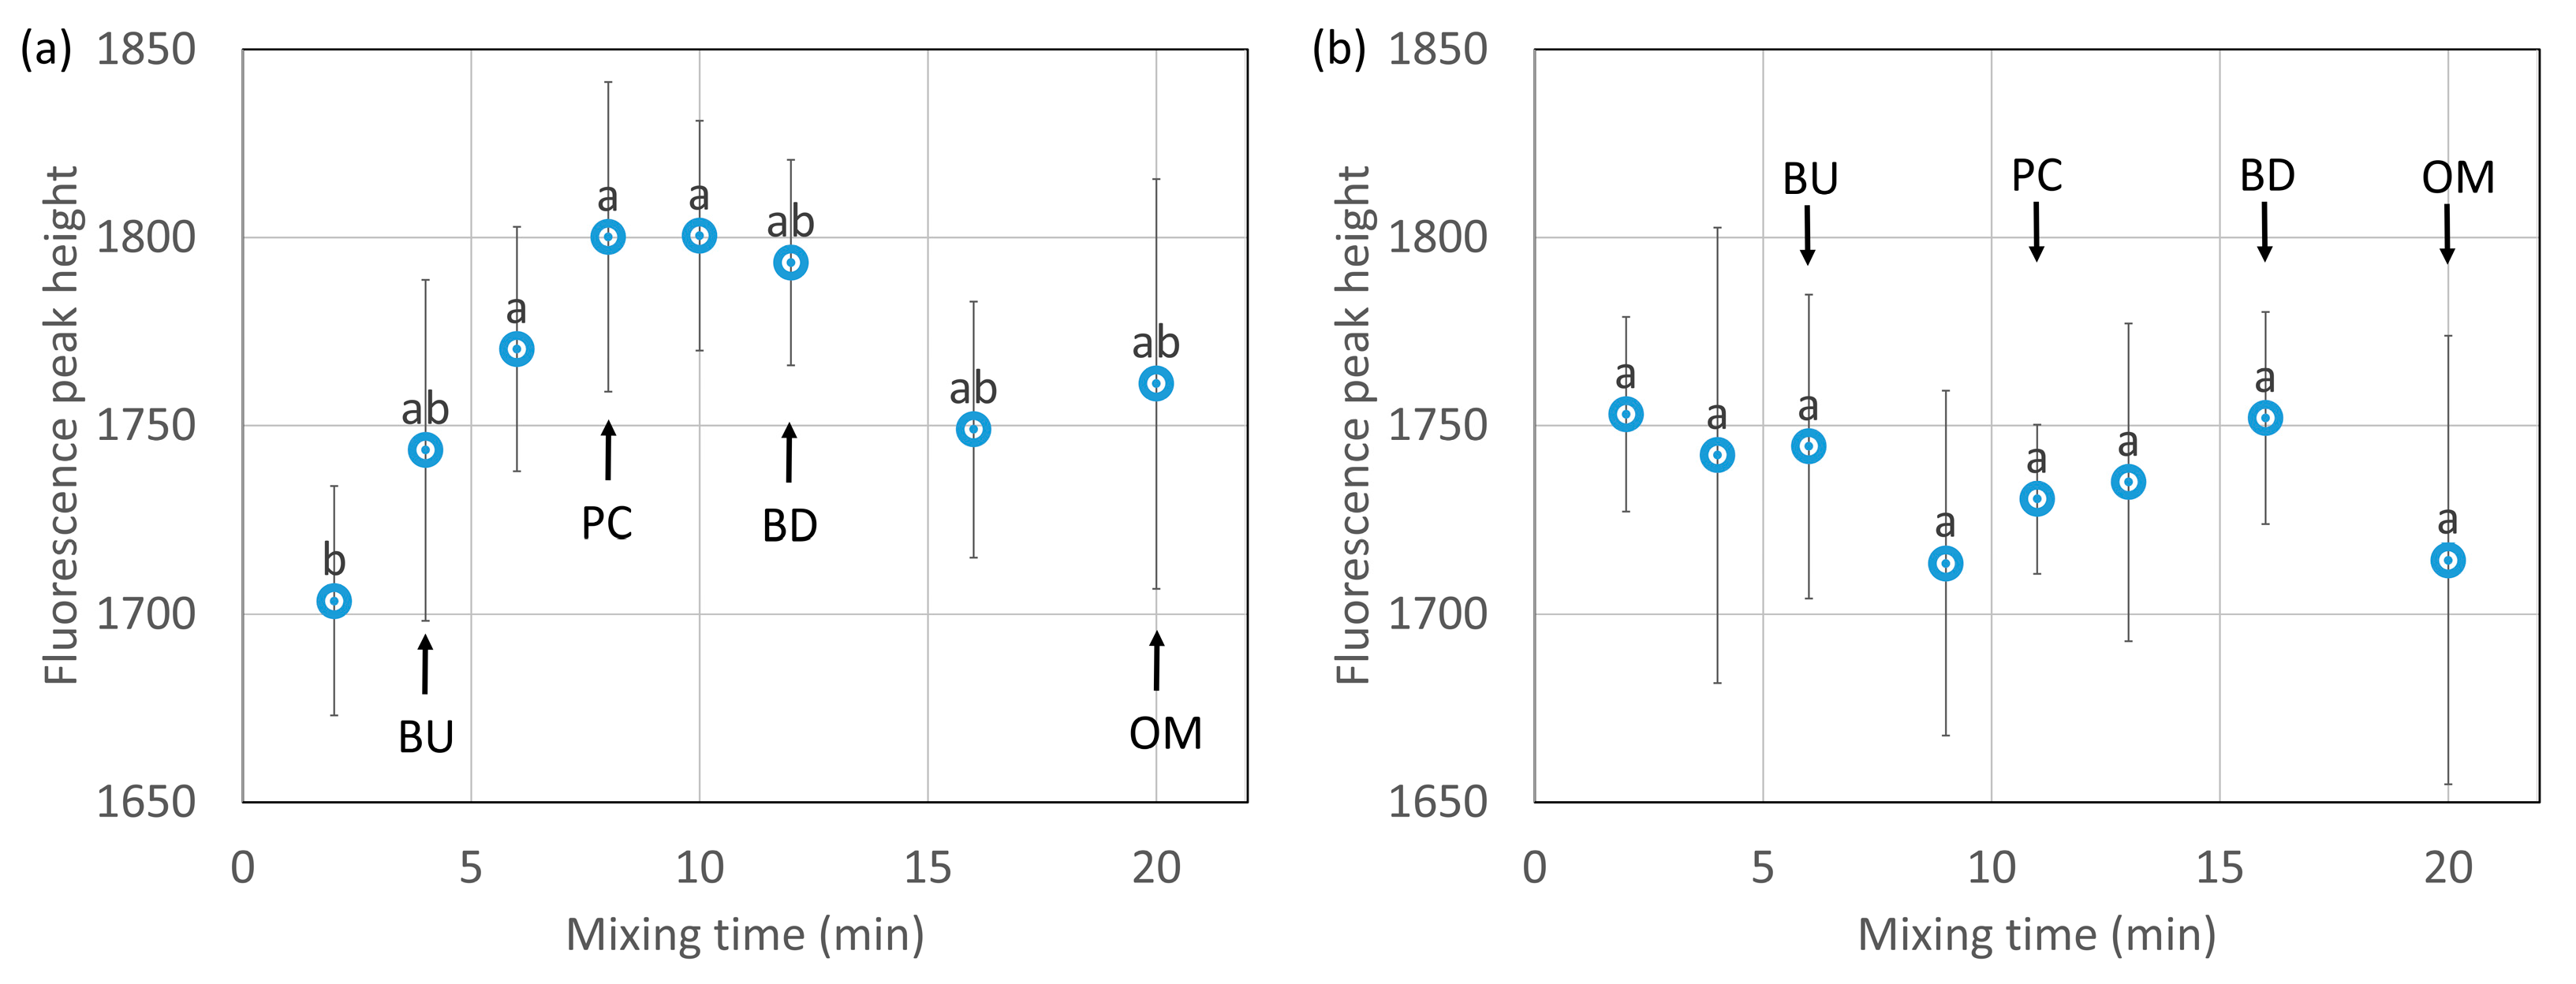
The results of a front-face fluorescence analysis using 8-ANS as a fluorescent reagent are shown in Figure 8a (HF) and Figure 8b (LF). The changes in fluorescence intensity indicate the changes in the hydrophobicity [27,28,39] of the dough surface. The hydrophobicity increased with the mixing time to the peak consistency in HF, which indicates that the structure of the proteins was loosened, and the hydrophobic groups were exposed. The fluorescence intensity in HF tended to decrease slightly after reaching the peak consistency. It is considered that the hydrophobic groups were bonded to each other and that the fluorescence intensity slightly decreased. This result complements that shown in Figure 4, which demonstrates the hydrophobic interactions of ω-gliadin. No significant changes were seen in the hydrophobicity of the dough surface in LF.
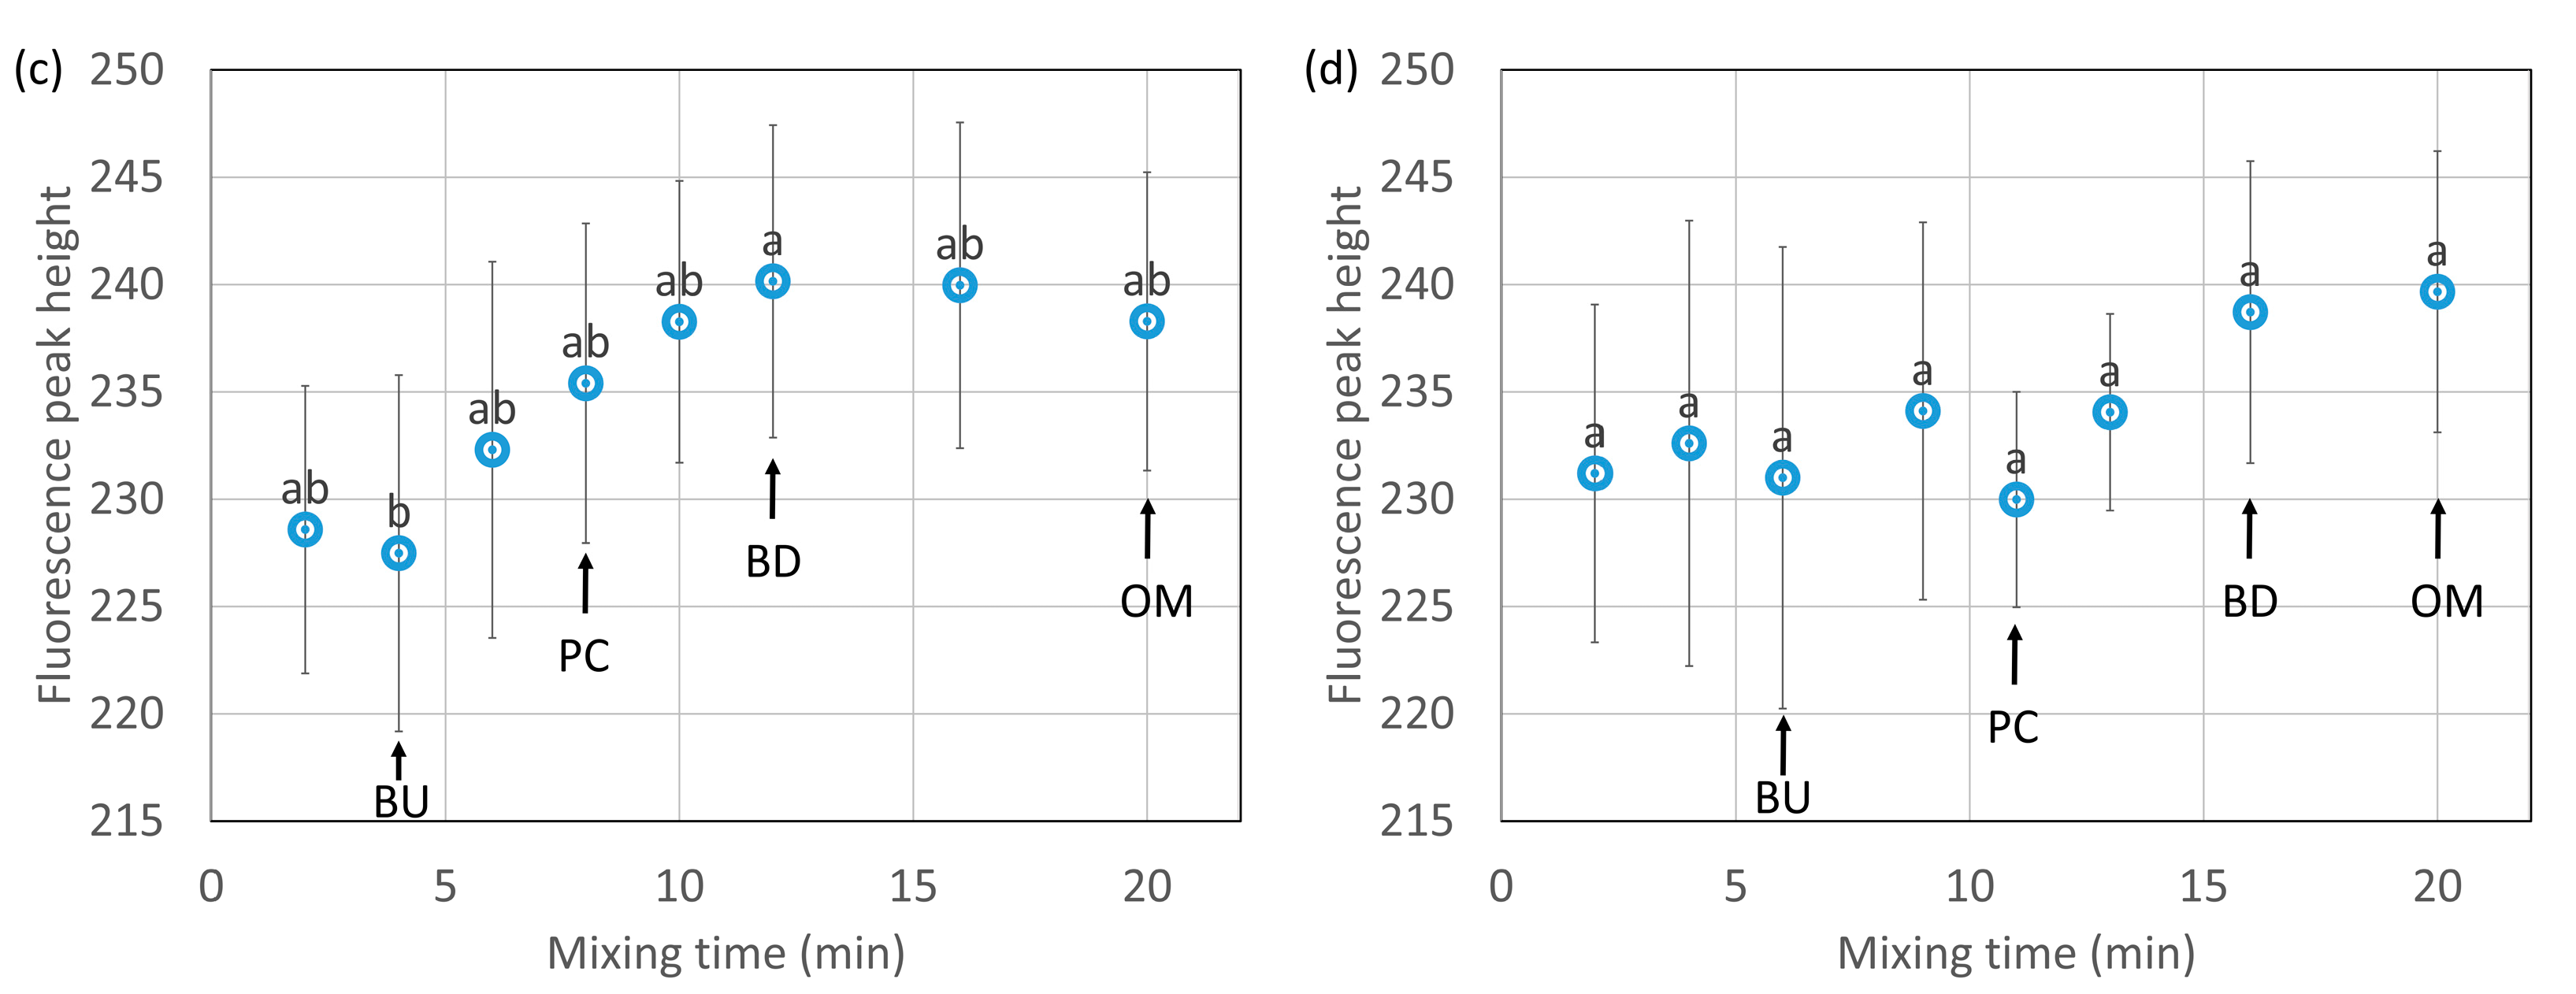
The results of a front-face-fluorescence analysis using thioflavin T as a fluorescent reagent are shown in Figure 8c (HF) and Figure 8d (LF). The changes in fluorescence intensity indicate the changes in aggregates [39,40] present on the dough surface. The aggregates increased slightly with mixing and then decreased. It was considered that there was a time lag between the exposure of the hydrophobic groups and the aggregation through the hydrophobic interactions. No significant changes were seen in the aggregation of the dough surface in LF.
Bonomi et al. [27] and Jazaeri et al. [28] reported data on the changes in the surface hydrophobicity, but their results were not conclusive, depending on the type of sample used. Bonomi et al. [27] measured the changes in fluorescence due to a tryptophan (a type of hydrophobic amino acid) residue and surface hydrophobicity during 15 min of farinograph mixing using commercial wheat flour and semolina flour as samples without evaluating the presence of significant differences. In semolina flour, the fluorescence intensity by tryptophan residues increased to the peak consistency and then became constant, suggesting that tryptophan exposure was associated with network formation and the completion of changes in dough consistency. However, they reported finding no changes in the wheat flour. Jazaeri et al. [28] measured the surface hydrophobicity by farinograph mixing for 10 min using hard and soft flours as samples. They claimed that the hard flour behaved similarly to the semolina flour of Bonomi et al., although it was not significantly changed (p > 0.1). The results of the present study showed that the hydrophobic groups were significantly exposed during mixing, even with the hard wheat flour.
The changes in the hydrophobic interactions and aggregation were very small in LF during mixing. The extraction rate of the proteins with 30% 1-propanol was lower in LF than in HF, and the proteins in LF aggregated through relatively strong hydrophobic interactions. The time to reach the peak consistency was longer in LF than in HF, indicating that its relatively strong aggregation made hydration difficult. In LF, hydrophobic changes may be less likely to occur because of the relatively strong aggregation of the protein. In our previous report [21], LF also showed a small change in molecular size.
Based on the results of this report, it is considered that the hydrophobic interactions of proteins change during dough formation as follows. First, the hydrophobic interactions of proteins that originally aggregate through relatively strong hydrophobic interactions weaken up to the peak consistency, and the protein aggregates disaggregate to monomers (mainly ω-gliadin). At the same time, the hydrophobic group is exposed, and the surface hydrophobicity increases. Some monomeric proteins (e.g., α-gliadin, ω-gliadin, and LMW-glutenin) aggregate through relatively weak hydrophobic interactions during the addition of water. After the peak consistency, the exposed hydrophobic proteins interact with each other and the ω-gliadin aggregates. The relatively strong hydrophobic interactions weaken while the proteins aggregate, so the hydrophobic interactions are expected to converge at a certain level. Khan and Bushuk [41] proposed a structure in which glutenin polymerizes with disulfide bonds while glutenin polymers bond together with hydrogen bonds and hydrophobic interactions. Weegels et al. [42] proposed a model in which hydrophobic gliadin aggregates at the C- and N-terminals of glutenin through hydrophobic interactions during mixing; the glutenins line up side-by-side, and then, the glutenins bond to other glutenin with disulfide bonds; after which, the disulfide bonds strengthen the protein structure. Since we did not analyze the behavior of the disulfide or hydrogen bonds in this study, we could not verify either model. In a recent study, Liu et al. proposed a model in which proteins aggregate by hydrophobic interactions until optimum mixing and then are destroyed [9]. This behavior is different from our data. This may be due to the different experimental conditions in each report, such as the samples, extraction methods, and the method of analysis. We could analyze the changes in hydrophobic interactions during dough formation in detail, thereby showing the importance of hydrophobic interactions.
4. Conclusions
This study showed changes in the hydrophobic interactions among proteins during dough formation. The hydrophobic interactions among proteins weaken, and a part of the protein aggregates disaggregate to monomers (mainly ω-gliadin) up to the peak consistency. After the peak consistency, the exposed hydrophobic groups in the protein interact with each other, and ω-gliadin reaggregates.
In a previous study [21], it was reported that the molecular size of proteins decreases, because noncovalent bonds weaken during dough formation, while ω-gliadin aggregates with other proteins. In the present study, we confirmed the same behavior in the hydrophobic interactions as in the noncovalent interactions. This suggests that the effect of noncovalent bonds during dough formation is mainly due to hydrophobic interactions.
These findings suggest that, to gain a better understanding of the mechanism underlying gluten formation, it is important to analyze disulfide and other noncovalent bonds to obtain a comprehensive picture of dough formation.
Author Contributions
K.H. and S.I. designed the research experiments. S.I. performed the experiments. S.I. and K.H. analyzed the data. S.I. wrote the paper. S.I., K.H., B.-X.F., and C.O. reviewed and edited the paper. The manuscript was critically revised and approved by all the authors. All authors have read and agreed to the published version of the manuscript.
Funding
This research received no external funding.
Institutional Review Board Statement
Not applicable.
Informed Consent Statement
Not applicable.
Data Availability Statement
All data are presented in this article in the form of figures and tables.
Conflicts of Interest
The authors declare no conflict of interest.
References
- Delcour, J.A.; Joye, I.J.; Pareyt, B.; Wilderjans, E.; Brijs, K.; Lagrain, B. Wheat Gluten Functionality as a Quality Determinant in Cereal-Based Food Products. Annu. Rev. Food Sci. Technol. 2012, 3, 469–492. [Google Scholar] [CrossRef]
- Bock, J.; Seetharaman, K. Unfolding gluten. Cereal Foods World 2012, 57, 209–214. [Google Scholar] [CrossRef]
- MacRitchie, F. Theories of glutenin/dough systems. J. Cereal Sci. 2014, 60, 4–6. [Google Scholar] [CrossRef]
- Graveland, A.; Bosveld, P.; Lichtendonk, W.; Marseille, J.; Moonen, J.; Scheepstra, A. A model for the molecular structure of the glutenins from wheat flour. J. Cereal Sci. 1985, 3, 1–16. [Google Scholar] [CrossRef]
- Kasarda, D.D. Glutenin structure in relation to wheat quality. In Wheat is Unique; Pomeranz, Y., Ed.; Am. Assoc. Cereal Chem.: St. Paul, MN, USA, 1989; pp. 277–302. [Google Scholar]
- Wrigley, C.W. Giant proteins with flour power. Nat. Cell Biol. 1996, 381, 738–739. [Google Scholar] [CrossRef] [PubMed]
- Belton, P. Mini Review: On the Elasticity of Wheat Gluten. J. Cereal Sci. 1999, 29, 103–107. [Google Scholar] [CrossRef]
- Hamer, R.J.; van Vliet, T. Understanding the structure and properties of gluten: An overview. In Wheat Gluten; Shewry, P.R., Tatham, A.S., Eds.; Royal Society of Chemistry: Cambridge, UK, 2000; pp. 125–131. [Google Scholar]
- Li, M.; Yue, Q.; Liu, C.; Zheng, X.; Hong, J.; Wang, N.; Bian, K. Interaction between gliadin/glutenin and starch granules in dough during mixing. LWT 2021, 148, 111624. [Google Scholar] [CrossRef]
- MacRitchie, F. Letters to the editor. J. Cereal Sci. 2007, 60, 96–97. [Google Scholar] [CrossRef]
- Belton, P. Letters to the editor. J. Cereal Sci. 2007, 60, 97–98. [Google Scholar] [CrossRef]
- Van Vliet, T.; Hamer, R.J. Letters to the editor. J. Cereal Sci. 2007, 60, 98–99. [Google Scholar] [CrossRef]
- Skerritt, J.H.; Hac, L.; Bekes, F. Depolymerization of the glutenin macropolymer during dogh mixing: I. Changes in levels, molecular weight distribution, and overall composition. Cereal Chem. 1999, 76, 395–401. [Google Scholar] [CrossRef]
- Skerritt, J.H.; Hac, L.; Lindsay, M.P.; Bekes, F. Depolymerization of the glutenin macropolymer during dogh mixing: II. Differences in relation of specific glutenin subunits. Cereal Chem. 1999, 76, 402–409. [Google Scholar] [CrossRef]
- Aussenac, T.; Carceller, J.L.; Kleiber, D. Changes in SDS solubility of gluten polymers during dough mixing and resting. Cereal Chem. 2001, 78, 39–45. [Google Scholar] [CrossRef]
- Okada, K.; Negishi, Y.; Nagao, S. Factors affecting dough breakdown during overmixing. Cereal Chem. 1987, 64, 428–434. [Google Scholar]
- Lee, L.; Ng, P.K.W.; Steffe, J.F. Biochemical Studies of Proteins in Nondeveloped, Partially Developed, and Developed Doughs. Cereal Chem. J. 2002, 79, 654–661. [Google Scholar] [CrossRef]
- Morel, M.-H.; Redl, A.; Guilbert, S. Mechanism of Heat and Shear Mediated Aggregation of Wheat Gluten Protein upon Mixing. Biomacromolecules 2002, 3, 488–497. [Google Scholar] [CrossRef]
- Lancelot, E.; Fontaine, J.; Grua-Priol, J.; Assaf, A.; Thouand, G.; Le-Bail, A. Study of structural changes of gluten proteins during bread dough mixing by Raman spectroscopy. Food Chem. 2021, 358, 129916. [Google Scholar] [CrossRef] [PubMed]
- Feng, Y.; Zhang, H.; Wang, J.; Chen, H. Dynamic changesin glutenin macropolymer during different dough mixing and resting prosses. Molecules 2021, 26, 541. [Google Scholar] [CrossRef]
- Iwaki, S.; Aono, S.; Hayakawa, K.; Fu, B.X.; Otobe, C. Changes in Protein Non-Covalent Bonds and Aggregate Size during Dough Formation. Foods 2020, 9, 1643. [Google Scholar] [CrossRef]
- Miller, R.A.; Hoseney, R.C. Role of salt in baking. Cereal Foods World 2008, 53, 4–6. [Google Scholar] [CrossRef]
- Kinsella, J.E.; Hale, M.L. Hydrophobic associations and gluten consistency: Effects of specific anions. J. Agric. Food. Chem. 1984, 32, 1054–1056. [Google Scholar] [CrossRef]
- Melnyk, J.P.; Dreisoerner, J.; Bonomi, F.; Marcone, M.F.; Seetharaman, K. Effect of the Hofmeister series on gluten aggregation measured using a high shear-based technique. Food Res. Int. 2011, 44, 893–896. [Google Scholar] [CrossRef]
- Chen, G.; Ehmke, L.; Sharma, C.; Miller, R.; Faa, P.; Smith, G.; Li, Y. Physicochemical properties and gluten structures of hard wheat flour doughs as affected by salt. Food Chem. 2019, 275, 569–576. [Google Scholar] [CrossRef] [PubMed]
- Kato, A.; Matsuda, T.; Matsudomi, N.; Kobayashi, K. Determination of protein hydrophobicity using sodium dodecyl sul-fate binding method. J. Agric. Food. Chem. 1984, 32, 284–288. [Google Scholar] [CrossRef]
- Bonomi, F.; Mora, G.; Pagani, M.A.; Iametti, S. Probing structural features of water-insoluble proteins by front-face fluorescence. Anal. Biochem. 2004, 329, 104–111. [Google Scholar] [CrossRef] [PubMed]
- Jazaeri, S.; Bock, J.E.; Bagagli, M.P.; Iametti, S.; Bonomi, F.; Seetharaman, K. Structural Modifications of Gluten Proteins in Strong and Weak Wheat Dough During Mixing. Cereal Chem. J. 2015, 92, 105–113. [Google Scholar] [CrossRef]
- Ogilvie, O.; Roberts, S.; Sutton, K.; Gerrard, J.; Larsen, N.; Domigan, L. The effect of dough mixing speed and work input on the structure, digestibility and celiac immunogenicity of the gluten macropolymer within bread. Food Chem. 2021, 359, 129841. [Google Scholar] [CrossRef]
- Kuktaite, R.; Larsson, H.; Johansson, E. Variation in protein composition of wheat flour and its relationship to dough mixing behavior. J. Cereal Sci. 2004, 40, 31–39. [Google Scholar] [CrossRef]
- La Gatta, B.; Rutigliano, M.; Rusco, G.; Petrella, G.; Di Luccia, A. Evidence for different supramolecular arrangements in pasta from durum wheat (Triticum durum) and einkorn (Triticum monococcum) flours. J. Cereal Sci. 2017, 73, 76–83. [Google Scholar] [CrossRef]
- Fu, B.X.; Sapirstein, H.D. Procedure for isolating monomeric proteins and polymeric glutenin of wheat flour. Cereal Chem. 1996, 73, 143–152. [Google Scholar]
- Sapirstein, H.D.; Fu, B.X.; Sapirstein, H.D.; Fu, B.X. Intercultivar Variation in the Quantity of Monomeric Proteins, Soluble and Insoluble Glutenin, and Residue Protein in Wheat Flour and Relationships to Breadmaking Quality. Cereal Chem. J. 1998, 75, 500–507. [Google Scholar] [CrossRef]
- Cinco-Moroyoqui, F.J.; MacRitchie, F. Quantitation of LMW-GS to HMW-GS Ratio in Wheat Flours. Cereal Chem. J. 2008, 85, 824–829. [Google Scholar] [CrossRef]
- Bean, S.R.; Lyne, R.K.; Tilley, K.A.; Chung, O.K.; Lookhart, G.L. A Rapid Method for Quantitation of Insoluble Polymeric Proteins in Flour. Cereal Chem. J. 1998, 75, 374–379. [Google Scholar] [CrossRef]
- Dupont, F.M.; Vensel, W.H.; Tanaka, C.K.; Hurkman, W.J.; Altenbach, S.B. Deciphering the complexities of the wheat flour proteome using quantitative two-dimensional electrophoresis, three proteases and tandem mass spectrometry. Proteome Sci. 2011, 9, 1–29. [Google Scholar] [CrossRef] [PubMed] [Green Version]
- Branlard, G.P.; Metakovsky, E.V. Some Gli alleles related to common wheat dough quality. In Gliadin and Glutenin—The Unique Balance of Wheat Quality; Wrigley, C.W., Bekes, F., Bushuk, W., Eds.; Am. Assoc. Cereal Chem.: St. Paul, MN, USA, 2006; pp. 115–137. [Google Scholar]
- Mills, E.N.C.; Burgess, S.R.; Tatham, A.S.; Shewry, P.R.; Chan, H.W.S.; Morgan, M.R.A. Characterization of a panel of mono-clonal anti-gliadin antibodies. J. Cereal Sci. 1990, 11, 89–101. [Google Scholar] [CrossRef]
- Huschka, B.; Bonomi, F.; Marengo, M.; Miriani, M.; Seetharaman, K. Comparison of lipid effects on structural features of hard and soft wheat flour proteins assessed by front-face fluorescence. Food Chem. 2012, 133, 1011–1016. [Google Scholar] [CrossRef]
- Rasmussen, P.; Barbiroli, A.; Bonomi, F.; Faoro, F.; Ferranti, P.; Iriti, M.; Picariello, G.; Iametti, S. Formation of structured polymers upon controlled denaturation of β-Lactoglobilin with different chaotropes. Biopolymers 2007, 86, 57–72. [Google Scholar] [CrossRef] [PubMed]
- Khan, K.; Bushuk, W. Studies of glutenin. XII. Comparison by sodium dodecyl sulfate-polyacrylamide gel electrophoresis of unreduced and reduced glutenin from various isolation and purification procedures. Cereal Chem. 1979, 56, 63–68. [Google Scholar]
- Weegels, P.L.; Marseille, J.P.; Jager, A.M.; Hamer, R.J. Structure-function relationships of gluten proteins. In Gluten Proteins; Bushuk, W., Tkachuk, R., Eds.; AACC International Press: St. Paul, MN, USA, 1990; pp. 98–111. [Google Scholar]
Figure 1.
Dough mixing curves for high-protein flour (left) and low-protein flour (right). Arrows indicate sampling points. BU, PC, BD and OM indicate buildup, peak consistency, breakdown, and overmixing, respectively. Reprinted from Iwaki et al. 2020 [21].
Figure 1.
Dough mixing curves for high-protein flour (left) and low-protein flour (right). Arrows indicate sampling points. BU, PC, BD and OM indicate buildup, peak consistency, breakdown, and overmixing, respectively. Reprinted from Iwaki et al. 2020 [21].

Figure 2.
Size-exclusion high-performance liquid chromatography (SE-HPLC) chromatogram of the protein extracted with 30% 1-propanol (pH 7.0) from high-protein flour (HF). “A” represents protein aggregates and “B” monomeric proteins.
Figure 2.
Size-exclusion high-performance liquid chromatography (SE-HPLC) chromatogram of the protein extracted with 30% 1-propanol (pH 7.0) from high-protein flour (HF). “A” represents protein aggregates and “B” monomeric proteins.

Figure 3.
Electrophoretic images of SDS-PAGE for fractions A and B under nonreducing (A, B) and reducing (a, b) conditions. Fractions A and B are shown in Figure 2. The M lane is a size marker (from the top: 250, 150, 100, 75, 50, and 25 kbp).
Figure 3.
Electrophoretic images of SDS-PAGE for fractions A and B under nonreducing (A, B) and reducing (a, b) conditions. Fractions A and B are shown in Figure 2. The M lane is a size marker (from the top: 250, 150, 100, 75, 50, and 25 kbp).

Figure 4.
Changes in the amount of protein aggregates, monomeric proteins extracted with 30% 1-propanol, and unextractable proteins during mixing from high-protein flour (HF) (a,b) and low-protein flour (LF) (c,d). FL, BU, PC, BD and OM indicate flour (before mixing), buildup, peak consistency, breakdown, and overmixing, respectively. Protein aggregates mean “A”, and monomeric proteins mean “B” in Figure 2. Unextractable proteins mean proteins not extracted with 30% 1-propanol. The error bars show standard deviations (n = 6). Different letters on the graph indicate significant differences (p < 0.05).


Figure 5.
Changes in the amount of protein aggregates and monomeric proteins extracted with 10% 1-propanol during mixing from high-protein flour (HF) (a) and low-protein flour (LF) (b). FL, BU, PC, BD and OM indicate flour (before mixing), buildup, peak consistency, breakdown, and overmixing, respectively. Protein aggregates mean “A”, and monomeric proteins mean “B” in Figure 2. The error bars show standard deviations (n = 6). Different letters on the graph indicate significant differences (p < 0.05).

Figure 6.
Electrophoretic images of the protein aggregates (a,c) and monomeric proteins (b,d) in high-protein flour (HF) (a,b) and low-protein flour (LF) (c,d) extracted with 30% 1-propanol. Blue circles show proteins with decreased intensities after buildup (n = 4, p < 0.05), and red circles show proteins with increased intensities after buildup (n = 4, p < 0.05). The numbers correspond to those in Table 1, Table 2, Table 3 and Table 4.

Figure 7.
Electrophoretic images of monomeric proteins (a,b) in high-protein (HF) and low-protein flour (LF) extracted with 10% 1-propanol. Blue circles show proteins whose intensities decreased from flour to buildup (n = 4, p < 0.05). Red circles show proteins whose intensities increased from flour to buildup (n = 4, p < 0.05). The numbers correspond to those in Table 5 and Table 6.

Figure 8.
Changes in the fluorescence intensity of the dough with the addition of 8-anilino-1-naphthalene-sulfonic acid (a,b) or thioflavin T (c,d) during mixing from high-protein flour (HF) (a,c) and low-protein flour (LF) (b,d). BU, PC, BD and OM indicate buildup, peak consistency, breakdown, and overmixing, respectively. The error bars show standard deviations (n = 6). Different letters on the graph indicate significant differences (p < 0.1).


Table 1.
The increased or decreased protein in protein aggregates extracted with 30% 1-propanol in HF a during mixing.
Table 1.
The increased or decreased protein in protein aggregates extracted with 30% 1-propanol in HF a during mixing.
| Spot No. b | Identification c | Spot Ratio (%) d | Increase (↑) or Decrease (↓) | ||||
|---|---|---|---|---|---|---|---|
| Flour | Build Up | Peak Top | Break Down | Overmixing | |||
| 1 | HMW-glutenin | 0.66 ± 0.29 | 0.83 ± 0.15 | 0.99 ± 0.14 | 1.03 ± 0.15 | 1.09 ± 0.07 | ↑ |
| 2 | HMW-glutenin | 0.96 ± 0.23 | 0.93 ± 0.19 | 1.48 ± 0.49 | 1.47 ± 0.16 | 1.39 ± 0.32 | ↑ |
| 3 | HMW-glutenin | 0.65 ± 0.22 | 0.8 ± 0.22 | 1.1 ± 0.47 | 1.14 ± 0.15 | 1.15 ± 0.22 | ↑ |
| 4 | HMW-glutenin | 0.58 ± 0.21 | 0.72 ± 0.14 | 0.81 ± 0.28 | 1.13 ± 0.14 | 1.14 ± 0.21 | ↑ |
| 5 | HMW-glutenin | 0.55 ± 0.14 | 0.83 ± 0.22 | 1.35 ± 0.33 | 1.48 ± 0.07 | 1.61 ± 0.32 | ↑ |
| 6 | HMW-glutenin | 0.68 ± 0.18 | 0.75 ± 0.2 | 1.35 ± 0.41 | 1.51 ± 0.52 | 1.44 ± 0.71 | ↑ |
| 7 | HMW-glutenin | 0.7 ± 0.25 | 0.92 ± 0.15 | 1.01 ± 0.46 | 1.22 ± 0.18 | 1.27 ± 0.13 | ↑ |
| 8 | Enzymes | 1.38 ± 0.89 | 0.75 ± 0.39 | 0.26 ± 0.12 | 0.4 ± 0.1 | 0.41 ± 0.13 | ↓ |
| 9 | Enzymes | 2.1 ± 1.01 | 0.66 ± 0.34 | 0.29 ± 0.1 | 0.35 ± 0.16 | 0.28 ± 0.15 | ↓ |
| 10 | Enzymes | 2.01 ± 1.21 | 0.71 ± 0.35 | 0.26 ± 0.08 | 0.4 ± 0.2 | 0.28 ± 0.1 | ↓ |
| 11 | ω-gliadin | 0.66 ± 0.19 | 1.81 ± 9.69 | 0.36 ± 0.18 | 0.31 ± 0.09 | 0.38 ± 0.16 | ↓ |
| 12 | ω-gliadin | 1.77 ± 0.39 | 1.35 ± 0.19 | 1.25 ± 0.25 | 1.07 ± 0.24 | 0.99 ± 0.09 | ↓ |
| 13 | ω-gliadin | 0.96 ± 0.41 | 1.25 ± 0.28 | 0.87 ± 0.34 | 0.53 ± 0.12 | 0.51 ± 0.2 | ↓ |
| 14 | ω-gliadin | 1.11 ± 0.53 | 1.43 ± 0.16 | 1.17 ± 0.35 | 0.77 ± 0.16 | 0.71 ± 0.26 | ↓ |
| 15 | ω-gliadin | 1.53 ± 0.21 | 1.29 ± 0.25 | 1.13 ± 0.17 | 1.18 ± 0.17 | 1.02 ± 0.2 | ↓ |
| 16 | ω-gliadin | 1.68 ± 0.86 | 1.12 ± 1.28 | 0.58 ± 0.19 | 0.59 ± 0.31 | 0.46 ± 0.18 | ↓ |
| 17 | LMW-glutenin | 1.41 ± 0.15 | 1.19 ± 0.17 | 1.84 ± 0.44 | 1.52 ± 0.08 | 1.52 ± 0.23 | ↑ |
| 18 | γ-gliadin | 1.47 ± 0.31 | 1.16 ± 0.04 | 1.96 ± 0.58 | 1.61 ± 0.27 | 1.45 ± 0.22 | ↑ |
| 19 | α-gliadin | 1.24 ± 0.08 | 1.13 ± 0.35 | 1.73 ± 0.34 | 1.67 ± 0.47 | 1.68 ± 0.32 | ↑ |
| 20 | α-gliadin | 1.61 ± 0.5 | 1.21 ± 0.33 | 2.15 ± 0.26 | 2.01 ± 0.7 | 1.99 ± 0.35 | ↑ |
| 21 | α-gliadin | 1.88 ± 0.43 | 1.21 ± 0.3 | 2.28 ± 0.43 | 1.86 ± 0.55 | 1.99 ± 0.4 | ↑ |
a Spots were detected by 2D-DIGE; significant differences (p < 0.05, n = 4) among any of the groups were determined by an ANOVA test. b These spot numbers correspond to the spot numbers in Figure 6a. c The identification of each protein was estimated from the report of Dupont et al. [36]. d Values are the means ± standard deviation.
Table 2.
The increased or decreased protein in monomeric protein extracted with 30% 1-propanol in HF a during mixing.
Table 2.
The increased or decreased protein in monomeric protein extracted with 30% 1-propanol in HF a during mixing.
| Spot No. b | Identification c | Spot Ratio (%) d | Increase (↑) or Decrease (↓) | ||||
|---|---|---|---|---|---|---|---|
| Flour | Build Up | Peak Top | Break Down | Overmixing | |||
| 1 | ω-gliadin | 0.93 ± 0.05 | 1.97 ± 0.51 | 1.05 ± 0.18 | 0.88 ± 0.29 | 0.88 ± 0.17 | ↓ |
| 2 | ω-gliadin | 0.96 ± 0.1 | 2.02 ± 0.44 | 1.2 ± 0.2 | 0.97 ± 0.17 | 0.91 ± 0.11 | ↓ |
| 3 | ω-gliadin | 0.88 ± 0.11 | 1.79 ± 0.51 | 1.01 ± 0.14 | 0.86 ± 0.24 | 0.83 ± 0.14 | ↓ |
| 4 | ω-gliadin | 0.95 ± 0.15 | 2 ± 0.66 | 1.21 ± 0.25 | 0.94 ± 0.18 | 1.03 ± 0.2 | ↓ |
| 5 | ω-gliadin | 0.94 ± 0.31 | 2.01 ± 0.76 | 1.24 ± 0.22 | 0.89 ± 0.22 | 1.05 ± 0.21 | ↓ |
| 6 | ω-gliadin | 0.91 ± 0.17 | 1.78 ± 0.6 | 1.21 ± 0.25 | 0.88 ± 0.33 | 1.02 ± 0.19 | ↓ |
| 7 | ω-gliadin | 0.99 ± 0.13 | 1.89 ± 0.55 | 1.08 ± 0.2 | 0.82 ± 0.21 | 0.9 ± 0.1 | ↓ |
| 8 | ω-gliadin | 0.91 ± 0.1 | 1.8 ± 0.49 | 1.08 ± 0.18 | 0.97 ± 0.21 | 0.96 ± 0.14 | ↓ |
| 9 | ω-gliadin | 0.87 ± 0.02 | 2.26 ± 0.54 | 1.16 ± 0.19 | 0.92 ± 0.2 | 1 ± 0.16 | ↓ |
| 10 | ω-gliadin | 0.99 ± 0.22 | 1.93 ± 0.82 | 1.05 ± 0.19 | 0.86 ± 0.26 | 0.85 ± 0.16 | ↓ |
| 11 | ω-gliadin | 0.87 ± 0.16 | 1.65 ± 0.56 | 0.93 ± 0.07 | 0.81 ± 0.23 | 0.72 ± 0.14 | ↓ |
| 12 | ω-gliadin | 0.92 ± 0.08 | 1.68 ± 0.59 | 0.98 ± 0.11 | 0.86 ± 0.14 | 0.9 ± 0.12 | ↓ |
| 13 | ω-gliadin | 0.81 ± 0.17 | 1.67 ± 0.71 | 0.96 ± 0.06 | 0.75 ± 0.25 | 0.72 ± 0.13 | ↓ |
| 14 | ω-gliadin | 0.91 ± 0.13 | 1.77 ± 0.58 | 1.12 ± 0.19 | 0.85 ± 0.18 | 0.94 ± 0.15 | ↓ |
| 15 | ω-gliadin | 0.86 ± 0.13 | 1.82 ± 0.76 | 1.05 ± 0.05 | 0.89 ± 0.23 | 0.94 ± 0.19 | ↓ |
| 16 | ω-gliadin | 0.9 ± 0.26 | 2.3 ± 0.77 | 1.39 ± 0.1 | 0.96 ± 0.31 | 1 ± 0.32 | ↓ |
| 17 | ω-gliadin | 1.15 ± 0.24 | 2.39 ± 0.76 | 1.07 ± 0.22 | 1.06 ± 0.21 | 0.96 ± 0.14 | ↓ |
| 18 | ω-gliadin | 0.85 ± 0.08 | 1.79 ± 0.65 | 1 ± 0.14 | 0.87 ± 0.17 | 0.77 ± 0.17 | ↓ |
| 19 | ω-gliadin | 0.9 ± 0.18 | 1.72 ± 0.57 | 1.1 ± 0.1 | 0.92 ± 0.19 | 0.9 ± 0.17 | ↓ |
| 20 | ω-gliadin | 0.73 ± 0.16 | 1.68 ± 0.75 | 0.95 ± 0.17 | 0.77 ± 0.15 | 0.87 ± 0.08 | ↓ |
| 21 | ω-gliadin | 0.85 ± 0.12 | 1.75 ± 0.6 | 1.02 ± 0.15 | 0.96 ± 0.22 | 0.93 ± 0.17 | ↓ |
| 22 | ω-gliadin | 0.86 ± 0.24 | 2.14 ± 0.61 | 1.12 ± 0.16 | 0.99 ± 0.25 | 0.9 ± 0.2 | ↓ |
| 23 | ω-gliadin | 0.87 ± 0.12 | 1.77 ± 0.67 | 1.06 ± 0.13 | 0.95 ± 0.08 | 0.86 ± 0.1 | ↓ |
| 24 | ω-gliadin | 0.89 ± 0.09 | 1.98 ± 0.62 | 1.18 ± 0.36 | 0.96 ± 0.14 | 1.13 ± 0.26 | ↓ |
| 25 | ω-gliadin | 0.92 ± 0.15 | 1.61 ± 0.47 | 0.99 ± 0.08 | 0.76 ± 0.32 | 0.8 ± 0.12 | ↓ |
| 26 | ω-gliadin | 0.91 ± 0.16 | 1.78 ± 0.49 | 1.18 ± 0.14 | 0.88 ± 0.08 | 0.97 ± 0.15 | ↓ |
| 27 | ω-gliadin | 1.25 ± 0.3 | 1.31 ± 1.76 | 0.51 ± 0.18 | 0.57 ± 0.33 | 0.2 ± 0.15 | ↓ |
| 28 | LMW-glutenin | 0.93 ± 0.33 | 0.33 ± 0.34 | 1.1 ± 0.11 | 0.93 ± 0.18 | 0.86 ± 0.13 | ↑ |
| 29 | LMW-glutenin | 1.25 ± 0.31 | 0.4 ± 0.44 | 1.54 ± 0.46 | 1.31 ± 0.15 | 1.33 ± 0.13 | ↑ |
| 30 | LMW-glutenin | 1.19 ± 0.32 | 0.4 ± 0.53 | 1.49 ± 0.24 | 1.43 ± 0.36 | 1.33 ± 0.23 | ↑ |
| 31 | LMW-glutenin | 1.06 ± 0.29 | 0.41 ± 0.62 | 1.66 ± 0.34 | 1.43 ± 0.47 | 1.39 ± 0.25 | ↑ |
| 32 | LMW-glutenin | 1.06 ± 0.29 | 0.44 ± 0.35 | 1.36 ± 0.17 | 1.23 ± 0.15 | 1.24 ± 0.29 | ↑ |
| 33 | α-gliadin | 1.1 ± 0.26 | 0.25 ± 0.39 | 1 ± 0.66 | 1.15 ± 0.37 | 1.22 ± 0.2 | ↑ |
| 34 | γ-gliadin | 1.07 ± 0.2 | 0.49 ± 0.62 | 1.67 ± 0.43 | 1.26 ± 0.2 | 1.44 ± 0.26 | ↑ |
| 35 | α-gliadin | 0.94 ± 0.5 | 0.24 ± 0.43 | 1.03 ± 0.66 | 1.32 ± 0.45 | 1.28 ± 0.21 | ↑ |
| 36 | γ-gliadin | 1.33 ± 0.71 | 0.32 ± 0.27 | 1.41 ± 0.35 | 1.42 ± 0.37 | 1.58 ± 0.3 | ↑ |
| 37 | LMW-glutenin | 0.96 ± 0.61 | 0.34 ± 0.43 | 1.56 ± 0.56 | 1.66 ± 0.56 | 1.73 ± 0.4 | ↑ |
| 38 | LMW-glutenin | 1.2 ± 0.35 | 0.51 ± 0.23 | 1.23 ± 0.37 | 1.17 ± 0.21 | 1.06 ± 0.4 | ↑ |
| 39 | γ-gliadin | 1.15 ± 0.54 | 0.3 ± 0.43 | 1.07 ± 0.65 | 1.53 ± 0.46 | 1.28 ± 0.26 | ↑ |
| 40 | γ-gliadin | 1.23 ± 0.41 | 0.48 ± 0.4 | 1.01 ± 0.35 | 1.43 ± 0.37 | 1.47 ± 0.15 | ↑ |
| 41 | α-gliadin | 1.28 ± 0.41 | 0.57 ± 0.21 | 1 ± 0.13 | 0.99 ± 0.2 | 0.96 ± 0.06 | ↑ |
| 42 | α-gliadin | 1.26 ± 0.23 | 0.71 ± 0.18 | 1.09 ± 0.21 | 1.2 ± 0.31 | 1.32 ± 0.24 | ↑ |
a Spots were detected by 2D-DIGE; significant differences (p < 0.05, n = 4) among any of the groups were determined by an ANOVA test. b These spot numbers correspond to the spot numbers in Figure 6b. c The identification of each protein was estimated from the report of Dupont et al. [36]. d Values are the means ± standard deviation.
Table 3.
The increased or decreased protein in protein aggregates extracted with 30% 1-propanol in LF a during mixing.
Table 3.
The increased or decreased protein in protein aggregates extracted with 30% 1-propanol in LF a during mixing.
| Spot No. b | Identification c | Spot Ratio (%) d | Increase (↑) or Decrease (↓) | ||||
|---|---|---|---|---|---|---|---|
| Flour | Build Up | Peak Top | Break Down | Overmixing | |||
| 1 | HMW-glutenin | 0.62 ± 0.28 | 0.71 ± 0.33 | 0.86 ± 0.13 | 0.96 ± 0.16 | 1.61 ± 0.21 | ↑ |
| 2 | HMW-glutenin | 0.81 ± 0.36 | 0.88 ± 0.43 | 1.28 ± 0.49 | 1.44 ± 0.35 | 2.33 ± 0.42 | ↑ |
| 3 | HMW-glutenin | 0.66 ± 0.14 | 0.75 ± 0.24 | 0.91 ± 0.11 | 1.05 ± 0.43 | 1.22 ± 0.19 | ↑ |
| 4 | Enzymes | 2.65 ± 2.85 | 0.54 ± 0.26 | 0.76 ± 0.19 | 0.9 ± 0.26 | 0.49 ± 0.65 | ↓ |
| 5 | Enzymes | 2.21 ± 0.67 | 0.79 ± 0.3 | 0.85 ± 0.14 | 0.92 ± 0.51 | 0.42 ± 0.37 | ↓ |
| 6 | Enzymes | 3.09 ± 4.13 | 0.79 ± 0.11 | 0.78 ± 0.3 | 0.97 ± 0.73 | 0.48 ± 0.71 | ↓ |
| 7 | ω-gliadin | 1.13 ± 0.67 | 0.51 ± 0.25 | 0.87 ± 0.25 | 0.61 ± 0.29 | 0.29 ± 0.23 | ↓ |
| 8 | ω-gliadin | 1.2 ± 0.24 | 0.83 ± 0.35 | 0.73 ± 0.34 | 1.4 ± 0.79 | 0.35 ± 0.2 | ↓ |
a Spots were detected by 2D-DIGE; significant differences (p < 0.05, n = 4) among any of the groups were determined by an ANOVA test. b These spot numbers correspond to the spot numbers in Figure 6c. c The identification of each protein was estimated from the report of Dupont et al. [36]. d Values are the means ± standard deviation.
Table 4.
The increased or decreased protein in monomeric protein extracted with 30% 1-propanol in LF a during mixing.
Table 4.
The increased or decreased protein in monomeric protein extracted with 30% 1-propanol in LF a during mixing.
| Spot No. b | Identification c | Spot Ratio (%) d | Increase (↑) or Decrease (↓) | ||||
|---|---|---|---|---|---|---|---|
| Flour | Build Up | Peak Top | Break Down | Overmixing | |||
| 1 | Enzymes | 1.51 ± 0.61 | 0.81 ± 0.31 | 0.48 ± 0.29 | 0.61 ± 0.32 | 0.44 ± 0.34 | ↓ |
| 2 | Enzymes | 2.35 ± 0.61 | 1.06 ± 0.85 | 0.86 ± 0.12 | 0.95 ± 0.18 | 0.75 ± 0.34 | ↓ |
| 3 | ω-gliadin | 1.88 ± 0.87 | 2.61 ± 1.64 | 1.9 ± 0.25 | 1.7 ± 0.67 | 0.8 ± 0.44 | ↓ |
| 4 | ω-gliadin | 3.73 ± 2.13 | 2 ± 1.33 | 1.27 ± 0.36 | 1.11 ± 0.29 | 0.76 ± 0.52 | ↓ |
| 5 | Serpins | 1.88 ± 0.87 | 2.61 ± 1.64 | 1.9 ± 0.25 | 1.7 ± 0.67 | 0.8 ± 0.44 | ↓ |
a Spots were detected by 2D-DIGE; significant differences (p < 0.05, n = 4) among any of the groups were determined by an ANOVA test. b These spot numbers correspond to the spot numbers in Figure 6d. c The identification of each protein was estimated from the report of Dupont et al. [36]. d Values are the means ± standard deviation.
Table 5.
The increased or decreased proteins in the monomeric protein extracted with 10% 1-propanol in HF a during mixing.
Table 5.
The increased or decreased proteins in the monomeric protein extracted with 10% 1-propanol in HF a during mixing.
| Spot No. b | Identification c | Spot Ratio (%) d | Increase (↑) or Decrease (↓) | |
|---|---|---|---|---|
| Flour | Build Up | |||
| 1 | ω-gliadin | 0.64 ± 0.23 | 1.4 ± 0.69 | ↑ |
| 2 | ω-gliadin | 1.07 ± 0.44 | 2.1 ± 0.34 | ↑ |
| 3 | ω-gliadin | 0.65 ± 0.12 | 1.55 ± 0.44 | ↑ |
| 4 | ω-gliadin | 0.73 ± 0.27 | 1.38 ± 0.39 | ↑ |
| 5 | LMW-glutenin | 1.31 ± 0.24 | 0.68 ± 0.19 | ↓ |
| 6 | LMW-glutenin | 1.43 ± 0.52 | 0.73 ± 0.17 | ↓ |
| 7 | LMW-glutenin | 2.11 ± 0.53 | 0.84 ± 0.21 | ↓ |
| 8 | LMW-glutenin | 1.16 ± 0.2 | 0.86 ± 0.13 | ↓ |
| 9 | LMW-glutenin | 1.19 ± 0.27 | 0.74 ± 0.09 | ↓ |
| 10 | α-gliadin | 1.55 ± 0.36 | 0.9 ± 0.28 | ↓ |
a Spots were detected by 2D-DIGE; significant differences (p < 0.05, n = 4) among any of the groups were determined by an ANOVA test. b These spot numbers correspond to the spot numbers in Figure 7a. c The identification of each protein was estimated from the report of Dupont et al. [36]. d Values are the means ± standard deviation.
Table 6.
The increased or decreased proteins in the monomeric protein extracted with 10% 1-propanol in LF a during mixing.
Table 6.
The increased or decreased proteins in the monomeric protein extracted with 10% 1-propanol in LF a during mixing.
| Spot No. b | Identification c | Spot Ratio (%) d | Increase (↑) or Decrease (↓) | |
|---|---|---|---|---|
| Flour | Build Up | |||
| 1 | ω-gliadin | 0.35 ± 0.17 | 1.61 ± 0.26 | ↑ |
| 2 | ω-gliadin | 0.61 ± 0.12 | 1.37 ± 0.38 | ↑ |
| 3 | ω-gliadin | 1.17 ± 0.24 | 1.87 ± 0.28 | ↑ |
| 4 | ω-gliadin | 1.19 ± 0.05 | 1.6 ± 0.37 | ↑ |
| 5 | ω-gliadin | 1 ± 0.24 | 2.1 ± 0.43 | ↑ |
| 6 | ω-gliadin | 0.83 ± 0.28 | 1.35 ± 0.24 | ↑ |
| 7 | ω-gliadin | 0.59 ± 0.05 | 0.77 ± 0.11 | ↑ |
| 8 | ω-gliadin | 1.53 ± 0.43 | 2.41 ± 0.27 | ↑ |
| 9 | ω-gliadin | 1.45 ± 0.3 | 2.14 ± 0.18 | ↑ |
| 10 | ω-gliadin | 1.47 ± 0.35 | 2.08 ± 0.28 | ↑ |
| 11 | α-gliadin | 0.88 ± 0.2 | 0.51 ± 0.13 | ↓ |
| 12 | α-gliadin | 2.46 ± 0.9 | 0.85 ± 0.64 | ↓ |
| 13 | α-gliadin | 1.53 ± 0.65 | 0.45 ± 0.56 | ↓ |
| 14 | γ-gliadin | 2.08 ± 0.48 | 1.44 ± 0.31 | ↓ |
| 15 | LMW-glutenin | 2.8 ± 1.09 | 0.9 ± 0.99 | ↓ |
| 16 | LMW-glutenin | 2.09 ± 0.53 | 0.96 ± 0.65 | ↓ |
a Spots were detected by 2D-DIGE; significant differences (p < 0.05, n = 4) among any of the groups were determined by an ANOVA test. b These spot numbers correspond to the spot numbers in Figure 7b. c The identification of each protein was estimated from the report of Dupont et al. [36]. d Values are the means ± standard deviation.
Publisher’s Note: MDPI stays neutral with regard to jurisdictional claims in published maps and institutional affiliations. |
© 2021 by the authors. Licensee MDPI, Basel, Switzerland. This article is an open access article distributed under the terms and conditions of the Creative Commons Attribution (CC BY) license (https://creativecommons.org/licenses/by/4.0/).
Share and Cite
MDPI and ACS Style
Iwaki, S.; Hayakawa, K.; Fu, B.-X.; Otobe, C. Changes in Hydrophobic Interactions among Gluten Proteins during Dough Formation. Processes 2021, 9, 1244. https://0-doi-org.brum.beds.ac.uk/10.3390/pr9071244
AMA Style
Iwaki S, Hayakawa K, Fu B-X, Otobe C. Changes in Hydrophobic Interactions among Gluten Proteins during Dough Formation. Processes. 2021; 9(7):1244. https://0-doi-org.brum.beds.ac.uk/10.3390/pr9071244
Chicago/Turabian StyleIwaki, Sonoo, Katsuyuki Hayakawa, Bin-Xiao Fu, and Chikako Otobe. 2021. "Changes in Hydrophobic Interactions among Gluten Proteins during Dough Formation" Processes 9, no. 7: 1244. https://0-doi-org.brum.beds.ac.uk/10.3390/pr9071244
Note that from the first issue of 2016, this journal uses article numbers instead of page numbers. See further details here.