
Investigation of Seeds and Peels of Citrullus colocynthis as Efficient Natural Adsorbent for Methylene Blue Dye


1
Chemistry Department, Faculty of Science, Albaha University, Al Bahah 65731, Saudi Arabia
2
Department of Chemistry, Faculty of Sciences of Gabes, University of Gabes, Gabes 6072, Tunisia
*
Author to whom correspondence should be addressed.
Processes 2021, 9(8), 1279; https://0-doi-org.brum.beds.ac.uk/10.3390/pr9081279
Submission received: 14 June 2021
/
Revised: 16 July 2021
/
Accepted: 21 July 2021
/
Published: 25 July 2021
(This article belongs to the Topic New Research on Detection and Removal of Emerging Pollutants)
Abstract
:Natural adsorbents as low-cost materials have been proved efficient for water remediation and have significant capacity for the removal of certain chemicals from wastewater. The present investigation aimed to use Citrullus colocynthis seeds (CCSs) and peels (CCPs) as an efficient natural adsorbent for methylene blue (MB) dye in an aqueous solution. The examined biosorbents were characterized using surface area analyzer (BET), scanning electron microscope (SEM), thermogravimetric analyzer (TGA) and Fourier transform infra-red (FT-IR) spectroscopy. Batch adsorption experiments were conducted to optimize the main factors influencing the biosorption process. The equilibrium data for the adsorption of MB by CCSs were best described by the Langmuir isotherm followed by the Freundlich adsorption isotherms, while the equilibrium data for MB adsorption by CCPs were well fitted by the Langmuir isotherm followed by the Temkin isotherm. Under optimum conditions, the maximum biosorption capacity and removal efficiency were 18.832 mg g−1 and 98.00% for MB-CCSs and 4.480 mg g−1 and 91.43% for MB-CCPs. Kinetic studies revealed that MB adsorption onto CCSs obeys pseudo-first order kinetic model (K1 = 0.0274 min−1), while MB adsorption onto CCPs follows the pseudo-second order kinetic model (K2 = 0.0177 g mg−1 min−1). Thermodynamic studies revealed that the MB biosorption by CCSs was endothermic and a spontaneous process in nature associated with a rise in randomness, but the MB adsorption by CCPs was exothermic and a spontaneous process only at room temperature with a decline in disorder. Based on the obtained results, CCSs and CCPSs can be utilized as efficient, natural biosorbents, and CCSs is promising since it showed the highest removal percentage and adsorption capacity of MB dye.
1. Introduction
Dyes are considered one of the most concerning industrial contaminants that are discharged into the environment in large amounts. They significantly spoil pleasant water characteristics and damage the aquatic environment [1]. Therefore, there are increasing research efforts, as it is vitally important to develop suitable and efficient techniques for the treatment of dye pollutants and their effective removal from wastewater to guarantee the safe discharge of treated liquid wastes into watercourses and water bodies [2]. Many conventional chemical, physical, and biological methods have been developed for the decontamination of water, but unfortunately, most of these methods are not applicable for large scale industries because of the limitations posed by the majority of them, such as high cost, low efficiency at low dye concentrations, and sludge production [3,4]. Adsorption is considered an efficient and prevalent process used for wastewater remediation, as it is capable of eliminating hazardous pollutants and color [5]. It has been reported as an attractive method, due to its multiple benefits, such as the operation facileness, the design simplicity and the high-quality treated water production [6,7]. Activated carbon is the most commonly used effective adsorbent for several kinds of dyes, owing to its high surface area, but it is restricted by its high cost and regeneration problems [8]. Various low-cost adsorbents, including agricultural and industrial by-products, have been developed as an alternative to commercial adsorbents and examined for their ability to remove dyestuffs [6]. The advantage of using these materials is largely by virtue of their omnipresent availability and low cost, and their regeneration is unnecessary [9]. Numerous studies reported the successful adsorption of dyes, using different parts of plants as adsorbent materials, such as Calotropis Procera [10], Artocarpus heterophyllus leaf [11], banana peels [12], almond gum [13], Oleander plant tissues [14], apple peels [15], Vigna Trilobata pod [16], Cucumis sativus peel [17], Antigonon leptopus leaf [18], Lathyrus sativus husk [19], etc.
Citrullus colocynthis is a species of the genus Citrullus of the Cucurbitaceae family known as handal in Arabic. It is native to tropical Africa and Asia and largely distributed in the arid regions of the Mediterranean basin [20]. The fruit is rich in biologically active constituents and used in the treatment of different ailments [21]. Recent studies have focused on the efficiency of Citrullus colocynthis waste ash and seed ash as phenol biosorbents [22,23].
In this work, MB was adopted as a model dye, which is widely used by a huge number of industries, such as the textile, pharmaceutical and food industries; exposure to it can cause different adverse health effects [24]. Several studies have highlighted the use of ecofriendly low-cost adsorbents based on natural materials for the removal of this contaminant from water systems.
To the best of our knowledge, CCSs and CCPs untreated forms have not been used for such a purpose. Hence, this work is dedicated to investigating the effectiveness of CCSs and CCPs as adsorbent materials for removing MB dye from aqueous solutions. The impact of the contact time, MB initial concentration, adsorbent particle size, adsorbent dosage, pH and temperature factors on the biosorption process were examined. Additionally, the biosorption kinetics, isotherms and thermodynamic properties were analyzed.
2. Materials and Methods
2.1. Materials and Solutions
MB dye (molecular formula: C16H18ClN3S) was purchased from Sharlau (Spain) and was used without further purification. A total of 1000 mg/L MB dye stock solution was prepared in the laboratory. The required standard solutions were obtained by diluting the stock solution, using distilled water, and were used to prepare the calibration curve.
Citrullus colocynthis plant fruits were collected from the Al-Aqiq region in Al-Baha province located in the southwestern part of Saudi Arabia in November 2019. The collected fruits were rinsed thoroughly with tap water and air dried in the shade for two weeks. Then, CCSs and CCPs were separated, dried in the oven at 50 °C for about 24 h, crushed in a mixer grinder, screened through a set of sieves to obtain three fractions viz. <600 µm, 600–1180 µm and >1180 µm, and were stored in plastic containers for further use as adsorbent materials.
2.2. Characterization of Biosorbents
The point of zero charge (pHPZC) of the biosorbents was measured as described by Miyah et al. [25]. The surface area, pore volume and pore radius were measured by the Surface Area and Pore Size Analyzer (model Nova touch-Quantachrome instruments, Anton Paar QuantaTech, New York, NY, USA). The TGA measurements were performed on thermogravimetric Analyzer (Model Pyris 1, Perkin Elmer, Waltham, MA, USA). The morphological features of the biosorbents and MB-loaded biosorbents were determined by SEM (model: Nova-Nano SEM-600, FEI, Hillsboro, OR, USA) at 15.0 kV and 500× magnification. Infrared spectra of the biosorbents and MB-loaded biosorbents were recorded over 4000–400 cm−1, using Thermo Scientific Nicolet iS50 FT-IR spectrophotometer in the attenuated total reflectance (ATR) mode.
2.3. Batch Biosorption Experiments
The batch biosorption experiments were performed in a shaking incubator (JSSI-100C, JSR, Tokyo, Japan) at 140 rpm. The experiments were performed at different parameters, including contact time (0–240 min), initial MB dye concentration (2–7 mg/L), particle size of biosorbents (<600 µm, 600–1180 µm and >1180 µm), adsorbent dosage (0.5 g/L–10 g/L), pH (2–12), and temperature (20–60 °C). The solution pH was adjusted by adding 0.1M NaOH or 0.1M HCl before adding the adsorbent. Finally, the adsorbent was separated from the solution, using a HPLC syringe filter. The residual dye concentration was determined by monitoring the optical density for the dye solution at 665 nm, using a UV-Vis spectrophotometer (PD 303S, APEL, Japan).
The removal percentage R (%) was determined using Equation (1):
where Ci and Ct are the MB dye concentration (mg/L) before and after the adsorption, respectively.
The equilibrium biosorption loading qe (mg g−1) of MB adsorbed by CCSs and CCPs was assessed using Equation (2):
where Ce is MB dye concentrations (mg/L) at equilibrium, V is the volume of aqueous solution (L) and m is the mass of the biosorbent (g).
2.4. Adsorption Isotherms
Different isotherm equations are available to analyze the equilibrium data. Langmuir, Freundlich and Temkin equations, which are the most common ones, were adopted in the present investigation. Regression methods are generally used to assess the coefficients of the isotherm equations.
The used Langmuir equation was used in linearized form as shown in Equation (3) [14]:
In addition, the linear form of Freundlich equation is described by Equation (4) [26]:
The used Temkin isotherm linear expression is given in Equation (5) [19]:
where qe is adsorbent-phase concentration of adsorbate (mg g−1) and Ce is the aqueous-phase concentration of adsorbate (mg/L) at equilibrium. qm is the maximum adsorption capacity (mg g−1) and KL is the Langmuir constant (L/mg) related to the free adsorption energy. Kf (mg g−1) (L g−1)1/n is the Freundlich constant related to the adsorption capacity and 1/n is an indicator of the adsorption strength. R is the ideal gas constant (8.314 J mol−1 K−1), T is the absolute temperature (K), and bt (J mol−1) and Kt (L mg−1) are the Temkin constants linked with the equilibrium binding constant and adsorption heat.
The Langmuir model is helpful in calculating the separation factor abbreviated as RL, which is a dimensionless factor, by using Equation (6):
According to RL values, the biosorption process can be either favorable (0 < RL < 1), linear (RL = 1), irreversible (RL = 0) or unfavorable (RL > 1) [27].
2.5. Biosorption Kinetics
The pseudo-first order kinetic model, developed by Lagergren in 1898, suggests the existence of physisorption, which is represented by Equation (7) [19]:
where qe is the adsorption capacity (mg g−1) at equilibrium time and qt is the adsorption capacity at any time t (min), k1 (min−1) is the rate constant for the pseudo-first-order adsorption process.
The pseudo-second order kinetic model presumes that chemisorption is the rate-limiting step [28]. It is described by Equation (8):
where qe is the adsorption capacity (mg g−1) at equilibrium and qt is the adsorption capacity at any time t (min), k2 (g mg−1 min−1) is the rate constant for the pseudo-second-order adsorption process.
2.6. Thermodynamic Studies
Thermodynamic parameters’ determination is required to study the spontaneity and feasibility of the adsorption process. These thermodynamic properties were assessed at a given temperature, using Equations (9) and (10) [27]:
where kd = qe/Ce is the apparent equilibrium adsorption constant at temperature T (K), ΔGº is Gibb’s free energy, ΔHº is the enthalpy and ΔSº is the entropy.
3. Results and Discussions
3.1. Characterization of Biosorbents
3.1.1. Surface Area
The surface area, pore volume and pore radius values of CCSs and CCPs were 24.6794 and 11.9878 m²/g, 0.023 and 0.013 cc/g, and 14.90 and 15.60 Å, respectively. It is worth noting that the surface area was approximately two-fold higher in the case of CCSs than in CCPs, suggesting that CCSs had better adsorbent capacity than CCPs. These observed values were higher compared with other reported biosorbents, such as orange and banana peels [29], jackfruit leaf [11], pinus durangensis sawdust [30], tea waste [31] and Lathyrus sativus husk [19], but were smaller than other adsorbents, such as activated carbon [32]. As the pore volumes were found to be less than 20 Å, CCSs and CCPs are considered predominately microporous materials, according to IUPAC classification [33].
3.1.2. TGA Analysis
The thermal stability of CCSs and CCPs was determined by TGA. The plot of the percent weight loss versus temperature over time is portrayed in Figure 1. Thermogravimetric (TG) experiments were performed at a temperature range starting from 25 °C to 800 °C with 10 °C/min as heating rate. The TG pyrolysis plots exhibit the typical reverse s-shaped curves distinctive of the thermal degradation of lignocellulosic biomass under an inert atmosphere [34]. Moreover, the TG curves indicate that the thermal degradation of CCSs and CCPs occurred in two stages. During the first stage, the % weight loss was 2.80% and 3.12%, which occurred at 88.28 °C and 91.91 °C for CCSs and CCPs, respectively, which may be ascribed to the release of moisture. In the second stage, for both biosorbents, a continuous mass loss was observed with the rising of temperature, up to 610 °C and 670 °C for CCSs and CCPs, respectively. The highest mass % loss during the second stage was estimated to be 76.74% and 73.05%, which occurred at 351.28 °C and 303.18 °C for CCSs and CCPs, respectively. These findings may be associated with the removal of light molecules, including cellulose, hemicellulose and lignin, representing the essential constituents of the biomass among which hemicellulose is the most thermally unstable component [25]. It was revealed that the degradation temperatures of these components were in the range of 200–350 °C for hemicellulose, 250–400 °C for cellulose and 150–1000 °C for lignin [35]. At the end of this stage, it was observed that CCSs and CCPs were completely pyrolyzed, followed by a gradual drop in weight loss. The mass of biosorbents remained constant at 15.67% for CCSs and 17.14% for CCPs with the increasing of temperature, which is linked to the ash content of the biosorbents.
3.1.3. FT-IR Spectra
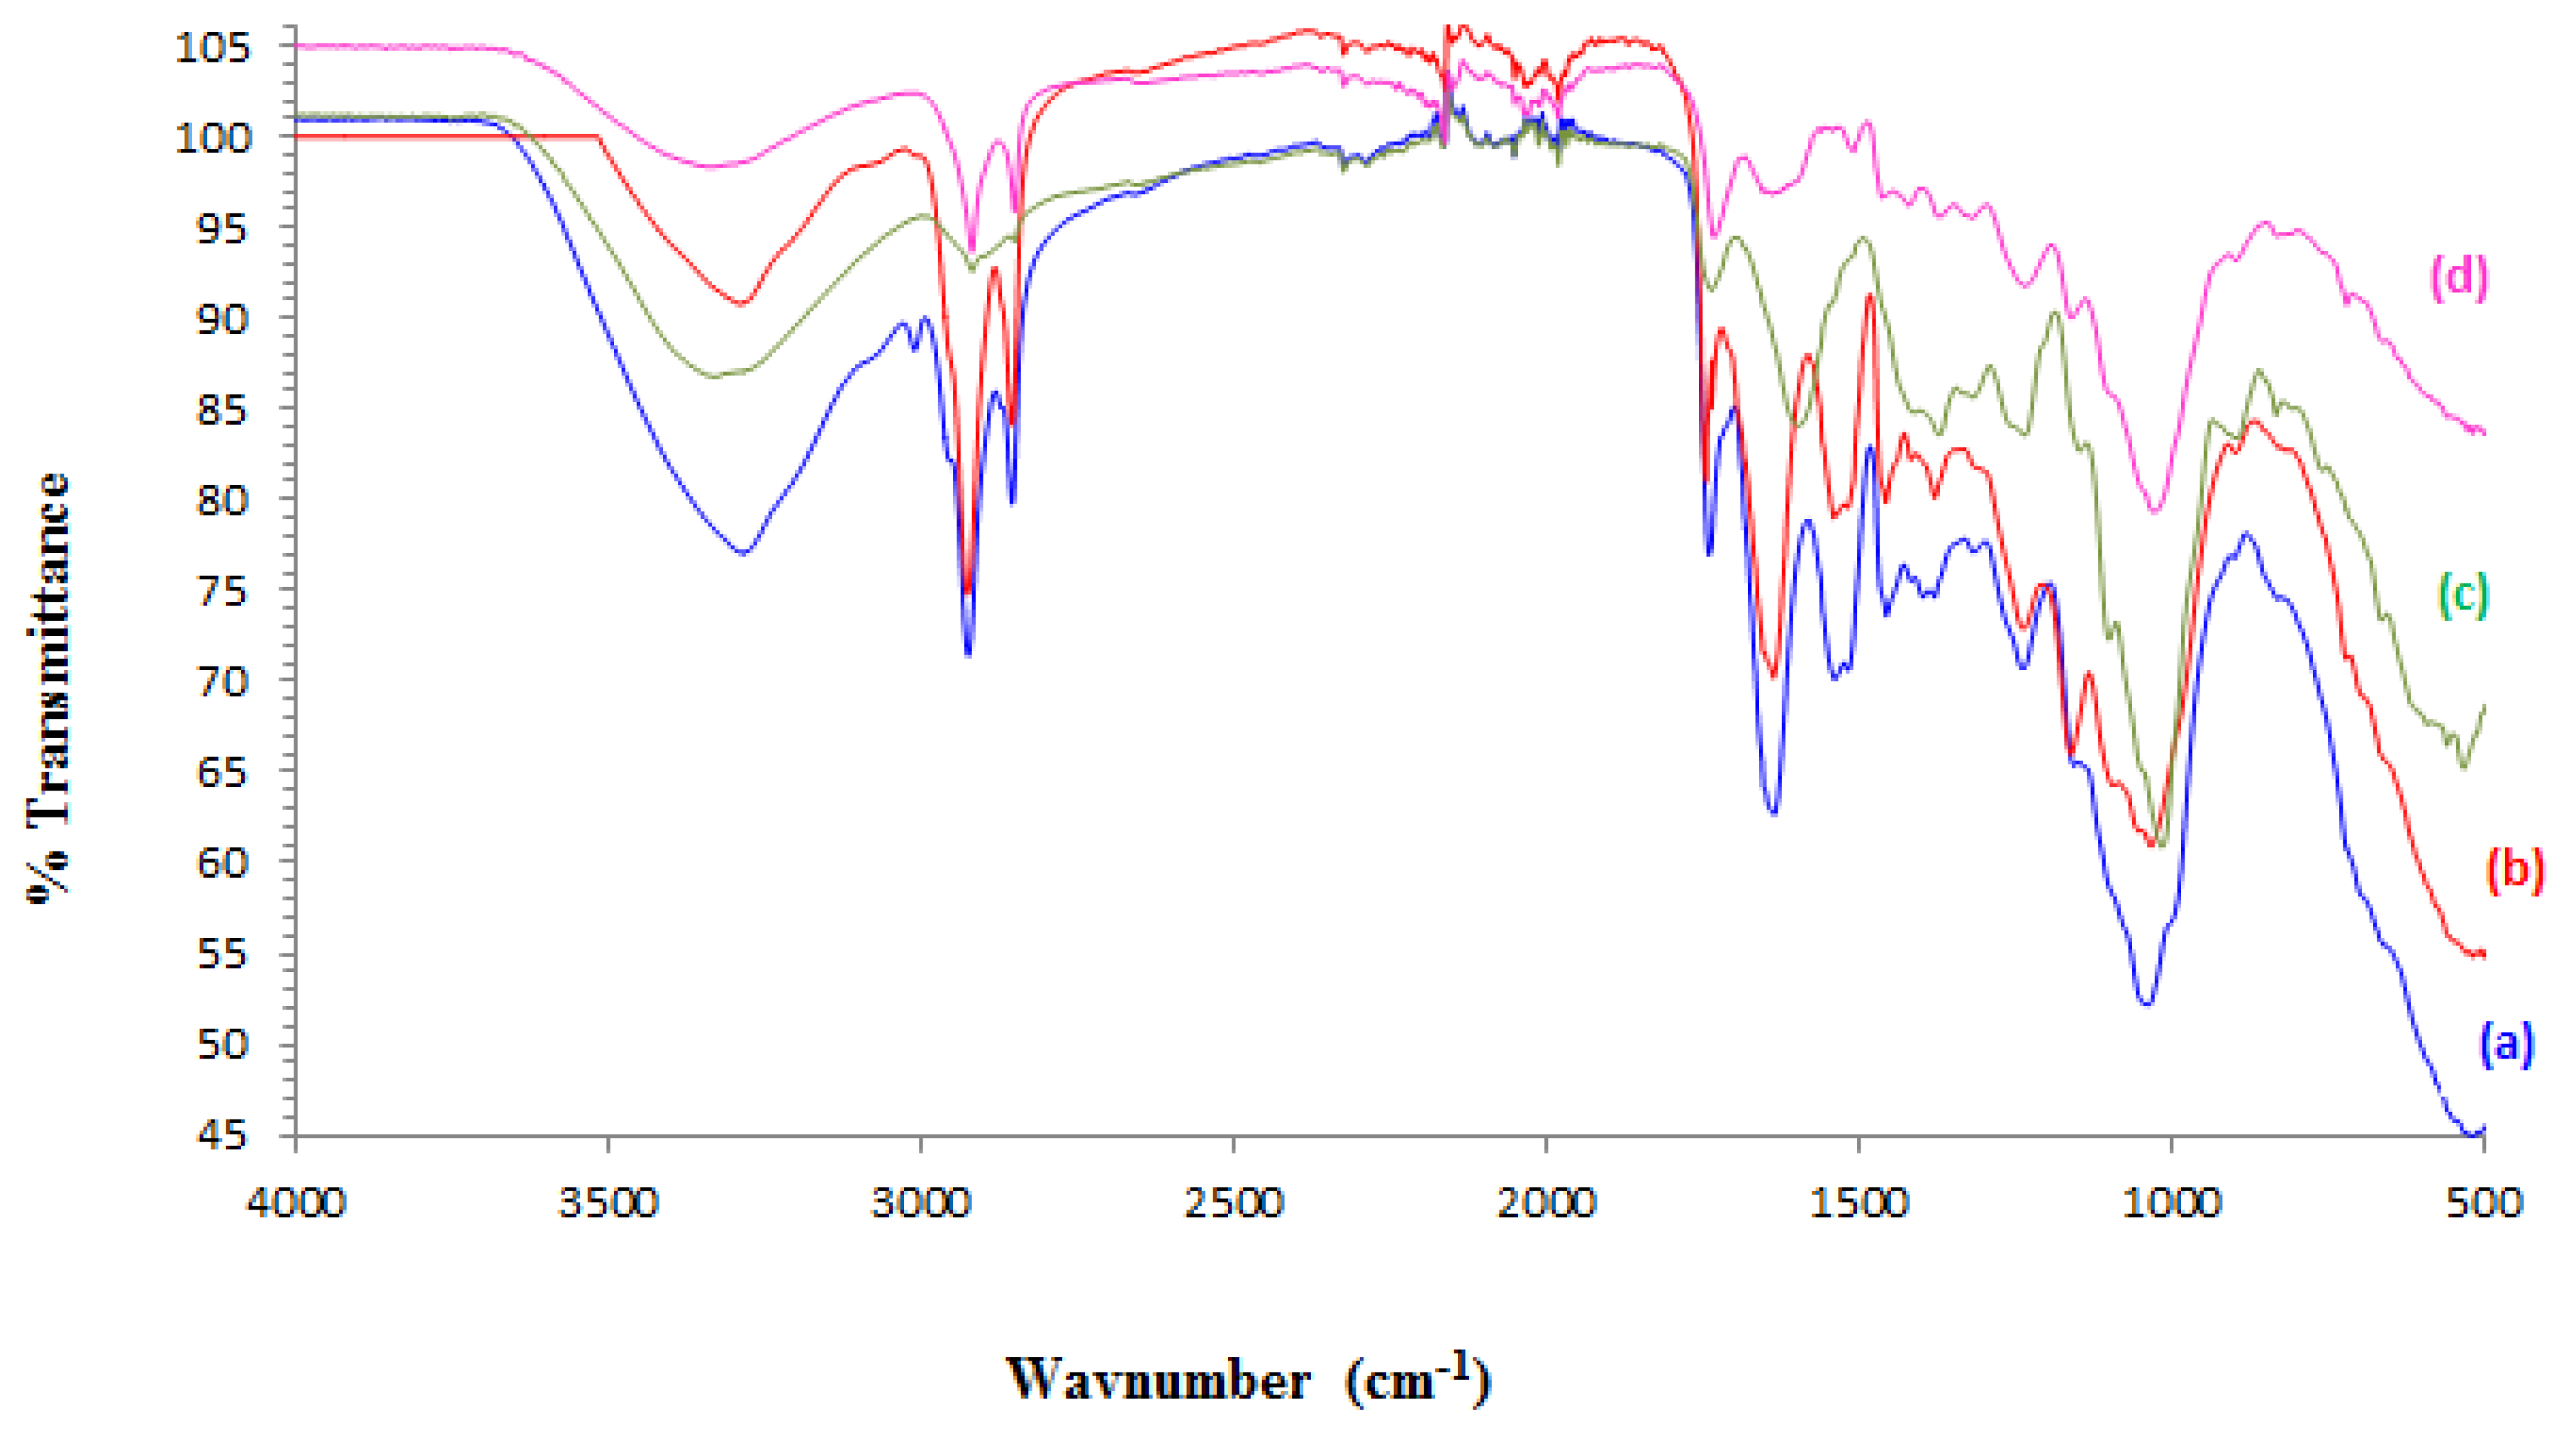
FT-IR spectroscopy is a useful technique for obtaining information on the nature of interactions between the adsorbent and adsorbate and for identifying the functional groups involved in these interactions [26]. The FT-IR spectra of CCSs and CCPs pre- and post adsorption are illustrated in Figure 2. The main FT-IR peaks were identified, assigned to their appropriate functional groups and the percent difference in band intensities (% ΔI) pre- and post-absorption was calculated. The findings are presented in Table 1. The FT-IR spectra for CCSs and CCPs showed the main peaks fundamentally linked to lignocellulosic biomass components [34], which were attributable to -OH groups (broadband), the -CH aliphatic group (sharp), the carbonyl group of ester and carboxylate, C=C of aromatic ring and C-O of carboxylate groups. It was observed that the positions of the bands before and after adsorption remained unchanged, while some major decrease in the band intensity of some specific peaks’ characteristic of -OH groups, C=C, C=O and C-O bonds appeared in the IR spectra of MB-loaded CCSs and CCPs. These observations suggest that there is involvement of the above-named functional groups in the MB biosorption process. Similar findings were obtained by Shakoor and Nasar [26] who concluded significant engagement of the corresponding functional groups, due to the peak intensity reduction instead of the peak shifts.
3.1.4. SEM
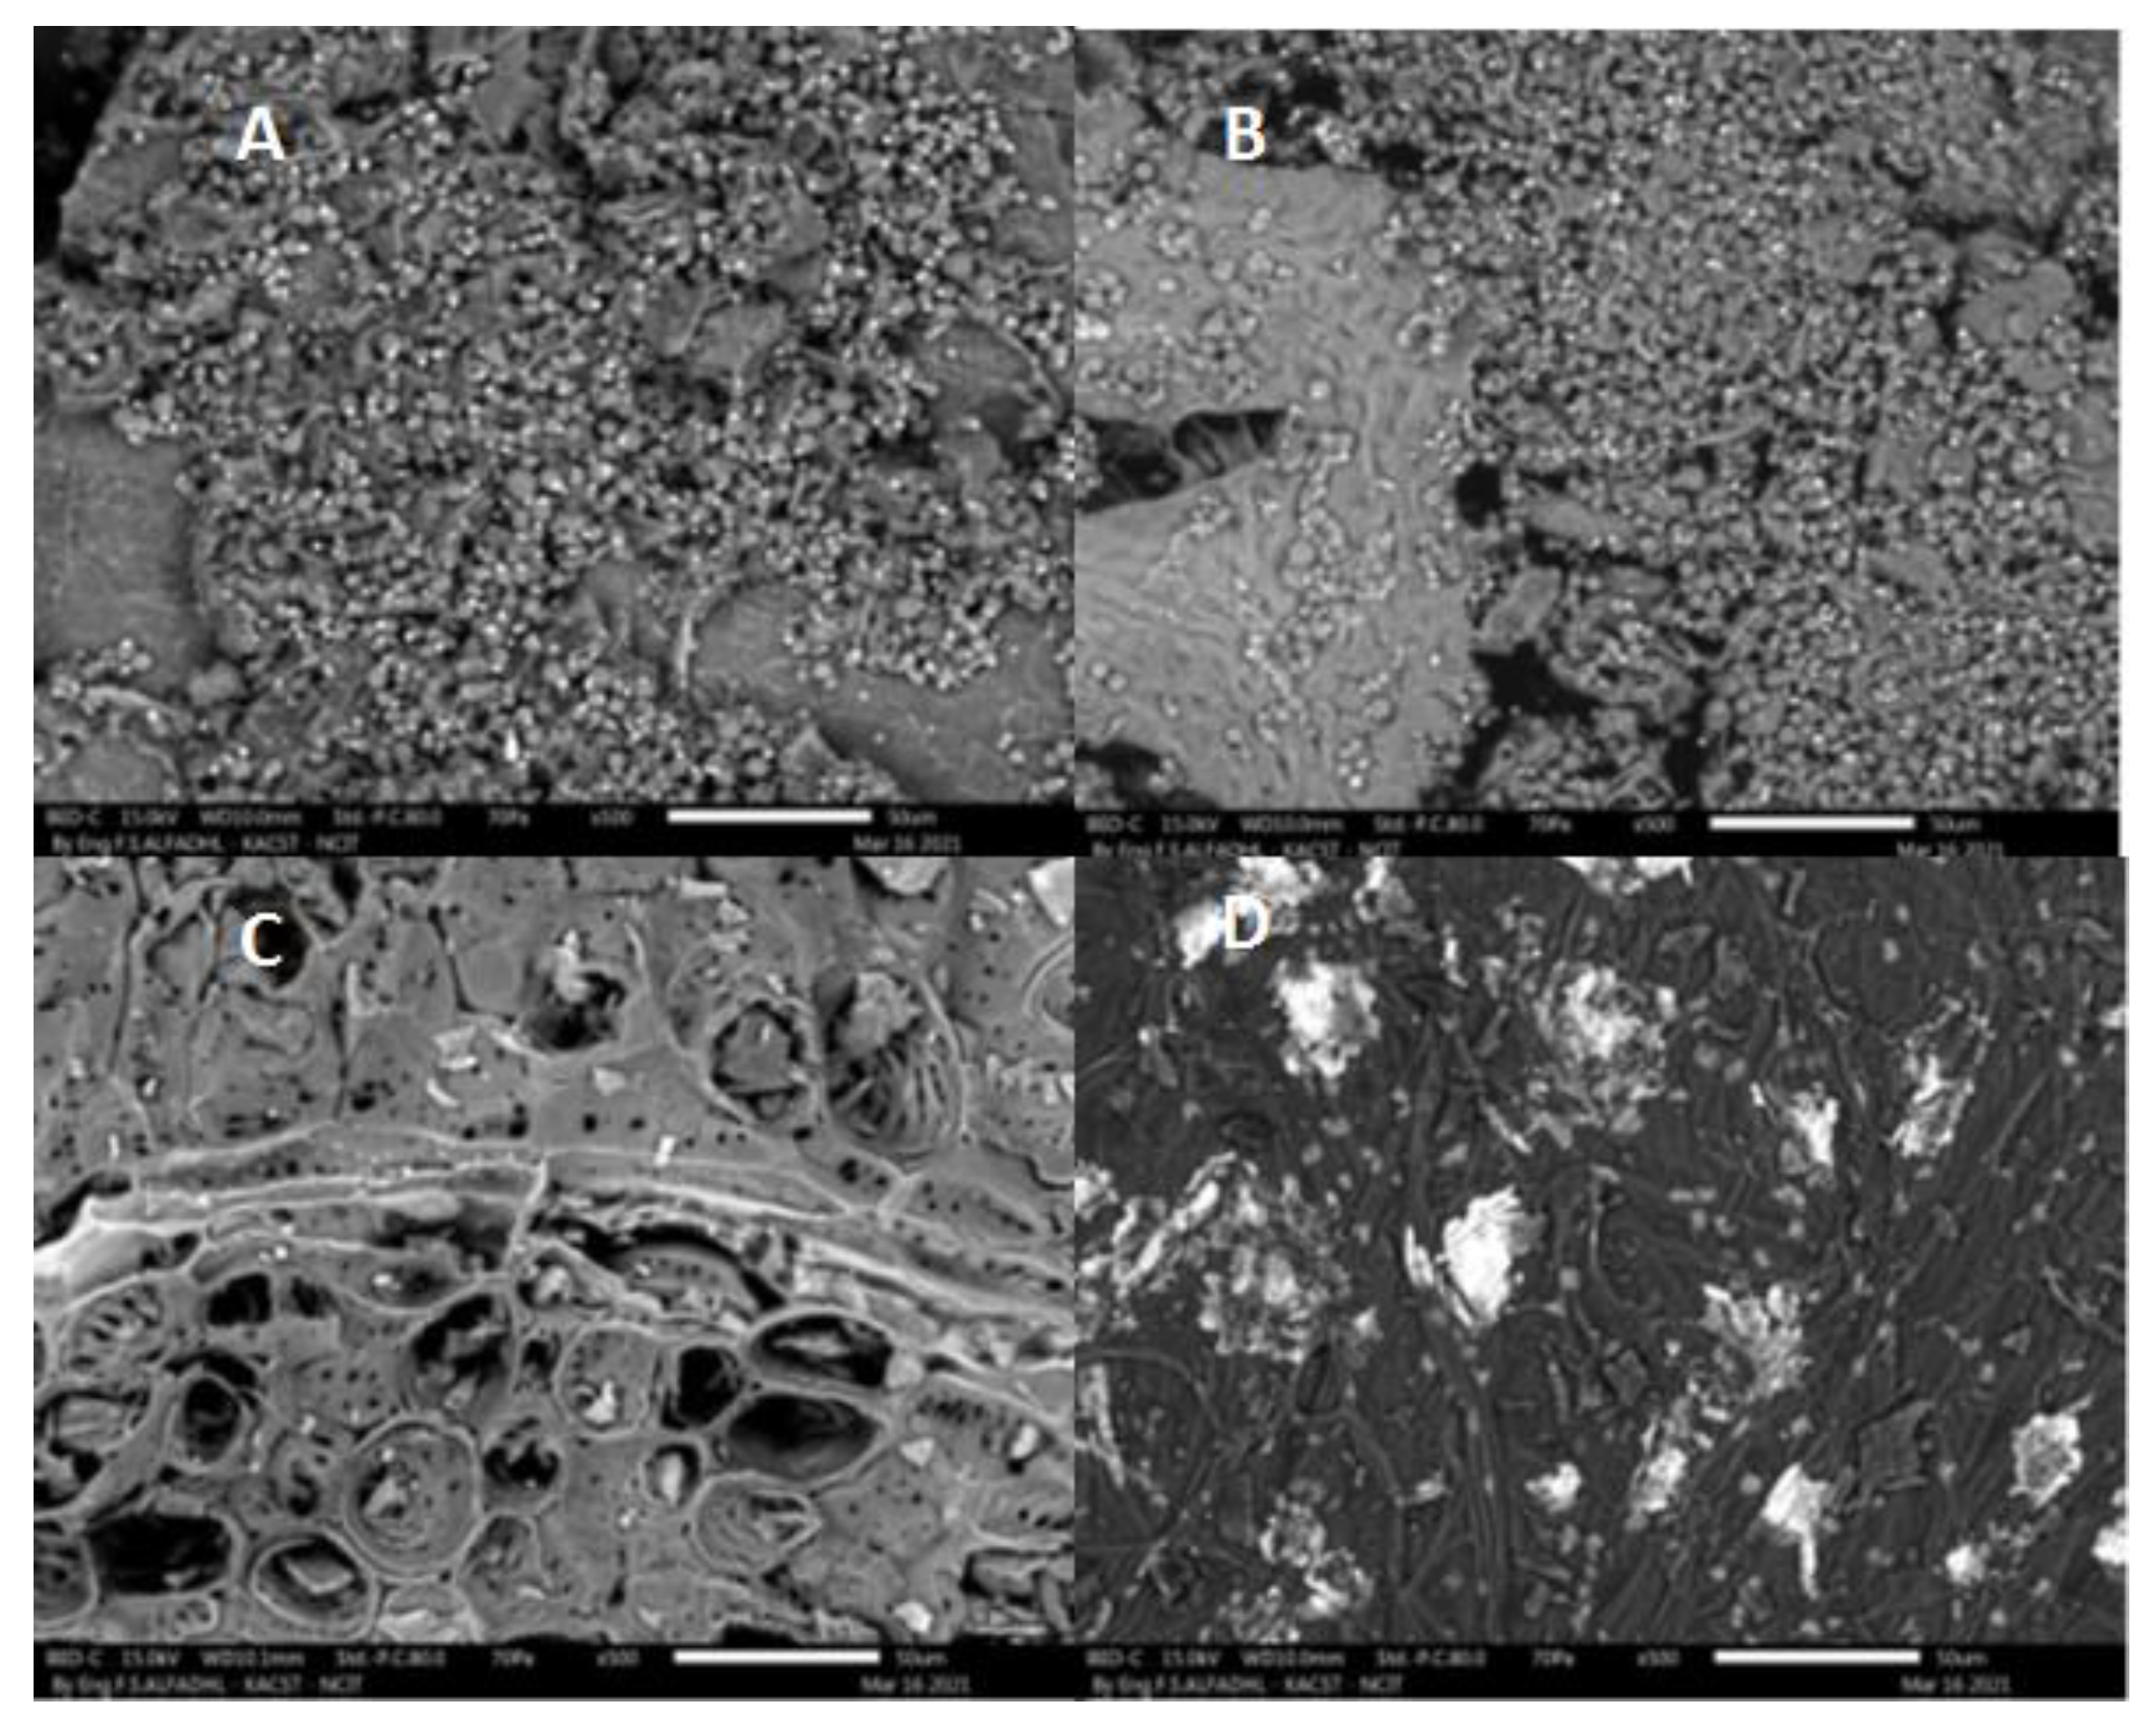
The pre- and post-adsorption SEM micrographs of CCSs and CCPs with MB, recorded at 500 magnifications, are illustrated in Figure 3. The SEM of CCSs exhibited the presence of irregular polygonal parenchymal cells with different sizes and shapes [45], while the SEM of CCPs exhibited a highly uneven, rough and porous surface, displaying clearly visible pockets with channels between them. The porous aspect and the surface heterogeneity are considered beneficial for any adsorbent [31]. It was noticed that these surfaces were completely modified after adsorption, indicating the filling of the pores and irregularities with the MB dye molecules.
3.2. Effect of Contact Time
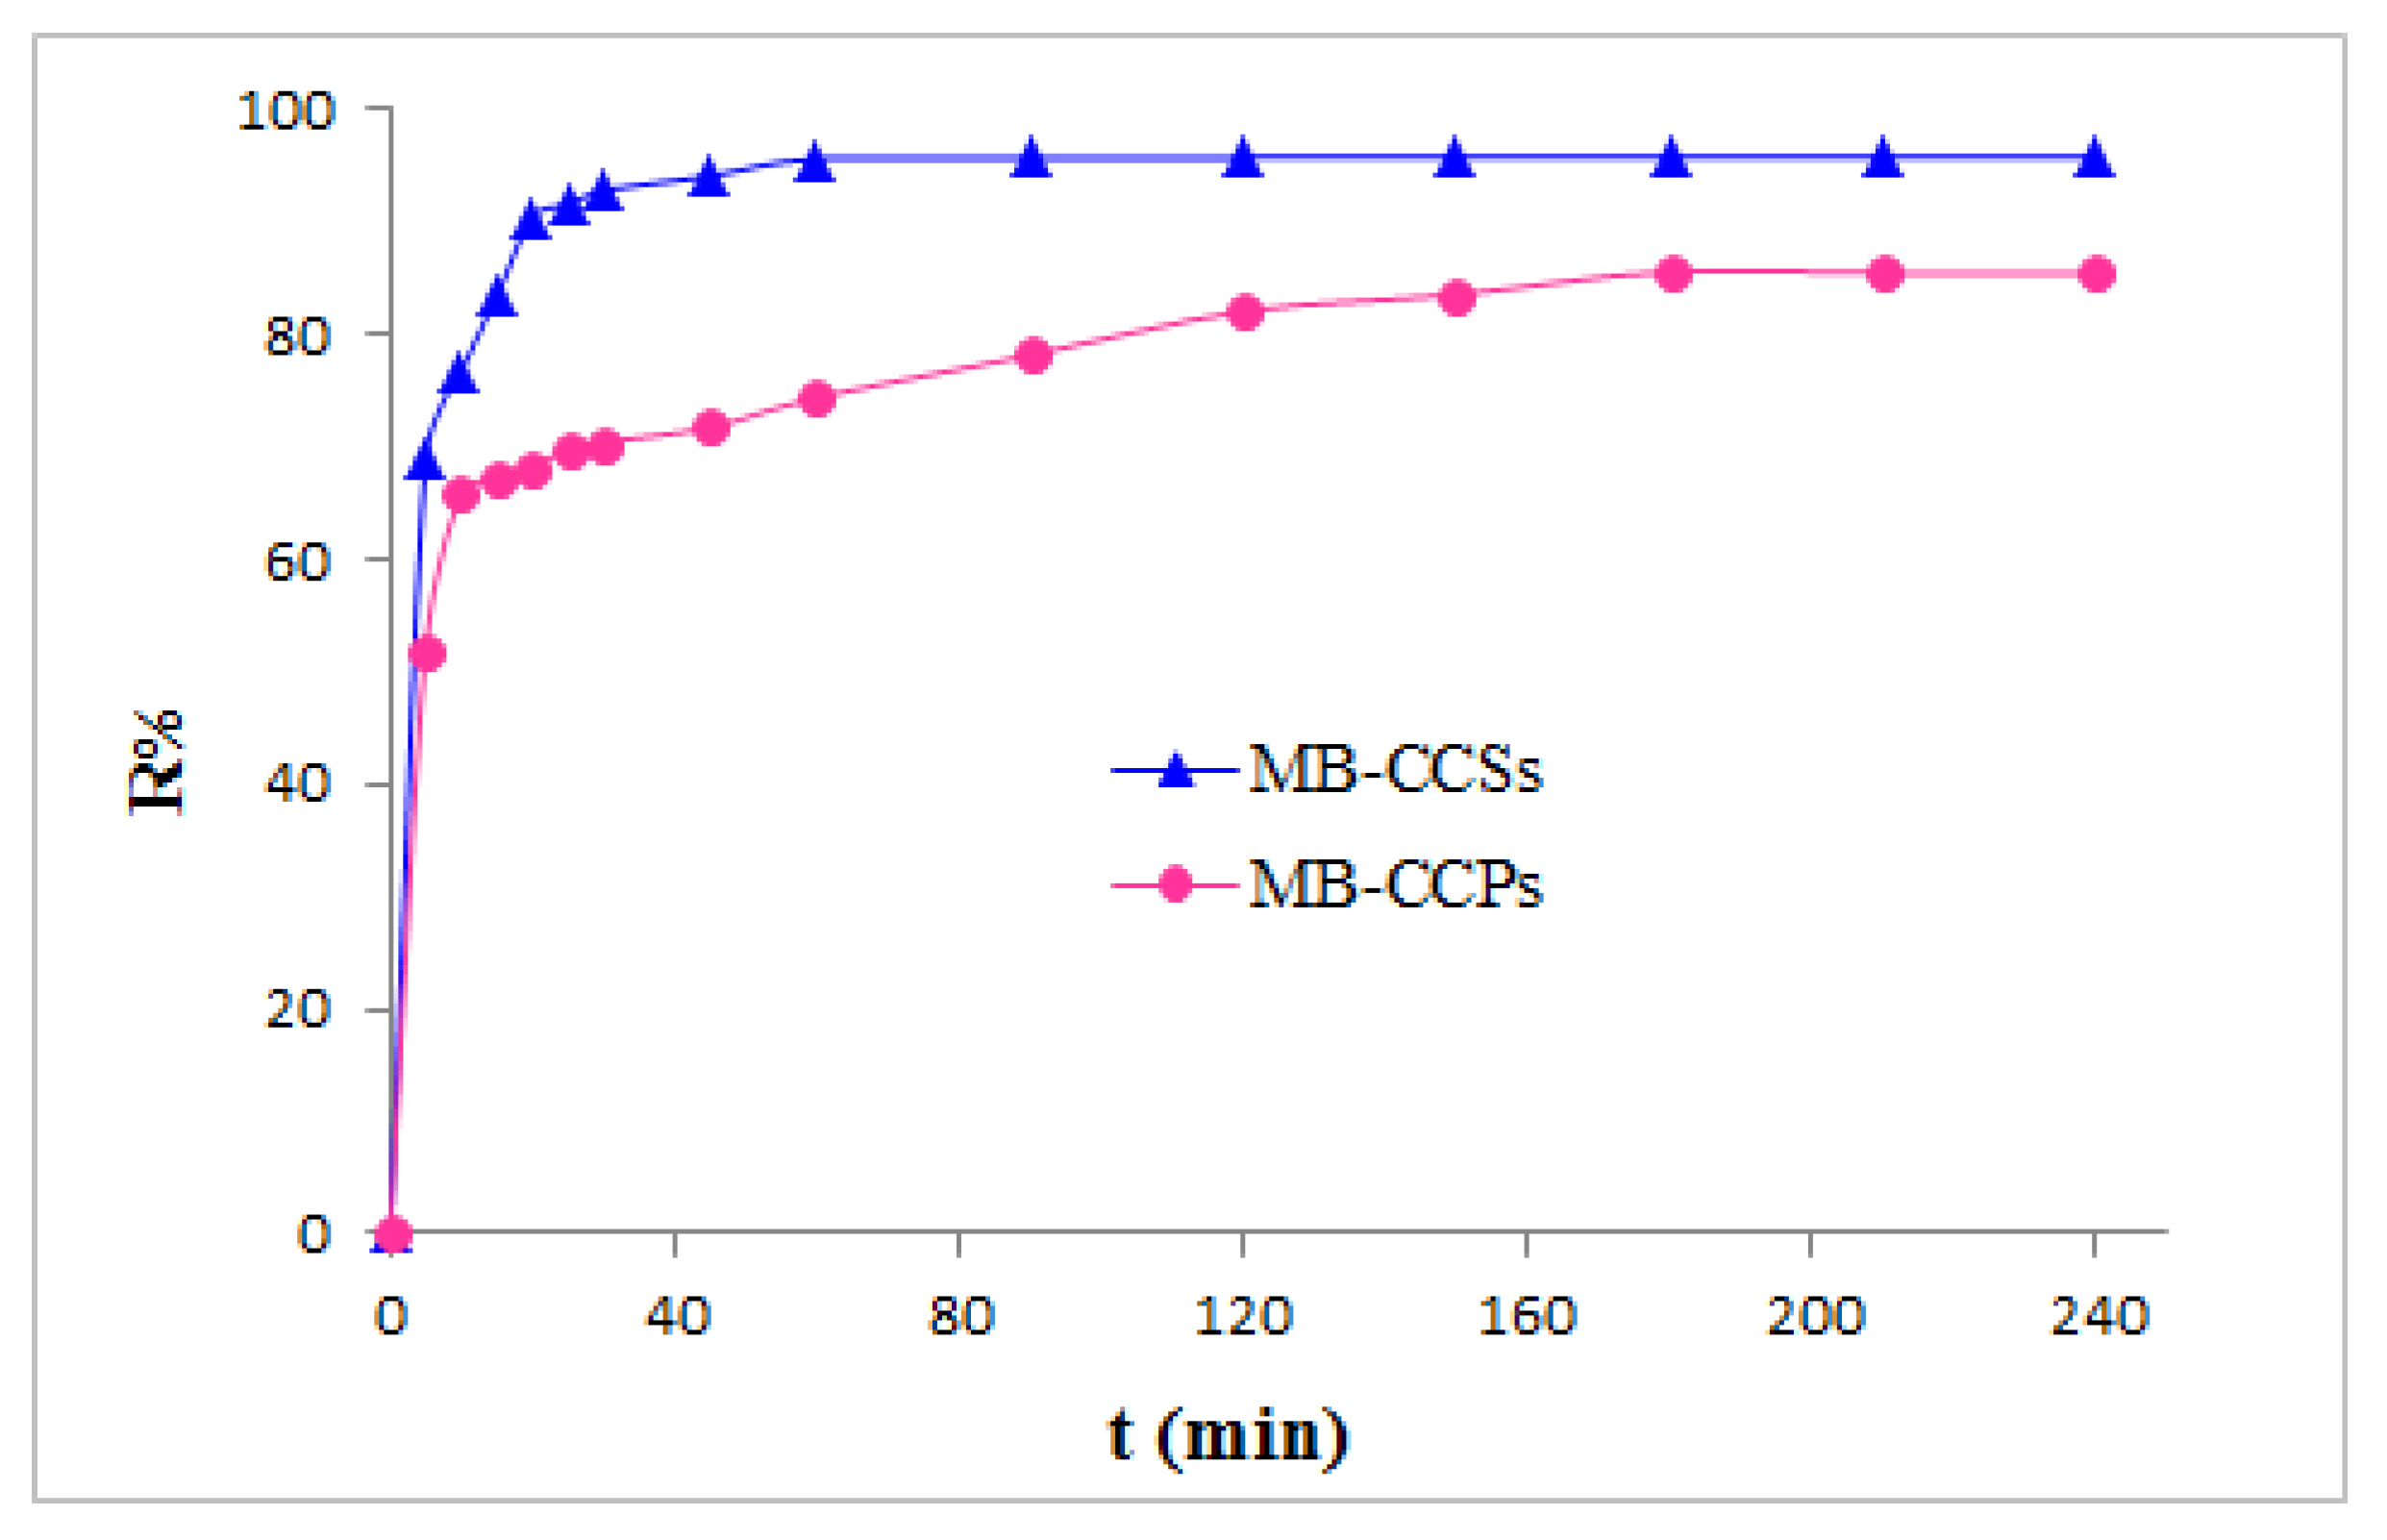
The effect of contact time on the MB removal by CCSs and CCPs as biosorbents over the time range of 0–240 min was studied; the changes in the MB removal efficiency are given in Figure 4. The removal rates of MB rose rapidly with both adsorbents during the first 20 min for CCSs and the first 45 min for CCPs, which was followed by a very slow adsorption rate. The equilibrium was reached after 60 min (R% = 95.57) for CCSs and 180 min for CCPs (R% = 85.55). This trend could be explained by the fact that a huge number of abundant unoccupied binding sites on the surface of both adsorbents were accessible at the adsorption process onset. In the middle stage, these sites were progressively covered, resulting in the adsorbent surface saturation. In the final stage, when all sites were fully occupied, the removal efficiency values remained constant, as no further adsorption occurs after the mentioned equilibrium times [26]. Hence, 60 min and 180 min were selected as the MB-CCS and MB-CCP optimum times, respectively, for subsequent batch experiments.
3.3. Effect of Initial MB Dye Concentration
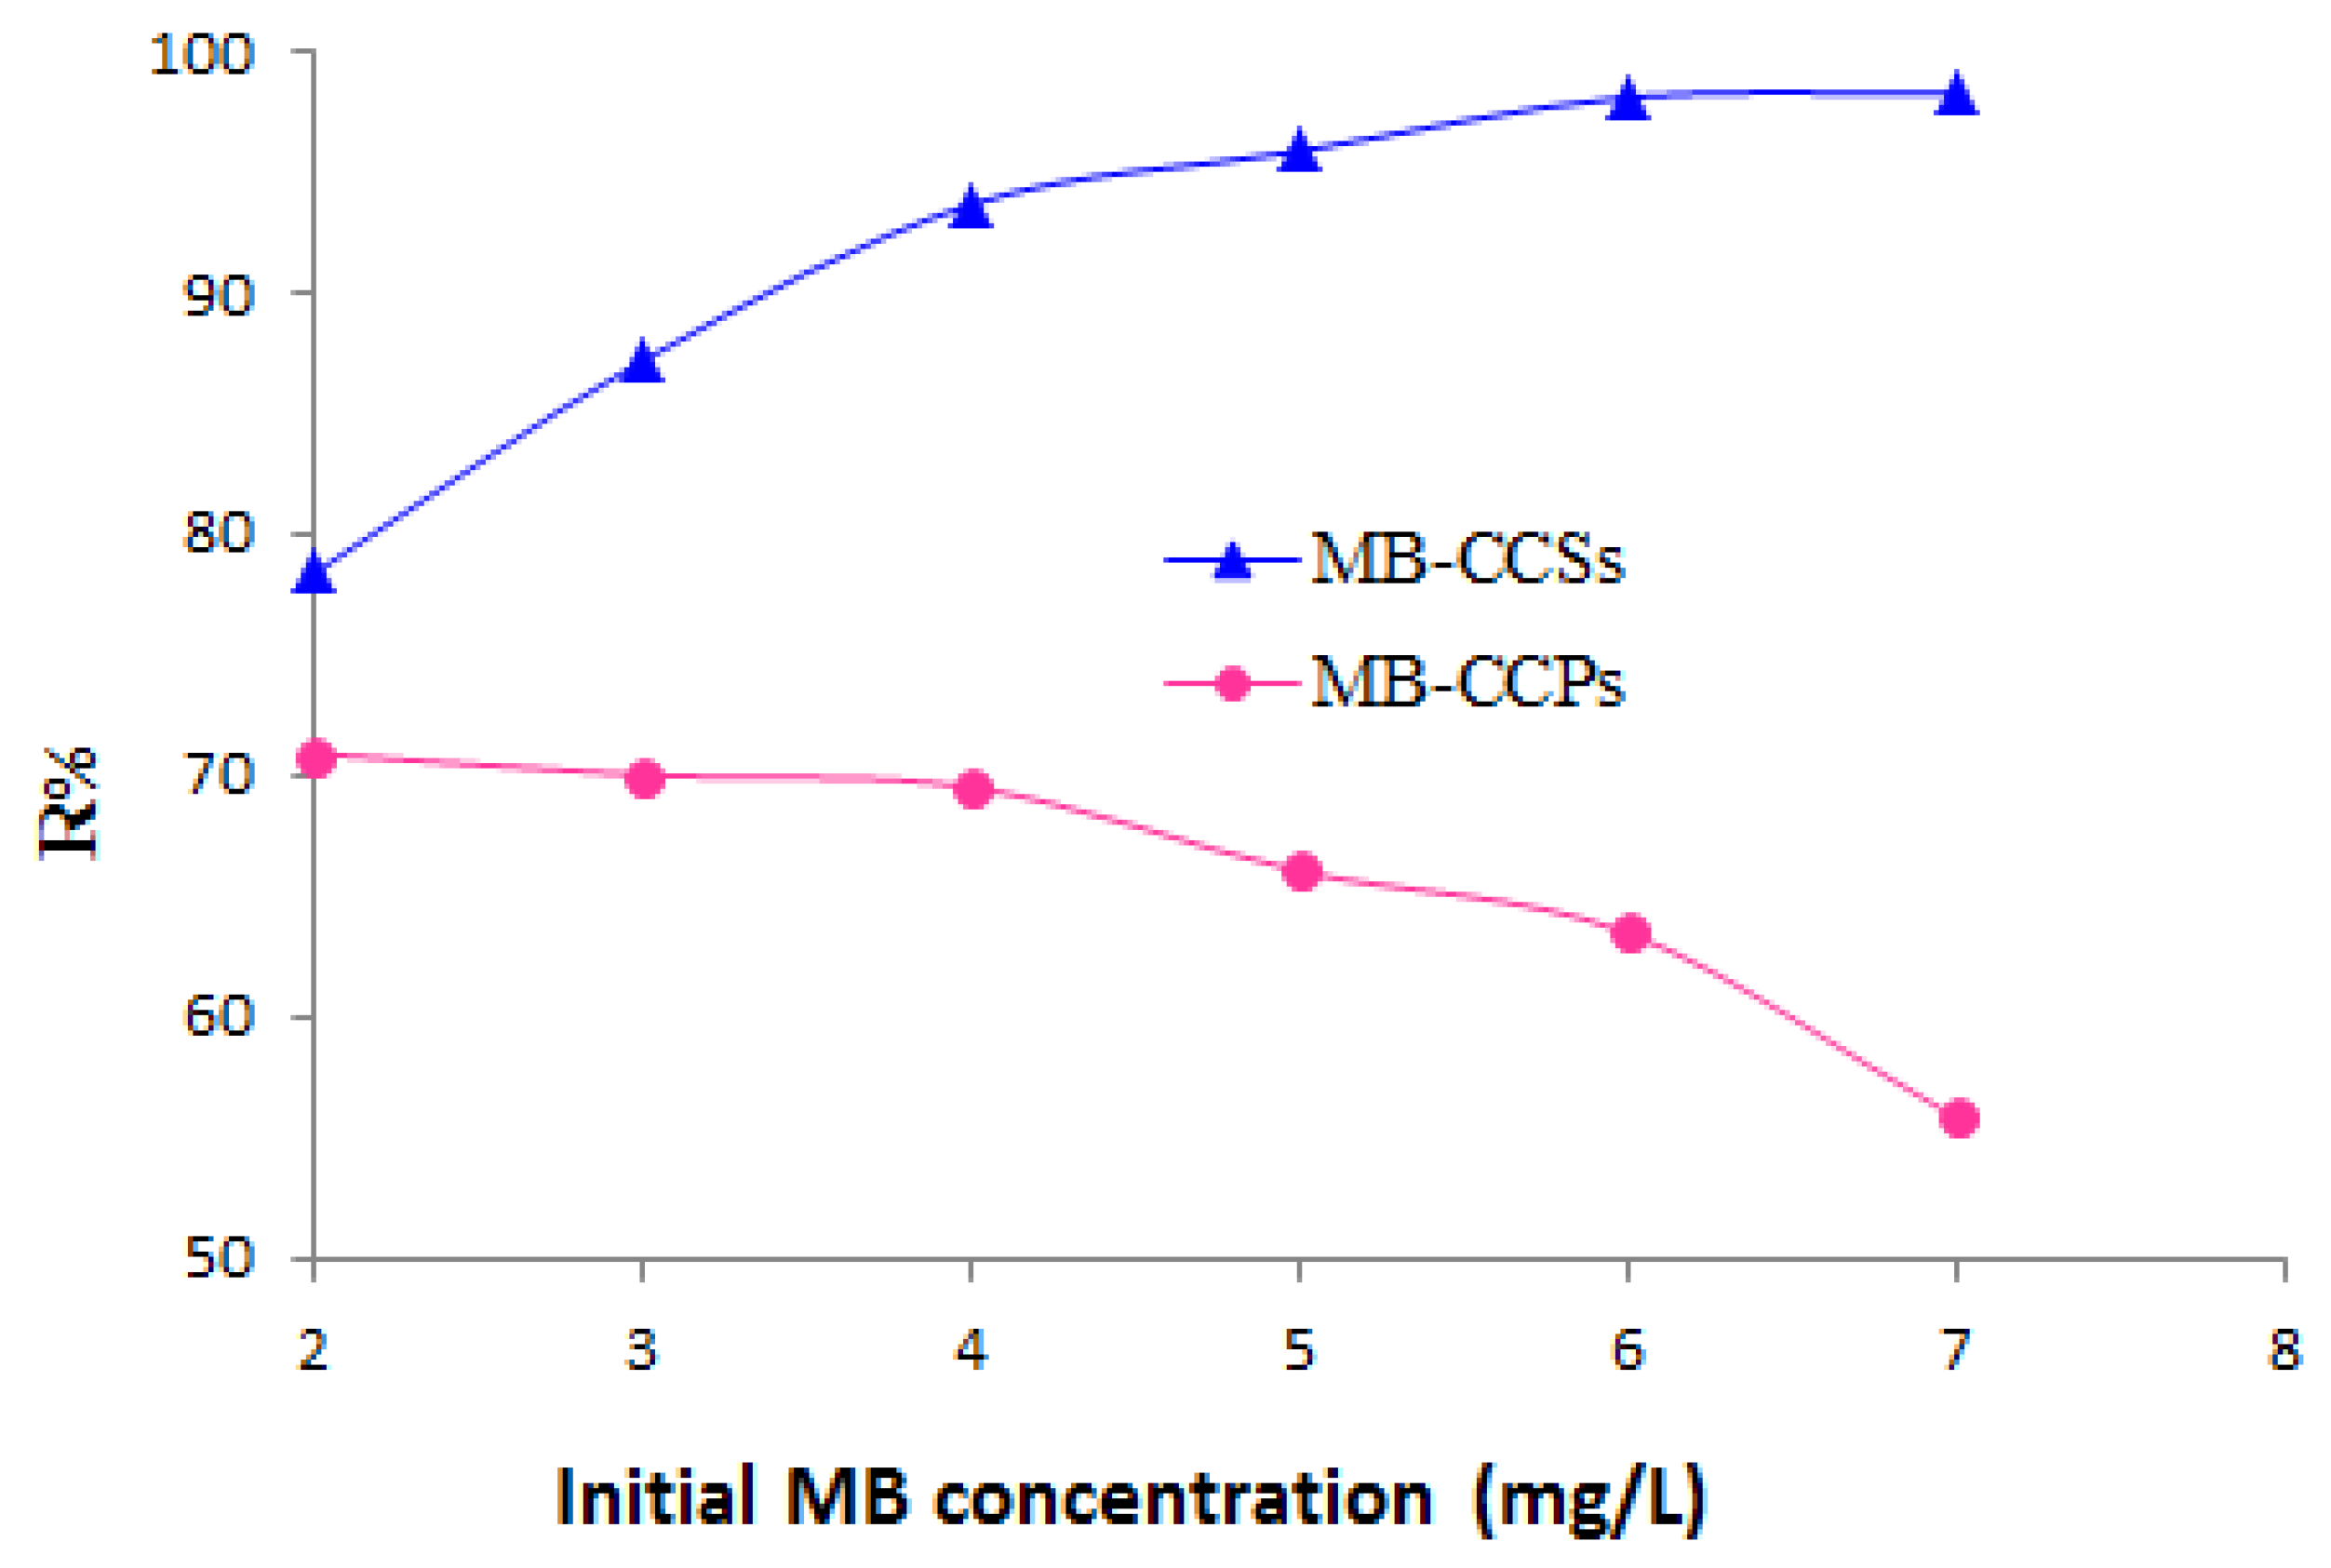
The effect of the initial MB dye concentration on the removal of MB dye by CCSs and CCPs adsorbents was investigated at various concentrations, ranging from 2 mg/L–7 mg/L. Figure 5 represents the dye removal efficiency (R%) versus concentration. The obtained results revealed that the removal efficiency of dye by CCSs increased from 78.36% to 98.09% as the MB dye concentration varied from 2 mg/L to 6 mg/L but insignificant changes were observed in the removal efficiency with further increases in the dye concentration. The rapid uptake of MB at low concentrations could be linked to the availability of a huge count of free active sites on CCSs particles, compared to the initial count of MB molecules, enhancing the collisions between MB and CCSs. A higher concentration provides a vital driving force to surmount the mass transfer resistance of dye molecules between the aqueous solution and the solid surface [14].
On the other hand, the dye removal efficiency by CCPs insignificantly decreased from 70.88% to 69.49% as the MB dye varied from 2 mg/L to 4 mg/L, followed by a quick decline to reach 55.82% at 7 mg/L. This could be explained by the availability of a limited number of active sites on the surface of CCPs, which would have become saturated at a definite concentration. At higher MB concentrations, the majority of the molecules are still unadsorbed, producing a decrease in the removal efficiency [11]. To make the biosorption process effective, MB dye concentrations of 6 mg/L and 4 mg/L were chosen as optimum values with CCSs and CCPs, respectively.
3.4. Impact of Adsorbent Particle Size
The impact of three different particle sizes of CCSs and CCPs on MB dye removal was investigated, and the results obtained are manifested in Table 2. The increase in particle size of CCSs decreased the MB dye removal efficiency (97.80% for <600 µm, 85.64% for 600 µm–1180 µm and 75.62% for >1180 µm). This may be explained by the fact that the adsorbent surface area with the smallest particles is the largest and contained the highest number of active sites and pores, which are more accessible [46]. Similar behavior was observed in using CCPs. Indeed, as the particle size decreased from >1180 µm to <600 µm, the MB removal efficiency was increased from 54.17% to 68.20%. However, the particles of the size 600–1180 µm were selected for further batch experiments, due to problems in the handling of CCPs smaller particles during the adsorption process.
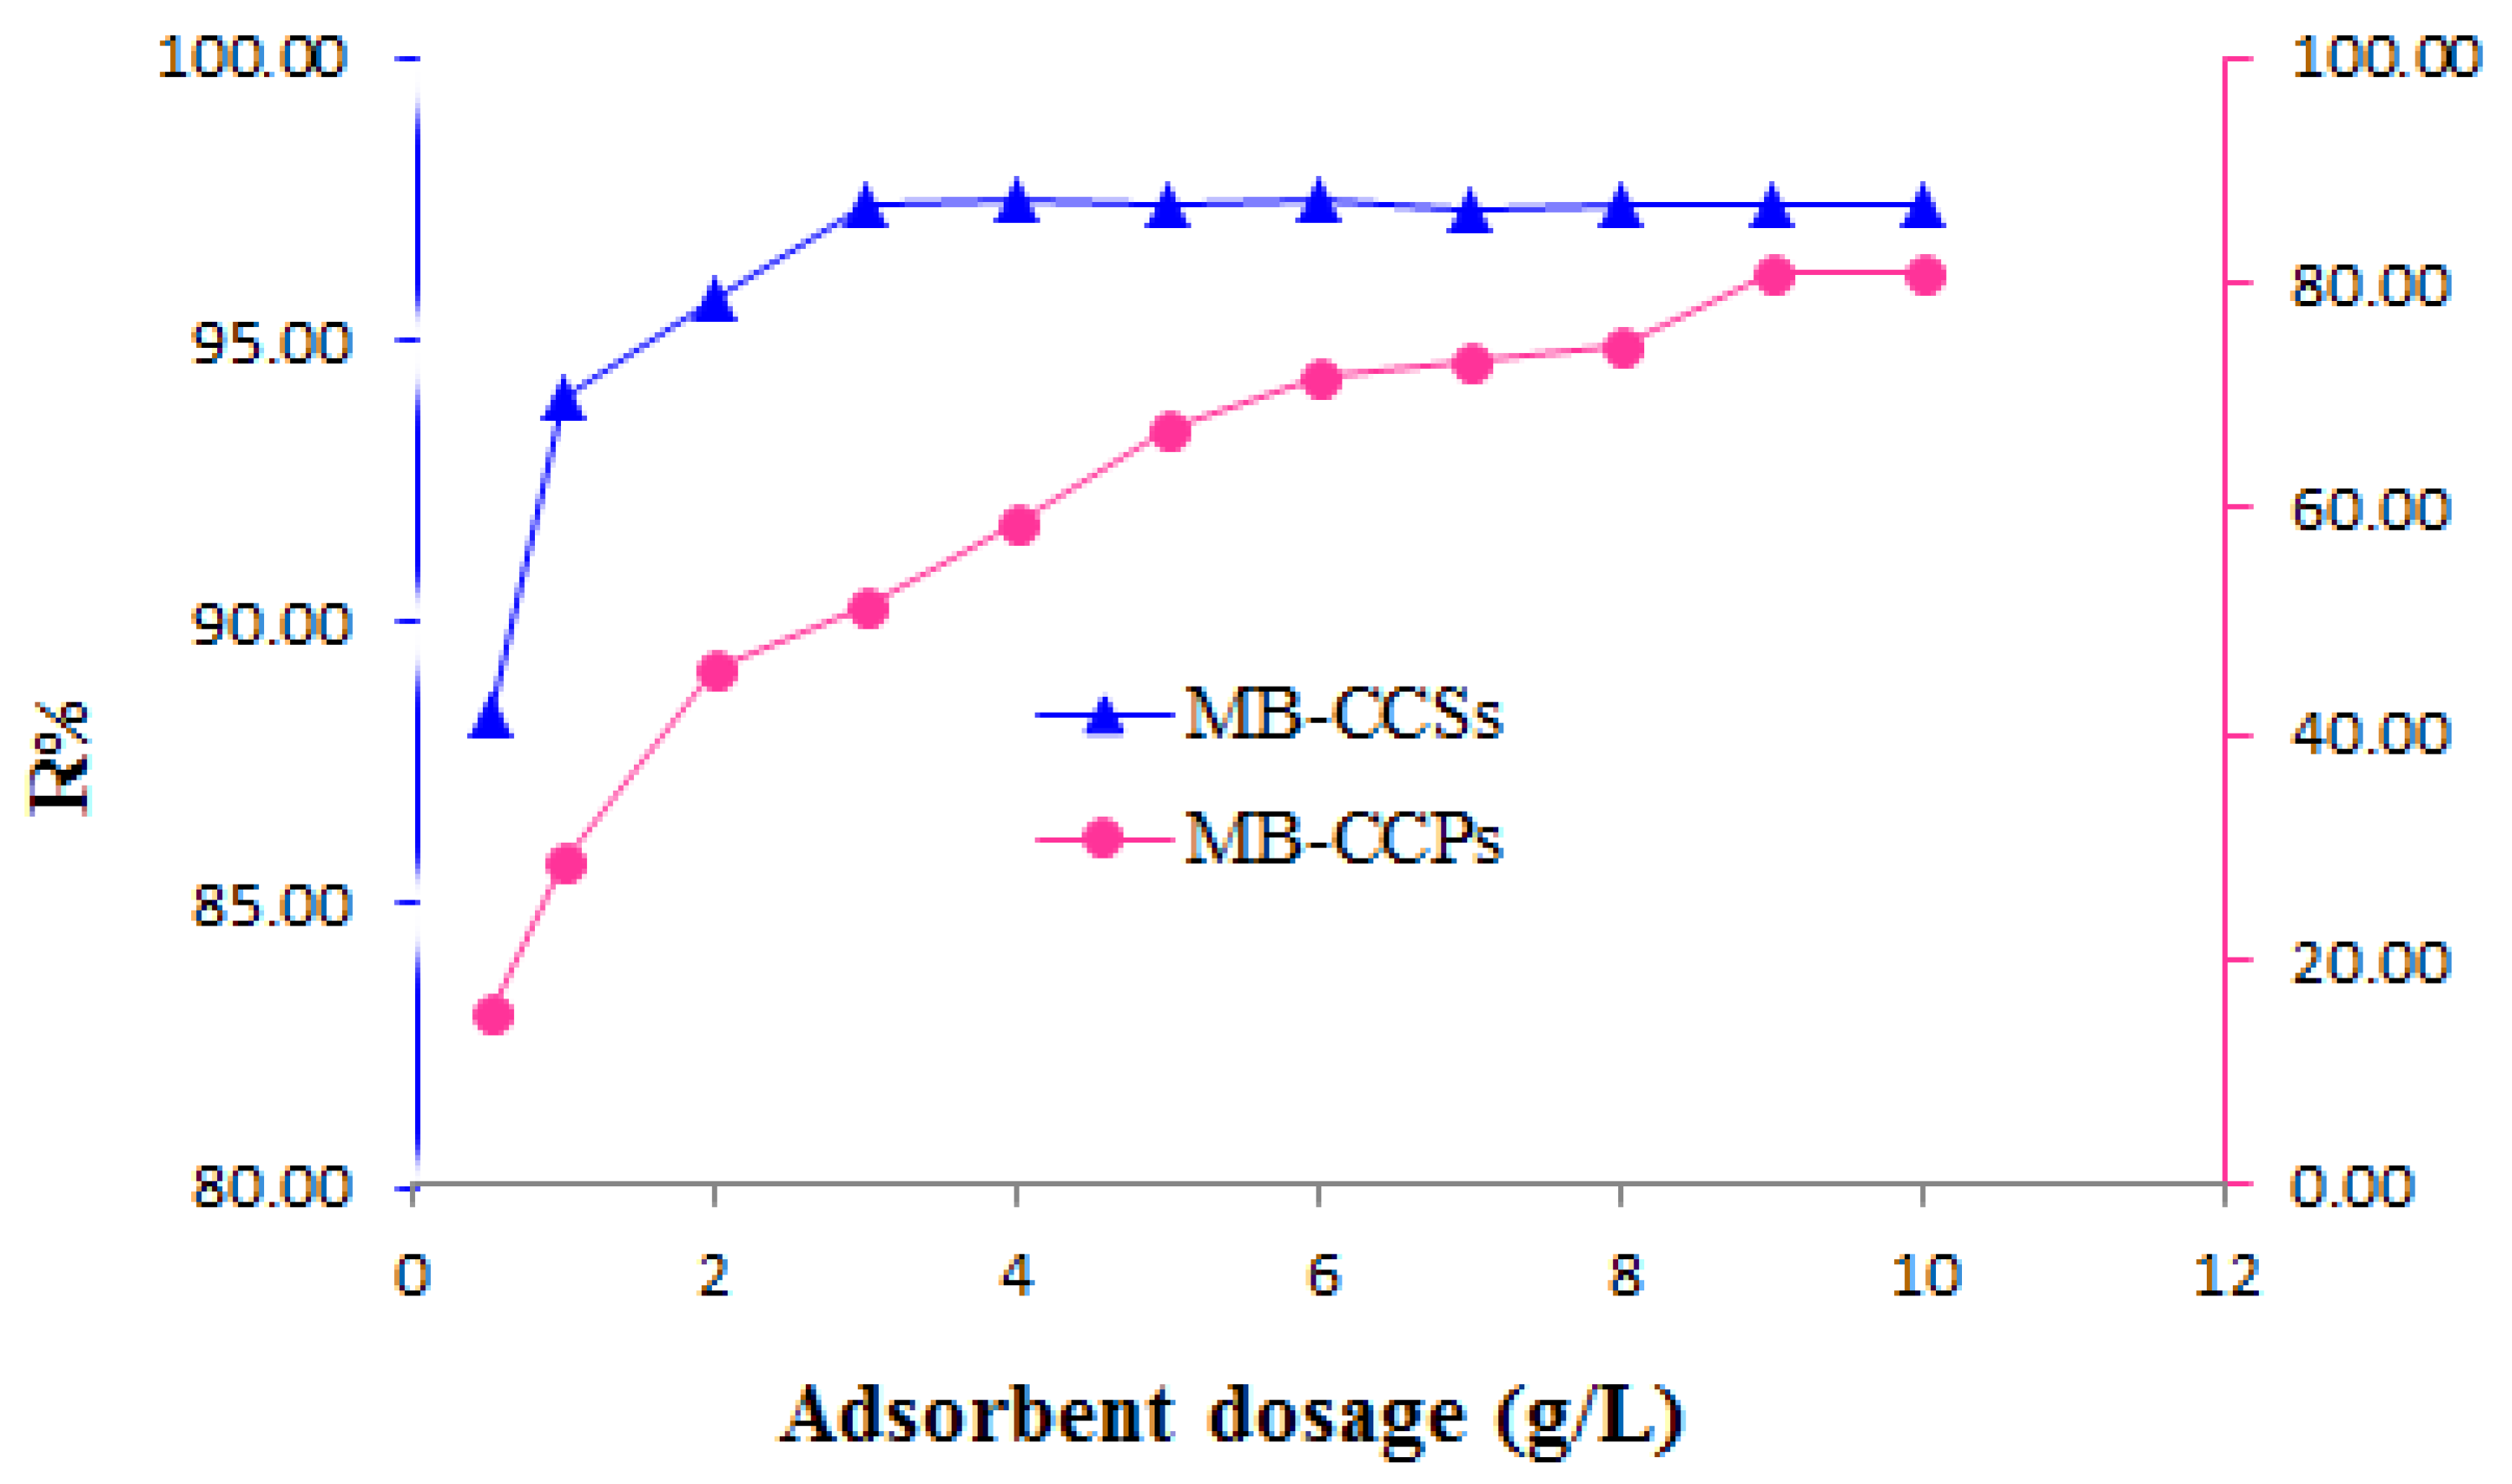
3.5. Effect of Adsorbent Dosage
The effect of CCSs and CCPs dosage on MB dye removal was examined under various doses, ranging from 0.5 to 10 g/L. The obtained results are portrayed in Figure 6. It is obvious that a rise in the dosage of both biosorbents resulted in an increase in the MB removal efficiency. This may be associated with the attainability of unfilled active binding sites over a greater adsorbent surface area [18,47]. The removal efficiency increased promptly from 88.34% to 97.38% as the CCSs dosage increased from 0.5 to 3 g/L, followed by insignificant changes in R% with further enhancement in CCSs dosage. The removal of MB dye using CCPs adsorbent increased with a slow pattern from 15.35% to 81.14% by varying the CCPs dose from 0.5 to 9 g/L. Thereafter, R% remained unchanged, despite the further increase in the CCPs dosage. Based on these observations, 3 g/L and 9 g/L were concluded as the optimum CCSs and CCPs dosages, respectively.
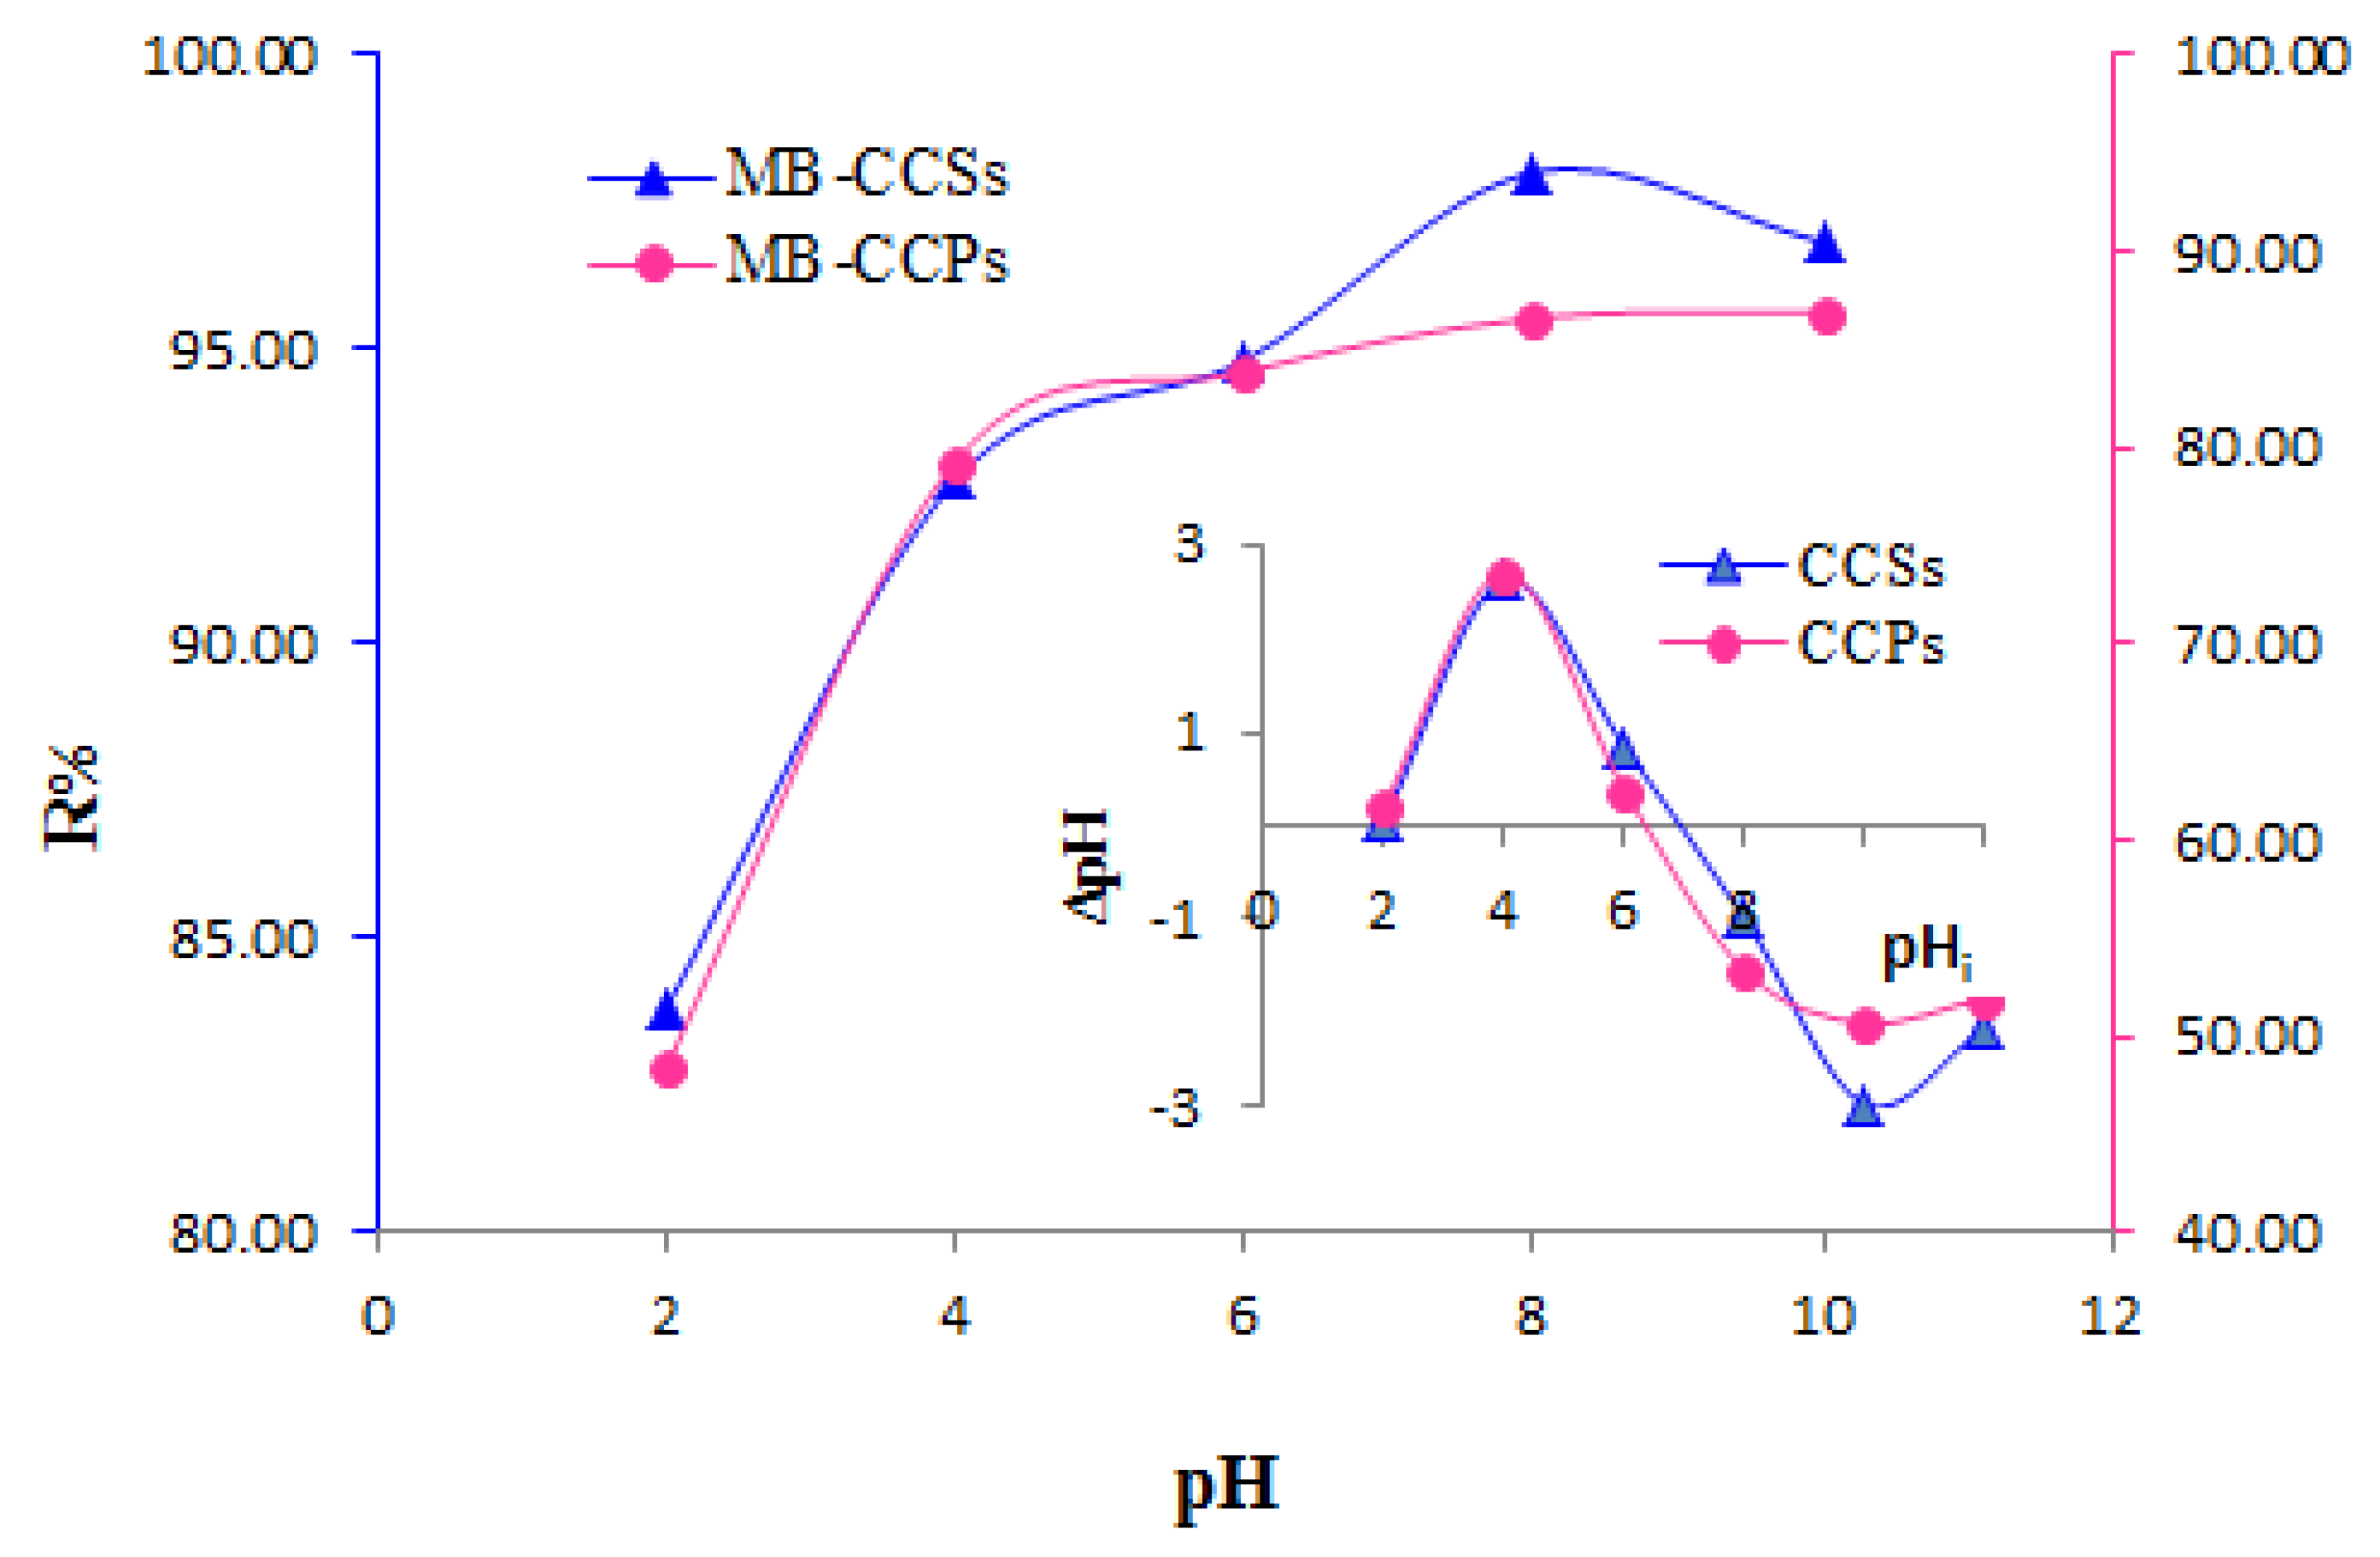
3.6. Effect of PH
Batch experiments were executed by changing the pH of solutions from 2 to 10, while other parameters were maintained constant. Figure 7 showed the dye removal efficiency variation versus the initial solution pH. The percent removal of MB on CCSs and CCPs increased significantly by increasing pH from 2 to 8 and thereafter, no considerable change in MB efficiency removal was observed for further increases in the solution pH. The lowest values of MB adsorptive elimination were observed at pH < 8 because of the repulsion between the positively charged surface of both biosorbents and the cationic dye [47]. Moreover, the lower sorption of MB dye in acidic media may be associated with the competition from excess H+ ions with the cationic dye for the binding sites [4,14]. MB dye removal efficiency under slightly alkaline conditions was found to be favorable. Indeed, at pH 8, the optimum values were 98.02% and 86.63% on CCSs and CCPs, respectively. This could be explained by the reduction in H+ ions on the free sites and the predominance of negative charges on the surface of the biosorbents, enhancing the electrostatic attraction between the negatively charged adsorbent particles and the cationic dye [47,48]. Therefore, all further experiments were carried out at initial pH = 8 for MB-CCSs and MB-CCPs adsorption experiments.
The impact of pH on the biosorption process could be interpreted based on pHPZC. The values of pHPZC were determined as 7 and 6.4 for CCSs and CCPs, respectively (Figure 7–inset). The surface of biosorbents is positively charged at pH < pHPZC, owing to the protonation in the presence of extra hydrogen ions, negatively charged at pH > pHPZC as a result of the deprotonation by the excess of OH− ions neutral at pH = PHPZC and [26]. Hence, the MB cationic dye should be adsorbed on a negatively charged biosorbent surface; in other terms, the pH of the medium should exceed pHPZC, which approves our selection of pH = 8 as the optimum value.
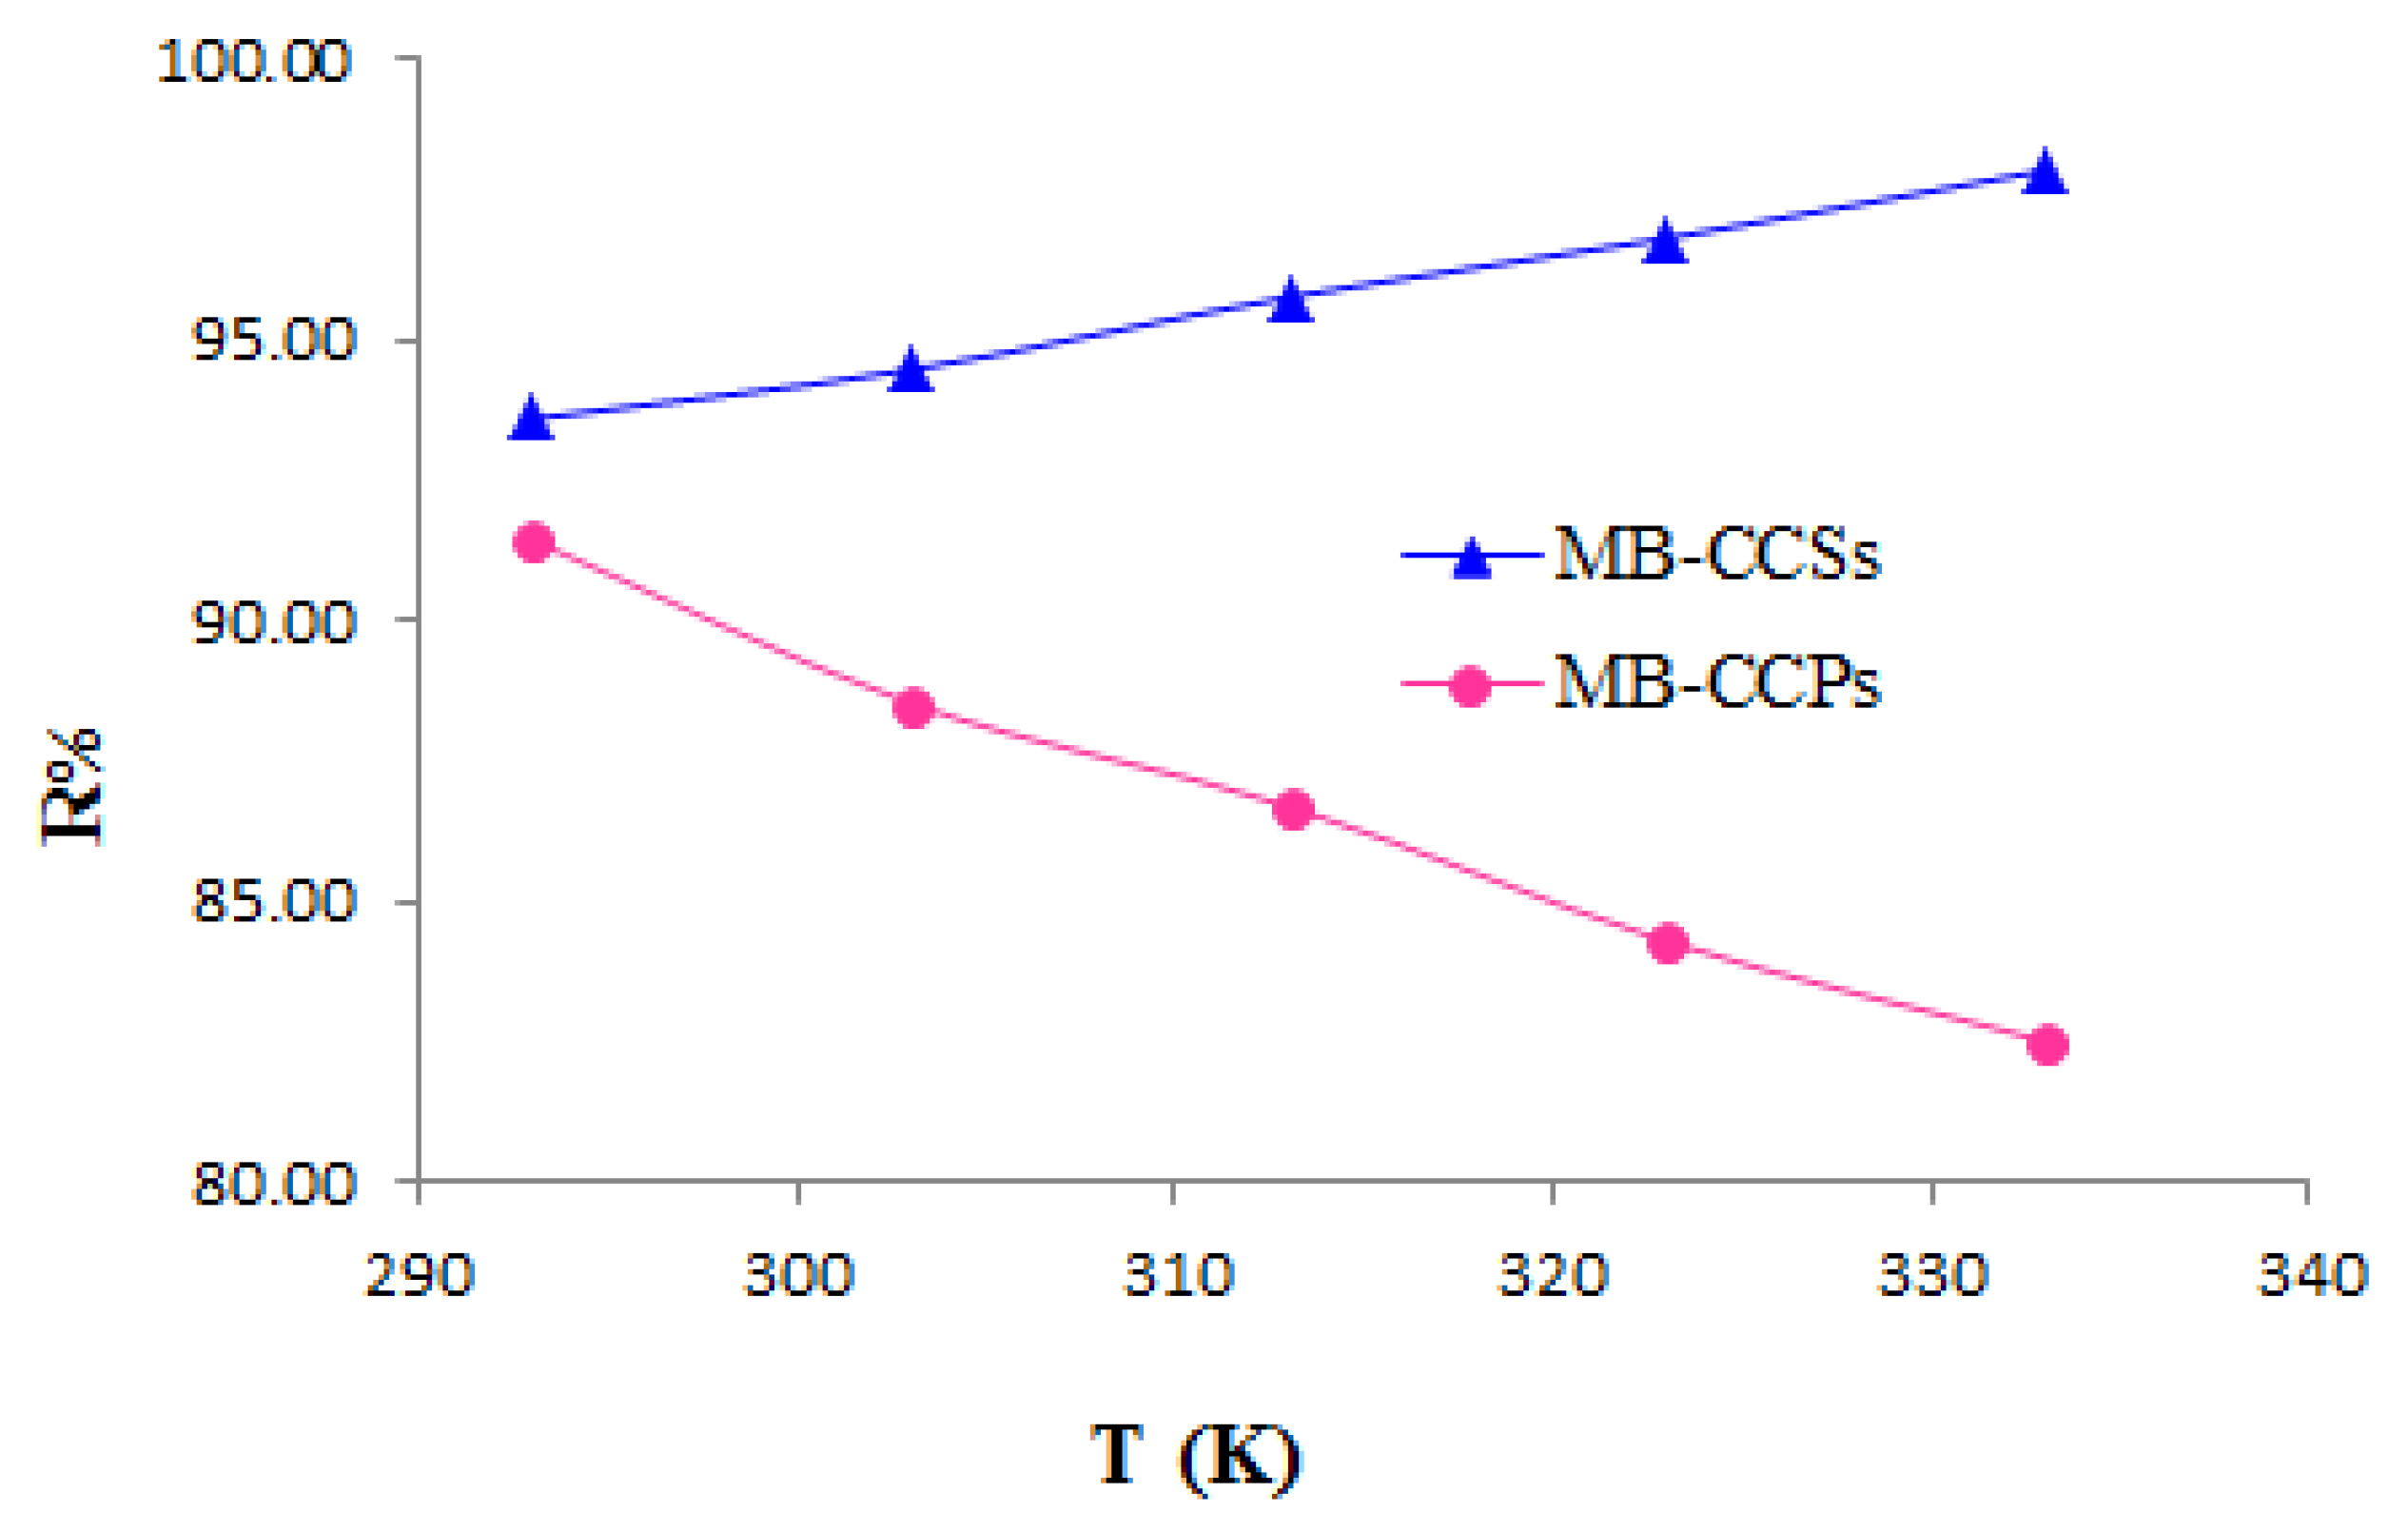
3.7. Impact of Temperature
The impact of temperature on the MB dye uptake percentage by CCSs and CCPs was investigated between 293 and 333 K. As shown in Figure 8, the MB percent uptake by CCSs was increased from 93.58 to 98.00% upon increasing the temperature, which is indicative of the nature of the endothermic process. This could be linked to the rise in the kinetic energy of MB dye ions, resulting in increasing the chemical interaction with the adsorbent surface as well as an enhancement in the diffusion rate of the adsorbate molecules on the adsorbent particles [13,14].
An adverse trend was detected for the uptake of MB by CCPs, which was decreased from 91.43% to 82.52%, suggesting the exothermic nature of the adsorption process. This could be attributable to the proneness of MB molecules to run away from the biosorbent surface to the aqueous solution upon increasing the temperature, or could be assignable to the bonds’ weakness between the biosorbent binding sites and the adsorbate molecules [11,41].
3.8. Isotherm Studies
Adsorption isotherms generally describe the nature of interactions between adsorbates and adsorbents by establishing the relationship linking the quantity of the dye adsorbed and the dye concentration remaining in the solution at equilibrium (qe and Ce respectively) at a constant temperature and pH to evaluate the adsorbents’ capacities [33].
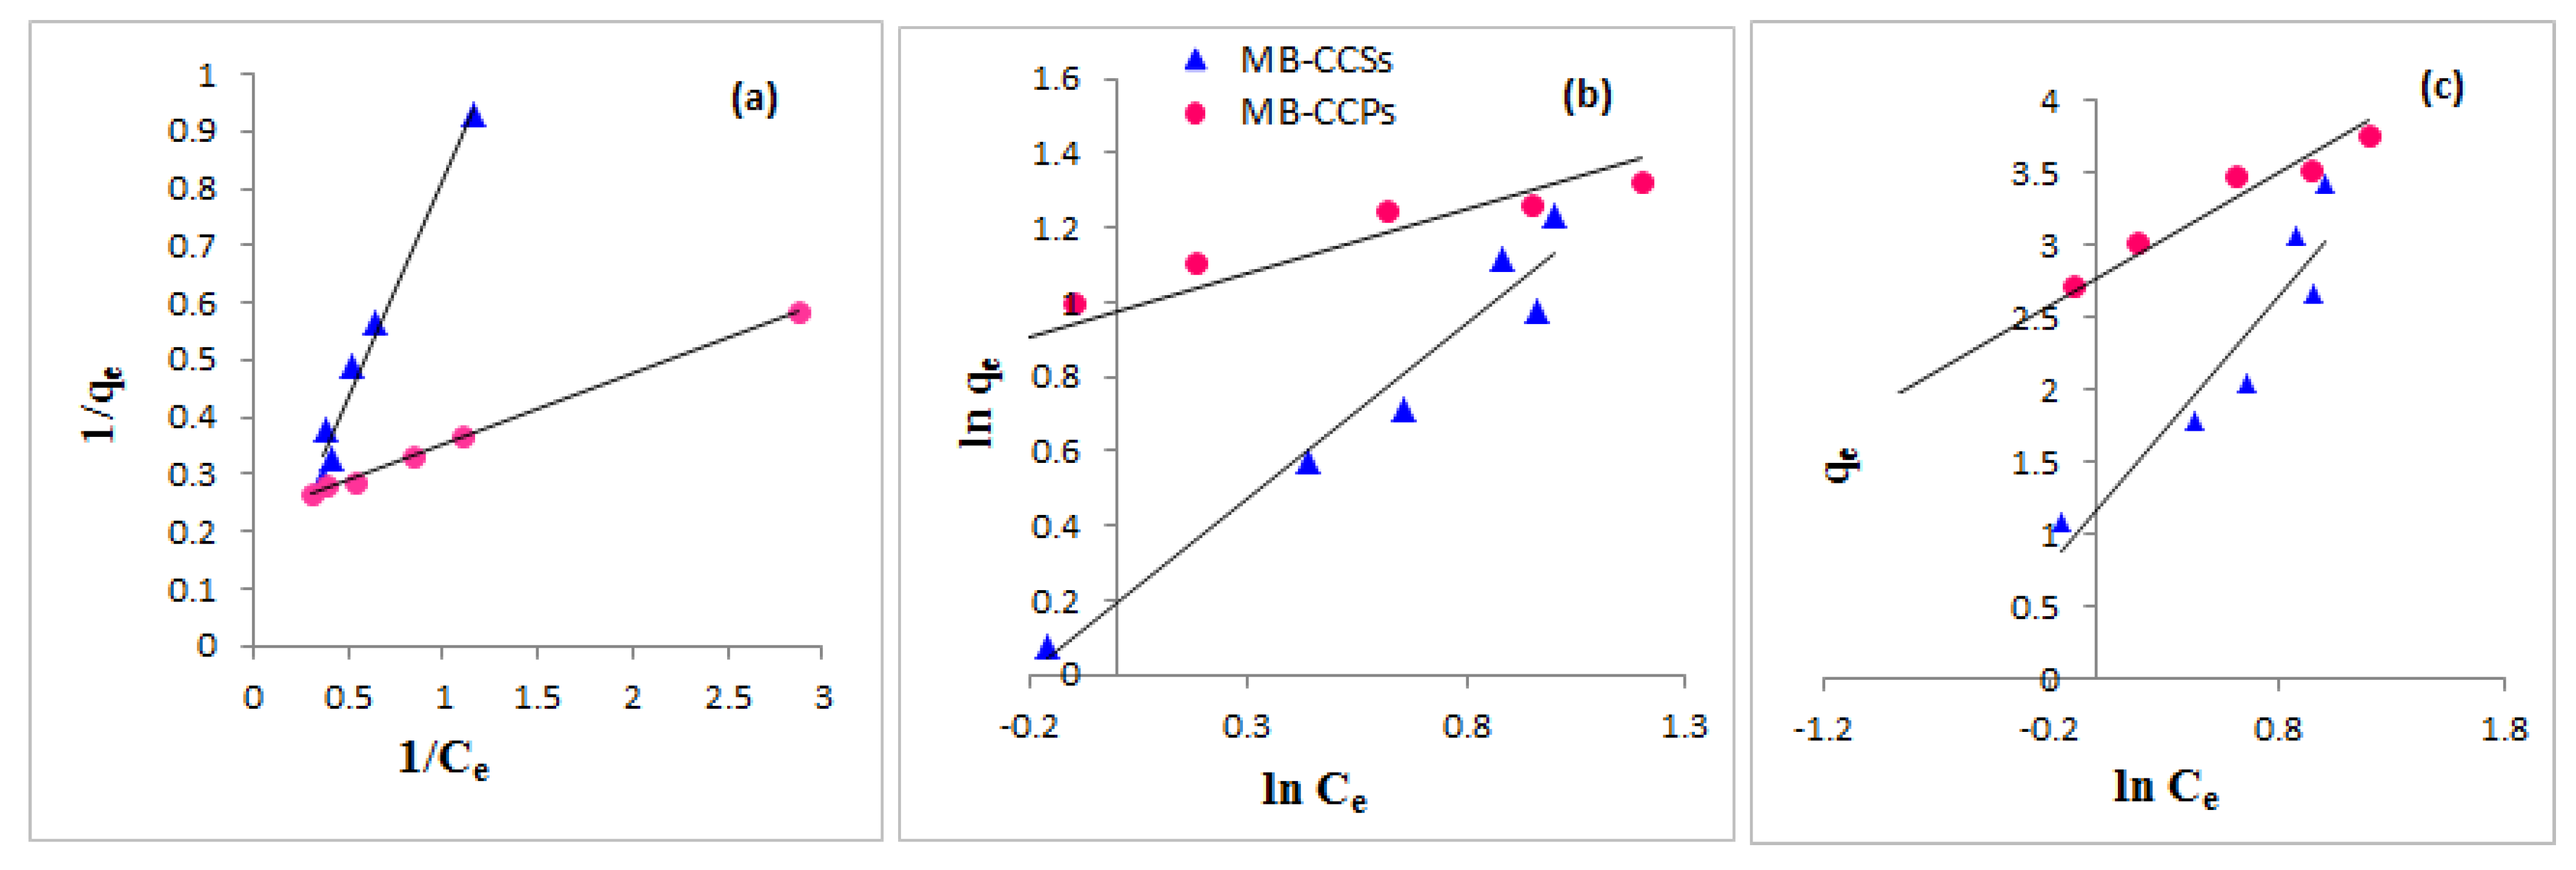
In this investigation, three isotherm models were adopted to analyze the equilibrium data of MB dye loaded onto CCSs and CCPs (Langmuir, Freundlich and Temkin). The isotherm parameters of each model were calculated from the intercept and the slope of the appropriate linear curves portrayed in Figure 9a-C; the values are listed in Table 3. The correlation coefficients are also given in Table 3 to confirm the applicability of the adsorption isotherm models.
By analyzing these results, it was noted that the Langmuir model presented the best fitness for MB-CCSs system pursued by the Freundlich model (R2 = 0.9753 and R2 = 0.9503 respectively). Unfortunately, the Temkin model is not well suited to the equilibrium data because of the moderate value (R2 = 0.8642). The fitness of both Langmuir and Freundlich isotherms implied that CCSs and CCPs may display monolayer coverage and an irregular surface [38]. The Langmuir model presented the best fitness for the MB-CCPs system followed by the Temkin model (R2 = 0.9982 and 0.9776, respectively). The Freundlich model could not fit well to the adsorption of MB onto CCPs based on the R2 value (0.9456). The high value of the Langmuir model correlation coefficient postulates that the adsorption process was monolayer, reversible at the homogenous adsorbent surface with no lateral interaction between the adsorbate molecules [33]. Furthermore, the Temkin model correlation coefficient was greater than 0.95, suggesting that electrostatic interactions describing a chemical process are involved in the adsorption mechanism between MB and CCPs [31].
The Freundlich constants Kf and n that represent the adsorption capacity and the strength of adsorption were estimated. The values of n were larger than 1 for both CCSs and CCPs, which indicates that the adsorption processes were favorable and followed the normal Langmuir isotherm [19,26]. The values of Kt and bt from the Temkin isotherm model were 20.884 L/mg and 2.682 kJ mol−1 for MB-CCPs, suggesting a strong interaction between the MB dye and the biosorbent surface, and that the sorption process is of a physio-Chemical nature [38,49]. The obtained values of RL listed in Table 4 varied between 0 and 1, suggesting the favorable MB biosorption on CCSs and CCPs.
The maximum monolayer biosorption capacities (qm) of Langmuir isotherms were equal to 18.832 and 4.480 mg g−1 for MB-CCSs and MB-CCPs, respectively. It is clear that CCSs was 4.2 times more efficient as a MB biosorbent than CCPs. On comparing the maximum adsorbed quantity of MB obtained in this study with other biosorbents reported in the literature (Table 5), it was clear that the biosorption capacity of CCSs was greater than those of six materials out of fifteen biosorbents and larger than that of activated carbon, while the adsorption capacity of CCPs was the lowest one.
3.9. Adsorption Kinetics
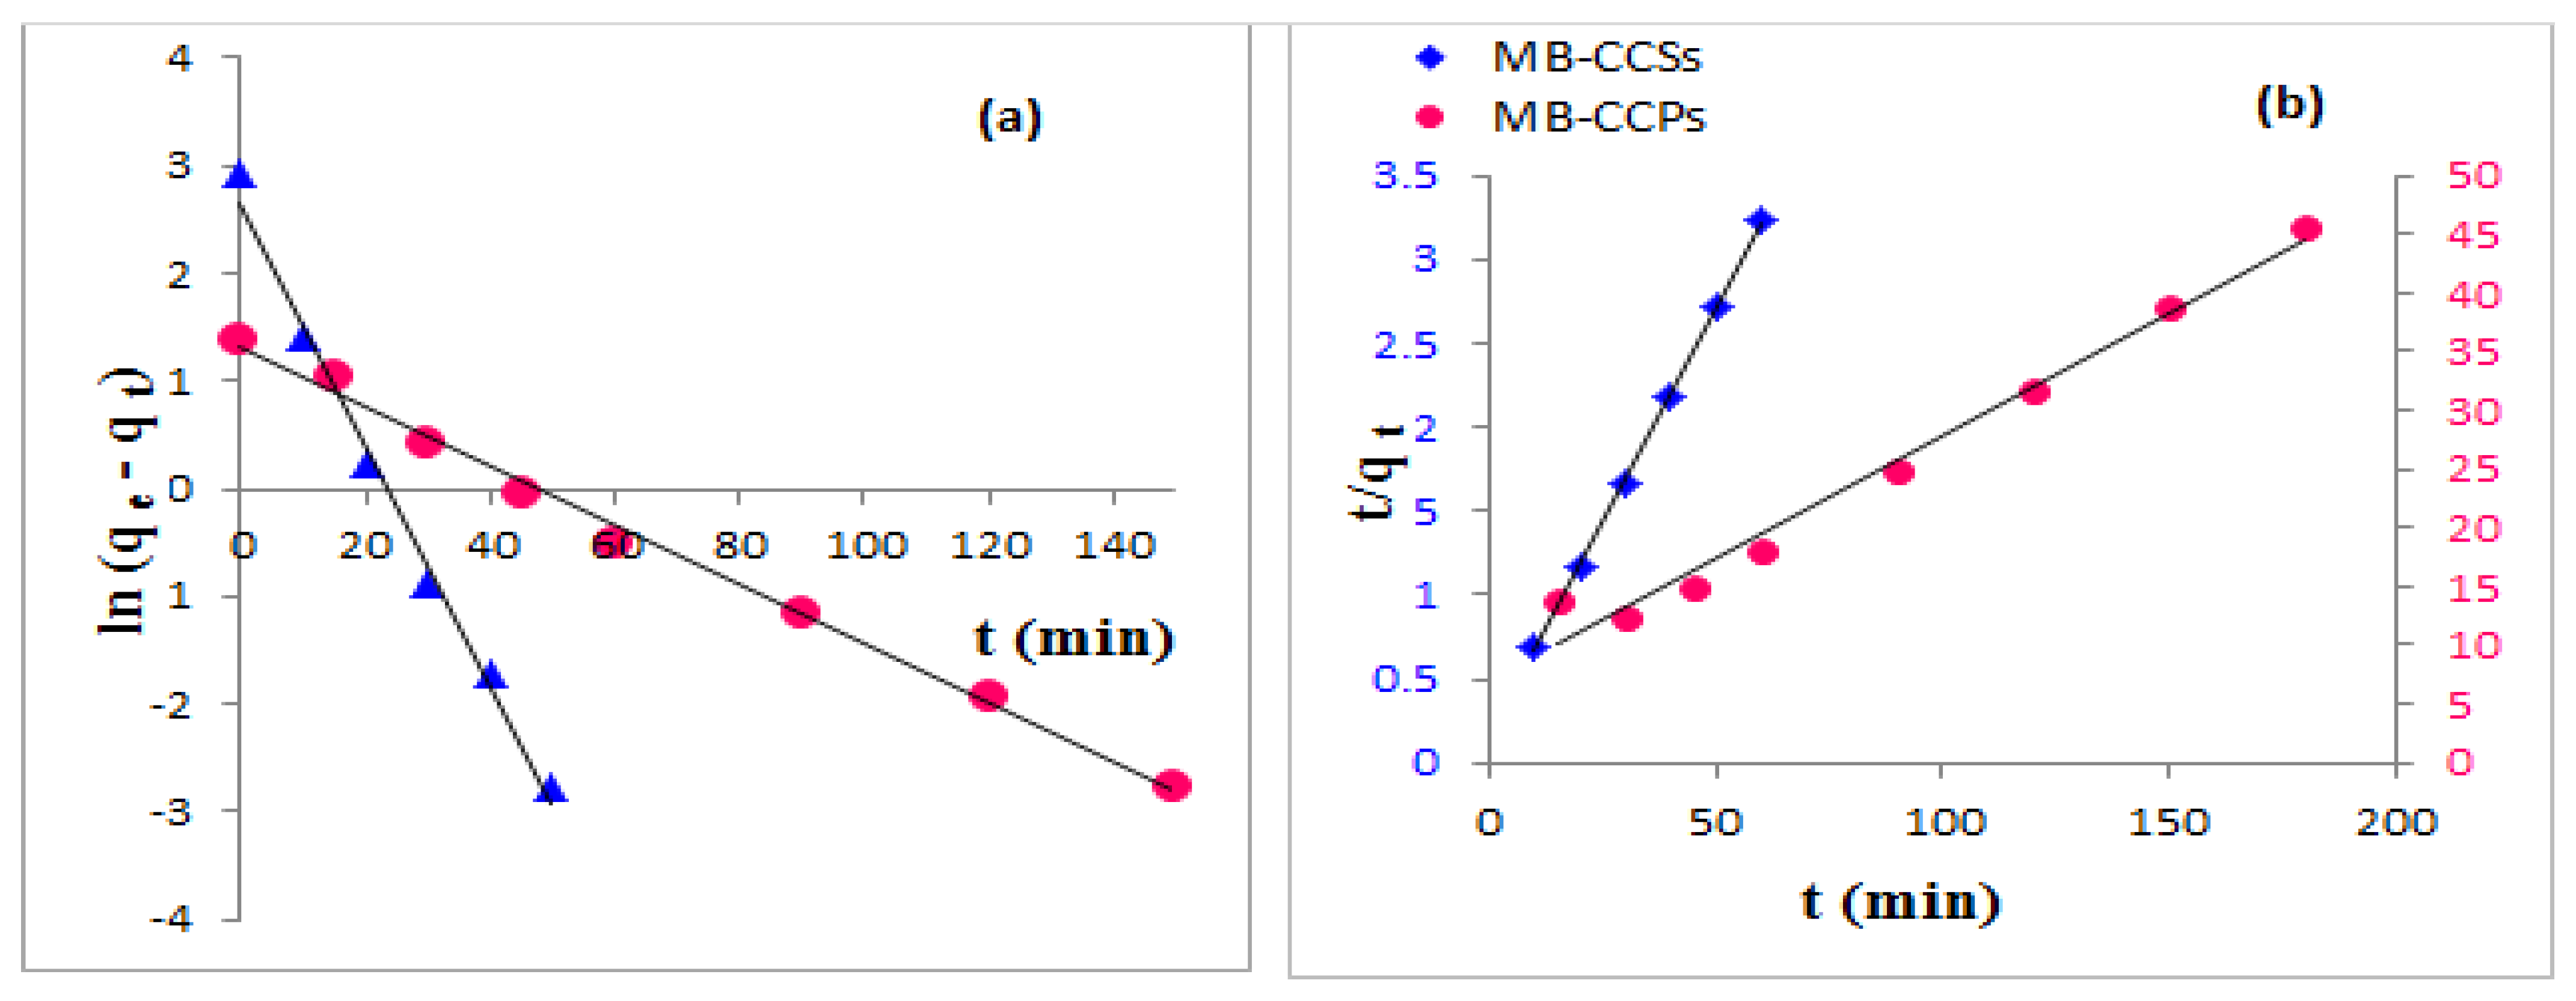
The investigation of adsorption kinetics is of remarkable importance for the determination of the equilibrium time and the rate of adsorption [62]. In this work, biosorption kinetics of MB dye was assessed, using pseudo-first and pseudo-second order models. The parameters of each model were calculated from the intercept and the slope of the appropriate linear curves shown in Figure 10a,b. These values are summarized in Table 6 in addition to the correlation coefficients in order to check the fitness of the kinetic models with the experimental data.
It was observed that the experimental data of MB adsorbed by CCSs fitted perfectly to the pseudo-second order (R2 = 0.9994) rather than pseudo-first order (R2 = 0.991). Moreover, there was only a small difference between qe,exp (18.832 mg g−1) and qe,cal (19.531 mg g−1), confirming the suitability of the pseudo-second order mechanism process, while the pseudo-first order was the model that best fitted the experimental data of MB sorption by CCPs, which was due to the high value of R2 (0.9947), compared to pseudo-second-order (R2 = 0.9803). Kinetic data results revealed that the MB adsorption by CCSs and CCPs followed chemisorption and physisorption, respectively [63].
3.10. Thermodynamic Studies
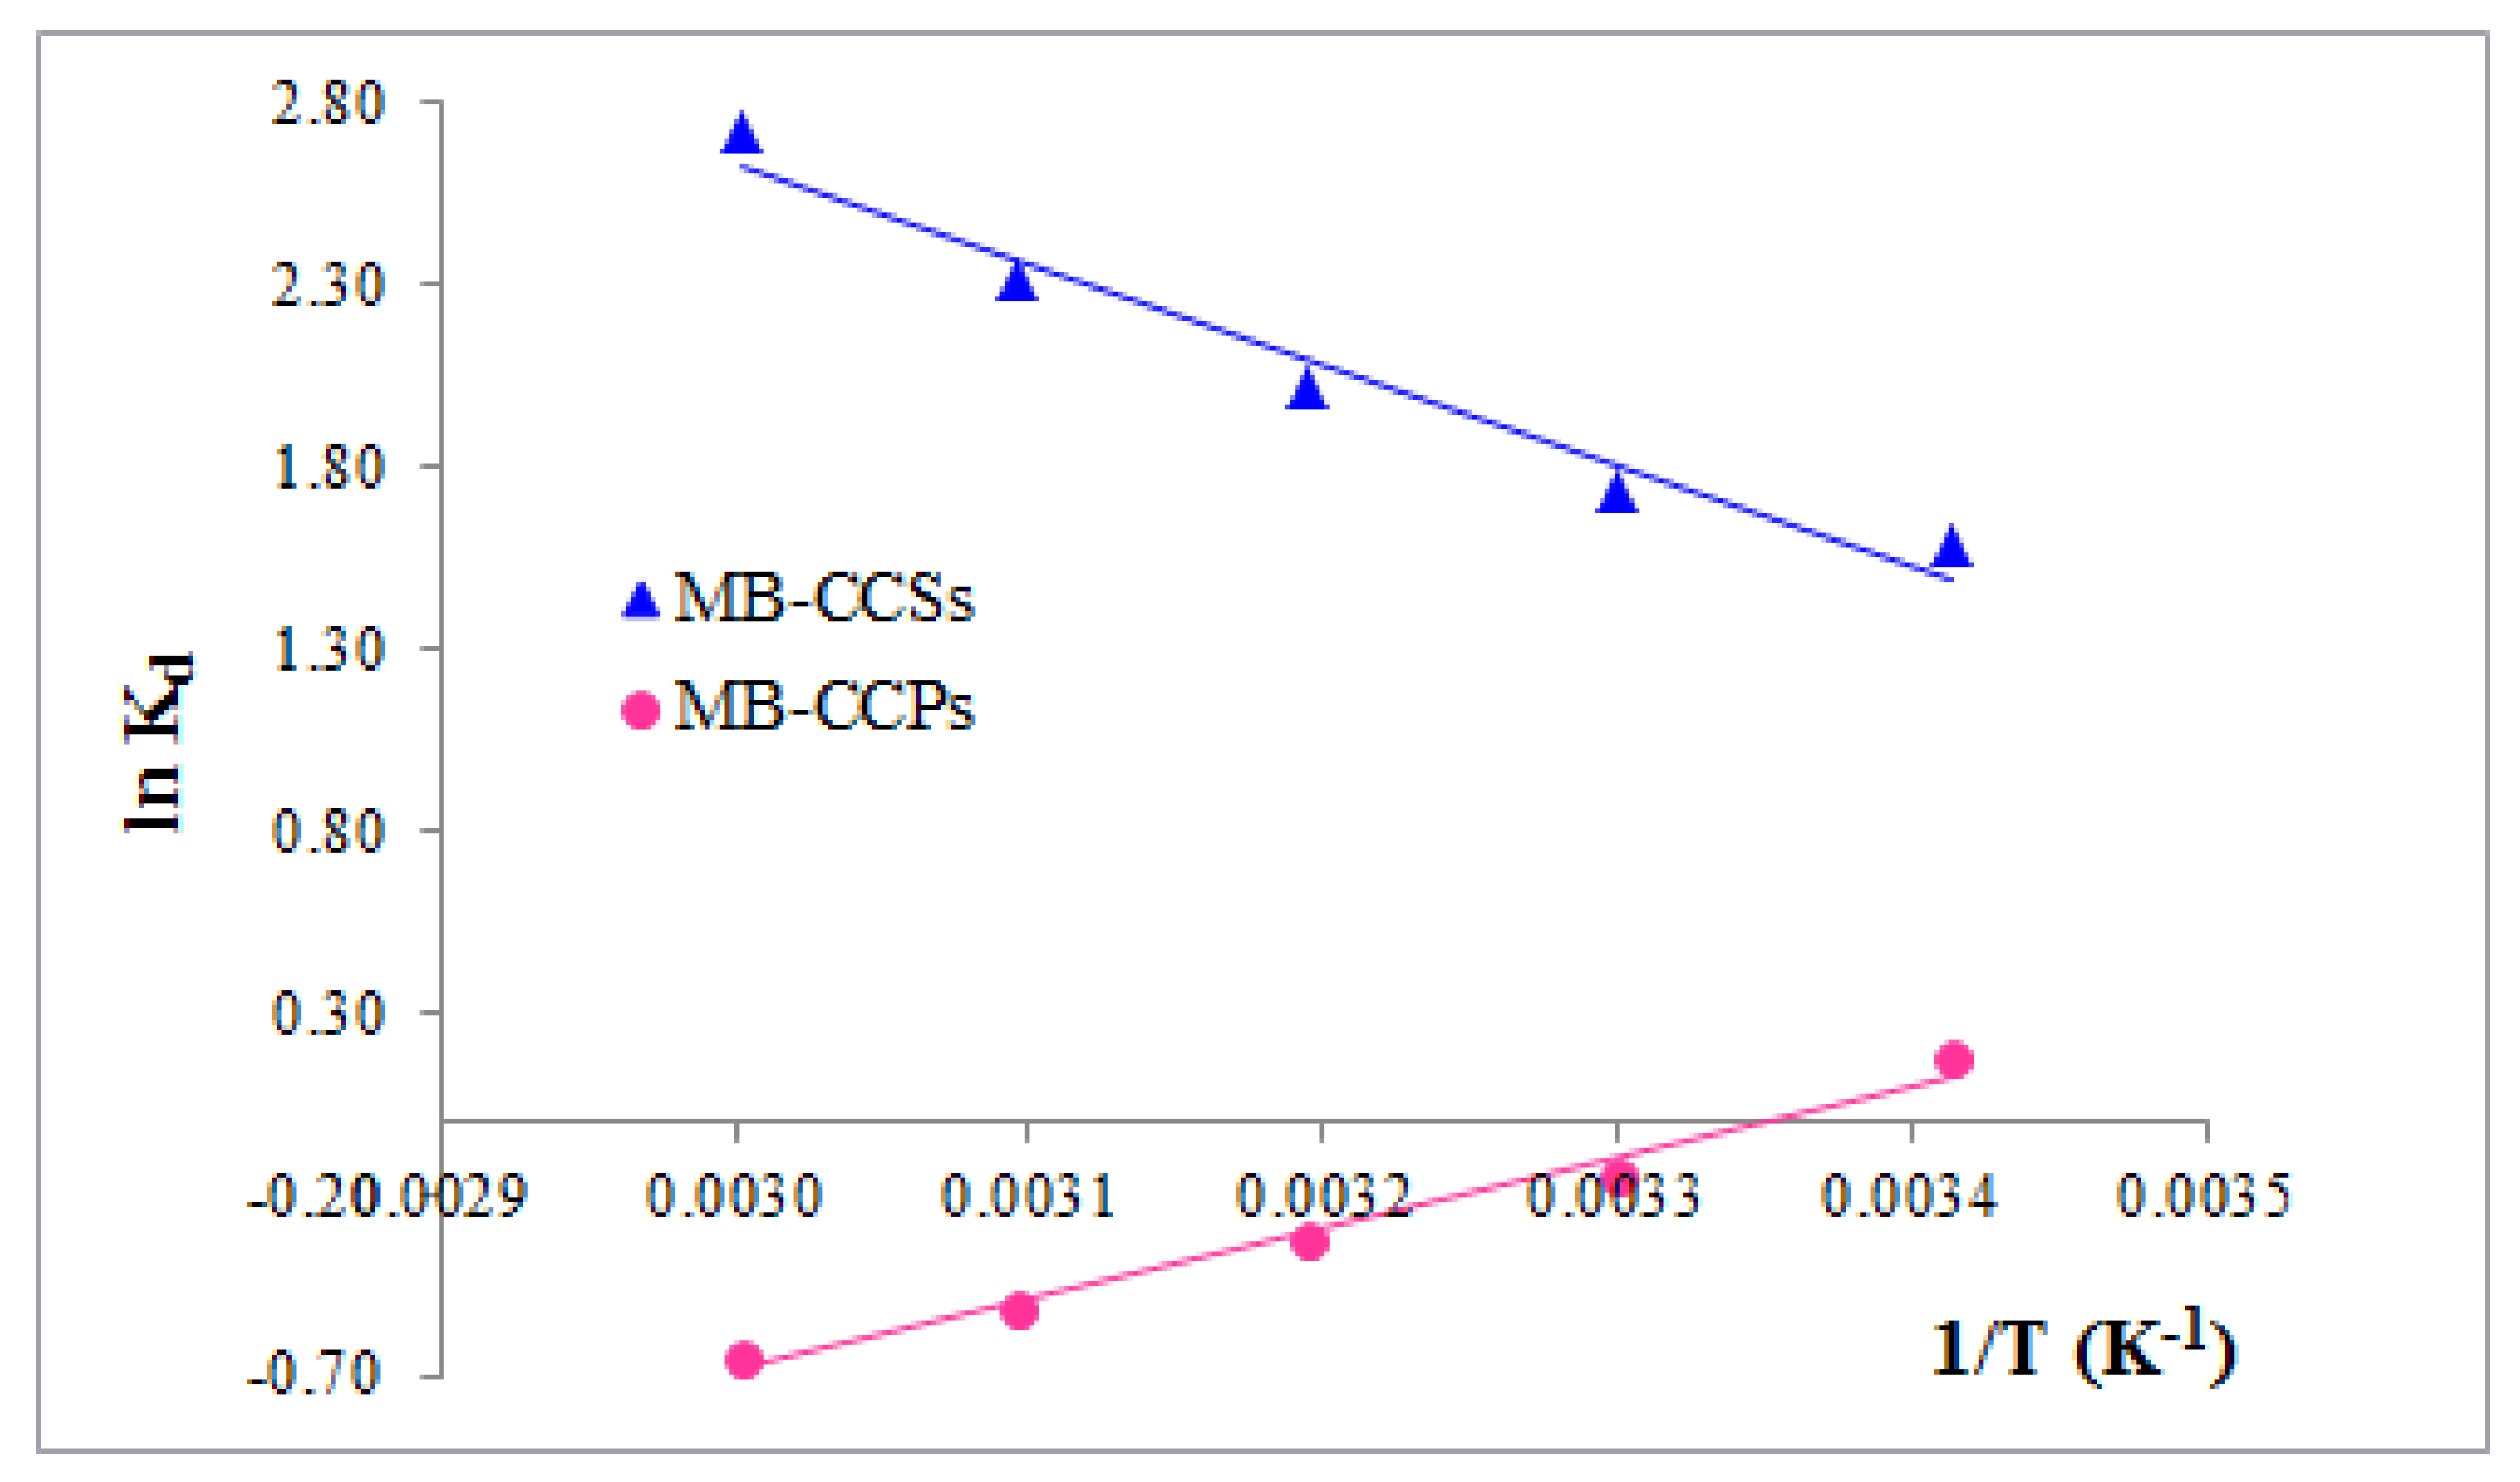
Thermodynamic studies are useful for the estimation of the feasibility and the adsorption process nature. Hence, the thermodynamic parameters were calculated by examining the impact of temperature on the biosorption processes under optimum conditions. The values of ΔHº and ΔSº were deduced from the slope and the intercept of the linear plot of Van’t Hoff, i.e., ln Kd versus 1/T, and were further used to calculate ΔGº at a given temperature. The mentioned plots are presented in Figure 11 and the estimated thermodynamic parameters are outlined in Table 7.
The negative values of ΔGº in the temperature range 293–333 K are indicative of the spontaneity and the feasibility of the biosorption of MB onto CCSs. These values decreased when temperature increased, indicating that adsorption is favored at high temperature values [17]. The positive value of ΔHº (23.09 kJ mol−1) indicated that MB biosorption by CCSs is an endothermic and chemical process [48]. The positive value of ΔSº is an indication of the increase in disorder at the solid–liquid interface during the adsorption process, which could be associated with structural modifications of MB molecules and the adsorbent surface during the process [28]. The biosorption process is likely to take place spontaneously at any temperature since ΔHº > 0 and ΔSº > 0 [13].
MB dye adsorption by CCPs was favorable at a normal temperature and was nonspontaneous at higher temperatures, as the only negative value of ΔGº was obtained at 293 K, and it was observed that ΔGº increased positively between 303 and 333 K. The negative value of ΔHº shores up the exothermic comportment of the adsorption process. The negative value ΔSº suggests the decline of disorder at the solid/solution interface during the biosorption process, resulting in decreasing the adsorption capacity because of dye molecules escaping from the biosorbents [19].
3.11. Adsorption Mechanism
The results of the different parameters, physical characterization, kinetic and isotherm modeling were adopted to understand the adsorption mechanism. Based on the obtained results, MB biosorption onto CCSs and CCPs was found to be a complicated process involving different types of interactions. The removal of MB by CCSs and CCPs was rapid at the first stage and then reached an equilibrium. The MB uptake by CCSs could be considered a physicochemical process since the MB biosorption by CCSs follows pseudo-second order, which suggests that chemisorption interactions play a crucial role in this operation. It is best suited by Langmuir and Freundlich models, indicating a physisorption process, while the pseudo-first order best fits the biosorption of MB by CCPs, suggesting that physical interactions play a fundamental role in the MB-CCPs adsorption process, while electrostatic interactions are also involved between MB and CCPs since the Temkin model was well applicable (R2 > 0.95).
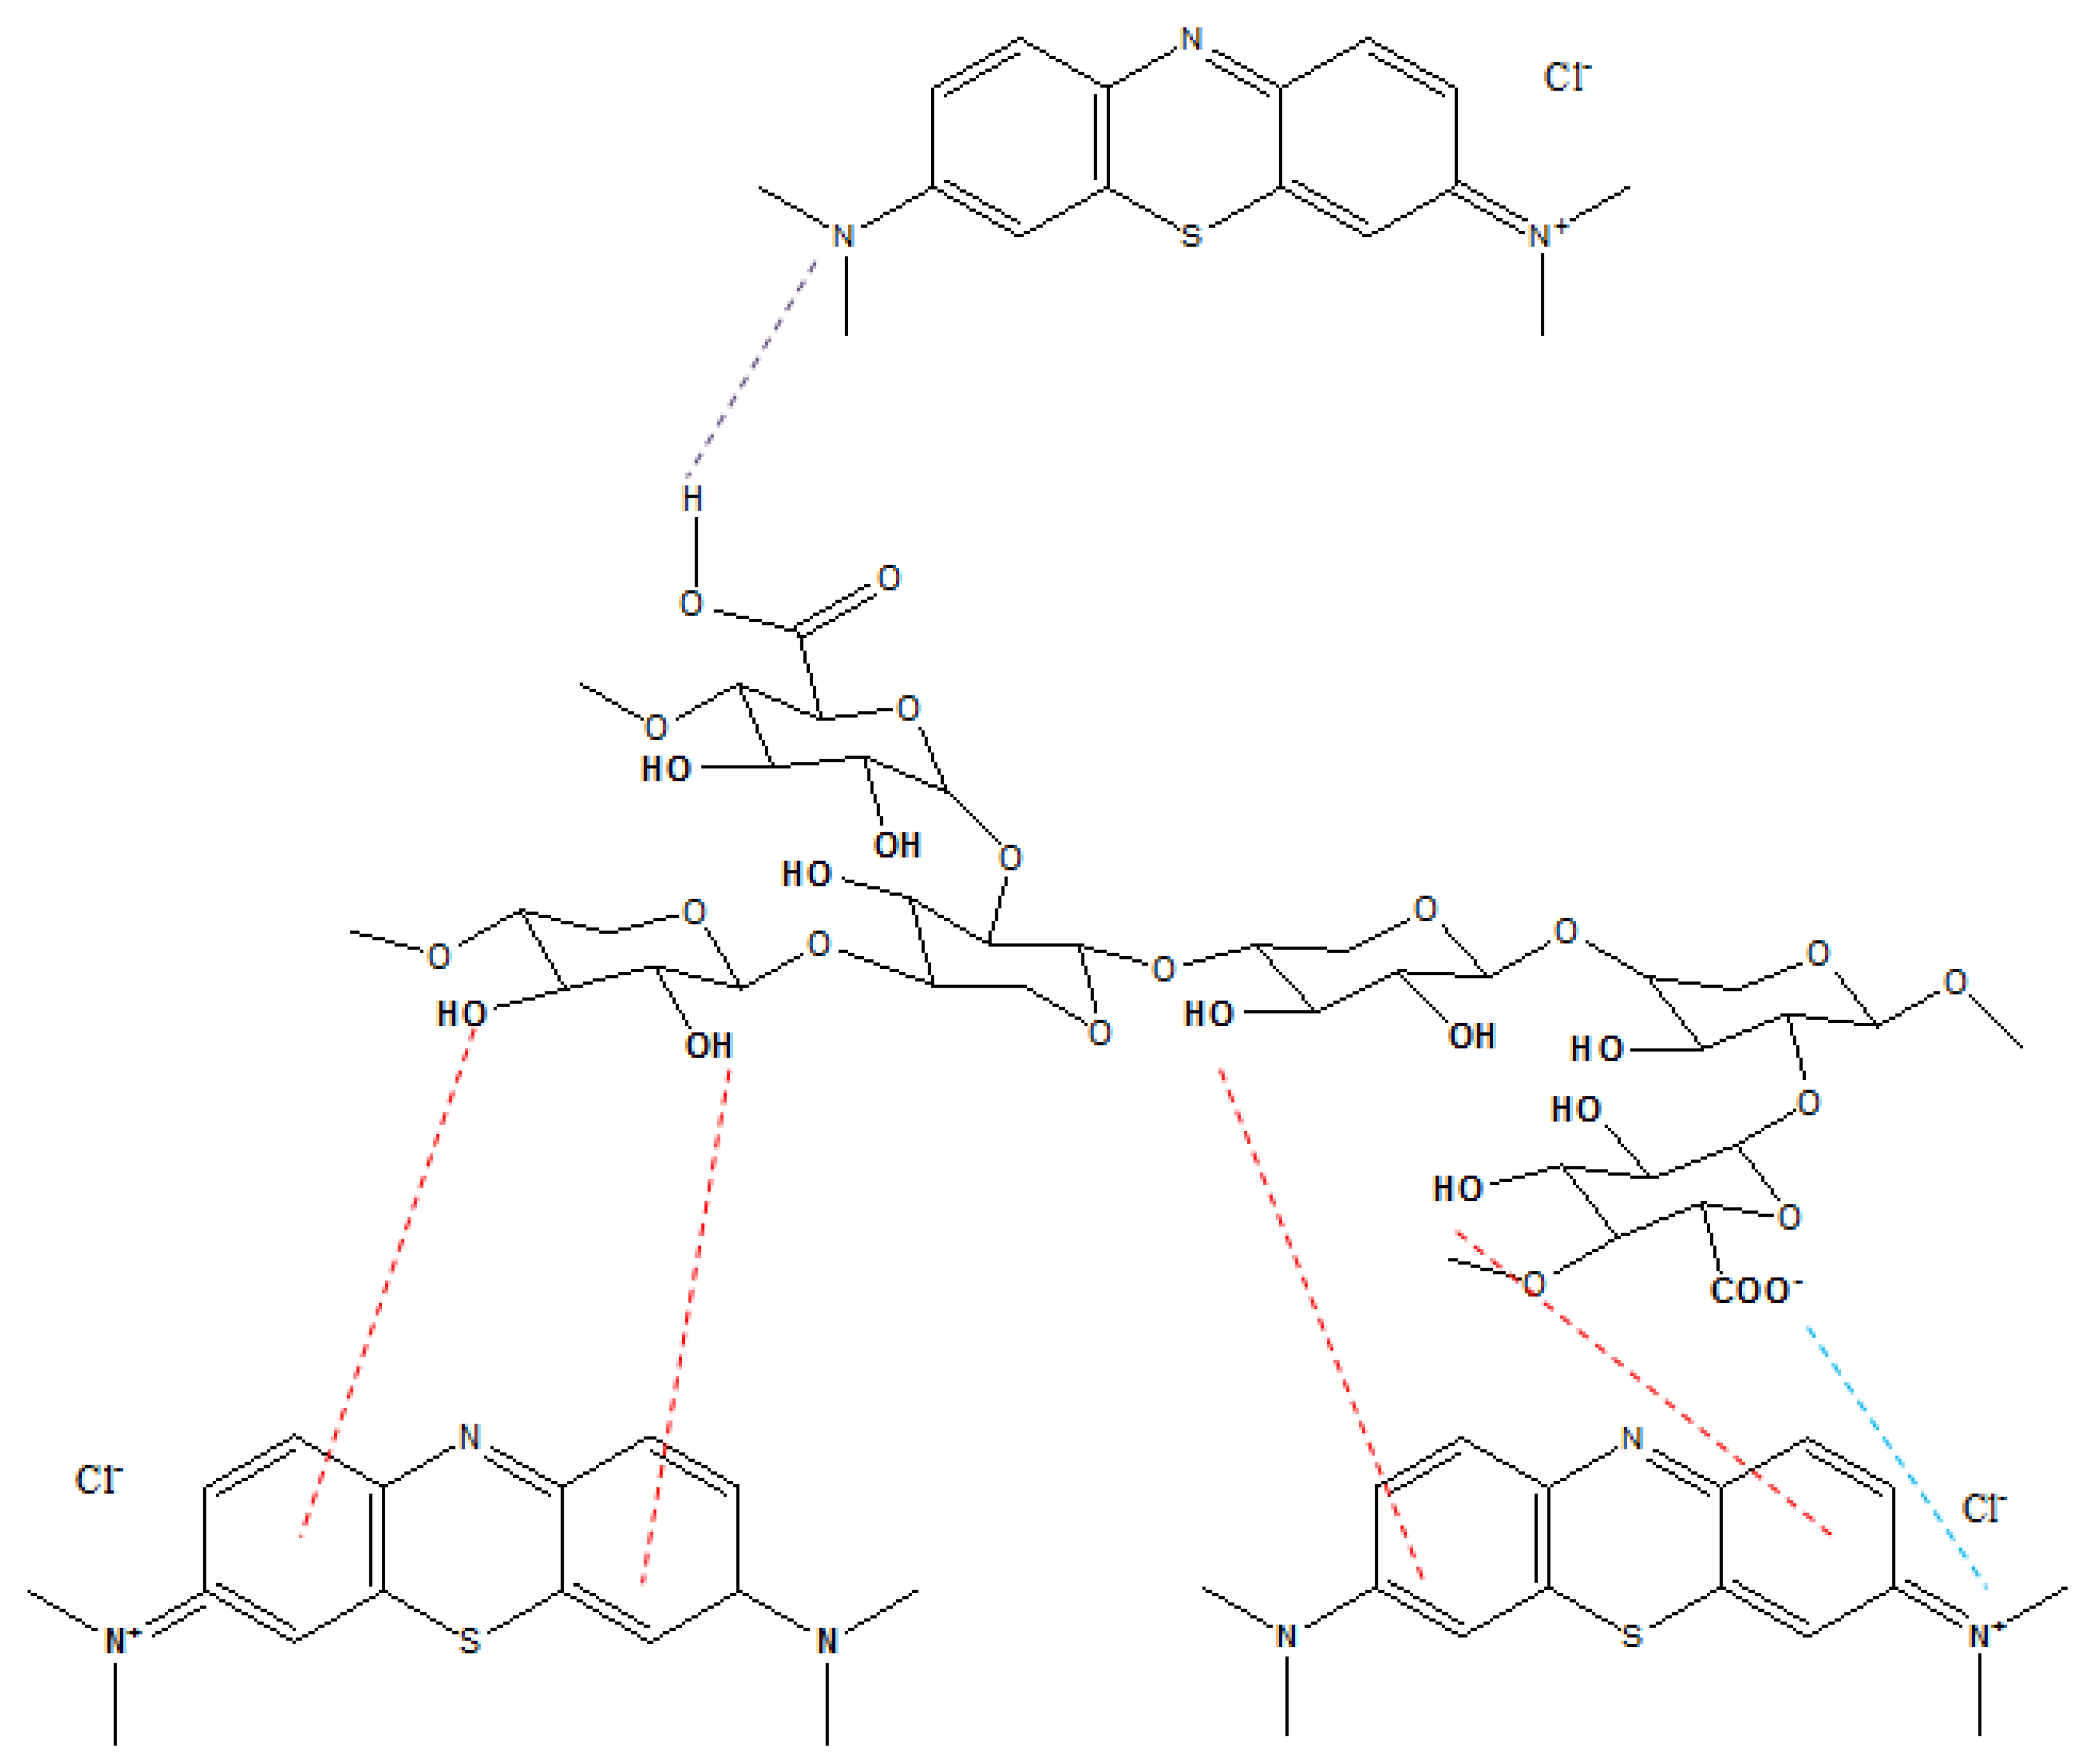
The effect of pH on MB loading is another indicator on the importance of electrostatic interaction between the dye and biosorbents. Indeed, it was found that the electrostatic interaction between the cationic MB dye dissociated into MB+ and Cl− groups and adsorbents increased at pH > pHPZC since the biosorbents’ surface became more negatively charged. At the surface, the carboxylic groups were deprotonated and the carboxylate anions (-COO−) were electrostatically attracted to the positively charged quaternary ammonium group of MB cationic dye [40]. Furthermore, dipole–dipole hydrogen bonds might be formed between hydroxyl groups acting as proton donors on the surface of the biosorbents and nitrogen atom acting as proton acceptors in the MB dye [64]. The n–π interactions could be formed between oxygen atoms in the carbonyl groups (electron donors) of the biosorbent surface and aromatic rings (electron acceptors) in the MB dye [19]. This mechanism is supported by the FT-IR results, which revealed that the intensity of the IR bands of the above-named functional groups decreased after MB adsorption. Accordingly, organic functional groups of CCSs and CCPs played a significant role in the MB biosorption. Hence, the adsorption of MB onto CCSs and CCPs could occur via three possible mechanisms, viz. hydrogen bonding, n–π interactions and electrostatic attraction, which prove that physisorption and/or chemisorption could be involved in the biosorption process. All these interactions are shown in Figure 12.
4. Conclusions
MB dye adsorption onto CCSs and CCPs was studied concerning equilibrium, kinetics and isotherms. Batch experiments were used to determine the effect of different parameters on the MB removal efficiency. The results indicated that all parameters affected significantly the adsorption process. Maximum removal percentage was achieved, using 6 mg/L of MB dye, 3 g/L of adsorbent at 60 min and 333 K for CCSs and using 4 mg/L of MB dye, 9 g/L of adsorbent at 180 min and 293 K for CCPs under alkaline conditions. Under optimum conditions, 98.00% and 91.43% of MB removal was reached, using CCSs and CCPs, respectively. Kinetic studies revealed that biodsorption of MB by CCSs follows pseudo-second order, while MB biosorption onto CCPs is well described by pseudo-first order, suggesting chemisorption and physisorption processes, respectively. The equilibrium data fitted well with Langmuir and Freundlich models, indicating monolayer coverage at the heterogeneous surface for the MB-CCSs system, while Langmuir and Temkin models for MB-CCPs suggest that the adsorption process was monolayer and reversible at the homogenous adsorbent surface. MB maximum adsorption by CCSs was found to be 18.832 mg g−1, which is considered relatively high, compared with many biosorbents, while MB maximum adsorption by CCPs was 4.480 mg g−1. The thermodynamic results revealed that the biosorption process using CCSs was endothermic, feasible, spontaneous at any temperature and favorable at higher temperature values with increasing the randomness at the solid–liquid interface, while the adsorption process using CCPs was exothermic and spontaneous only at a normal temperature of 293 K with decreasing the randomness at the solid–liquid interface of the adsorbent
Author Contributions
Conceptualization, methodology, W.M.A. and I.E.M.; formal analysis, software, resources, writing—original draft preparation, W.M.A.; validation, investigation, data curation, visualization, supervision, writing—review and editing, I.E.M. All authors have read and agreed to the published version of the manuscript.
Funding
Not applicable.
Institutional Review Board Statement
Not applicable.
Informed Consent Statement
Not applicable.
Data Availability Statement
Data are contained within the article.
Conflicts of Interest
The authors declare no conflict of interest.
References
- Tan, K.B.; Vakili, M.; Horri, B.A.; Poh, P.E.; Abdullah, A.Z.; Salamatinia, B. Adsorption of dyes by nanomaterials: Recent developments and adsorption mechanisms. Sep. Purif. Technol. 2015, 150, 229–242. [Google Scholar] [CrossRef]
- Wahlström, N.; Steinhagen, S.; Toth, G.; Pavia, H.; Edlund, U. Ulvan dialdehyde-gelatin hydrogels for removal of heavy metals and methylene blue from aqueous solution. Carbohydr. Polym. 2020, 249, 116841. [Google Scholar] [CrossRef] [PubMed]
- Bhatia, D.; Sharma, N.R.; Singh, J.; Kanwar, R.S. Biological methods for textile dye removal from wastewater: A review. Crit. Rev. Environ. Sci. Technol. 2017, 47, 1836–1876. [Google Scholar] [CrossRef]
- Kuang, Y.; Zhang, X.; Zhou, S. Adsorption of Methylene Blue in Water onto Activated Carbon by Surfactant Modification. Water 2020, 12, 587. [Google Scholar] [CrossRef] [Green Version]
- Chikri, R.; Elhadiri, N.; Benchanaa, M.; El Maguana, Y. Efficiency of Sawdust as Low-Cost Adsorbent for Dyes Removal. J. Chem. 2020, 2020, 8813420. [Google Scholar] [CrossRef]
- De Gisi, S.; Lofrano, G.; Grassi, M.; Notarnicola, M. Characteristics and adsorption capacities of low-cost sorbents for wastewater treatment: A review. Sustain. Mater. Technol. 2016, 9, 10–40. [Google Scholar] [CrossRef] [Green Version]
- Katheresan, V.; Kansedo, J.; Lau, S.Y. Efficiency of various recent wastewater dye removal methods: A review. J. Environ. Chem. Eng. 2018, 6, 4676–4697. [Google Scholar] [CrossRef]
- Holkar, C.; Jadhav, A.; Pinjari, D.V.; Mahamuni, N.M.; Pandit, A.B. A critical review on textile wastewater treatments: Possible approaches. J. Environ. Manag. 2016, 182, 351–366. [Google Scholar] [CrossRef]
- Saini, R.D. Textile Organic Dyes: Polluting effects and Elimination Methods from Textile Waste Water. Int. J. Chem. Eng. Res. 2017, 9, 121–136. [Google Scholar]
- Oyelude, E.O.; Owusu, U.R. Adsorption of Methylene blue from aqueous solution using acid modified Calotropis procera leaf powder. J. Appl. Sci. Environ. Sanit. 2011, 6, 477–484. [Google Scholar]
- Das, P.; Chakraborty, S.; Chowdhury, S. Batch and continuous (fixed-bed column) biosorption of crystal violet by Artocarpus heterophyllus (jackfruit) leaf powder. Colloids Surf. B Biointerfaces 2012, 92, 262–270. [Google Scholar] [CrossRef]
- Moubarak, F.; Atmani, R.; Maghri, I.; Elkouali, M.; Talbi, M.; Latifa, M. Elimination of Methylene Blue dye with natural adsorbent “banana peels powder”. Glob. J. Sci. Front. Res. 2014, 14, 39–44. [Google Scholar]
- Bouaziz, F.; Koubaa, M.; Kallel, F.; Chaari, F.; Driss, D.; Ghorbel, R.E.; Chaabouni, S.E. Efficiency of almond gum as a low-cost adsorbent for methylene blue dye removal from aqueous solutions. Ind. Crops Prod. 2015, 74, 903–911. [Google Scholar] [CrossRef]
- Abu-El-Halawa, R.; Zabin, S.A.; Abu-Sittah, H.H. Investigation of Methylene Blue Dye Adsorption from Polluted Water Using Oleander Plant (Al Defla) Tissues as Sorbent. Am. J. Environ. Sci. 2016, 12, 213–224. [Google Scholar] [CrossRef]
- Enniya, I.; Jourani, A. Study of Methylene Blue Removal by a biosorbent prepared with Apple peels. J. Mater. Environ. Sci. 2017, 8, 4573–4581. [Google Scholar] [CrossRef] [Green Version]
- Saibaba, K.V.N.; Kandisa, R.V. Adsorption Isotherm Studies on Methylene Blue Dye Removal Using Naturally Available Biosorbent. Rasayan J. Chem. 2019, 12, 2176–2182. [Google Scholar]
- Shakoor, S.; Nasar, A. Utilization of Cucumis Sativus Peel as an Eco-Friendly Biosorbent for the Confiscation of Crystal Violet Dye from Artificially Contaminated Wastewater. Anal. Chem. Lett. 2019, 9, 1–19. [Google Scholar] [CrossRef]
- Devi, V.S.; Sudhakar, B.; Prasad, K.; Sunadh, P.J.; Krishna, M. Adsorption of Congo red from aqueous solution onto Antigonon leptopus leaf powder: Equilibrium and kinetic modeling. Mater. Today Proc. 2020, 26, 3197–3206. [Google Scholar] [CrossRef]
- Ghosh, I.; Kar, S.; Chatterjee, T.; Bar, N.; Das, S.K. Removal of methylene blue from aqueous solution using Lathyrus sativus husk: Adsorption study, MPR and ANN modelling. Process Saf. Environ. Prot. 2021, 149, 345–361. [Google Scholar] [CrossRef]
- Degola, F.; Marzouk, B.; Gori, A.; Brunetti, C.; Dramis, L.; Gelati, S.; Buschini, A.; Restivo, F.M. Aspergillus flavus as a Model System to Test the Biological Activity of Botanicals: An Example on Citrullus colocynthis L. Schrad. Organic Extracts. Toxins 2019, 11, 286. [Google Scholar] [CrossRef] [Green Version]
- Ahmed, M.; Ji, M.; Qin, P.; Gu, Z.; Liu, Y.; Sikandar, A.; Iqbal, M.F.; Javeed, A. Phytochemical screening, total phenolic and flavonoids contents and antioxidant activities of Citrullus colocynthis L. and Cannabis sativa L. Appl. Ecol. Environ. Res. 2019, 17, 6961–6979. [Google Scholar] [CrossRef]
- Qasemi, M.; Afsharnia, M.; Zarei, A.; Najafpoor, A.A.; Salari, S.; Shams, M. Phenol removal from aqueous solution using Citrullus colocynthis waste ash. Data Brief 2018, 18, 620–628. [Google Scholar] [CrossRef]
- Salari, S.; Afsharnia, M.; Moteallemi, A.; Ghasemi, M. Evaluation of removal efficiency of phenol from synthetic aqueous solutions by Citrullus colocynthis seed ash. Environ. Health Eng. Manag. 2018, 5, 49–55. [Google Scholar] [CrossRef]
- Hasdemir, Z.M.; Simsek, S. Removal of Cationic Dye in Aquatic Medium by Using a New Composite Material. Cumhur. Sci. J. 2018, 39, 181–191. [Google Scholar] [CrossRef] [Green Version]
- Miyah, Y.; Lahrichi, A.; Idrissi, M.; Boujraf, S.; Taouda, H.; Zerrouq, F. Assessment of adsorption kinetics for removal potential of Crystal Violet dye from aqueous solutions using Moroccan pyrophyllite. J. Assoc. Arab Univ. Basic Appl. Sci. 2017, 23, 20–28. [Google Scholar] [CrossRef] [Green Version]
- Shakoor, S.; Nasar, A. Adsorptive decontamination of synthetic wastewater containing crystal violet dye by employing Terminalia arjuna sawdust waste. Groundw. Sustain. Dev. 2018, 7, 30–38. [Google Scholar] [CrossRef]
- Ray, S.S.; Gusain, R.; Kumar, N. (Eds.) Adsorption equilibrium isotherms, kinetics and thermodynamics. In Micro and Nano Technologies, Carbon Nanomaterial-Based Adsorbents for Water Purification; Elsevier: Amsterdam, The Netherlands, 2020; pp. 101–118. [Google Scholar] [CrossRef]
- Hamoudi, S.A.; Hamdi, B.; Brendlé, J. Removal of Ions Pb2+ and Cd2+ from Aqueous Solution by Containment Geomaterials. In Exergetic, Energetic and Environmental Dimensions; Dincer, I., Colpan, C.O., Kizilkan, O., Eds.; Academic Press: Cambridge, MA, USA, 2018; pp. 1029–1043. [Google Scholar] [CrossRef]
- Kamsonlian, S.; Suresh, S.; Balomajumder, S.; Chand, S. Characterization of banana peels and orange peels: Biosorption mechanism. Int. J. Sci. Technol. Manag. 2011, 2, 1–7. [Google Scholar]
- Salazar-Rabago, J.J.; Ramos, R.L.; Utrilla, J.R.; Perez, R.O.; Cordova, F.J.C. Biosorption mechanism of Methylene Blue from aqueous solution onto White Pine (Pinus durangensis) sawdust: Effect of operating conditions. Sustain. Environ. Res. 2017, 27, 32–40. [Google Scholar] [CrossRef]
- Liu, L.; Fan, S.; Li, Y. Removal Behavior of Methylene Blue from Aqueous Solution by Tea Waste: Kinetics, Isotherms and Mechanism. Int. J. Environ. Res. Public Health 2018, 15, 1321. [Google Scholar] [CrossRef] [Green Version]
- Saleem, J.; Bin Shahid, U.; Hijab, M.; Mackey, H.; McKay, G. Production and applications of activated carbons as adsorbents from olive stones. Biomass Convers. Biorefin. 2019, 9, 775–802. [Google Scholar] [CrossRef] [Green Version]
- Sahoo, T.R.; Prelot, B. Chapter 7—Adsorption processes for the removal of contaminants from wastewater: The perspective role of nanomaterials and nanotechnology. In Micro and Nano Technologies, Nanomaterials for the Detection and Removal of Wastewater Pollutant; Bonelli, B., Freyria, F.S., Rossetti, I., Sethi, R., Eds.; Elsevier: Amsterdam, The Netherlands, 2020; pp. 161–222. [Google Scholar] [CrossRef]
- Nyakuma, B.; Oladokun, O.; Dodo, Y.; Wong, S.; Uthman, H.; Halim, M. Fuel Characterization and Thermogravimetric Analysis of Melon (Citrullus colocynthis L.) Seed Husk. Chem. Chem. Technol. 2016, 10, 493–497. [Google Scholar] [CrossRef]
- Díez, D.; Urueña, A.; Piñero, R.; Barrio, A.; Tamminen, T. Determination of Hemicellulose, Cellulose, and Lignin Content in different Types of Biomasses by Thermogravimetric Analysis and Pseudocomponent Kinetic Model (TGA-PKM Method). Processes 2020, 8, 1048. [Google Scholar] [CrossRef]
- Silva, F.; Nascimento, L.; Brito, M.; da Silva, K.; Paschoal, W., Jr.; Fujiyama, R. Biosorption of Methylene Blue Dye Using Natural Biosorbents Made from Weeds. Materials 2019, 12, 2486. [Google Scholar] [CrossRef] [Green Version]
- Prasad, A.L.; Santhi, T. Adsorption of hazardous cationic dyes from aqueous solution onto Acacia nilotica leaves as an eco friendly adsorbent. Sustain. Environ. Res. 2012, 22, 113–122. [Google Scholar]
- Bouras, H.D.; Yeddou, A.R.; Bouras, N.; Hellel, D.; Holtz, M.D.; Sabaou, N.; Chergui, A.; Nadjemi, B. Biosorption of Congo red dye by Aspergillus carbonarius M333 and Penicillium glabrum Pg1: Kinetics, equilibrium and thermodynamic studies. J. Taiwan Inst. Chem. Eng. 2017, 80, 915–923. [Google Scholar] [CrossRef]
- Koyuncu, H.; Kul, A.R. Removal of methylene blue dye from aqueous solution by nonliving lichen (Pseudevernia furfuracea (L.) Zopf.), as a novel biosorbent. Appl. Water Sci. 2020, 10, 72. [Google Scholar] [CrossRef] [Green Version]
- Dinh, V.-P.; Huynh, T.-D.-T.; Le, H.M.; Nguyen, V.-D.; Dao, V.-A.; Hung, N.Q.; Tuyen, L.A.; Lee, S.; Yi, J.; Nguyen, T.D.; et al. Insight into the adsorption mechanisms of methylene blue and chromium(iii) from aqueous solution onto pomelo fruit peel. RSC Adv. 2019, 9, 25847–25860. [Google Scholar] [CrossRef] [Green Version]
- Khattri, S.D.; Singh, M.K. Removal of malachite green from dye wastewater using neem sawdust by adsorption. J. Hazard. Mater. 2009, 167, 1089–1094. [Google Scholar] [CrossRef] [PubMed]
- Barka, N.; Abdennouri, M.; El Makhfouk, M.; Qourzal, S. Biosorption characteristics of cadmium and lead onto eco-friendly dried cactus (Opuntia ficus indica) cladodes. J. Environ. Chem. Eng. 2013, 1, 144–149. [Google Scholar] [CrossRef]
- Sharma, M.; Kaushik, A.; Kaushik, C.P. Waste biomass of Nostoc linckia as adsorbent of crystal violet dye: Optimization based on statistical model. Int. Biodeterior. Biodegrad. 2011, 65, 513–521. [Google Scholar]
- Singh, R.; Singh, T.S.; Odiyo, J.O.; Smith, J.A.; Edokpayi, J.N. Evaluation of Methylene Blue Sorption onto Low-Cost Biosorbents: Equilibrium, Kinetics, and Thermodynamics. J. Chem. 2020, 2020, 8318049. [Google Scholar] [CrossRef] [Green Version]
- Ambi, A.A.; Nuru, F.G.; Ibrahim, M.M.; Mora, A.T.; Abubakar, M.S. Pharmacognostic Studies and Elemental Analysis of the Surface Structures of the Seeds of Colocynthis citrullus (Thunb.). Int. J. Glob. Sustain. 2017, 4, 1–10. [Google Scholar]
- Ikenyiri, P.N.; Ukpaka, C.P. Overview on the Effect of Particle Size on the Performance of Wood Based Adsorbent. J. Chem. Eng. Process Technol. 2016, 7, 1000315. [Google Scholar]
- Amin, M.T.; Alazba, A.A.; Shafiq, M. Comparative study for adsorption of methylene blue dye on biochar derived from orange peel and banana biomass in aqueous solutions. Environ. Monit. Assess. 2019, 191, 735. [Google Scholar] [CrossRef]
- Sivarajasekar, N.; Baskar, R.; Ragu, T.; Sarika, K.; Preethi, N.; Radhika, T. Biosorption studies on waste cotton seed for cationic dyes sequestration: Equilibrium and thermodynamics. Appl. Water Sci. 2017, 7, 1987–1995. [Google Scholar] [CrossRef] [Green Version]
- Pathania, D.; Sharma, S.; Singh, P. Removal of methylene blue by adsorption onto activated carbon developed from Ficus carica bast. Arab. J. Chem. 2017, 10, S1445–S1451. [Google Scholar] [CrossRef] [Green Version]
- de Oliveira Brito, S.M.; Andrade, H.M.C.; Soares, L.F.; de Azevedo, R.P. Brazil nut shells as a new biosorbent to remove methylene blue and indigo carmine from aqueous solutions. J. Hazard. Mater. 2010, 174, 84–92. [Google Scholar] [CrossRef] [PubMed]
- Soni, M.; Sharma, A.K.; Srivastava, J.K. Adsorptive Removal of Methylene Blue Dye from an Aqueous Solution Using Water Hyacinth Root Powder as a Low Adsorbent. Int. J. Chem. Sci. 2012, 3, 338–345. [Google Scholar]
- Rehman, M.S.U.; Kim, I.; Han, J.-I. Adsorption of methylene blue dye from aqueous solution by sugar extracted spent rice biomass. Carbohydr. Polym. 2012, 90, 1314–1322. [Google Scholar] [CrossRef]
- Liu, Y.; Zhao, X.; Li, J.; Ma, D.; Han, R. Characterization of bio-char from pyrolysis of wheat straw and its evaluation on methylene blue adsorption. Desalin. Water Treat. 2012, 46, 115–123. [Google Scholar] [CrossRef]
- Cheng, G.; Sunb, L.; Jiaob, L.; Peng, L.; Leia, Z.; Wanga, Y.; Lina, J. Adsorption of methylene blue by residue biochar from copyrolysis of dewatered sewage sludge and pine sawdust. Desalin. Water Treat. 2013, 51, 37–41. [Google Scholar] [CrossRef]
- Shakoor, S.; Nasar, A. Adsorptive treatment of hazardous methylene blue dye from artificially contaminated water using Cucumis sativus peel waste as a low-cost adsorbent. Groundw. Sustain. Dev. 2017, 5, 152–159. [Google Scholar] [CrossRef]
- Ong, S.T.; Keng, P.S.; Lee, S.L.; Leong, M.H.; Hung, Y.T. Equilibrium studies for the removal of basic dye by sunflower seed husk (Helianthus annuus). Phys. Sci. Int. J. 2010, 5, 1270–1276. [Google Scholar]
- Irem, S.; Khan, Q.M.; Islam, E.; Hashmat, A.J.; Haq, M.A.U.; Afzal, M.; Mustafa, T. Enhanced removal of reactive navy blue dye using powdered orange waste. Ecol. Eng. 2013, 58, 399–405. [Google Scholar] [CrossRef]
- Edokpayi, J.N.; Ndlovu, S.S.; Odiyo, J.O. Characterization of pulverized Marula seed husk and its potential for the sequestration of methylene blue from aqueous solution. BMC Chem. 2019, 13, 10. [Google Scholar] [CrossRef] [PubMed]
- Belala, Z.; Jeguirim, M.; Belhachemi, M.; Addoun, F.; Trouvé, G. Biosorption of basic dye from aqueous solutions by Date Stones and Palm-Trees Waste: Kinetic, equilibrium and thermodynamic studies. Desalination 2011, 271, 80–87. [Google Scholar] [CrossRef]
- Jawad, A.H.; Rashid, R.A.; Mahmuod, R.M.; Ishak, M.A.M.; Kasim, N.N.; Ismail, K. Adsorption of methylene blue onto coconut (Cocos nucifera) leaf: Optimization, isotherm and kinetic studies. Desalin. Water Treat. 2016, 57, 8839–8853. [Google Scholar] [CrossRef]
- Ijagbemi, C.O.; Chun, J.I.; Han, D.H.; Cho, H.Y.; O, S.J.; Kim, D.S. Methylene Blue adsorption from aqueous solution by activated carbon: Effect of acidic and alkaline solution treatments. J. Environ. Sci. Health 2010, 45, 958–967. [Google Scholar] [CrossRef] [PubMed]
- Lou, S. Applied Adsorption Kinetics Model for Removal of Hazards from Aqueous Solution: More Informational Parameters for Industrial Design. J. Environ. Sci. Public Health 2017, 1, 228–239. [Google Scholar] [CrossRef]
- Kandisa, R.V.; Kv, N.S.; Gopinadh, R.; Veerabhadram, K. Kinetic Studies on Adsorption of Methylene Blue Using Natural Low Cost Adsorbent. J. Ind. Pollut. Control 2018, 34, 2054–2058. [Google Scholar]
- Basharat, S.; Rehman, R.; Mahmud, T.; Basharat, S.; Mitu, L. Tartaric Acid-Modified Holarrhena antidysenterica and Citrullus colocynthis Biowaste for Efficient Eradication of Crystal Violet Dye from Water. J. Chem. 2020, 2020, 8862167. [Google Scholar] [CrossRef]
Figure 1.
TG pyrolysis curves of CCSs and CCPs.

Figure 2.
FT-IR spectra of (a) CCSs pre- adsorption, (b) CCSs post adsorption, (c) CCPs pre- adsorption and (d) CCPs post adsorption.
Figure 2.
FT-IR spectra of (a) CCSs pre- adsorption, (b) CCSs post adsorption, (c) CCPs pre- adsorption and (d) CCPs post adsorption.

Figure 3.
SEM micrograph of (A) CCSs pre- adsorption (B) CCSs post adsorption (C) CCPs pre- adsorption (D) CCPs post adsorption.
Figure 3.
SEM micrograph of (A) CCSs pre- adsorption (B) CCSs post adsorption (C) CCPs pre- adsorption (D) CCPs post adsorption.

Figure 4.
Effect of contact time on MB dye removal efficiency using CCSs and CCPs.

Figure 5.
Effect of initial MB dye concentration on the removal efficiency of MB dye using CCSs and CCPs.
Figure 5.
Effect of initial MB dye concentration on the removal efficiency of MB dye using CCSs and CCPs.

Figure 6.
Effect of adsorbent dosage on MB removal efficiency using CCSs and CCPs.

Figure 7.
Effect of pH on MB removal efficiency using CCSs and CCPs (Inset–pHPZC).

Figure 8.
Impact of temperature on MB removal efficiency using CCSs and CCPs.

Figure 9.
Adsorption Isotherm models: (a) Langmuir, (b) Freundlich, (c) Temkin.

Figure 10.
Adsorption kinetic models: (a) pseudo-first order, (b) pseudo-second order.

Figure 11.
The plot of ln Kd as a function of 1/T for the removal of MB dye by CCSs and CCPs.

Figure 12.
Proposed mechanism for MB adsorption by CCSs and CCPs.


Table 1.
FT-IR band position (cm−1) and function groups assignments of CCSs and CCPs before and after adsorption.
Table 1.
FT-IR band position (cm−1) and function groups assignments of CCSs and CCPs before and after adsorption.
| CCSs | CCSs-MB | % ΔI | CCPs | CCPs-MB | % ΔI | Suggested Assignments | Reference |
|---|---|---|---|---|---|---|---|
| 3292 | 3292 | −13.66 | 3328 | 3328 | −11.57 | stretching vibration of -OH (alcohols and phenols) | [36] |
| 2923 | 2924 | −3.42 | 2917 | 2917 | −1.05 | asymmetric stretching of -CH group | [37] |
| 2854 | 2854 | −3.8 | 2847 | 2847 | −2.4 | symmetric stretching vibrations of -CH group | |
| 1739 | 1739 | −7.68 | 1735 | 1731 | −6.25 | C = O stretching vibration of carboxylate (-COO−) / (-COOR) | [38] |
| 1635 | 1636 | −7.93 | stretching vibrations of aromatic -C=O and -C=C bonds in carboxylic acid anions. | [39] [40] | |||
| 1538 | 1540 | −8.9 | 1596 | 1596 | −13.58 | aromatic ring vibrations | [41] |
| 1455 | 1456 | −6.23 | phenolic -OH and -C=O stretching of carboxylates | [42] | |||
| 1370 | 1370 | −12.04 | stretching vibration of -COO | ||||
| 1237 | 1236 | −2.19 | 1235 | 1232 | −8.24 | C=O stretching vibration | [43] |
| 1036 | 1032 | −8.76 | 1027 | 1027 | −17.06 | C-O stretching of carboxylate groups | [44] |
Table 2.
Effect of adsorbent particle size on MB removal efficiency.
| Particle Size (µm) | R% (CCSs) | R% (CCPs) |
|---|---|---|
| <600 | 97.80 | 68.20 |
| 600 µm–1180 µm | 85.64 | 63.50 |
| >1180 | 75.62 | 54.17 |
Table 3.
Different parameters of isotherm models for MB adsorption onto CCSs and CCPs.
| Sample | MB-CCSs | MB-CCPs |
|---|---|---|
| Langmuir | ||
| qm (mg g−1) | 18.832 | 4.367 |
| KL (L/mg) | 0.0698 | 1.8438 |
| R2 | 0.9753 | 0.9982 |
| Freundlich | ||
| Kf (mg g−1) (L g−1)1/n | 1.2054 | 2.6485 |
| n | 1.0625 | 2.8910 |
| R2 | 0.9503 | 0.9456 |
| Temkin | ||
| Kt (L/mg) | 20.884 | |
| bt (kJ mol−1) | 2.682 | |
| R2 | 0.8642 | 0.9776 |
Table 4.
Dimensionless separation factor RL.
| MB (Ci, mg/L) | 2 | 3 | 4 | 5 | 6 | 7 |
|---|---|---|---|---|---|---|
| MB-CCSs | 0.878 | 0.827 | 0.782 | 0.741 | 0.705 | 0.672 |
| MB-CCPs | 0.213 | 0.153 | 0.119 | 0.098 | 0.083 | 0.072 |
Table 5.
Comparison of biosorption capacities of different biosorbents for MB dye elimination.
| Biosorbent | Qm (mg g−1) | Reference |
|---|---|---|
| Brazil nut shells | 7.81 | [50] |
| Water hyacinth root powder | 8.04 | [51] |
| Spent rice | 8.13 | [52] |
| Sugar extracted spent rice biomass | 8.13 | [52] |
| Bio-char from pyrolysis of wheat straw | 12.03 | [53] |
| Pine sawdust | 16.75 | [54] |
| Cucumis sativus peels | 21.459 | [55] |
| Sunflower seed husk (Helianthus annuus) | 23.20 | [56] |
| Orange waste | 30.3 | [57] |
| Marula seed husk | 33 | [58] |
| Palm tree waste | 39.47 | [59] |
| Ginkgo biloba leaves | 48.07 | [44] |
| Vigna Trilobata pod | 71.42 | [16] |
| Coconut leaves | 112.35 | [60] |
| Tea waste | 113.1461 | [31] |
| Activated carbon | 8.77 | [61] |
| CCSs | 18.832 | present study |
| CCPs | 4.480 | present study |
Table 6.
Kinetic parameters for the biosorption of MB dye onto CCSs and CCPs.
| Sample | MB-CCSs | MB-CCPs |
|---|---|---|
| MB (Ci, mg/L) | 6 | 4 |
| qe, exp (mg g−1) | 18.832 | 4.367 |
| Pseudo-First Order | ||
| K1 (min−1) | 0.1113 | 0.0274 |
| qe1, cal (mg g−1) | 14.036 | 3.681 |
| R2 | 0.991 | 0.9947 |
| Pseudo-Second Order | ||
| K2 (g mg−1 min−1) | 0.0177 | 0.0061 |
| qe2, cal (mg g−1) | 19.531 | 4.801 |
| R2 | 0.9994 | 0.9803 |
Table 7.
Thermodynamic parameters for MB dye adsorption by CCSs and CCPs.
| Adsorbent | ΔHº(kJ mol−1) | ΔSº(J mol−1 K−1) | Temperature (K) | ΔGº(KJ mol−1) |
|---|---|---|---|---|
| CCSs | 23.09 | 91.17 | 293 | −3.62 |
| 303 | −4.53 | |||
| 313 | −5.44 | |||
| 323 | −6.36 | |||
| 333 | −7.27 | |||
| CCPs | −16.25 | −54.47 | 293 | −0.29 |
| 303 | 0.25 | |||
| 313 | 0.80 | |||
| 323 | 1.34 | |||
| 333 | 1.89 |
Publisher’s Note: MDPI stays neutral with regard to jurisdictional claims in published maps and institutional affiliations. |
© 2021 by the authors. Licensee MDPI, Basel, Switzerland. This article is an open access article distributed under the terms and conditions of the Creative Commons Attribution (CC BY) license (https://creativecommons.org/licenses/by/4.0/).
Share and Cite
MDPI and ACS Style
Alghamdi, W.M.; El Mannoubi, I. Investigation of Seeds and Peels of Citrullus colocynthis as Efficient Natural Adsorbent for Methylene Blue Dye. Processes 2021, 9, 1279. https://0-doi-org.brum.beds.ac.uk/10.3390/pr9081279
AMA Style
Alghamdi WM, El Mannoubi I. Investigation of Seeds and Peels of Citrullus colocynthis as Efficient Natural Adsorbent for Methylene Blue Dye. Processes. 2021; 9(8):1279. https://0-doi-org.brum.beds.ac.uk/10.3390/pr9081279
Chicago/Turabian StyleAlghamdi, Wafa Mohammed, and Ines El Mannoubi. 2021. "Investigation of Seeds and Peels of Citrullus colocynthis as Efficient Natural Adsorbent for Methylene Blue Dye" Processes 9, no. 8: 1279. https://0-doi-org.brum.beds.ac.uk/10.3390/pr9081279
Note that from the first issue of 2016, this journal uses article numbers instead of page numbers. See further details here.