
A Techno-Economic Model for Wind Energy Costs Analysis for Low Wind Speed Areas


1
African Centre of Excellence, Energy for Sustainable Development, University of Rwanda, Kigali 4285, Rwanda
2
School of Engineering, University of KwaZulu Natal, Durban 4041, South Africa
3
George W. Woodruff School of Mechanical Engineering, Georgia Institute of Technology, Atlanta, GA 30332-0405, USA
*
Author to whom correspondence should be addressed.
Processes 2021, 9(8), 1463; https://0-doi-org.brum.beds.ac.uk/10.3390/pr9081463
Submission received: 28 June 2021
/
Revised: 10 July 2021
/
Accepted: 20 July 2021
/
Published: 21 August 2021
(This article belongs to the Special Issue The Process and Modelling of Renewable Energy Sources)
Abstract
:The global population is moving away from fossil fuel technologies due to their many disadvantages, such as air pollution, greenhouse gases emission, global warming, acid rain, health problems, and high costs. These disadvantages make fossil fuels unsustainable. As a result, renewable energy is becoming more attractive due to its steadily decreasing costs. Harnessing renewable energy promises to meet the present energy demands of the African continent. The enormous renewable energy potential available across the African continent remains largely untapped, especially for wind energy. However, marginal and fair wind speeds and power densities characterize African wind energy resulting in low and unsustainable power in many areas. This research develops a techno-economic model for wind energy cost analysis for a novel, Ferris wheel-based wind turbine. The model is used to techno-economically analyze the siting of wind turbine sites in low wind speed areas on the African continent. The wind turbine’s technical performance is characterized by calculating the annual energy production and the capacity factor using the wind Weibull probability distribution of the cities and theoretical power curve of the wind turbine. Its economic performance is evaluated using annualized financial return on investment, simple payback period, and levelized cost of electricity. The techno-economic model is validated for 21 African cities and shows that the Ferris wheel-based design is very competitive with four current, commercial wind turbines, as well as with other sources of energy. Hence, the new wind turbine may help provide the economical, clean, renewable energy that Africa needs.
1. Introduction
The challenge of providing an adequate and sufficient amount of energy for the populace is a global issue. The extent of the concern varies between developed and less developed nations, but the exercise of providing energy is a major challenge worldwide [1]. Energy security is one of the major pillars of sustainable development [2]. As energy systems become more complex, economic, social, health, and environmental concerns are included in energy security assessments [2,3]. Statistics show that up to 1.2 billion people lack access to electricity [3,4]. Approximately 600 million of these are in sub-Saharan Africa, which accounts for 70% of the sub-Saharan population [5,6,7,8]. The energy demands of developing nations, such as those in sub-Saharan Africa, are growing exponentially due to population growth [9,10].
The global population is moving away from fossil fuel technologies due to their many disadvantages, such as air pollution, greenhouse gas emission, global warming, acid rain, health problems, and high costs, which makes them unsustainable [11,12]. Thus, renewable energy is becoming more attractive due to its steady reduction in costs and increased benefits to the environment [13,14]. Harnessing renewable energy promises to meet the present energy demands of Africa because many of the current sources and their usage are unsustainable [15]. Rapid deployment of renewable energy and increased energy efficiency result in significant energy security, climate change mitigation, and economic benefits [16]. The potential for renewable energy resources in Africa is enormous because they can, in principle, exceed the continent’s present energy demands [10].
African countries have enormous renewable energy potential. Their power generation potential is estimated to be 350 Gigawatts (GW) for hydropower, 110 GW for wind, 15 GW for geothermal, and 1000 GW for solar energy. In addition, the potential energy from bio-waste is estimated to be 520 GW per year [17]. Despite the enormous renewable energy potential available across the African continent, it remains largely untapped, especially wind energy. Harnessing wind energy in Africa will increase energy generation and accessibility. Consequently, on-grid or off-grid applications will enhance rural electrification and reduce energy problems in Africa. Utilizing more wind energy will greatly contribute to the energy mix, and enable Africa to solve the problem of generating the power necessary to meet the continent’s present energy demands.
Historically, hydropower has been the oldest and largest source of green energy in the African electricity supply industry, but there is increased use of solar and wind technologies over the past two decades [18]. In 2019, a total of 944 megawatts (MW) of wind power were installed in Africa and the Middle East. Currently, the installed capacity of wind power in Africa and the Middle East exceeds 6 GW, increased from 0.8 GW in 2009 [19]. Over the next five years, due to installations in South Africa (3.5 GW), Egypt (1.8 GW), Morocco (1.2 GW), and Saudi Arabia (1.2 GW), wind power is expected to increase to approximately 10.9 GW. The major markets in the region are South Africa, Egypt, Morocco, and Kenya [20]. However, the African wind energy market is believed to lag behind other clean electricity technologies [18], especially solar and hydropower.
The wind speed and wind power density distributions of sub-Saharan Africa are shown in Figure 1 [21]; the dark red zones identify the highest wind power densities, followed by the red zone, the yellow zone, the green zone, the deep blue zone, while the light blue zones identify significantly lower wind potential. Here, one observes that some countries have sufficient wind power potential for it to become economically viable, but most of the continent has marginal and fair wind speeds and power densities. In addition, wind power is low and unsuitable in some areas. The lowest potential in sub-Sahara Africa is in Central Africa, while the highest potential is seen in Mauritania, Mali, Chad, Sudan, Niger, Somalia, Kenya, Namibia, South Africa, and the northeastern part of Madagascar. Mauritania’s potential, for example, is about four times its annual energy consumption in millions of tons of oil equivalent (MTOE), while Sudan’s is equivalent to 90% of its annual energy needs [22]. Mukasa et al., 2005, used a technical feasibility method based on technologies available and found these countries to have large on-shore wind energy potential [23].
Wind power is a much less expensive alternative to traditional energy sources. There is increased interest in commercialization of wind energy because of this low cost and high profit potential. From the time one commissions a wind turbine, a positive cash flow is realized in a shorter period compared to other investments [24,25]. The rapid increase in wind energy installations benefits investors and consumers in many ways. Wind power is a smart investment, with life cycles of around 20 years [26,27,28] and an average payback period of 15 years [29].
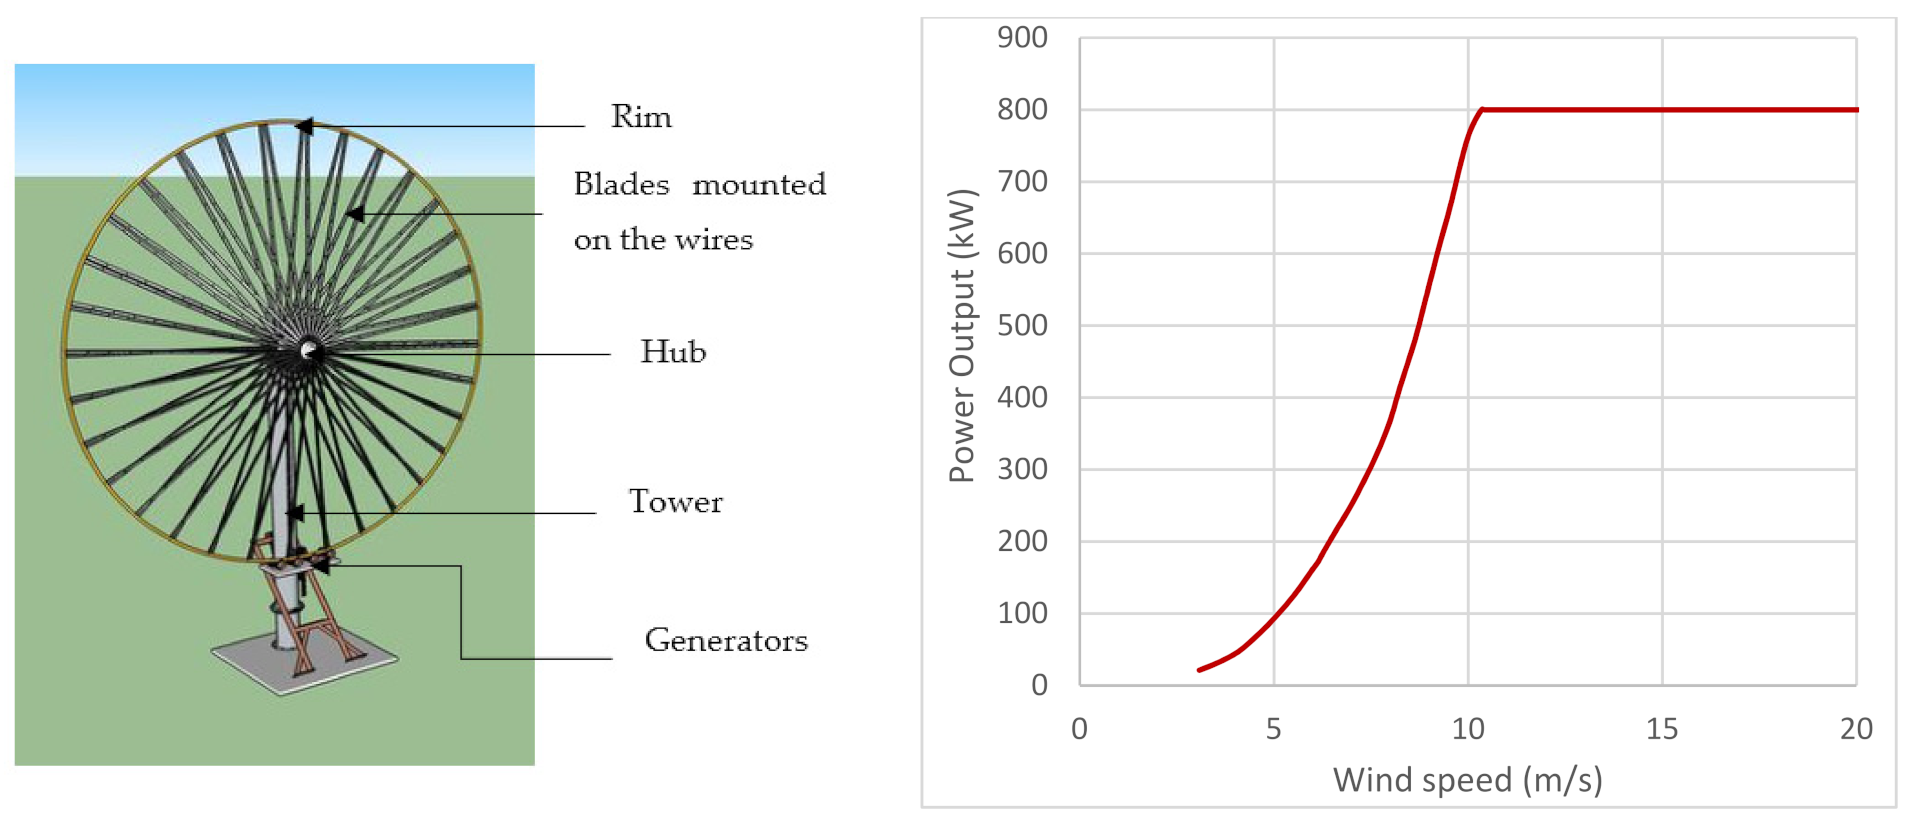
Conventional wind turbines are designed to operate at high wind speeds to generate electricity. A cut-in speed of 3–5 m/s is needed [30], and a rated wind speed range of 12–15 m/s is required to generate electricity [31]. However, this wind speed potential is not available in most parts of the continent, especially in the sub-Sahara. Conventional wind turbines are also heavy and expensive to purchase, install, and maintain, thus informing the choice of a new wind turbine, the Ferris wheel Wind Turbine (FWT), as the basis for the research study. The Ferris wheel technology (Figure 2) has its blades on wire spokes, which creates a strong, light design. It addresses many of the challenges associated with conventional wind turbines. In addition, it poses to be a better technology for Africa because it can generate power at lower-rated wind speeds, higher cut-out speeds, lower weight to power ratios, reduced maintenance, installation, transportation and capital costs, greater ease of transportation, greater ease of erection because of its integrated lifting system, and lower levelized cost of electricity [32]. This research presents a techno-economic model for wind energy cost analysis. The model is used to study the techno-economic analysis of siting of the FWT in the low wind speed areas using the African continent as a case study [33]. In addition, the research compares the techno-economic viability of the FWT with other existing commercial wind turbines and other sources of energy.
In this paper, Section 1 introduces the paper and explains the need for clean energy in comparison to fossil. It explains how wind energy has been widely used as a source of power generation and discusses the reasons that wind energy is needed in the African energy mix, as well as potential for wind energy across the continent. Section 2 details the methodology and the framework used to develop the techno-economic model. Section 3 presents the African countries and cities selected as case studies, which represent the wind speed distribution available across the African continent. Section 4 introduces the mathematical modelling from both the technical and economic standpoints. Section 5 discusses the data used in the model, which consist of wind data, wind turbine specifications, and economic data. Section 6 introduces the techno-economic analysis procedure including its input and output variables, presents, discusses the results, and compares the FWT and some existing commercial wind turbines. Conclusion and recommendations are presented in Section 7.
2. Materials and Methods
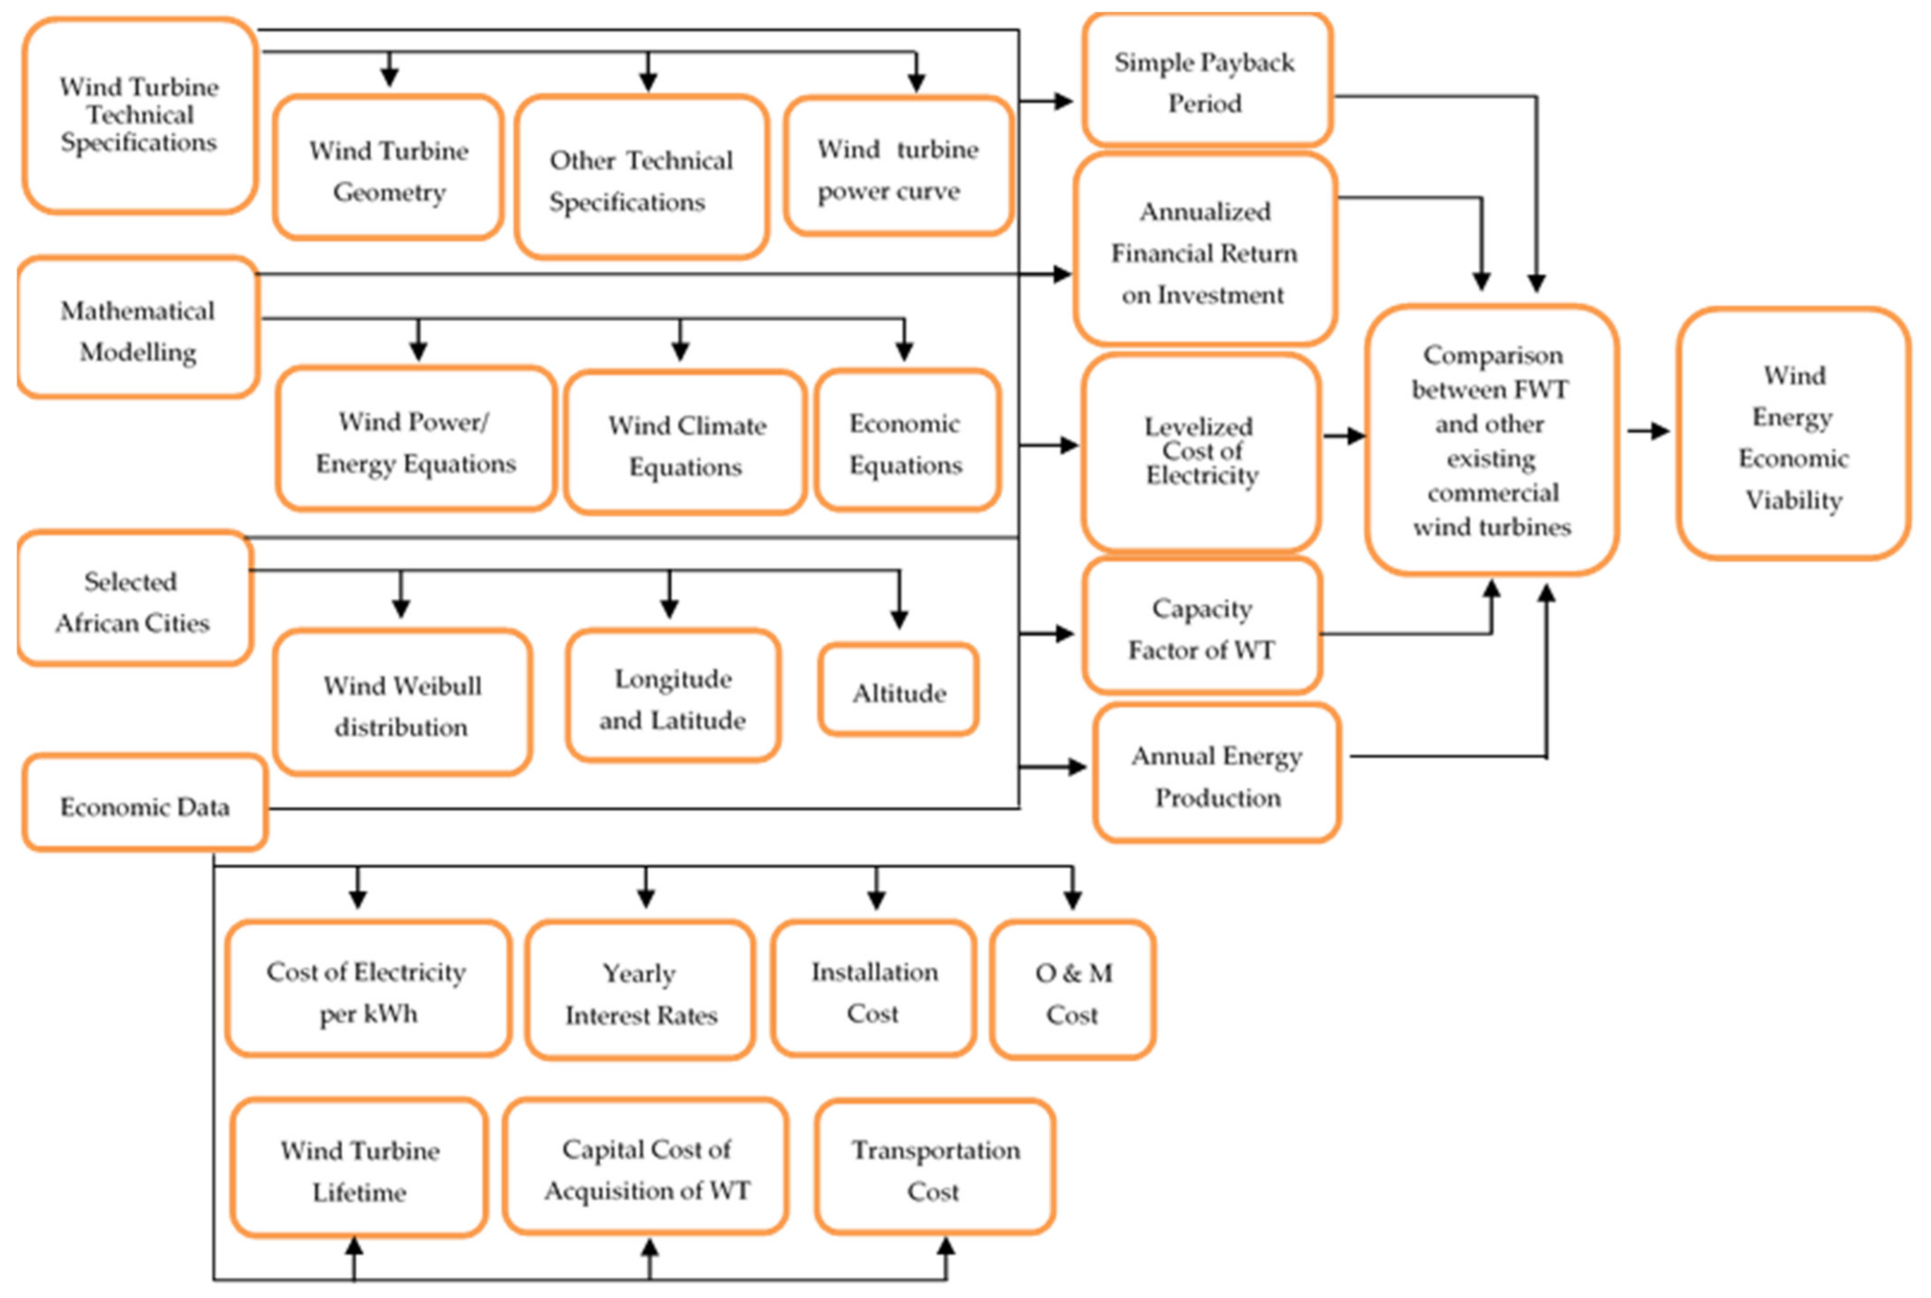
The techno-economic model framework is shown in Figure 3. The method to develop the techno-economic model is as follows:
- Mathematical modelling: The mathematical equations for analysing the wind data using the Weibull distribution, evaluating the technical performance through the annual energy production and the capacity factor and the economics through the annualized financial return on investment, simple payback period, and levelized cost of electricity are presented. These include wind power and energy, Weibull distribution, and economic equations.
- Wind turbine specifications: The wind turbine is identified. The geometry and other technical specifications of the FWT are discussed. The BWT wind turbine power curve, the power curve of the existing commercial wind turbines used for comparison and their technical specifications are also presented.
- Selected sites: The demonstration cities are identified based on their wind resource potential and proximity to the electric grid.
- Wind data: The two-parameter Weibull distribution of the wind direction of the selected sites over a period of ten years are obtained and analysed using the previously mentioned mathematical models.
- Economic data: The economic data that are input in the model are obtained. They are divided into location dependent—cost of electricity per kWh, yearly interest rate, inflation rate, and wind turbine dependent data—cost of acquisition of wind turbine, transportation and installation cost, operation and maintenance (O & M) cost, and wind turbine lifetime.
Determining economic viability is of utmost importance especially in low wind speed resource regions such as those in the African continent. The results from this techno-economic model for the Ferris wheel-based wind turbine are compared to other existing sources of energy and commercially available wind turbines to ascertain its competitiveness.
3. The Selected African Countries and Cities
The case study countries selected for use in the techno-economic model are discussed with their respective annual mean wind speeds [21] and are shown in Table 1. The countries were chosen as case studies based on their locations in Africa and their annual mean wind speeds. The case study countries represent a range of wind speeds available in Africa, allowing one to compare and determine the feasibility of very low wind speed applications and the characteristics of the wind resource in these countries. Even though Morocco is in the Middle East and North African (MENA) region, it is one of the few countries with high wind resources on the continent and that informed its inclusion in this study. To evaluate the techno-economic viability of siting wind turbines in these countries, specific cities were chosen.
These African cities represent the range of wind speeds available in the continent from low to medium to high. The cities chosen also have significant populations. The windiest areas within the cities are chosen as installation sites. Figure 4 shows the locations of the cities and their proximity to the African electric grid network, which reduces the cost of transmission line installations to the sites [35,36]. Ati (Chad) and Garissa (Kenya) are not on the African grid network; these two locations serve as off-grid examples for this study.
4. Mathematical Modelling
In order to accurately determine the wind speed characteristic, reliably evaluate the wind power potential, and evaluate the economic viability of a local regime, it is necessary to determine the statistical distribution that best fits the wind speeds of the location. Probability density functions are used to determine the wind potential in a certain area. There are numerous distributions used in modelling the wind speed; however, the most frequently used distributions are Weibull, Rayleigh, Lognormal, and Gamma distributions [37,38,39,40]. The Weibull distribution is undoubtedly one of the most powerful, accurate and widely used models for wind potential assessment of a particular location worldwide [36,41,42,43] because it offers greater flexibility for fitting experimental data [44]. From the recommendations and results of previous studies, the present research adopts a two-parameter Weibull probability density function for the analysis of wind speed characteristic and assessment of wind energy potential [39].
The probability density function representing the Weibull distribution can be expressed by Equation (1) [38,39,43,45].
where k (dimensionless) and c (m/s) represent the factor for shape and scale factor, respectively, which means that k and c store the complete information about the distribution. Therefore, the Weibull cumulative distribution function, obtained by taking an integral of the Weibull probability density function, which is represented by f(v), is given as Equation (2) [41,46]
The Weibull parameters at measurement height are related to the parameters at the wind turbine hub height by Equation (3) [42,46,47],
where V is the wind speed at the wind turbine hub height h, V0 is the wind speed at original height h0, and α is the surface roughness coefficient [48]. Using Equation (4) and the Weibull distribution, it is possible to determine the average velocity [49]:
where
The gamma function can be approximated by Equation (6) [49]
The wind power density, P(v), is independent of the turbine characteristic such as size and efficiency. It depends only on the air density and the wind speed and is given by Equation (7) [38,49]
The fundamental wind power equation is used for estimating wind power, is given by Equation (8) [50]
where is air density, A is the area of the wind turbine, and V is the wind velocity. However, a wind turbine cannot convert more than 59.3% of the kinetic energy of the wind into mechanical energy, which is the Betz Limit. The theoretical Betz limit power coefficient is defined by Equation (9)
In addition, wind turbines cannot operate at this maximum limit. The Cp value is unique to each turbine type and is a function of wind speed in which the turbine is operating. Hence, after factoring the power coefficient into Equation (8), the available, extractable power, from the wind is given by Equation (10) [50]
The annual energy production of a wind turbine in a particular location (AEP) is given by Equation (11) [47,48,51]
The capacity factor of a wind turbine or a wind farm is defined as the actual energy production divided by the maximum possible energy output of a power plant, over a period of time, given by Equation (12) [52]
A wind energy system is an investment that produces revenue. An economic analysis is used to evaluate the profitability and viability of a wind energy project at a particular site. A payback calculation compares revenue with costs and determines the length of time required to recoup an initial investment. The simple payback period (SPP) is given by Equation (13) [49]
where I is the installed capital cost of the wind turbine plus the costs of civil works. Generally, the civil works costs consist of the transportation and installation costs, which are typically between 20% and 30% of the wind turbine’s total price. AEP is the annual energy production (kWh/year). is the price of electricity ($/kWh). If the payback period of investments is shorter than the estimated service life or operation of the implemented technical solution, then the investment is economically justified [53]. The levelized cost of the electricity (LCOE) is used to determine the installed cost of electricity produced by a wind energy conversion system [42,48,54] according to Equation (14)
where I is the installed capital cost of the wind turbine plus the costs of civil works, and CRF and are the capital recovery factor and the present worth of the annual cost throughout the lifetime of the wind turbine. CRF and are given by Equations (15) and (16) [42,48,54]
where represents the operation and maintenance costs for the first year and is approximately 20–30% of the annual cost of the wind machine, which is the price of the machine divided by its lifetime, e is the escalation rate of operation and maintenance, i is the interest rate, and n is the useful lifetime of the turbine in years. All of these methods or technologies require an investment, and in order to evaluate their financial benefits, a return on investment (ROI) analysis is required. The ROI is given by Equation (17) [53,55].
where PVC is an estimate of the cost to implement a project (predicted cost) and PVB is an estimate of the benefit (financial return) from the project implementation (predicted benefit) [56].
5. Data Collection
5.1. Wind Data
To assess wind energy potential in the selected African countries, the Weibull distribution wind data for a spatial data layer with 1 km × 1 km resolution throughout the locations was acquired from the Global Wind Atlas (GWA) [21,57]. The GWA dataset is the only publicly available dataset that provides worldwide wind conditions that include microscale information, from global meteorological observations, obtained from various sources, within a numerical weather prediction model in order to obtain the values of various climate parameters in regular grid points over long periods. The GWA is maintained by the Technical University of Denmark in partnership with the World Bank with funding provided by the Energy Sector Management Assistance Program (ESMAP) [58,59]. It is calculated using the data, which are derived from the WAsP Modelling. The WAsP software suite is the industry standard for wind resource assessment, siting, and energy yield calculation for wind turbines and wind farms. The WAsP software suite is used for sites located in all types of terrain globally [60]. The wind data used in this research are at a hub height of 100 m. While this research used data from the GWA, other sources of data, such as from meteorological organizations or the literature, can be used in the model presented in the present paper.
5.2. Geometry and Technical Specifications of the FWT Design
This research uses the Barber Wind Turbine (BWT), a commercial instantiation of FWT, as the basis for the techno-economic analysis of a low-speed wind turbine. Table 2 presents the geometry and technical specifications of the specific BWT used to explore the wind turbine design space. The BWT wind turbine is a 61 m (200 ft) rim with an 800 kW generator wind turbine (61 m–800 kW). This design is chosen because it is the initial wind turbine that BWT is commercializing; therefore, actual costs and data are available. The power curve of the BWT from wind tunnel testing is shown in Figure 4 and the data are presented in the Appendix A.
5.3. Economic Data
The economic data required for the techno-economic model include the cost of electricity per kWh in the selected African cities, the yearly interest rate for each city, capital cost of acquisition, operation, maintenance costs of the wind turbine, and wind turbine lifetime. The operation and maintenance costs are fixed at 2–3% of the installed capital cost. The capital cost of the wind turbine, including the transportation and installation costs, is set by the manufacturer [48]. The capital cost of acquisition as well as operation and maintenance costs of the BWT and other existing wind turbines were obtained from the wind turbine manufacturers. The yearly interest rates for the selected African cities were obtained from Trading Economics [62]. The inflation rates for each selected location were obtained from Statista [63]. The costs of electricity are location specific and were obtained from Global Petrol Prices [64]. All economic data used in the model are for the specific locations studied in this research and are presented in Table 3. However, these data can be adapted for the particular wind turbines and their locations for other studies elsewhere.
6. Results and Discussions
In order to develop the techno-economic model, various input parameters are needed. For this study, the input variables are wind turbine and location-dependent variables. The location-dependent variables are the data specific to the cities studied. The two classes of input variables for the techno-economic analysis in this study are presented in Table 2 and Table 3. The Weibull parameters (k–the factor for shape and c–scale factor), for each location in each of 12 compass directions at 100 m altitude, are obtained from the GWA. Using Equation (2), the Weibull probability density function for each direction under the range of the wind speed (cut-in speed to cut-out speed) of the theoretical power curve of the wind turbine is calculated. The average Weibull probability density function for each of the 12 directions for each varying wind speed are calculated. The annual energy production for the 21 cities is calculated by multiplying the estimated average Weibull probability density function over the range of wind speeds in the 21 cities by the theoretical power curve (Figure 1) of the FWT with the number of hours in a year (Equation (11)). An example of the calculation for Ati city is shown in the Appendix A (Table A2 and Figure 5). The capacity factor was calculated using Equation (12) while the annualized financial ROI, SPP, and LCOE were calculated using Equations (13)–(17).
The model was developed and exercised in the selected African cities. A 61 m rim FWT with a rated power of 800 kW was selected for performance assessment and economic analysis. Hence, the annual energy produced, together with the capacity factors of the wind turbine for the selected locations, are indexes used for the performance assessment and are presented in Figure 6. The ROI, SPP, and LCOE of the wind turbines in the selected African cities are indexes used for the economic assessment and the results are presented and discussed in Figure 7, Figure 8 and Figure 9 and Table A3.
6.1. FWT Performance Assessment
The annual energy produced (AEP) and the capacity factor of the wind turbine depends on the wind speed and the quality of the wind resource available in the selected sites. From the results, Ati, has the highest AEP of 2.57 GWh with 37.2% capacity factor. The lowest AEP of 0.31 GWh was recorded at Ruhengeri with 4.5% capacity factor. The capacity factors for onshore wind turbines are between 18–52% [65,66,67]. In this study, 38% of the cities can achieve capacity factors in this range. Hence, Ati appears to be an acceptable location for a wind turbine because sites with higher wind resource are preferred to the lower ones [68].
6.2. FWT Economic Analysis
To assess the economic viability of the FWT, annualized financial ROI, SPP, and LCOE were calculated. The details of the results are discussed below.
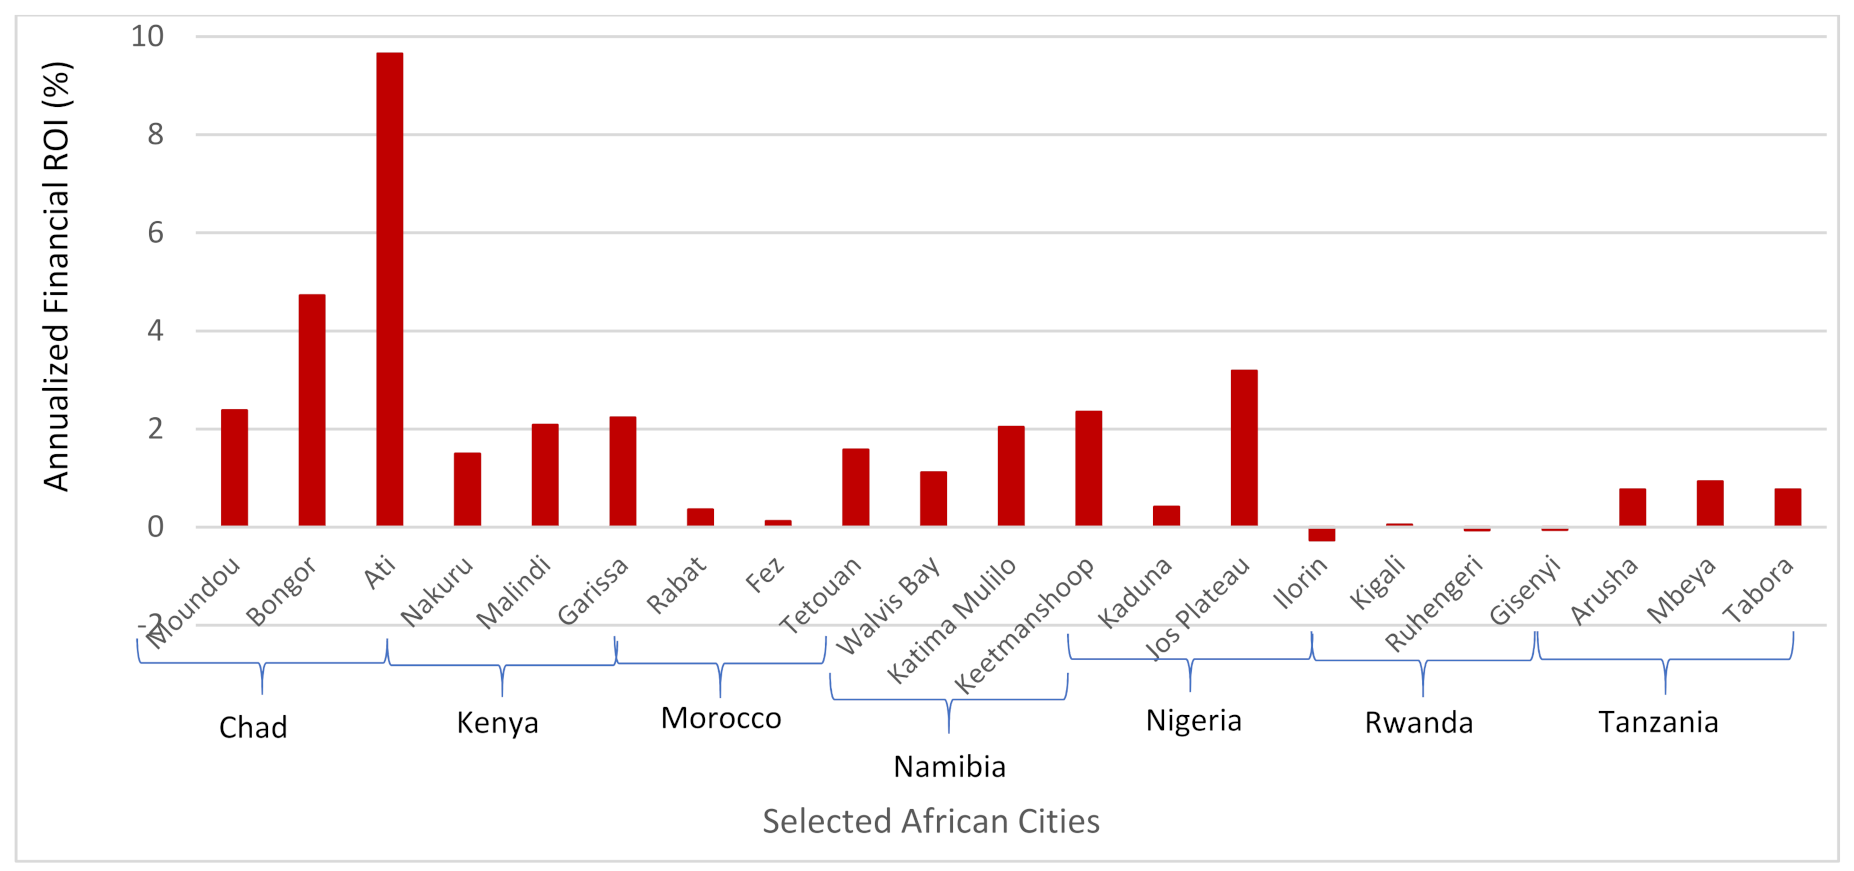
6.2.1. Annualized Return on Investment
Using the appropriate equations and the assumptions and parameters presented above, the ROIs for siting the FWT in the selected cities were estimated. The results are presented in Figure 7. The annualized ROI ranged from −0.06% in Ruhengeri to 9.65 % in Tetouan. The wind turbine has a positive ROI value except for the cities Gisenyi, Ilorin, and Ruhengeri. Therefore, these cities are not economically viable locations for wind power generation using the FWT 61 m–800 kW design. Overall, the FWT wind turbine under study is economically viable in 18 out of 21 cities. Investors consider a business with a higher ROI more profitable than their counterparts with lower ROI. An annualized ROI of 2–6% is considered good value [69,70,71,72]. Therefore, 38% of the cities can generate an annualized ROI within this range and even more.
6.2.2. Simple Payback Period
The estimated simple payback periods of the FWT in the twenty-one cities (Figure 8) show that the FWT will be able to pay for themselves within their lifetimes for the majority of the cities. The longest payback period of 27.3 years is observed at Ilorin, while the shortest payback period of 1.9 years is seen at Ati. Gisenyi, Ilorin, and Ruhengeri have payback periods that exceed the assumed lifetime of the wind turbine. Installing the wind turbines in those cities is not economically viable for energy production for the BWT 61 m–800 kW design. The payback period and ROI results agree, thereby validating the techno-economic model.
The literature shows that small and medium-sized wind turbines have a payback period of 5–12 years [39,73,74]. Sixty seven percent of the cities studied for this paper fall within this payback period range. Thus, the FWT can recoup its initial investment within an acceptable payback period for ten of the 21 cities, it would be profitable for the cities during its lifetime, and it would be unprofitable in the remaining seven cities. This makes the FWT 61 m–800 kW a viable investment for wind energy.
6.2.3. Levelized Cost of Electricity
The LCOE for the FWT are presented in Figure 9. LCOE is higher at regions with lower wind speeds. Ati has the lowest LCOE of 0.04 $/kWh and Ruhengeri has the highest LCOE of 0.43 $/kWh among the cities studied. LCOE is used to compare energy projects to current market prices. The LCOE results in Malindi (0.15 $/kWh), Garissa (0.14 $/kWh), and Nakuru (0.18 $/kWh) are within the range of the LCOE of onshore wind (0.10–0.26 $/kWh), and solar PV (0.15–0.24 $/kWh) in Kenya [75,76], and have a lower LCOE value than diesel LCOE of 0.34 $/kWh in Kenya [77]. Wind energy in Malindi, Garissa, and Nakuru competes favorably with solar PV, diesel, and current onshore wind energy in Kenya. The LCOE in Tetouan (0.06 $/kWh) is lower than renewables (0.042–0.15 $/kWh) including solar PV and onshore wind in Morocco while the LCOE in Rabat (0.12 $/kWh) and Fez (0.14 $/kWh) are in the range [78,79,80]. This makes the sites in Morocco compete favorably with renewable energy investments in Morocco.
In Namibia, LCOE in Keetmanshoop (0.07 $/kWh), Katima Mulilo (0.15 $/kWh), and Walvis Bay (0.12 $/kWh) is less than concentrated solar power (CSP) (0.17–0.22 $/kWh) [81]. LCOE results for Keetmanshoop fall within the range of coal (0.081–0.093 $/kWh), whereas the other two sites in Namibia have higher LCOE values than coal (0.081–0.093 $/kWh) and solar PV (0.088 $/kWh) [82]. Therefore, Keetmanshoop appears more favorable for wind energy investments than Katima Mulilo and Walvis Bay. In addition, the BWT is competitive against CSP, but not with coal and solar PV in Namibia. In Nigeria, Kaduna and Jos Plateau have LCOE values smaller than onshore wind (0.26 $/kWh) and solar PV (0.26 $/kWh) [83], whereas Ilorin is slightly higher. Our results are also close to LCOE results from the literature [84]. The FWT is competitive with other renewables in Nigeria.
In Rwanda, the LCOE of onshore wind, solar PV, and diesel are 0.34 $/kWh, 0.35 $/kWh, and 0.41 $/kWh, respectively [76,77]. The results from our LCOE model are slightly higher than these values. As a result, the three wind energy sites in Rwanda are not competitive with coal and other renewable energy sources, and therefore, are unfavorable for wind energy investments. In Tanzania, LCOE are close to biomass (0.1531 $/kWh) [83], and lower than CSP (0.21–0.22 $/kWh) [85] and diesel (0.34 $/kWh) [77]. Limited data were found for LCOE of renewables and fossil fuels in Chad; therefore, we would only compare our results with LCOE results from a few published articles. LCOE for Ati, Bongor, and Moundou in Chad are significantly lower than onshore wind (0.51–0.60 $/kWh) according to Jahangiri, 2019 [86], lower than solar PV (0.20–0.83 $/kWh), and lower than solar–diesel hybrid (0.54 $/kWh) compared with the LCOE results from Issak, 2018 [87]. The BWT is competitive against other renewables and coal in Tanzania and Chad.
In Figure 9, we also compared the LCOE of the BWT as built to the LCOE as designed in the 21 selected cities. Ati has the lowest LCOE designed close to the LCOE as built by the manufacturer. Higher efficiency and energy capture is achievable in cities with better wind distribution than cities with lower wind distributions. In addition, the comparison of LCOE to the current cost of electricity (COE) rates is also shown in Figure 9. The LCOE is higher than the COE in most of the cities except for Moundou, Bongor, Ati, Nakuru, Malindi, Garissa, Tetouan, Katima Mulilo, Keetmanshoop, and Walvis Bay. Hence, 48% of the cities have lower LCOE values than the COE. The margins between the current COE and the LCOE results in Tetouan and Rabat are positive; therefore, the project is more profitable in these two cities than the rest of the cities. Moreover, the COE rates in different countries are fixed by the government and may have been subsidized by the government. The COE rates also vary depending on the application of electricity, as rates for industrial applications are generally higher than the household uses.
6.3. Comparison between FWT and Existing Commercial Wind Turbines
New technologies are validated by comparing them with existing technologies under the same technical and economic conditions. This section compares the technical and economic performance of the BWT 800 kW with existing commercial wind turbines. These include the Enercon E53–Class S, Enercon E44–Class I, EWT DW61–Class III, and GE SLE 1.5–Class I. The BWT 800 kW is classified as Class S. The technical specifications, cost of acquisition and operation, and maintenance cost per year of these wind turbines are shown in Table 4. The power curve data for the BWT 800 kW and the existing commercial wind turbines are presented in the Appendix A (Table A1).
Using the technical specifications, the capital cost of acquisition and operation, and maintenance cost of the BWT and other existing wind turbines in the developed techno-economic model, the annual energy production (AEP) was estimated for the selected cities using their Weibull distribution. The results for AEP are presented in Figure 10a and Appendix A (Table A3). They show, for the 21 cities, that GE SLE 1.5 has the highest AEP, followed by EWT DW61, Enercon E53 and BWT 800, while Enercon E44 has the least AEP.
The levelized cost of electricity (LCOE) of the BWT and four commercial wind turbines are estimated and compared under the same conditions in the 21 cities using the technical specifications, the capital cost of acquisition and operation, and maintenance cost. The results for LCOE (Figure 10b and Appendix A Table A3) show that the EWT DW61 has the lowest LCOE, followed by BWT 800 kW, then GE SLE 1.5, Enercon E53, and the least LCOE is recorded on Enercon E44 for all the 21 cities. The EWT DW61 is specifically designed for low-speed areas; hence, it has the lowest LCOE among all the wind turbines being compared.
These results show the competitiveness of the BWT for operation in comparison with commercial wind turbines, especially for low wind condition locations, such as those in the African continent. Although the EWT DW61 has a slightly lower LCOE in the cities tested, the BWT 800 kW has a robust design and a wider range of applications to all classes of wind resources, and therefore, with commercialization, the BWT would have lower cost in the long run. The FWT technology is a strong candidate to increase the availability of economic, green, sustainable energy in Africa.
7. Conclusions/Recommendations
This research presents a novel multi-variable, techno-economic model for wind energy assessment in low wind speed areas, such as the African continent. The model’s inputs include the wind data of selected African cities, wind turbine geometry and technical specifications, and economic data of both the wind turbines and cities. The outputs include the annual energy production and the capacity factor of the wind turbines, the return on investment, the simple payback period, and the levelized cost of electricity specific to each site. The model has been used to demonstrate the techno-economic feasibility of a novel wind turbine, based upon a Ferris wheel (FWT). The results for the FWT are compared to other existing sources of energy and existing commercial wind turbines and show the high competitiveness of the FWT for low wind speed conditions, such as in Africa. Further research can address the application of FWT designs to on-grid or off-grid and hybrid systems.
This model can be used by investors to assess wind energy sites globally to determine the effectiveness of investments and by public governments to attract investment in wind energy. The model also provides decision-makers with a better understanding of wind farm economics, profit opportunities, and risks related to wind investments. The model is generic, which allows users to use their own data to determine economic viability of planned wind turbines in specific cities.
Author Contributions
Conceptualization, K.A.A. and J.S.C.; methodology, K.A.A., N.I. and J.S.C.; software, K.A.A. and J.S.C.; validation, K.A.A., N.I. and J.S.C.; formal analysis, K.A.A.; investigation, K.A.A. and J.S.C.; resources, K.A.A. and J.S.C.; data curation, K.A.A.; writing—original draft preparation, K.A.A.; writing—review and editing, K.A.A., N.I. and J.S.C.; supervision, J.S.C. and N.I.; project administration, J.S.C. and N.I. All authors have read and agreed to the published version of the manuscript.
Funding
This research is funded by the African Centre of Excellence, Energy for Sustainable Development, University of Rwanda, through the World Bank ACE II program.
Acknowledgments
The authors wish to thank the African Centre of Excellence, Energy for Sustainable Development, University of Rwanda, through the World Bank ACE II program for their support on this research. The views and opinions presented in this article are those of the authors and do not necessarily reflect the official policy or position of the World Bank. All errors and omissions are the authors alone.
Conflicts of Interest
The authors declare no conflict of interest for the research study.
Appendix A

Table A1.
Power curves of the BWT and the exiting commercial wind turbines compared.
| Wind Speed (m/s) | Power Output (kW) | ||||
|---|---|---|---|---|---|
| BWT 800 kW | Enercon E53 | Enercon E44 | EWT DW61 | GE SLE 1.5 | |
| 0.0 | 0 | 0 | 0 | 0 | 0 |
| 0.5 | 0 | 0 | 0 | 0 | 0 |
| 1.0 | 0 | 0 | 0 | 0 | 0 |
| 1.5 | 0 | 0 | 0 | 0 | 0 |
| 2.0 | 0 | 0 | 0 | 0 | 0 |
| 2.5 | 0 | 0 | 0 | 11 | 0 |
| 3.0 | 19 | 14 | 4 | 13 | 0 |
| 3.5 | 31 | 26 | 12 | 39 | 20 |
| 4.0 | 47 | 38 | 20 | 66 | 48 |
| 4.5 | 67 | 50 | 35 | 95 | 89 |
| 5.0 | 92 | 77 | 50 | 134 | 130 |
| 5.5 | 122 | 104 | 73 | 184 | 194 |
| 6.0 | 158 | 141 | 96 | 233 | 257 |
| 6.5 | 202 | 178 | 126 | 290 | 338 |
| 7.0 | 253 | 228 | 156 | 349 | 418 |
| 7.5 | 313 | 278 | 197 | 405 | 535 |
| 8.0 | 381 | 336 | 238 | 466 | 652 |
| 8.5 | 459 | 394 | 289 | 544 | 795 |
| 9.0 | 548 | 480 | 340 | 611 | 938 |
| 9.5 | 648 | 566 | 403 | 696 | 1071 |
| 10.0 | 760 | 645 | 466 | 789 | 1203 |
| 10.5 | 800 | 724 | 533 | 850 | 1277 |
| 11.0 | 800 | 744 | 600 | 886 | 1351 |
| 11.5 | 800 | 764 | 655 | 900 | 1394 |
| 12.0 | 800 | 780 | 710 | 900 | 1437 |
| 12.5 | 800 | 796 | 750 | 900 | 1459 |
| 13.0 | 800 | 800 | 790 | 900 | 1480 |
| 13.5 | 800 | 800 | 820 | 900 | 1488 |
| 14.0 | 800 | 800 | 850 | 900 | 1496 |
| 14.5 | 800 | 800 | 865 | 900 | 1498 |
| 15.0 | 800 | 800 | 880 | 900 | 1500 |
| 15.5 | 800 | 800 | 890 | 900 | 1500 |
| 16.0 | 800 | 800 | 900 | 900 | 1500 |
| 16.5 | 800 | 800 | 900 | 900 | 1500 |
| 17.0 | 800 | 800 | 900 | 900 | 1500 |
| 17.5 | 800 | 800 | 900 | 900 | 1500 |
| 18.0 | 800 | 800 | 900 | 900 | 1500 |
| 18.5 | 800 | 800 | 900 | 900 | 1500 |
| 19.0 | 800 | 800 | 900 | 900 | 1500 |
| 19.5 | 800 | 800 | 900 | 900 | 1500 |
| 20.0 | 800 | 800 | 900 | 900 | 1500 |
Table A2.
Annual Energy Production Calculation for Ati, Chad.
| Wind Speed (m/s) | Percent | Power Output (kW) | Energy Output (GWh) |
|---|---|---|---|
| 0.0 | 2.0 | 0 | 0 |
| 0.5 | 3.1 | 0 | 0 |
| 1.0 | 3.6 | 0 | 0 |
| 1.5 | 4.0 | 0 | 0 |
| 2.0 | 4.3 | 0 | 0 |
| 2.5 | 4.5 | 0 | 0 |
| 3.0 | 4.6 | 19 | 7570 |
| 3.5 | 4.6 | 31 | 12,648 |
| 4.0 | 4.6 | 47 | 18,983 |
| 4.5 | 4.5 | 67 | 26,669 |
| 5.0 | 4.5 | 92 | 35,746 |
| 5.5 | 4.3 | 122 | 46,184 |
| 6.0 | 4.2 | 158 | 57,895 |
| 6.5 | 4.0 | 202 | 70,727 |
| 7.0 | 3.8 | 253 | 84,479 |
| 7.5 | 3.6 | 313 | 98,907 |
| 8.0 | 3.4 | 381 | 113,731 |
| 8.5 | 3.2 | 459 | 128,652 |
| 9.0 | 3.0 | 548 | 143,359 |
| 9.5 | 2.8 | 648 | 157,542 |
| 10.0 | 2.6 | 760 | 170,898 |
| 10.5 | 2.4 | 800 | 165,621 |
| 11.0 | 2.2 | 800 | 151,809 |
| 11.5 | 2.0 | 800 | 138,504 |
| 12.0 | 1.8 | 800 | 125,770 |
| 12.5 | 1.6 | 800 | 113,658 |
| 13.0 | 1.5 | 800 | 102,204 |
| 13.5 | 1.3 | 800 | 91,432 |
| 14.0 | 1.2 | 800 | 81,360 |
| 14.5 | 1.0 | 800 | 71,994 |
| 15.0 | 0.9 | 800 | 63,338 |
| 15.5 | 0.8 | 800 | 55,385 |
| 16.0 | 0.7 | 800 | 48,126 |
| 16.5 | 0.6 | 800 | 41,547 |
| 17.0 | 0.5 | 800 | 35,625 |
| 17.5 | 0.4 | 800 | 30,337 |
| 18.0 | 0.4 | 800 | 25,653 |
| 18.5 | 0.3 | 800 | 21,538 |
| 19.0 | 0.3 | 800 | 17,955 |
| 19.5 | 0.2 | 800 | 14,864 |
| 20.0 | 0.2 | 800 | 12,018 |
Table A3.
Results of Intermediate Calculations.
| BWT 800 kW Results | AEP and LCOE Comparison between BWT and Other Commercial Wind Turbines | |||||||||||||||
|---|---|---|---|---|---|---|---|---|---|---|---|---|---|---|---|---|
| S/N | Selected African Cities | AEP (GWh) | Capacity Factor (%) | Annual ROI (%) | SPP (Years) | LCOE ($/kW) | Annual Energy Production (AEP) (GWh) | Levelized Cost of Electricity (LCOE) ($/kW) | ||||||||
| BWT 800 Kw | Enercon E53 | Enercon E44 | EWT DW61 | GE SLE 1.5 | BWT 800 kW | Enercon E53 | Enercon E44 | EWT DW61 | GE SLE 1.5 | |||||||
| 1 | Moundou | 0.82 | 12% | 2.38 | 5.92 | 0.12 | 0.82 | 1.04 | 0.79 | 1.44 | 1.90 | 0.12 | 0.12 | 0.40 | 0.19 | 0.25 |
| 2 | Bongor | 1.38 | 20% | 4.72 | 3.50 | 0.07 | 1.38 | 1.79 | 1.45 | 2.32 | 3.30 | 0.07 | 0.07 | 0.11 | 0.06 | 0.07 |
| 3 | Ati | 2.57 | 37% | 9.65 | 9.65 | 0.04 | 2.57 | 2.39 | 2.04 | 3.01 | 4.43 | 0.04 | 0.05 | 0.08 | 0.04 | 0.05 |
| 4 | Nakuru | 0.76 | 11% | 1.49 | 8.02 | 0.18 | 0.76 | 1.00 | 0.77 | 1.34 | 1.84 | 0.18 | 0.17 | 0.30 | 0.14 | 0.18 |
| 5 | Malindi | 0.94 | 14% | 2.08 | 6.49 | 0.15 | 0.94 | 1.28 | 0.93 | 1.76 | 2.35 | 0.15 | 0.14 | 0.25 | 0.11 | 0.14 |
| 6 | Garissa | 0.99 | 14% | 2.23 | 6.19 | 0.14 | 0.99 | 1.25 | 1.01 | 1.65 | 2.29 | 0.14 | 0.14 | 0.23 | 0.12 | 0.15 |
| 7 | Rabat | 1.00 | 14% | 0.36 | 14.73 | 0.12 | 1.00 | 1.26 | 1.00 | 1.68 | 2.30 | 0.12 | 0.12 | 0.19 | 0.09 | 0.12 |
| 8 | Fez | 0.83 | 12% | 0.12 | 17.85 | 0.14 | 0.83 | 1.03 | 0.86 | 1.33 | 1.89 | 0.14 | 0.14 | 0.22 | 0.12 | 0.15 |
| 9 | Tetouan | 1.90 | 27% | 1.58 | 7.76 | 0.06 | 1.90 | 2.34 | 2.07 | 2.89 | 4.34 | 0.06 | 0.06 | 0.09 | 0.05 | 0.06 |
| 10 | Walvis Bay | 1.14 | 16% | 1.12 | 9.45 | 0.12 | 1.14 | 1.41 | 1.16 | 1.85 | 2.60 | 0.12 | 0.12 | 0.19 | 0.10 | 0.12 |
| 11 | Katima Mulilo | 1.64 | 24% | 2.04 | 6.58 | 0.08 | 1.64 | 2.20 | 1.73 | 2.88 | 4.08 | 0.08 | 0.08 | 0.13 | 0.06 | 0.08 |
| 12 | Keetmanshoop | 1.80 | 26% | 2.35 | 5.98 | 0.07 | 1.80 | 2.30 | 1.93 | 2.93 | 4.27 | 0.07 | 0.07 | 0.11 | 0.06 | 0.07 |
| 13 | Kaduna | 1.41 | 20% | 0.41 | 14.14 | 0.15 | 1.41 | 1.85 | 1.50 | 2.39 | 3.42 | 0.15 | 0.14 | 0.24 | 0.12 | 0.14 |
| 14 | Jos Plateau | 1.39 | 20% | 3.18 | 4.78 | 0.10 | 1.39 | 1.84 | 1.44 | 2.43 | 3.39 | 0.10 | 0.09 | 0.15 | 0.08 | 0.09 |
| 15 | Ilorin | 0.73 | 11% | −0.27 | 27.25 | 0.28 | 0.73 | 0.99 | 0.76 | 1.31 | 1.82 | 0.28 | 0.26 | 0.45 | 0.21 | 0.27 |
| 16 | Kigali | 0.35 | 5% | 0.05 | 19.01 | 0.38 | 0.35 | 0.39 | 0.26 | 0.60 | 0.67 | 0.38 | 0.43 | 0.85 | 0.30 | 0.48 |
| 17 | Ruhengeri | 0.31 | 5% | −0.06 | 21.25 | 0.43 | 0.31 | 0.36 | 0.25 | 0.54 | 0.62 | 0.43 | 0.47 | 0.90 | 0.34 | 0.52 |
| 18 | Gisenyi | 0.32 | 5% | −0.05 | 21.04 | 0.42 | 0.32 | 0.38 | 0.29 | 0.54 | 0.68 | 0.42 | 0.44 | 0.78 | 0.34 | 0.48 |
| 19 | Arusha | 1.11 | 16% | 0.77 | 11.33 | 0.17 | 1.11 | 1.00 | 0.78 | 1.32 | 1.84 | 0.17 | 0.23 | 0.40 | 0.19 | 0.25 |
| 20 | Mbeya | 1.21 | 18% | 0.93 | 10.35 | 0.15 | 1.21 | 1.51 | 1.28 | 1.93 | 2.79 | 0.15 | 0.15 | 0.24 | 0.13 | 0.16 |
| 21 | Tabora | 1.11 | 16% | 0.77 | 11.33 | 0.17 | 1.11 | 1.43 | 1.11 | 1.93 | 2.62 | 0.17 | 0.16 | 0.28 | 0.13 | 0.17 |
References
- Fagbenle, R.O.; Katende, J.; Ajayi, O.O.; Okeniyi, J.O. Assessment of wind energy potential of two sites in North-East, Nigeria. Renew. Energy 2011, 36, 1277–1283. [Google Scholar] [CrossRef]
- Ochaeta, K. Energy Security and Sustainable Development Implications for Guatemala of the Electricity Generation Expansion Plan 2014–2028. Master’s Thesis, Uppsala University, Uppsala, Sweden, 2014. [Google Scholar]
- Pachauri, S.; Bew-Hammond, A.; Barnes, D.F.; Bouille, D.H.; Gitonga, S.; Modi, V.; Prasad, G.; Rath, A.; Zerriffi, H.; Dafrallah, T.; et al. Energy access for development. In Global Energy Assessment—Toward a Sustainable Future; Cambridge University Press: Cambridge, UK, 2012; Chapter 19; pp. 1401–1458. [Google Scholar]
- Powanga, L.; Giner-Reichl, I. China’s contribution to the African power sector: Policy implications for African countries. J. Energy 2019, 2019, 1–10. [Google Scholar] [CrossRef]
- International Energy Agency. Africa Energy Outlook 2019—Analysis Scenarios; Africa Energy Outlook Special Report; International Energy Agency: Paris, France, 2019; pp. 1–12. [Google Scholar]
- Lucas, P.L.; Dagnachew, A.G.; Hof, A.F. Towards Universal Electricity Access in Sub-Saharan Africa: A Quantitative Analysis of Technology and Investment Requirements; PBL Netherlands Environmental Assessment Agency: Hague, The Netherlands, 2017; pp. 1–58. [Google Scholar]
- Longa, F.D.; Strikkers, T.; Kober, T.; Van Der Zwaan, B. Advancing energy access modelling with geographic information system data. Environ. Model. Assess 2018, 23, 627–637. [Google Scholar] [CrossRef] [Green Version]
- Lee, K.; Brewer, E.; Christiano, C.; Meyo, F.; Miguel, E.; Podolsky, M.; Rosa, J.; Wolfram, C. Electrification for “under grid” households in rural Kenya. Dev. Eng. 2016, 1, 26–35. [Google Scholar] [CrossRef] [Green Version]
- Legros, G.; Havet, I.; Bruce, N.; Bonjour, S.; Rijal, K.; Takada, M.; Dora, C. The Energy Access Situation in Developing Countries: A Review Focusing on the Least Developed Countries and Sub-Saharan Africa; United Nations Development Programme: New York, NY, USA, 2009; pp. 1–142. [Google Scholar]
- International Renewable Energy Agency. Scaling Up Africa’s Renewable Energy Deployment: Detailed Overview of IRENA’s Engagement and Impact; International Renewable Energy Agency: Abu Dhabi, United Arab Emirates, 2020; pp. 1–82. [Google Scholar]
- Owusu, P.A.; Asumadu-Sarkodie, S. A review of renewable energy sources, sustainability issues and climate change mitigation. Cogent Eng. 2016, 3, 1–14. [Google Scholar] [CrossRef]
- Perera, F. Pollution from fossil-fuel combustion is the leading environmental threat to global pediatric health and equity: Solutions exist. Int. J. Environ. Res. Public Health 2018, 15, 16. [Google Scholar] [CrossRef] [PubMed] [Green Version]
- Adeyeye, K.; Ijumba, N.; Colton, J. Exploring the environmental and economic impacts of wind energy: A cost-benefit perspective. Int. J. Sustain. Dev. World Ecol. 2020, 27, 718–731. [Google Scholar]
- Mitchell, C. Momentum is increasing towards a flexible electricity system based on renewables. Nat. Energy 2016, 1, 1–6. [Google Scholar] [CrossRef]
- Ajayi, O.O. Assessment of utilization of wind energy resources in Nigeria. Energy Policy 2009, 37, 750–753. [Google Scholar] [CrossRef]
- Bouzarour-Amokrane, Y.; Tchangani, A.P.; Peres, F. Decision support system for wind farm installation using bipolar analysis. In Promoting Sustainable Practices through Energy Engineering and Asset Management; Engineering Science Reference, IGI Global: Hershey, PA, USA, 2015; pp. 1–21. [Google Scholar]
- Hafner, M.; Lucia de Strasser, T.S. Prospects for renewable energy in Africa. In Energy in Africa: Challenges and Opportunities; Hall, C., Ed.; Springer Nature Switzerland: Cham, Switzerland, 2018; Volume 8903, pp. 47–75. [Google Scholar]
- ESI Africa. The state of wind energy in Africa. Focus Renew. Energy 2018, 1, 1–10. [Google Scholar]
- Global Wind Energy Council. Global Wind Report, Annual Market Update 2010; Global Wind Energy Council: Brussels, Belgium, 2011; pp. 1–72. [Google Scholar]
- Global Wind Energy Council. Global Wind Report, Global Wind Report 2019; Global Wind Energy Council: Brussels, Belgium, 2020; pp. 1–78. [Google Scholar]
- Global Wind Atlas. Available online: https://www.globalwindatlas.info (accessed on 3 March 2020). Attribution 4.0 International (CC BY 4.0).
- Mentis, D. Wind Energy Assessment in Africa: A GIS-Based Approach. Master’s Thesis, KTH School of Industrial Engineering and Management Energy Technology, Stockholm, Sweden, 2013. [Google Scholar]
- Mukasa, A.D.; Mutambatsere, E.; Arvanitis, Y.; Triki, T. Development of Wind Energy in Africa; Working Paper Series No. 170; African Development Bank: Abidjan, Ivory Coast, 2013; pp. 1–43. [Google Scholar]
- Krohn, S.; Morthorst, P.; Awerbuch, S. The Economics of Wind Energy; The European wind energy association report; European Wind Energy Association Secretariat: Brussels, Belgium, 2009; pp. 1–156. [Google Scholar]
- Frankfurt School-UNEP Centre/BNEF. Global Trends in Renewable Energy Investment 2019; Frankfurt School-UNEP Centre/Bloomberg New Energy Finance: Frankfurt, Germany, 2019; pp. 1–76. [Google Scholar]
- Smoucha, E.A.; Fitzpatrick, K.; Buckingham, S.; Knox, O.G.G. Life cycle analysis of the embodied carbon emissions from 14 wind turbines with rated powers between 50 Kw and 3.4 Mw. J. Fundam. Renew. Energy Appl. 2016, 6, 1–10. [Google Scholar] [CrossRef] [Green Version]
- Chipindula, J.; Sai, V.; Botlaguduru, V. Life cycle environmental impact of onshore and offshore wind farms in Texas. Sustainability 2018, 10, 2022. [Google Scholar] [CrossRef] [Green Version]
- Ugur, E.; Elma, O.; Selamogullari, U.S.; Tanrioven, M.; Uzunoglu, M. Financial payback analysis of small wind turbines for a smart home application in Istanbul/Turkey. In Proceedings of the International Conference on Renewable Energy Research and Applications, Madrid, Spain, 20–23 October 2013; pp. 1–5. [Google Scholar]
- Eyerly, D. Does Wind Energy Pay for Itself? A Look at Wind Energy ROI. Discover Wind Energy. Available online: https://discoverwindenergy.com/does-wind-energy-pay-for-itself-a-look-at-wind-energy-roi/ (accessed on 20 June 2020).
- Rehman, S.; Alam, M.M.; Alhems, L.M.; Rafique, M.M. Horizontal axis wind turbine blade design methodologies for efficiency enhancement—A review. Energies 2018, 11, 506. [Google Scholar] [CrossRef] [Green Version]
- American Wind Energy Association. Size Specifications of Common Industrial Wind Turbines. Technical Specifications of Common Large Wind Turbines. Available online: http://aweo.org/windmodels.html (accessed on 26 June 2018).
- Barber Wind Turbines. Available online: https://www.barberwindturbines.com (accessed on 16 June 2020).
- Adeyeye, K.A. Design of a Wind Turbine for Prevalent Conditions in Africa for an Effective and Economic Power Generation. Ph.D. Thesis, University of Rwanda, Kigali, Rwanda, 2021. [Google Scholar]
- Topographic Maps. Available online: https://en-us.topographic-map.com (accessed on 19 July 2020). Attribution 4.0 International (CC BY 4.0).
- Abo-Khalil, A.G. Impacts of wind farms on power system stability. In Modeling and Control Aspects of Wind Power Systems; Muyeen, S.M., Al-Durra, A., Eds.; IntechOpen: London, UK, 2013; pp. 133–151. [Google Scholar]
- Cetinay, H.; Kuipers, F.A.; Guven, A.N. Optimal siting and sizing of wind farms. Renew. Energy 2017, 101, 51–58. [Google Scholar] [CrossRef] [Green Version]
- Akyuz, H.E.; Gamgam, H. Statistical Analysis of Wind Speed Data with Weibull, Lognormal and Gamma Distributions. Cumhur. Sci. J. 2017, 38, 68–76. [Google Scholar] [CrossRef]
- Ali, S.; Lee, S.; Jang, C. Techno-economic assessment of wind energy potential at three locations in South Korea using long-term measured wind data. Energies 2017, 10, 1442. [Google Scholar] [CrossRef] [Green Version]
- Ayodele, T.R.; Jimoh, A.A.; Munda, J.L.; Agee, J.T. Viability and economic analysis of wind energy resource for power generation in Johannesburg, South Africa. Int. J. Sustain. Energy 2014, 33, 284–303. [Google Scholar] [CrossRef]
- Ruslau, M.F.V.; Silubun, H.C.A. Analysis of Wind Speed Distribution at the Mopah Airport in Merauke. Atl. Highlights Eng. 2018, 1, 958–963. [Google Scholar]
- Adaramola, M.S.; Paul, S.S.; Oyedepo, S.O. Assessment of electricity generation and energy cost of wind energy conversion systems in North-Central Nigeria. Energy Convers. Manag. 2011, 52, 3363–3368. [Google Scholar] [CrossRef]
- Bhakta, S.; Mukherjee, V.; Shaw, B. Techno-economic analysis and performance assessment of standalone photovoltaic/wind/hybrid power system in Lakshadweep islands of India. J. Renew. Sustain. Energy 2015, 7, 063117. [Google Scholar] [CrossRef]
- Gul, M.; Tai, N.; Huang, W.; Nadeem, M.H.; Yu, M. Assessment of wind power potential and economic analysis at Hyderabad in Pakistan: Powering to local communities using wind power. Sustainability 2019, 11, 1391. [Google Scholar] [CrossRef] [Green Version]
- Rodriguez-Hernandez, O.; Martinez, M.; Lopez-villalobos, C.; Garcia, H.; Campos-Amezcua, R. Techno-Economic Feasibility Study of Small Wind Turbines in the Valley of Mexico Metropolitan Area. Energies 2019, 12, 890. [Google Scholar] [CrossRef] [Green Version]
- Dalabeeh, A.S.K. Techno-economic analysis of wind power generation for selected locations in Jordan. Renew. Energy 2017, 101, 1369–1378. [Google Scholar]
- Celik, A.N. A Techno-Economic Analysis of Wind Energy in Southern Turkey. Int. J. Green Energy 2007, 4, 37–41. [Google Scholar] [CrossRef]
- Ling, J.; Lublertlop, K. Economic Analysis of Wind Turbine Installation in Taiwan. Math. Probl. Eng. 2015, 2015, 1–9. [Google Scholar] [CrossRef]
- Ohunakin, O.S.; Oyewola, O.M.; Adaramola, M.S. Economic analysis of wind energy conversion systems using levelized cost of electricity and present value cost methods in Nigeria. Int. J. Energy Environ. Eng. 2013, 4, 2–9. [Google Scholar] [CrossRef] [Green Version]
- Manwell, J.F.; McGowan, J.G.; Rogers, A.L. Wind Energy Explained Theory, Design and Application, 2nd ed.; John Wiley & Sons Ltd.: West Sussex, UK, 2009; pp. 1–705. [Google Scholar]
- Rahimi, S.; Meratizaman, M.; Monadizadeh, S.; Amidpour, M. Techno-economic analysis of wind turbine e PEM (polymer electrolyte membrane) fuel cell hybrid system in standalone area. Energy 2014, 67, 381–396. [Google Scholar] [CrossRef]
- Charrouf, O.; Betka, A.; Becherif, M.; Tabanjat, A. Techno-economic analysis of wind turbines in Algeria. Int. J. Emerg. Electr. Power Syst. 2018, 2018, 1–13. [Google Scholar] [CrossRef]
- Neill, S.P.; Hashemi, M.R. Introduction. In Fundamentals of Ocean Renewable Energy; Elsevier: Amsterdam, The Netherlands, 2018; pp. 1–30. [Google Scholar]
- Rhodes, J.D.; King, C.; Gulen, G.; Olmstead, S.M.; Dyer, J.S.; Hebner, R.E.; Beach, F.C.; Edgar, T.F.; Webber, M.E. A geographically resolved method to estimate levelized power plant costs with environmental externalities. Energy Policy 2017, 102, 491–499. [Google Scholar] [CrossRef]
- Bakhshi, R.; Sandborn, P.A. Return on investment model for the implementation of new technologies on wind turbines. IEEE Trans. Sustain. Energy 2017, 3029, 1–8. [Google Scholar] [CrossRef]
- Gorshkov, A.S.; Vatin, N.I.; Rymkevich, P.P.; Kydrevich, O.O. Payback period of investments in energy saving. Mag. Civ. Eng. 2018, 78, 65–75. [Google Scholar]
- Botchkarev, A. Estimating the accuracy of the return on investment (ROI) performance evaluations. Interdiscip. J. Inf. Knowl. Manag. 2015, 10, 217–233. [Google Scholar] [CrossRef] [Green Version]
- Siyal, S.H. Techno-Economic Assessment of Wind Energy for Renewable Hydrogen Production in Sweden. Master’s Thesis, KTH Royal Institute of Technology, Stockholm, Sweden, 2019. [Google Scholar]
- Bandoc, G.; Prăvălie, R.; Patriche, C.; Degeratu, M. Spatial Assessment of Wind Power Potential at Global Scale: A Geographical Approach. J. Clean. Prod. 2018, 200, 1065–1086. [Google Scholar] [CrossRef]
- González-Aparicio, I.F.; Monforti, P.V.; Zucker, A.; Careri, F.; Huld, T.; Badger, J. Simulating European Wind Power Generation Applying Statistical Downscaling to Reanalysis Data. Appl. Energy 2017, 199, 155–168. [Google Scholar] [CrossRef]
- Technical University of Denmark (DTU). WAsP by DTU Wind Energy. 2020. Available online: https://www.wasp.dk (accessed on 11 July 2020).
- Barber, G.; Greenville, SC 29607, USA. Barber Wind Turbines. Personal Communication, 2018. [Google Scholar]
- Trading Economics. Interest Rates. Available online: https://tradingeconomics.com/countries (accessed on 5 February 2020).
- Statista. International Statistics and Market Data. Available online: https://0-www-statista-com.brum.beds.ac.uk/markets/422/international/ (accessed on 31 August 2020).
- Global Petrol Prices. Electricity prices for households, December 2019. Electricity Prices. Available online: https://www.globalpetrolprices.com/electricity_prices/ (accessed on 5 February 2020).
- Boccard, N. Capacity factor of wind power: Realized values vs. estimates. Energy Policy 2009, 37, 2679–2688. [Google Scholar] [CrossRef]
- Center for Sustainable Systems, University of Michigan. Wind Energy Factsheet 2019, CSS07–CSS09; University of Michigan: Ann Arbor, MI, USA, 2020; pp. 1–2. [Google Scholar]
- IRENA. Future of Wind: Deployment, Investment, Technology, Grid Integration and Socio-Economic Aspects (A Global Energy Transformation Paper); International Renewable Energy Agency: Abu Dhabi, United Arab Emirates, 2019; pp. 1–88. [Google Scholar]
- Diyoke, C. A new approximate capacity factor method for matching wind turbines to a site: Case study of Humber region, UK. Int. J. Energy Environ. Eng. 2019, 10, 451–462. [Google Scholar] [CrossRef] [Green Version]
- Royal, J.; O’Shea, A. What Is the Average Stock Market Return? NerdWallet 1–4. Available online: https://www.nerdwallet.com/blog/investing/average-stock-market-return (accessed on 25 July 2021).
- Vandenboss, K. Finding a Good Return on Investment. Millionacres 1–10. Available online: https://www.fool.com/millionacres/real-estate-investing/finding-good-return-investment/# (accessed on 20 July 2020).
- Kenton, W.; James, M. Return on Invested Capital (ROIC). Investopedia 1–8. Available online: https://www.investopedia.com/terms/r/returnoninvestmentcapital.asp (accessed on 20 July 2020).
- Nelson, D.; O’Connell, B.; de Lorenzo, L.; Huxham, M. European Renewable Energy Policy and Investment; Climate Policy Initiative: San Francisco, CA, USA, 2016; pp. 1–108. [Google Scholar]
- Blanco, I. The economics of wind energy. Renew. Sustain. Energy Rev. 2009, 13, 1372–1382. [Google Scholar] [CrossRef]
- How Much Do Wind Turbines Cost and Where Can I Get Funding? Available online: https://www.local.gov.uk/how-much-do-wind-turbines-cost-and-where-can-i-get-funding (accessed on 28 May 2020).
- Keizer, D.; Crijns-Graus, W.; Harmsen, R. Renewable electricity in Kenya. Master’s Thesis, Utrecht University, Utrecht, The Netherlands, 2017. [Google Scholar]
- Henbest, S.; Mills, L.; Orlandi, A.; Serhal, A.; Pathania, R. Levelized Cost of Electricity: DFID Priority Countries Possible Policy Conclusions; Bloomberg New Energy Finance: London, UK, 2015; pp. 1–83. [Google Scholar]
- Mburu, A. Solar + Battery Energy Storage vs. Diesel in East Africa. Powergen International. Available online: https://www.renewableenergyworld.com/2020/04/10/solar-battery-energy-storage-vs-diesel-in-east-africa/#gref (accessed on 31 July 2020).
- Suphachalasai, S.; Touati, M.; Ackerman, F.; Knight, P.; Glick, D.; Horowitz, A.; Rogers, J.A.; Amegroud, T. Emission Reductions from Energy Subsidies Reform and Renewable Energy Policy; World Bank Group, Morocco Energy Policy MRV: Morroco, Tunisia, 2018; pp. 1–62. [Google Scholar]
- Tsagas, I. Morocco: 170 MW of solar PV at €0.042/kWh; PV Magazine, 13 January 2017. [Google Scholar]
- United Nations. Data from: Energy Profile: Morocco. UN Environment Document Repository. 2017. Available online: https://www.pv-magazine.com/2017/01/13/morocco-170-mw-of-solar-pv-at-e0-042-per-kwh/ (accessed on 20 July 2020).
- Le Fol, Y.; Ndhlukula, K. Potential and future of concentrating solar power in Namibia. J. Energy S. Afr. 2013, 24, 90–98. [Google Scholar] [CrossRef]
- Stiftung, K.A. Namibia’s Energy Future: A Case for Renewables; Konrad Adenauer Stiftung: Windhoek, Namibia, 2012; pp. 1–116. [Google Scholar]
- Henbest, S.; Mills, L.; Orlandi, I.; Serhal, A.; Pathania, R. Levelized Cost of Electricity: DFID 28 Priority Countries; Bloomberg New Energy Finance: London, UK, 2015; pp. 1–21. [Google Scholar]
- Ogunnubi, O.A.; Overbye, T.J. An economic valuation of solar energy potential in Nigeria. In Proceedings of the 2015 IEEE Power and Energy Conference, London, ON, Canada, 26–28 October 2015; pp. 1–7. [Google Scholar]
- IRENA. Renewables Readiness Assessment in the United Republic of Tanzania; International Renewable Energy Agency: Abu Dhabi, United Arab Emirates, 2017; pp. 1–68. [Google Scholar]
- Jahangiri, M.; Soulouknga, M.H.; Bardei, F.K.; Shamsabadi, A.A.; Akinlabi, E.T.; Sichilalu, S.M.; Mostafaeipour, A. Techno-econo-environmental optimal operation of grid-wind-solar electricity generation with hydrogen storage system for domestic scale, case study in Chad. Int. J. Hydrogen Energy 2019, 44, 28613–28628. [Google Scholar] [CrossRef]
- Issak, M.B. Analyzing the Cost of Electricity for Solarpv—Diesel Hybrid Generation for Sub-Regional Hospital Electrification in Dourbali District, Chad. Master’s Thesis, Pan African University Institute of Water and Energy Sciences, Tlemcen, Algeria, 2018. [Google Scholar]
- Charabi, Y.; Abdul-Wahab, S. Wind turbine performance analysis for energy cost minimization. Renew. Wind. Water Sol. 2020, 7, 1–11. [Google Scholar] [CrossRef]
- Tank, V.; Bhutka, J.; Harinarayana, T. Wind Energy Generation and Assessment of Resources in India. J. Power Energy Eng. 2016, 4, 25–38. [Google Scholar] [CrossRef] [Green Version]
- Zhan, L.; Letizia, S.; Iungo, G.V. Wind LiDAR Measurements of Wind Turbine Wakes Evolving Over Flat and Complex Terrains: Ensemble Statistics of the Velocity Field. J. Phys. Conf. Ser. 2020, 1452, 1–12. [Google Scholar] [CrossRef]
- Astanei, D.; Nemes, C.; Munteanu, F.; Ciobanu, A. Annual energy production estimation based on wind speed distribution. In Proceedings of the 2016 International Conference and Exposition on Electrical and Power Engineering, EPE 2016, European Union, Iași, Romania, 20–22 October 2016; pp. 862–867. [Google Scholar]
Figure 1.
(left) Wind speed distribution in SSA; (right) Wind power density distribution in SSA [21].
Figure 1.
(left) Wind speed distribution in SSA; (right) Wind power density distribution in SSA [21].

Figure 2.
(left) Current design and (right) the power curve of the BWT [32] reproduced by permission.
Figure 2.
(left) Current design and (right) the power curve of the BWT [32] reproduced by permission.

Figure 3.
Wind Energy Techno-economic Model Framework: WT-wind turbine.

Figure 4.
Selected cities on the African network grid map.

Figure 5.
Energy production estimation of Ati, Chad.

Figure 6.
Annual energy production and capacity factor for the FWT design for the selected African cities (Column = Annual Energy Production; Circle = Capacity Factor).
Figure 6.
Annual energy production and capacity factor for the FWT design for the selected African cities (Column = Annual Energy Production; Circle = Capacity Factor).

Figure 7.
Annualized return on investment and Simple Payback period of the FWT in the selected African cities.
Figure 7.
Annualized return on investment and Simple Payback period of the FWT in the selected African cities.

Figure 8.
Annualized return on investment and Simple Payback period of the FWT in the selected African cities.
Figure 8.
Annualized return on investment and Simple Payback period of the FWT in the selected African cities.

Figure 9.
Levelized cost of electricity on the FWT and its relationship with cost of electricity in the selected African cities (Square = FWT Levelized Cost of Electricity; Circle = Cost of Electricity).
Figure 9.
Levelized cost of electricity on the FWT and its relationship with cost of electricity in the selected African cities (Square = FWT Levelized Cost of Electricity; Circle = Cost of Electricity).

Figure 10.
Comparison of (a) Annual Energy production and (b) Levelized Cost of Electricity between BWT and other existing commercial wind turbines.
Figure 10.
Comparison of (a) Annual Energy production and (b) Levelized Cost of Electricity between BWT and other existing commercial wind turbines.

Table 1.
Case study countries, selection criteria, selected African cities, latitude and longitude, and altitude [21,34].
| African Countries | Location | Selection Criteria | Cities | Latitude N(+)/S(−) | Longitude E(+)/W(−) | Altitude (m) |
|---|---|---|---|---|---|---|
| Chad | North-Central Africa | High wind energy resource and ranks second among Sahel countries | Moundou | 8.567 | 16.083 | 413 |
| Bongor | 10.281 | 15.372 | 315 | |||
| Ati | 13.215 | 18.335 | 294 | |||
| Kenya | Eastern Africa | High wind energy resource and one of the leading wind energy markets in Africa | Nakuru | −0.307 | 36.072 | 1850 |
| Malindi | −3.218 | 40.117 | 26 | |||
| Garissa | −0.453 | 39.646 | 1138 | |||
| Morocco | Northern Africa | Borders Mediterranean Sea | Rabat | 34.013 | −6.833 | 160 |
| Fez | 34.033 | −5.000 | 410 | |||
| Tetouan | 35.578 | −5.368 | 205 | |||
| Namibia | Southern Africa | Dominated by Namib desert and situated close to Kalahari desert. | Walvis Bay | −22.957 | 14.505 | 6 |
| Katima Mulilo | −17.500 | 24.267 | 950 | |||
| Keetmanshoop | −26.583 | 18.133 | 1064 | |||
| Nigeria | Western Africa | Located in the Sahel region | Kaduna | 10.526 | 7.439 | 250 |
| Jos Plateau | 9.928 | 8.892 | 1217 | |||
| Ilorin | 8.497 | 4.542 | 343 | |||
| Rwanda | Eastern/Central Africa | Has very low annual mean wind speed | Kigali | −1.950 | 30.059 | 1567 |
| Ruhengeri | −1.500 | 29.635 | 1842 | |||
| Gisenyi | −1.703 | 29.256 | 1481 | |||
| Tanzania | Eastern Africa | Located along the coastline of Indian ocean | Arusha | −3.367 | 36.683 | 1400 |
| Mbeya | −8.900 | 33.45 | 1700 | |||
| Tabora | −5.016 | 32.827 | 1200 |
Table 2.
Geometry and technical specifications of the BWT design [61].
Table 2.
Geometry and technical specifications of the BWT design [61].
| Wind turbine diameter (meters, feet) | 61 (200) |
| Wind turbine rated power (kW) | 800 |
| Swept area (sq m) | 2922 |
| Capital cost of wind turbine (USD) | 1,400,000 |
| Operation and Maintenance cost per year (USD) | 42,000 |
| Wind turbine lifetime (years) | 20 |
| Rated wind speed (m/s) | 10.4 |
| Cut-in speed (m/s) | 3 |
| Cut-out out speed (m/s) | 20 |
| City | Hub Height (m) | Cost of Electricity per kWh (USD) | Yearly Interest Rate (%) | Inflation Rate (%) |
|---|---|---|---|---|
| Moundou | 513 | 0.29 | 3.4 | 2.24 |
| Bongor | 415 | 0.29 | 3.4 | 2.24 |
| Ati | 394 | 0.29 | 3.4 | 2.24 |
| Nakuru | 1950 | 0.23 | 7.75 | 5.10 |
| Malindi | 126 | 0.23 | 7.75 | 5.10 |
| Garissa | 1238 | 0.23 | 7.75 | 5.10 |
| Rabat | 260 | 0.10 | 5.34 | 0.30 |
| Fez | 510 | 0.10 | 5.34 | 0.30 |
| Tetouan | 305 | 0.10 | 5.34 | 0.30 |
| Walvis Bay | 106 | 0.13 | 7.03 | 2.43 |
| Katima Mulilo | 1050 | 0.13 | 7.03 | 2.43 |
| Keetmanshoop | 1164 | 0.13 | 7.03 | 2.43 |
| Kaduna | 350 | 0.07 | 13.5 | 13.39 |
| Jos Plateau | 1317 | 0.07 | 13.5 | 13.39 |
| Ilorin | 443 | 0.07 | 13.5 | 13.39 |
| Kigali | 1667 | 0.21 | 7.14 | 6.90 |
| Ruhengeri | 1942 | 0.21 | 7.14 | 6.90 |
| Gisenyi | 1581 | 0.21 | 7.14 | 6.90 |
| Arusha | 1500 | 0.11 | 11.94 | 3.86 |
| Mbeya | 1800 | 0.11 | 11.94 | 3.86 |
| Tabora | 1300 | 0.11 | 11.94 | 3.86 |
Table 4.
Technical specifications and cost of acquisition and maintenance of BWT and existing wind turbines [88,89,90,91].
| Manufacturer | Power Output (kW) | Rotor Diameter (m) | Swept Area (m2) | Rated Wind Speed (m/s) | Cut-in Speed (m/s) | Cut-Out Speed (m/s) | Capital Cost of Acquisition | Operation and Maintenance Cost per Year |
|---|---|---|---|---|---|---|---|---|
| Enercon E53 | 800 | 52.9 | 2198 | 13 | 3 | 25 | $1,750,000 | $ 51,250 |
| Enercon E44 | 900 | 44.0 | 1521 | 16.5 | 3 | 34 | $ 2,337,500 | $ 51,250 |
| EWT DW61 | 900 | 61 | 2923 | 10 | 2.5 | 25 | $ 1,918,770 | $ 57,158 |
| GE SLE 1.5 | 1500 | 77 | 4657 | 14 | 3.5 | 25 | $ 3,375,000 | $ 87,500 |
| BWT 800 | 800 | 61 | 2923 | 9.6 | 3 | 20 | $ 1,400,000 | $ 42,000 |
Publisher’s Note: MDPI stays neutral with regard to jurisdictional claims in published maps and institutional affiliations. |
© 2021 by the authors. Licensee MDPI, Basel, Switzerland. This article is an open access article distributed under the terms and conditions of the Creative Commons Attribution (CC BY) license (https://creativecommons.org/licenses/by/4.0/).
Share and Cite
MDPI and ACS Style
Adeyeye, K.A.; Ijumba, N.; Colton, J.S. A Techno-Economic Model for Wind Energy Costs Analysis for Low Wind Speed Areas. Processes 2021, 9, 1463. https://0-doi-org.brum.beds.ac.uk/10.3390/pr9081463
AMA Style
Adeyeye KA, Ijumba N, Colton JS. A Techno-Economic Model for Wind Energy Costs Analysis for Low Wind Speed Areas. Processes. 2021; 9(8):1463. https://0-doi-org.brum.beds.ac.uk/10.3390/pr9081463
Chicago/Turabian StyleAdeyeye, Kehinde A., Nelson Ijumba, and Jonathan S. Colton. 2021. "A Techno-Economic Model for Wind Energy Costs Analysis for Low Wind Speed Areas" Processes 9, no. 8: 1463. https://0-doi-org.brum.beds.ac.uk/10.3390/pr9081463
Note that from the first issue of 2016, this journal uses article numbers instead of page numbers. See further details here.