Article

Preparation of Slow-Release Insecticides from Biogas Slurry: Effectiveness of Ion Exchange Resin in the Adsorption and Release of Ammonia Nitrogen

1
Key Laboratory of New Materials and Equipment for Renewable Energy, Ministry of Agriculture and Rural Affairs, Henan Agricultural University, Zhengzhou 450002, China
2
Institute of Modern Agricultural Engineering, Huanghe S&T University, Zhengzhou 450006, China
3
Institute of Atmospheric Pollution Research, National Research Council of Italy, 29300 Rome, Italy
*
Author to whom correspondence should be addressed.
Submission received: 6 July 2021 / Revised: 12 August 2021 / Accepted: 16 August 2021 / Published: 21 August 2021
(This article belongs to the Special Issue New Processes: Working towards a Sustainable Society)

Abstract

:
The insecticidal ingredient in a biogas solution being fully utilized by cation exchange resin to produce slow-release insecticide is of great social value. In this work, the feasibility of ammonia nitrogen in a biogas slurry loaded on resin as a slow-release insecticide was evaluated by studying the effect of adsorption and the slow release of ammonia nitrogen by resin. The effects of the ammonia nitrogen concentration, resin dosage, adsorption time and pH value on the ammonia nitrogen adsorption by the resin were studied. The results showed that the ion exchange resin had a good adsorption effect on the ammonia nitrogen. With the increase of the resin dosage, time and ammonia nitrogen concentration, the adsorption capacity increased at first and then stabilized. The ammonia nitrogen adsorption capacity reached its maximum value (1.13 mg) when the pH value was 7. The adsorption process can be fitted well by the Langmuir isothermal adsorption equation and quasi-second-order kinetic model. Additionally, the release rate of the ammonia nitrogen increased with the increasing sodium chloride concentration. The adsorption capacity of ammonia nitrogen by the D113 (resin type) resin decreased by 15.8% compared with the ammonium chloride solution. The report shows that the ion exchange resin has a good adsorption effect on ammonia nitrogen, which is of guiding significance for expanding the raw materials for slow-release insecticides, improving the utilization rate of biogas slurry and cleaner production of slow-release insecticides from biogas slurry. Additionally, all variables showed statistical differences (p < 0.05).

1. Introduction

Agriculture is a basic industry for national development, and it concerns the fundamental interests of the people [1]. Since the twentieth century, pesticides have been used in pursuit of crop yield, which has made great contributions to agricultural production, yet many of its shortcomings have been found in the process of use, such as causing the serious destruction of the ecological environment [2], the deterioration of soil properties [3], the pollution of water resources, the increase in pest resistance [4] and the damage to the health of people [5]. In the meantime, 90% of pesticides are lost due to osmotic action [6], resulting in a significant reduction of the pesticide utilization rate. It is extremely important to solve these problems in the development of agriculture, and the search for economical, environmentally friendly and highly effective insecticides has attracted more attention [7]. Recently, the insecticidal effect of biogas slurry has been studied.
Biogas slurry is the residue tail liquid after anaerobic fermentation of biomass, which has the function of promoting the growth and reproduction of animals and plants [8] and killing insects because it is rich in a variety of nutrients and ammonia nitrogen [9]. Biogas slurry has a remarkable effect on the control of aphids and red spiders in fruits and vegetables [10]. The full and rational utilization of biogas slurry can produce huge economic benefits. Until now, many areas have begun to directly use clean and low-cost biogas slurry to kill insects, which results in wasting some nutrients and is less efficient than other synthetic pesticides [11]. The common practice is to mix biogas slurry with other pesticides to further improve insecticidal efficiency [12]. This still does not solve the problem of nutrient waste. Slow-release pesticides are currently the more popular method [13] to improve the utilization efficiency of pesticides and reduce the pollution to the environment via reducing pesticide dosages, pesticide spraying frequency and prolonging the effective duration [14]. The combination of biogas slurry and slow-release technology is an interesting research direction, and there have been no such reports yet. To date, a variety of slow-release types have been developed, including microcapsule, inclusion, homogeneous and adsorption [15]. Among these, adsorption is widely used because of its low cost and easy operation.
A lot of slow-release carriers have been developed, such as nanoparticles [16], polymer material [17], bentonite and zeolite. Cation exchange resin can effectively adsorb cations from a solution and slowly release the adsorbed substances under certain conditions as a common adsorbent [18]. Chen et al. found that the maximum exchange capacity of lead (II) adsorbed by lignin-based cation exchange resin was 2.26 mmol/g [19], which was comparable to a phenol cation exchange resin. Daisuke et al. found a new method to remove Se(IV) using an Fe3+ ion exchange resin [20], and the Se was effectively removed using a column packed with 12.8 g (10.4 cm3) of adsorbent. Leng et al. used a cation exchange resin to remove iron from phosphoric acid and determined that the quasi-second-order kinetic model perfectly described the adsorption process [21]. Goutham R. et al. developed a polymer matrix film loaded with a combination of free diclofenac sodium and an ion exchange resin complex to achieve an immediate and slow release [22]. Atyabi et al. developed an effective sustained release system in which bicarbonate and other drugs are loaded on ion exchange resins [23], and the cation exchange resin can also efficiently adsorb ammonia nitrogen such that the efficiency is more than 90% [24]. To sum up, cation exchange resin has great potential for adsorbing ammonia nitrogen from biogas slurry to produce sustained release insecticides due to the high-efficiency adsorption of ammonia nitrogen.
In this study, D113 (resin type) macroporous weak acid acrylic cation exchange resin was selected, which is easier to regenerate than strongly acidic cation exchange resin and has good ion exchange performance (the schematic diagram of adsorption and release is shown in Figure 1). The adsorption capacity of the resin for ammonia nitrogen under different conditions was studied by the static adsorption method. The adsorption process and type were determined by fitting, and the effects of adsorption of ammonia nitrogen in the ammonium chloride solution and biogas slurry were compared. Slow-release studies were carried out. These revealed the correlation between the resin dosage, ammonia nitrogen concentration, adsorption time, adsorption temperature, pH value and ammonia nitrogen adsorption capacity and the characteristics of a slow release. The adsorption process parameters of the D113 macroporous weak acid acrylic cation exchange resin were optimized, which could provide scientific reference for the further research and development of technologies of efficient and environmentally friendly slow-release ecological insect repellent. The experimental results provide technical support for the harmless treatment of biogas slurry, and the use of pesticides will be reduced in the process of agricultural production, which is beneficial to the clean production of green agriculture and the health of humans and livestock.

2. Material and Methods

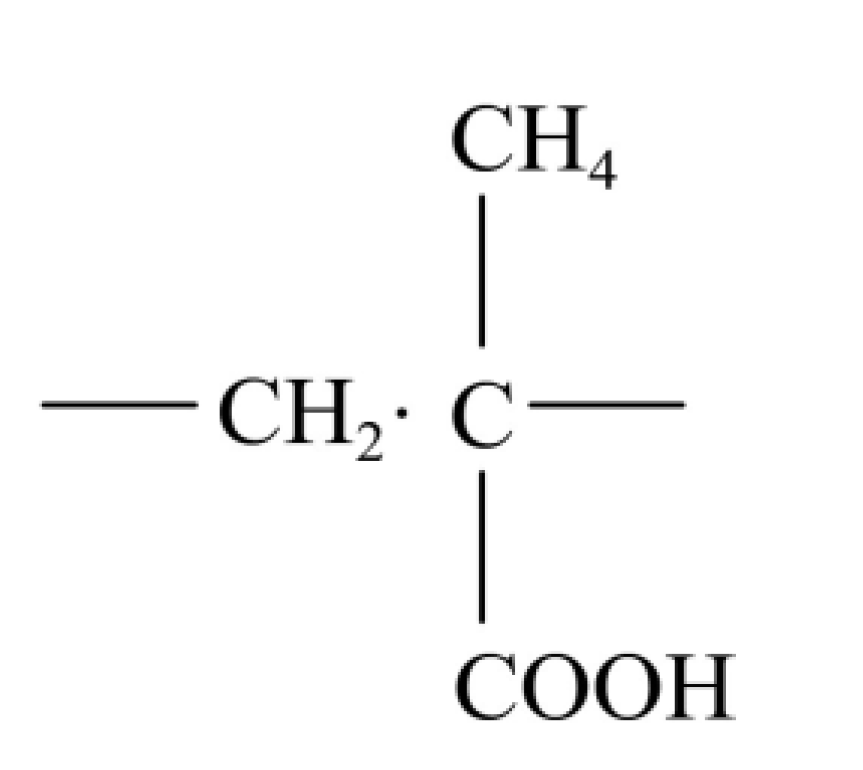
2.1. Experimental Materials

The D113 macroporous weak acid acrylic cation exchange resin (Shanxi Lanshen Special Resin Co. Ltd., Xian, China) was selected for this study, and the molecular structure diagram is shown in Figure 2. The resin was soaked in a 1.8 mol/L NaCl solution for 24 h and washed with ammonia-free water. Then, the resin was soaked in a 0.5 mol/L HCl solution for 10 h to remove inorganic impurities and repeatedly washed with ammonia-free water to neutrality. After being soaked in a 1 mol/L NaOH solution for 10 h to remove organic impurities, the resin was washed repeatedly with ammonia-free water to neutrality and dried in a drying oven (Beijing Zhongxi Yuanda Technology Co., Ltd., Shenyang, China) at 55 °C for use.
The biogas slurry was obtained from the anaerobic reactor using straw and pig manure as raw materials, and the ammonia nitrogen concentration was 432.43 mg/L.

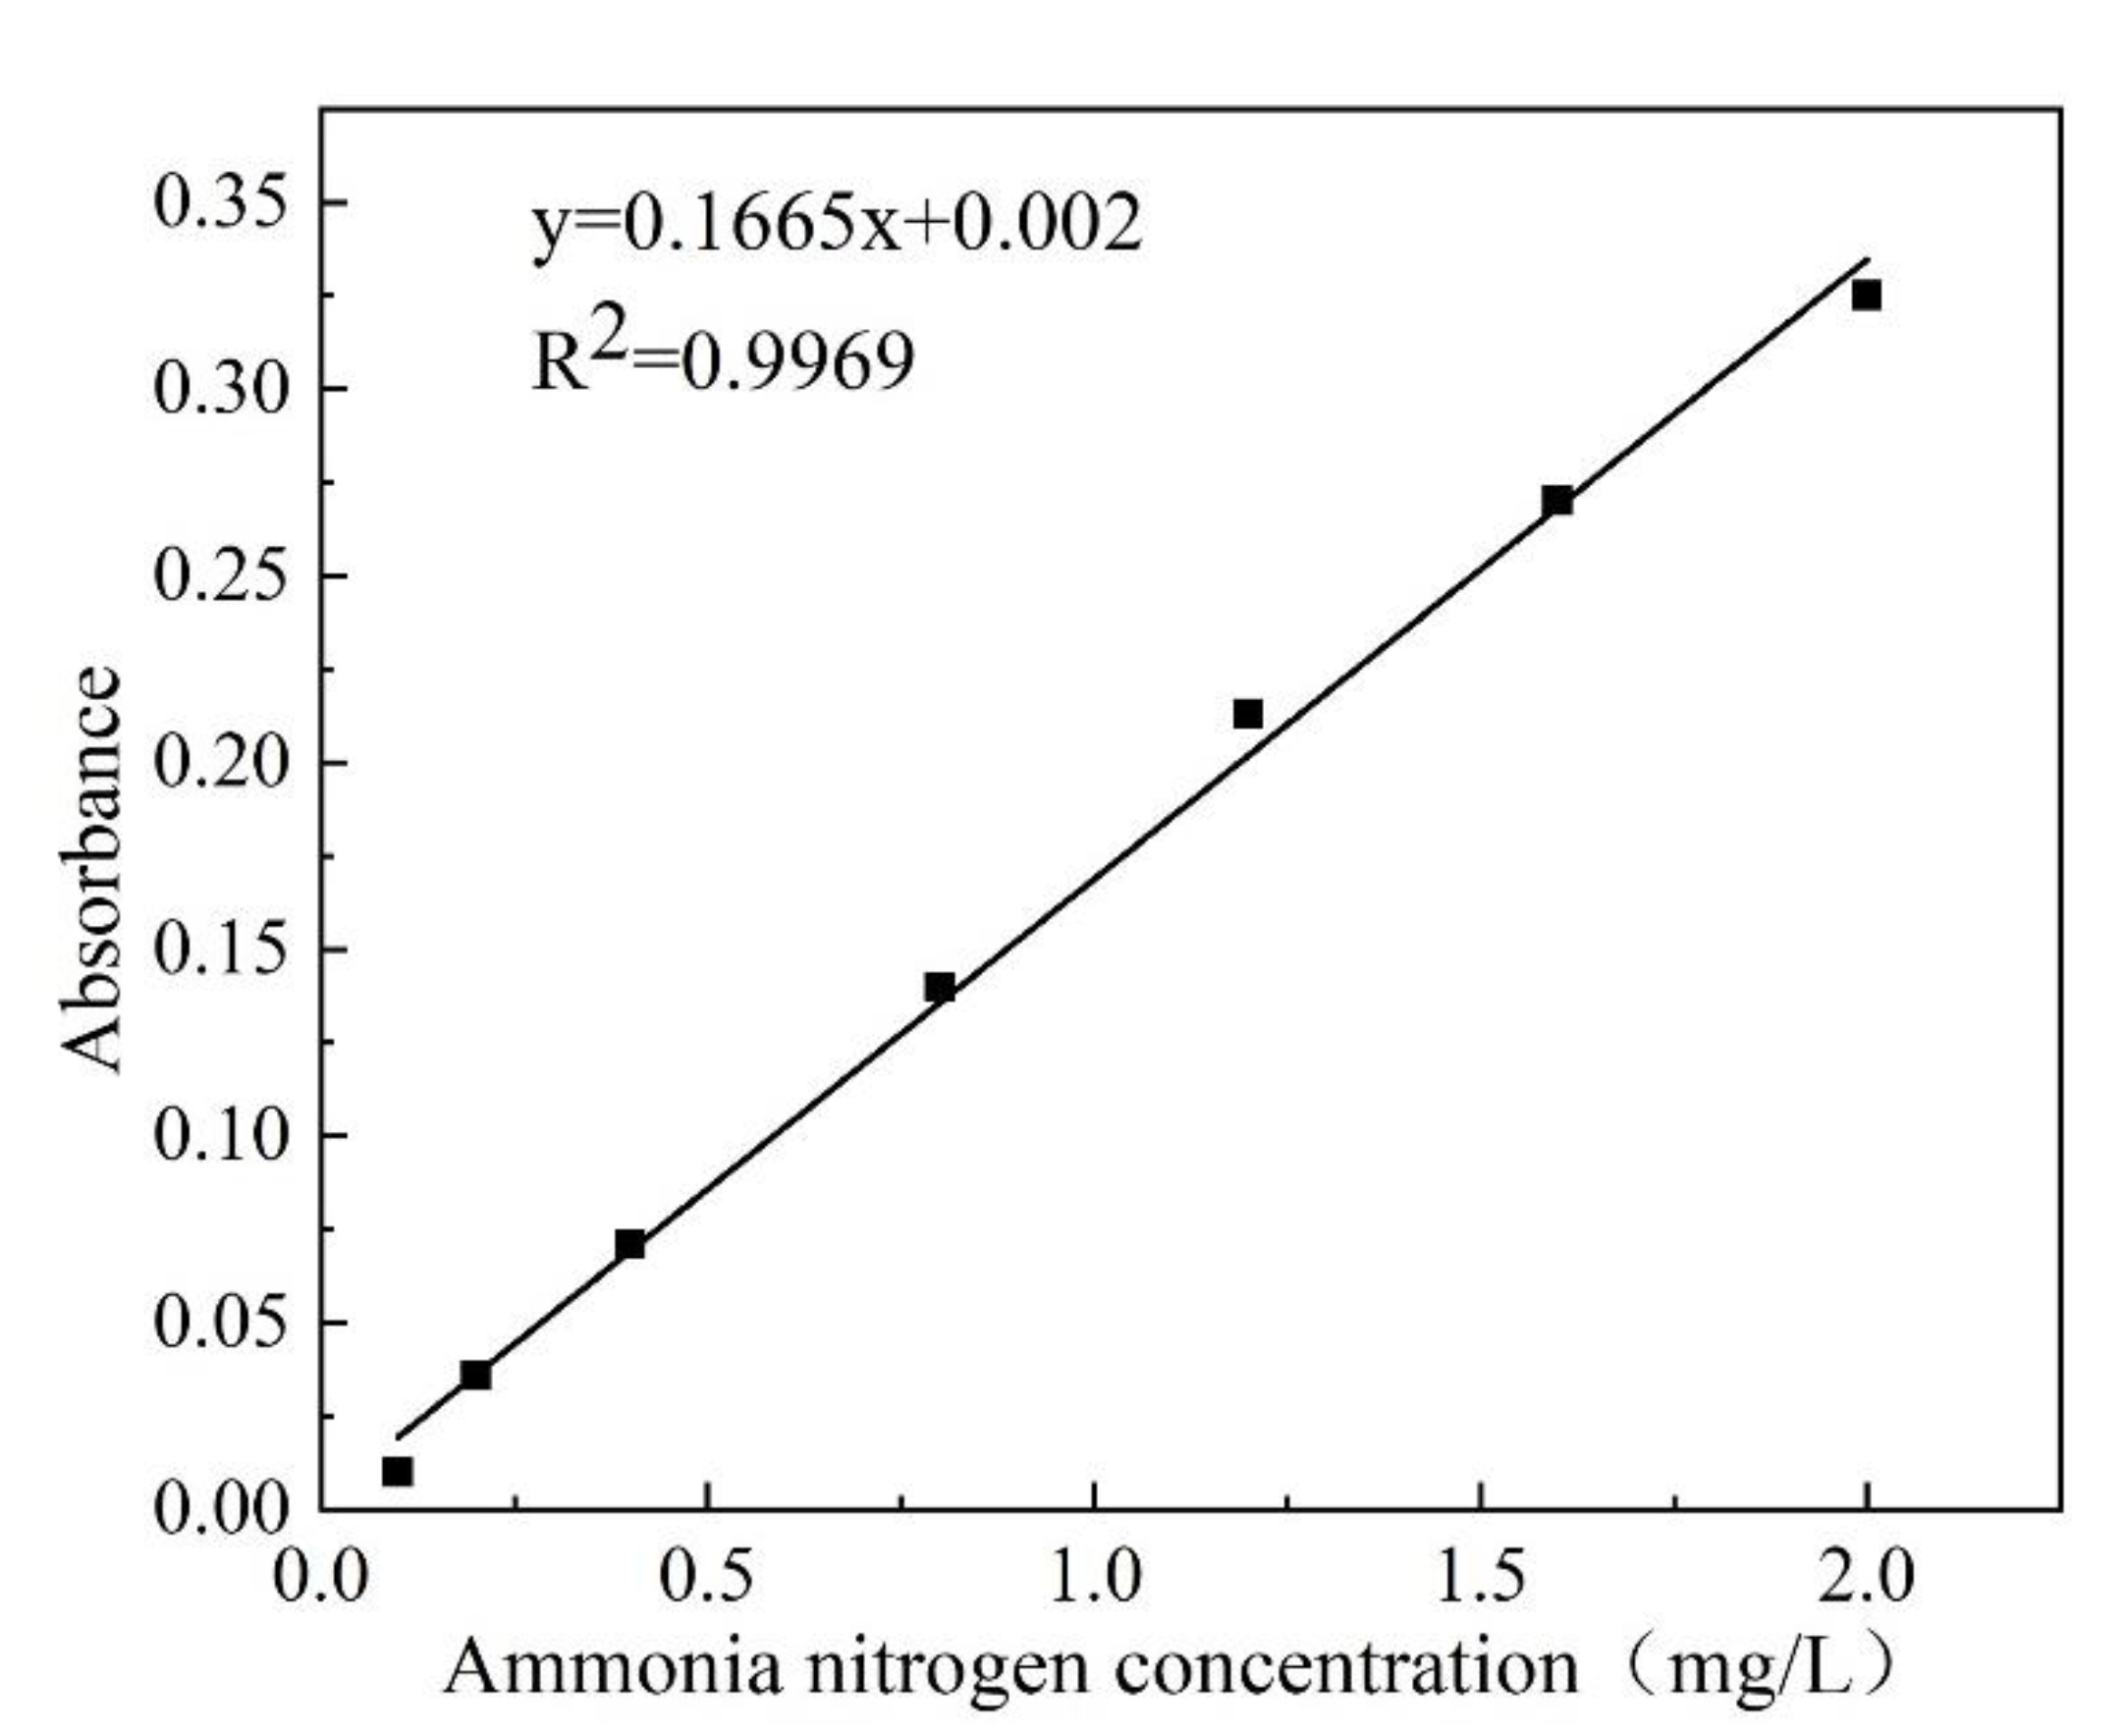
2.2. Standard Curve Drawing

The colorimetric tubes were filled with different volumes of an ammonia nitrogen standard solution (0 mL, 0.5 mL, 1 mL, 2 mL, 4 mL, 6 mL, 8 mL, and 10 mL) and ammonia-free water to 50 mL. a potassium sodium tartrate solution (Tianjin Yongda Chemical Reagent Company Limited, Tianjin, China) (1 mL) and Nessler’s reagent (Merck KGaA, Darmstadt, Germany) (1 mL) were added and then shaken well. The absorbance was measured at 420 nm with a spectrophotometer after developing color for 15 min. The standard curve regression equation was observed. As shown in Figure 3.

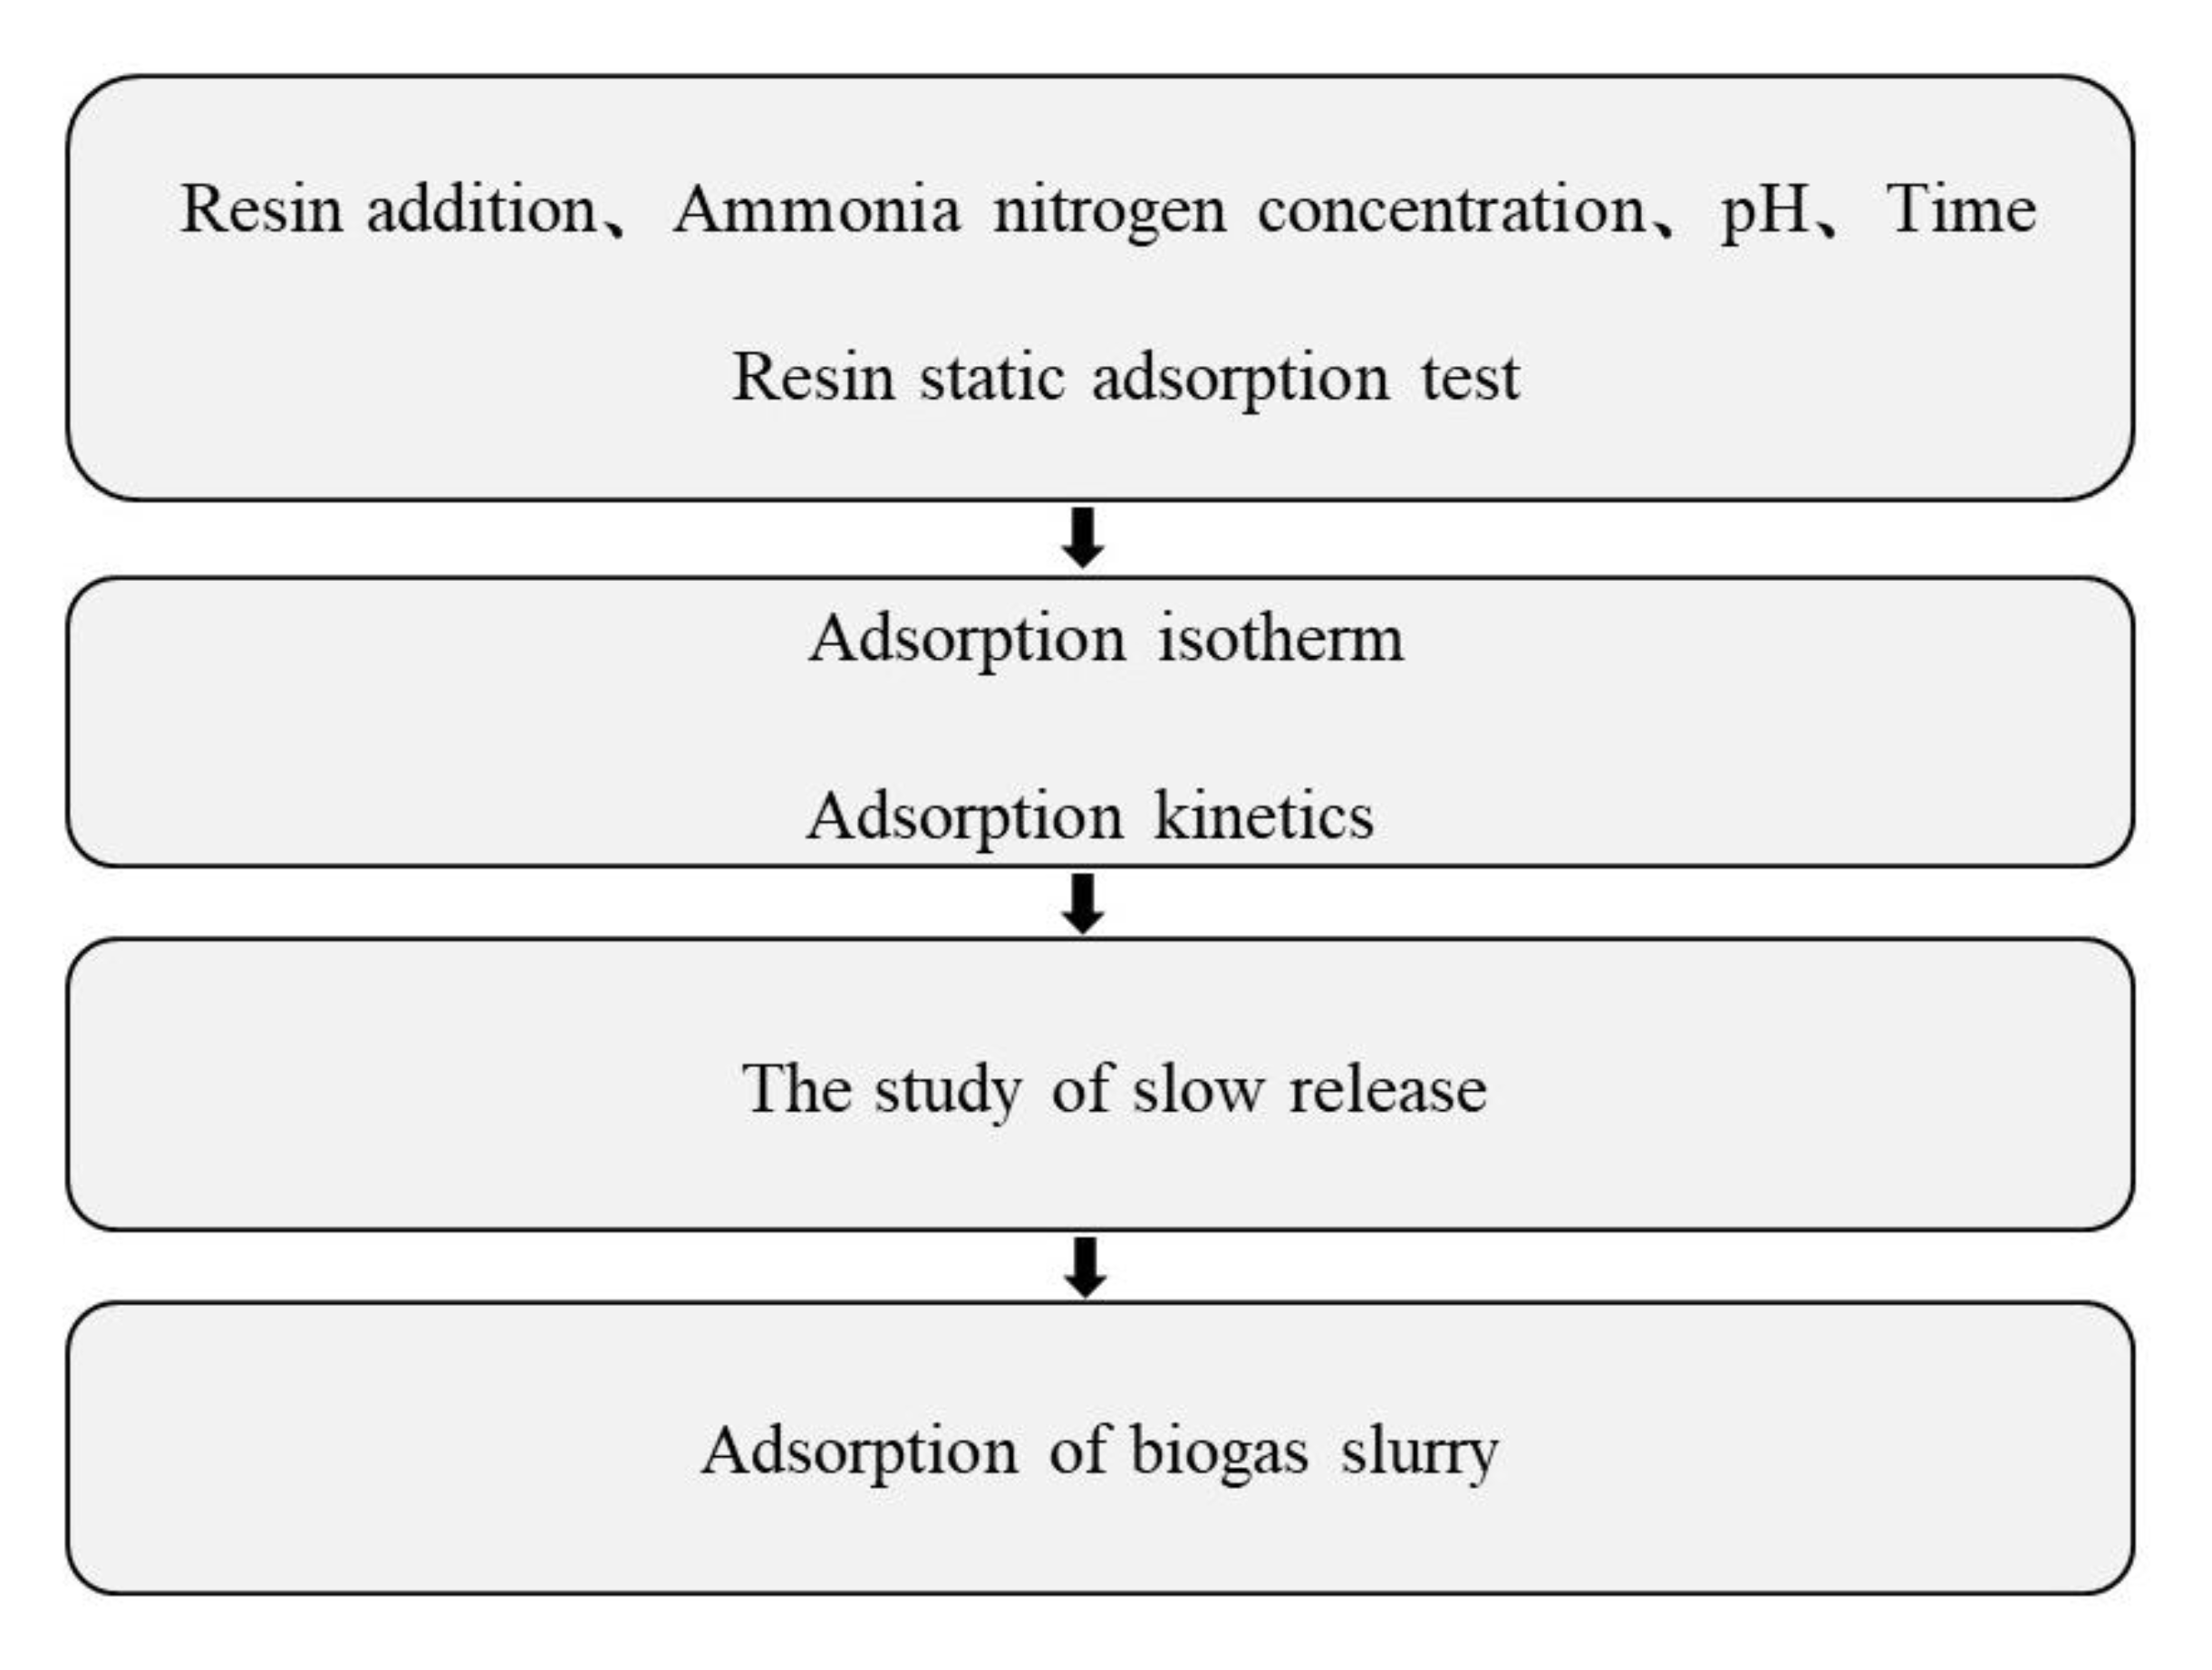
2.3. Experimental Scheme

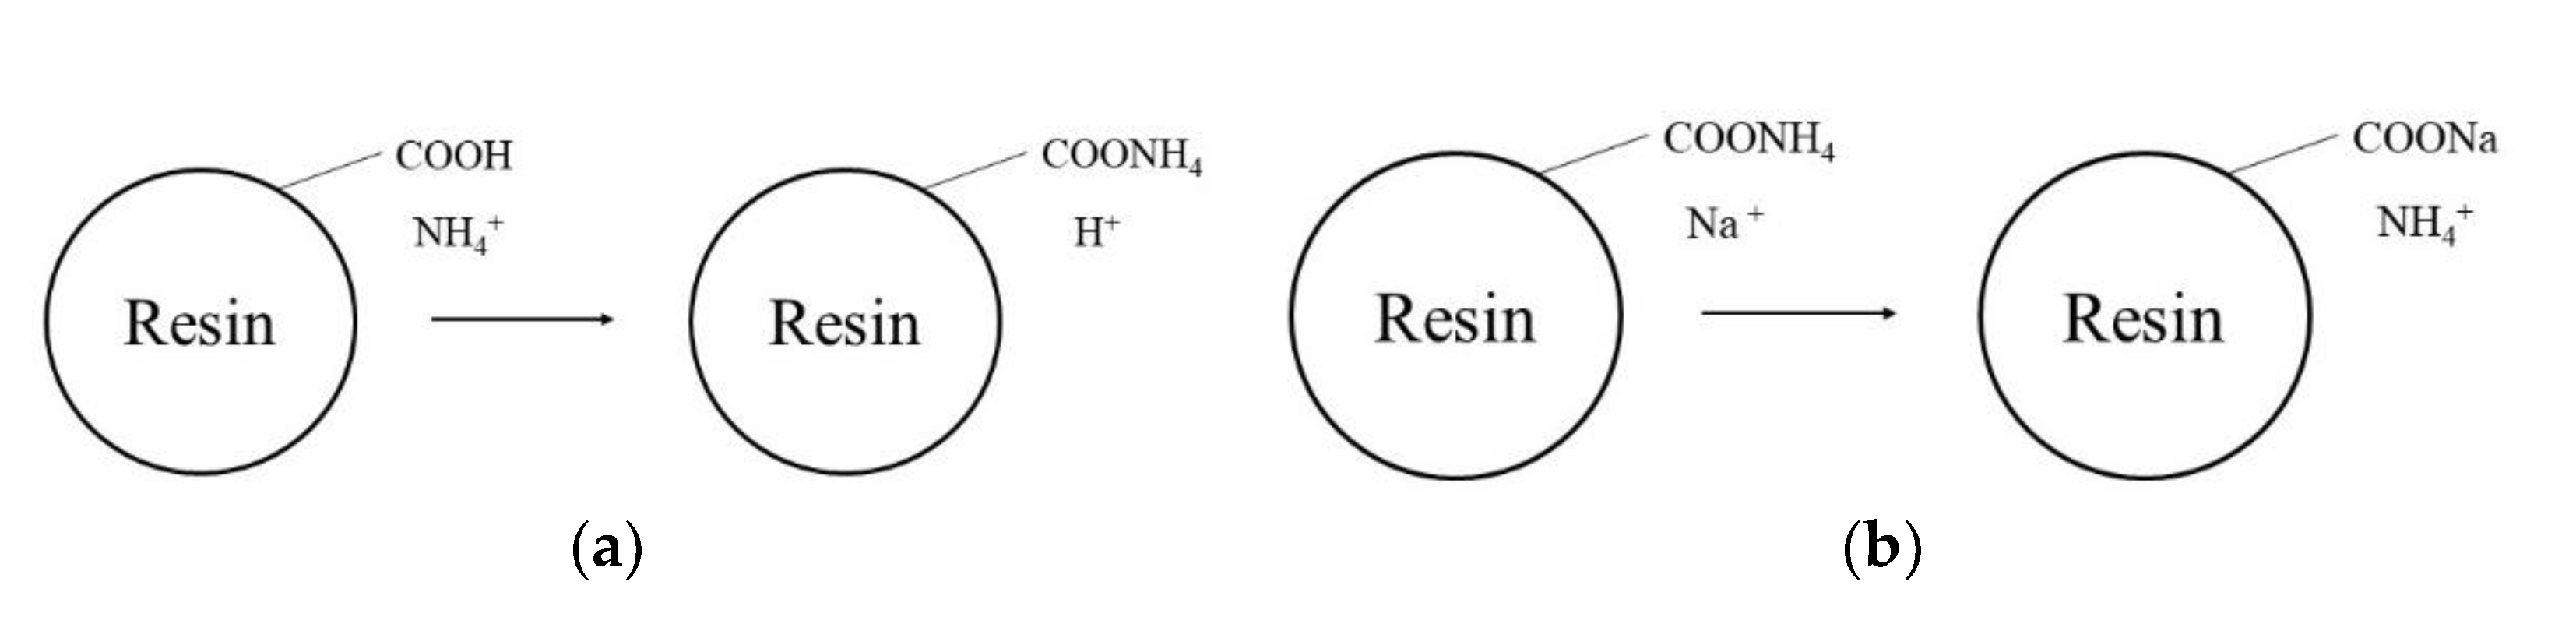
2.3.1. Resin Static Adsorption Test

In order to study the effects of the resin addition, ammonia nitrogen concentration, time, temperature and pH value on the ammonia nitrogen adsorption, a certain quality of ammonium chloride (Tianjin Kemiou Chemical Reagent Co., Ltd., Tianjin, China) was weighed with an electronic balance according to the experimental requirements (100, 500, 1000, 1500, 2000, 2500, and 3000 mg/L) and placed in a 100-mL Erlenmeyer flask. Ammonia-free water (50 mL) was added to fully dissolve it. The pH value of the solution was adjusted as required by the experiment (4, 5, 6, 7, 8, 9, and 10), and the required resin (0.1, 0.2, 0.3, 0.4, 0.5, 0.6, and 0.7 g) was weighed into the Erlenmeyer flask. After being sealed with a rubber stopper, the Erlenmeyer flask was shaken at 150 r/min in a constant temperature shaker (Shanghai Changken Test Equipment Co., Ltd., Shanghai, China) with different temperatures (20, 30, 40, 50, and 60 °C) and adsorption times (5, 10, 15, 20, 25, 30, 35, 40, 45, 50, 55, and 60 min).

2.3.2. Effect of Different NaCl Concentrations on the Slow Release of Ammonia Nitrogen

A sodium chloride solution (200 mg/L, 1000 mg/L, 2000 mg/L, 4000 mg/L, and 10,000 mg/L; 50 mL) was added to 100-mL Erlenmeyer flasks, and then 0.5 g of resin containing ammonia nitrogen (10 mg / g) was put into the Erlenmeyer flasks. All reactors remained still under room temperature. Samples were taken at 10 min, 30 min, 60 min, 120 min, 180 min, 240 min, 300 min, 360 min, 420 min, 480 min, 540 min, and 600 min, respectively, and the absorbance was measured.

2.3.3. Adsorption of Ammonia Nitrogen from the Biogas Slurry by the Resin

The biogas slurry was centrifuged, and the concentration of ammonia nitrogen without adsorption was measured. The supernatant (50 mL) was taken into the Erlenmeyer flask, and another Erlenmeyer flask contained the ammonium chloride solution (50 mL) with the same concentration of ammonia nitrogen as the biogas slurry. The adsorption experiments were conducted at a resin addition amount of 0.5 g, adsorption temperature of 30 °C, adsorption pH value of 7 and shaker speed of 150 r/min. Samples were taken at 5, 10, 15, 20, 25, 30, 35, 40, 45, and 50 min. The absorbance was measured. All experiments were performed in triplicate, and the average value of the experimental data was used as the result. The experimental procedures are shown in Figure 4.

2.4. Determination of Ammonia Nitrogen by Nessler’s Reagent Spectrophotometer

The supernatant of the ammonium chloride solution adsorbed by the resin was put into a 50-mL colorimetric tube by a liquid transfer gun. Ammonia-free water was added to 50 mL to dilute the solution. A potassium sodium tartrate solution (1 mL) and Nessler’s reagent (1 mL) were added to the colorimetric tube and then shaken well. Ammonia nitrogen would react with Nessler’s reagent to form a reddish complex. After developing color for 15 min, the absorbance of the solution was measured at 420 nm with a spectrophotometer, and the ammonia nitrogen concentration was calculated.

2.5. Isotherm Curve Fitting

The Langmuir and Freundlich adsorption isotherm equations [25] (Equations (1) and (2)) were used to simulate the data of ammonia nitrogen adsorption at different temperatures:
C e Q e = 1 K b Q m + C e Q m
where Qe is the adsorption capacity of the resin at equilibrium in mg/g, Qm is the theoretical maximum adsorption capacity of the ion exchange resin in mg/g, Ce is the ammonia nitrogen concentration at the adsorption equilibrium in mg/mL and Kb is the equilibrium constant:
l n Q e = l n K f + 1 n l n C e
where Qe is the adsorption capacity of the resin at equilibrium in mg/g, Ce is the ammonia nitrogen concentration at the adsorption equilibrium in mg/mL, Kf is the Freundlich constant and n is the empirical constant.

2.6. Adsorption Kinetic Model Fitting

Two kinetic equations (Equations (3) and (4)) were used to fit the data of the ammonia nitrogen adsorption under different adsorption times:
l n ( Q e Q t ) = l n Q e K 1 t
(quasi-first-order kinetic equation)
where Qe is the adsorption capacity of the resin at equilibrium in mg/g, Qt is the adsorption capacity of the resin at moment t in mg/g and K1 is the quasi-first-order kinetic rate constant:
t Q t = 1 K 2 Q e 2 + t Q e
(quasi-second-order kinetic equation)
where Qe is the ammonia nitrogen adsorption capacity by the resin at equilibrium in mg/g, Qt is the ammonia nitrogen adsorption capacity by the resin at moment t in mg/g and K2 is the quasi-second-order kinetic rate constant.

2.7. Statistical Analysis

The experimental data were analyzed by ANOVA (α = 0.05) using Mintab19 software (Mintab19, Pennsylvania State University, State College, PA, USA, 2019).

3. Results and Discussion

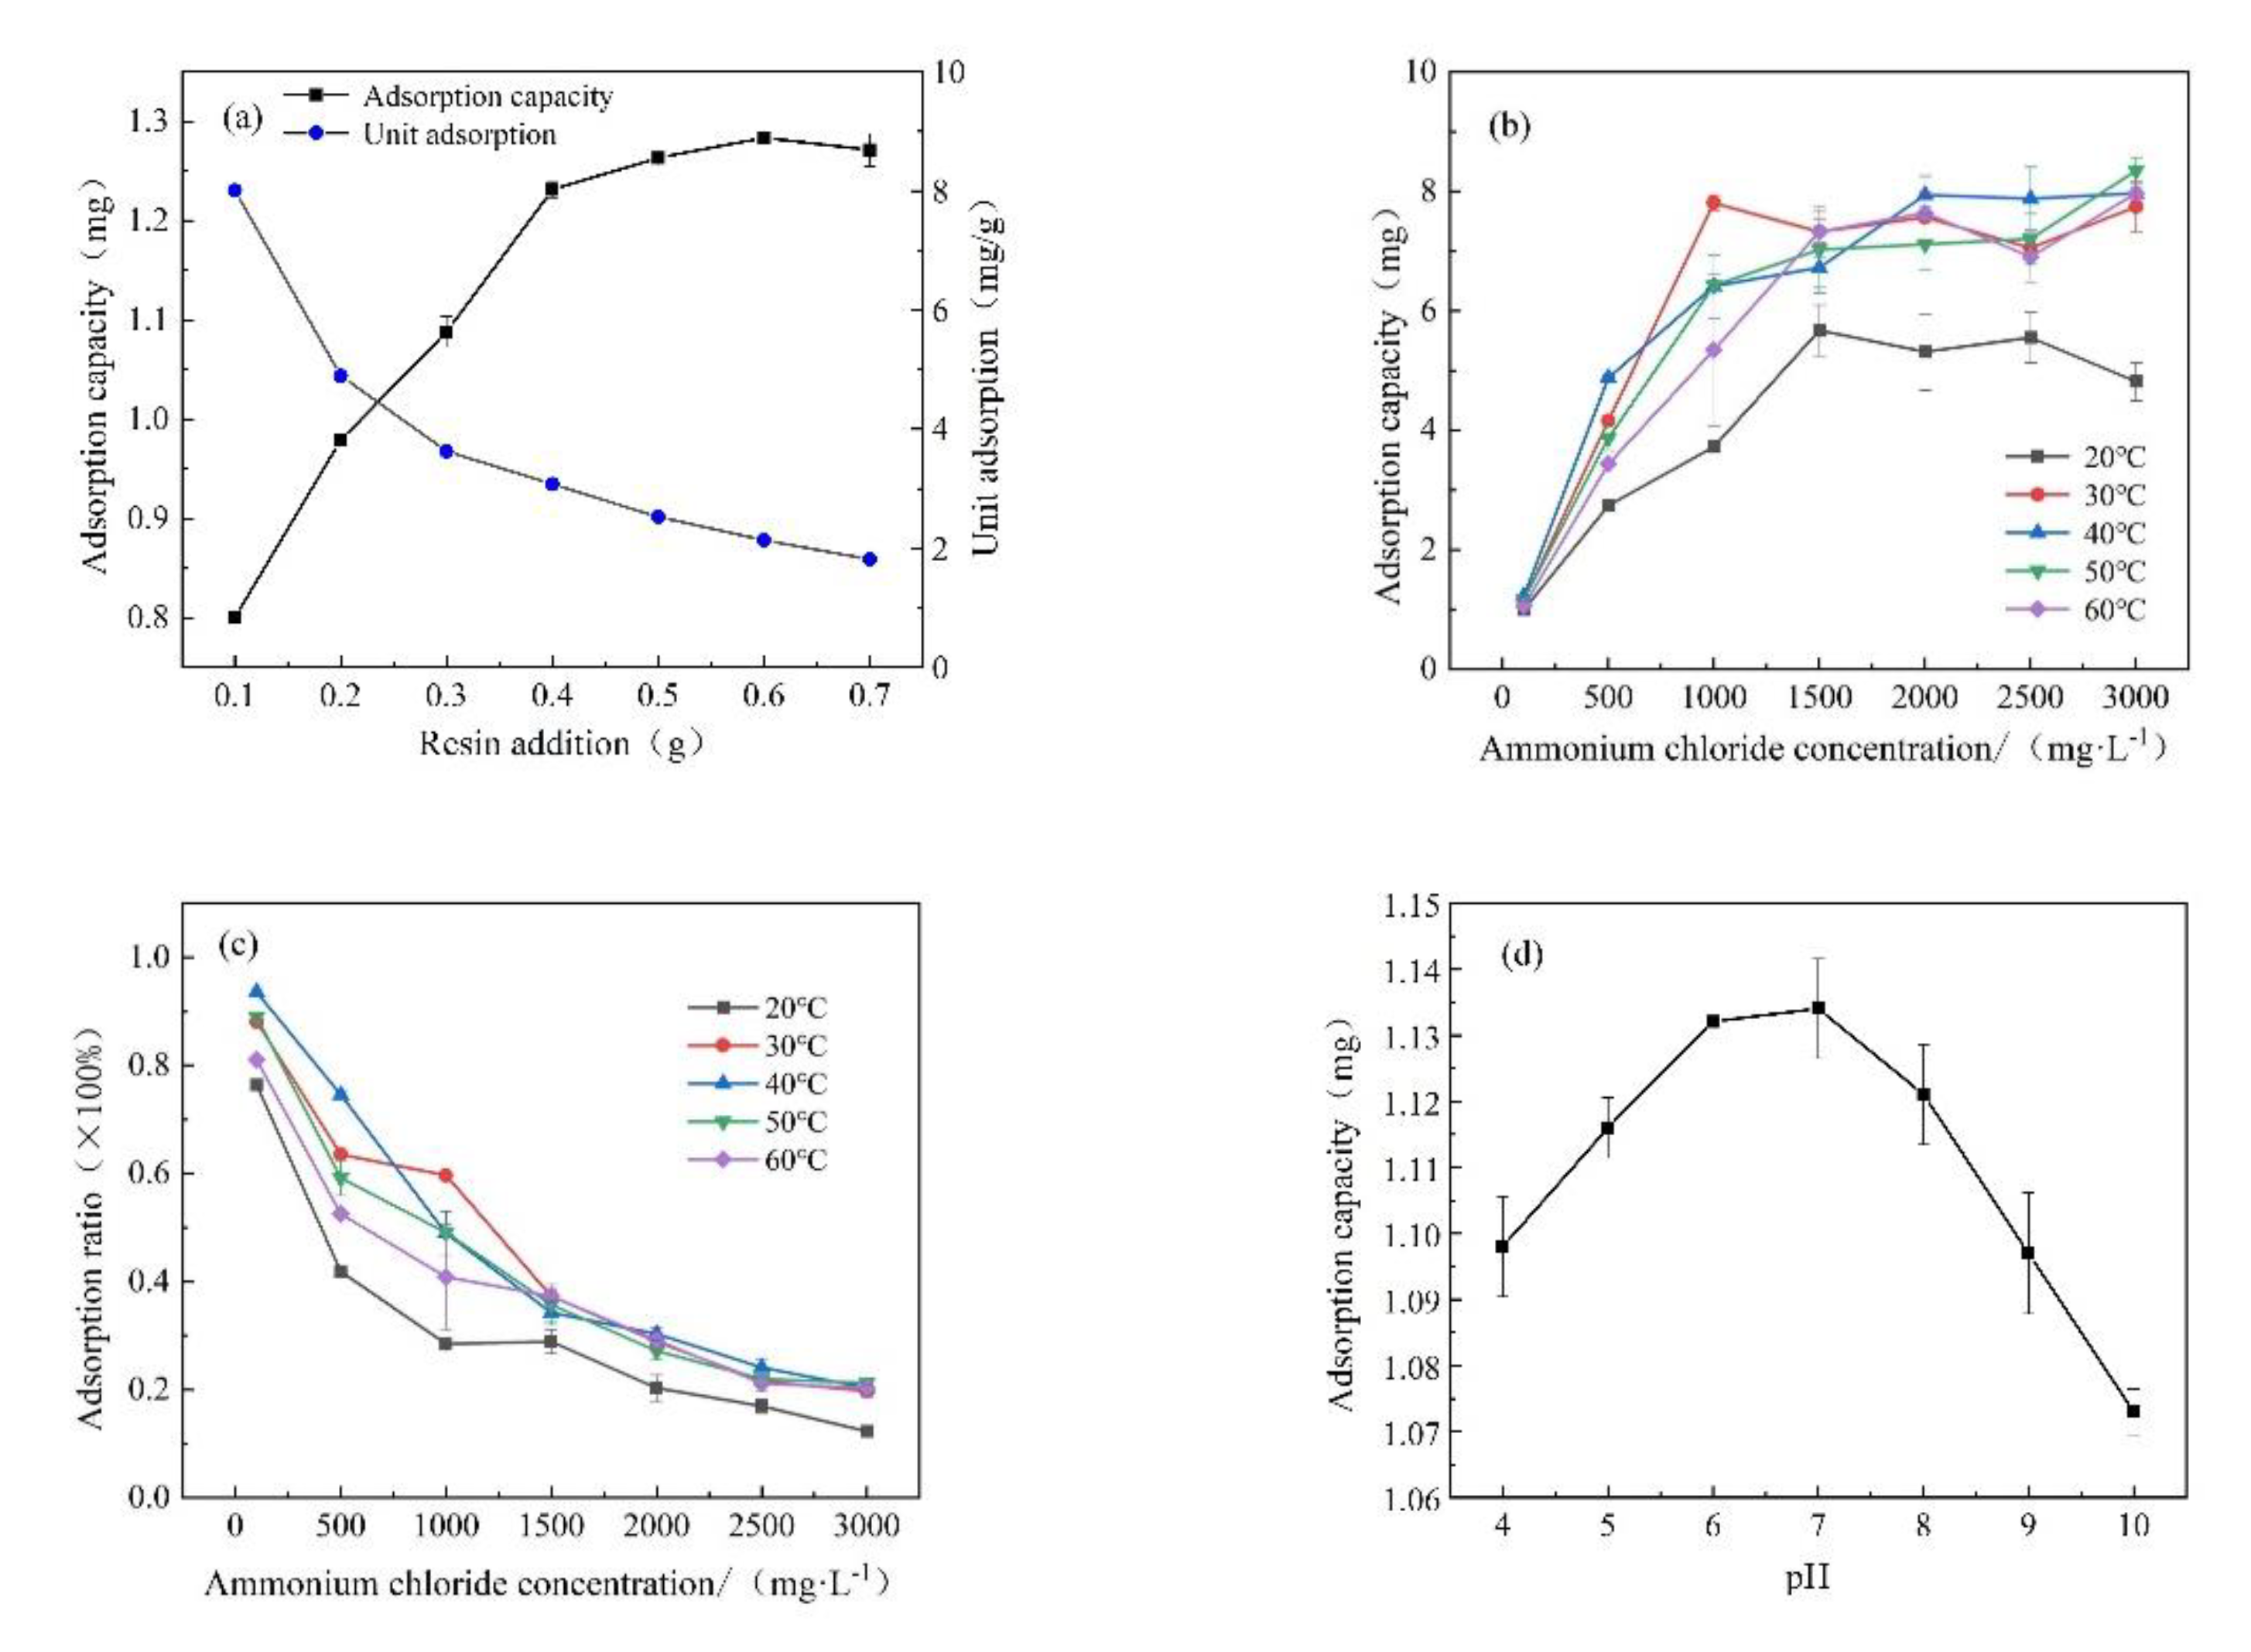
3.1. Effect of Resin Addition on Ammonia Nitrogen Adsorption

The adsorption test was performed with resin addition amounts of 0.05 g, 0.1 g, 0.2 g, 0.3 g, 0.4 g, 0.5 g, and 0.6 g under an ammonium chloride concentration of 100 mg/L, adsorption time of 30 min, adsorption temperature of 30 °C, pH value of 7 and shaker speed of 150 r/min. The absorbance was measured using the Nessler’s reagent spectrophotometer method, and then the adsorption capacity of ammonia nitrogen and resin unit adsorption capacity were calculated. The results are shown in Figure 5a.
As shown in Figure 5a, the ammonia nitrogen adsorption capacity increased with the increase in the resin addition, but the unit adsorption capacity decreased. When 0.1 g of resin was added, a total of 0.79 mg of ammonia nitrogen was adsorbed, accounting for 61% of the total ammonia nitrogen, and the unit adsorption capacity of the resin reached its highest value (7.98 mg/g). The efficiency was higher than those of other slow-release carriers [26]. When the resin addition increased to 0.4 g, 1.22 mg of ammonia nitrogen was adsorbed, accounting for 94% of the total ammonia nitrogen, which reached a higher value, but the unit adsorption capacity dropped to 3.07 mg/g. When the amount of resin continued to increase, the adsorption effect slowed down significantly. At the resin addition amount of 0.6 g, 1.28 mg of ammonia nitrogen was adsorbed, accounting for 98% of the total ammonia nitrogen. However, the unit adsorption capacity decreased to 2.13 mg/g. The unit adsorption capacity decreased to 1.79 mg/g when the resin addition was 0.7 g. This adsorption law was consistent with the research results by Zhuang [27]. This may be due to the number of ammonia nitrogen exchange sites increasing with the increasing resin amount [28], and the unit utilization efficiency of the resin decreased with the increase in the resin content, which may have been due to the fact that the ammonia nitrogen could not completely contact the resin. After comprehensive consideration, the amount of resin selected was 0.5 g, which showed a significant (p < 0.05) difference from the other addition amounts.

3.2. Effect of the Ammonia Nitrogen Concentration on Ammonia Nitrogen Adsorption by the Resin at Different Temperatures

The ammonium chloride solution concentration was set to 100 mg/L, 500 mg/L, 100 mg/L, 1500 mg/L, 2000 mg/ L, 2500 mg/L, and 3000 mg/L, and the adsorption tests were performed at 20 °C, 30 °C, 40 °C, 50 °C, and 60 °C, respectively, under a resin addition amount of 0.5 g, adsorption time of 30 min, pH value of 7 and shaker speed 150 r/min. The absorbance was measured, and then the ammonia nitrogen adsorption capacity and adsorption ratio were calculated. The results are shown in Figure 5b,c.
As shown in Figure 5b, when the concentration of ammonium chloride was 100 mg/L, the adsorption capacity of the resin reached its minimum value. The adsorption capacity increased gradually and then tended to be stable with the increase in the ammonium chloride concentration because the number of adsorption sites of the resin was constant [29]. As the concentration of the ammonia nitrogen increased, the adsorption sites decreased and finally reached saturation and adsorption equilibrium. When the temperature was 20 °C, the resin had the lowest adsorption capacity, and the maximum adsorption capacity was 5.67 mg. The adsorption capacities at 30 °C, 40 °C, 50 °C and 60 °C were very close; the maximum adsorption capacities were 7.80 mg, 8.04 mg, 8.34 mg and 7.89 mg, respectively. There was a significant (p < 0.05) difference was observed between 20 °C and the other temperatures. Because the resin adsorption process is an endothermic reaction [30], when the temperature increases, the adsorption capacity of the resin increases and finally tends to be stable. According to Figure 5c, the adsorption rate fell off gradually from 88% to 19% with the increase in the ammonia nitrogen concentration at 30 °C.

3.3. Effect of the pH Value on Ammonia Nitrogen Adsorption

The adsorption test was performed at pH values of 4, 5, 6, 7, 8, 9 and 10 with the condition of a resin addition amount of 0.5 g, ammonium chloride concentration of 100 mg/L, adsorption time of 30 min, adsorption temperature of 30 °C and shaker speed of 150 r/min. The absorbance was measured using the Nessler’s reagent spectrophotometer method, and the adsorption capacity was calculated. The results are shown in Figure 5d.
As shown in Figure 5d, the ammonia nitrogen adsorption capacity by the resin increased first and then decreased with the increase in the pH value. The initial pH value had a significant influence (p < 0.05) on the ammonia nitrogen adsorption capacity. The ammonia nitrogen adsorption capacity reached its maximum value (1.13 mg) when the pH value was 7. This was because when the solution was acidic, the concentration of H+ increased, which competed with NH4+ for the adsorption sites on the resin. The higher the concentration of the H+ was, the fiercer the competition with the NH4+ was, resulting in a reduction of the ammonia nitrogen adsorption capacity. When the solution was alkaline, NH4+ would combine with OH to become free ammonia [NH3]. The method of resin adsorption became physical adsorption, and the adsorption capacity was weak. Hence, with the increase in the pH value, free ammonia [NH3] would increase, leading to a lower ammonia nitrogen adsorption capacity for the resin [31]. The optimal pH value of the resin for ammonia nitrogen adsorption was seven.

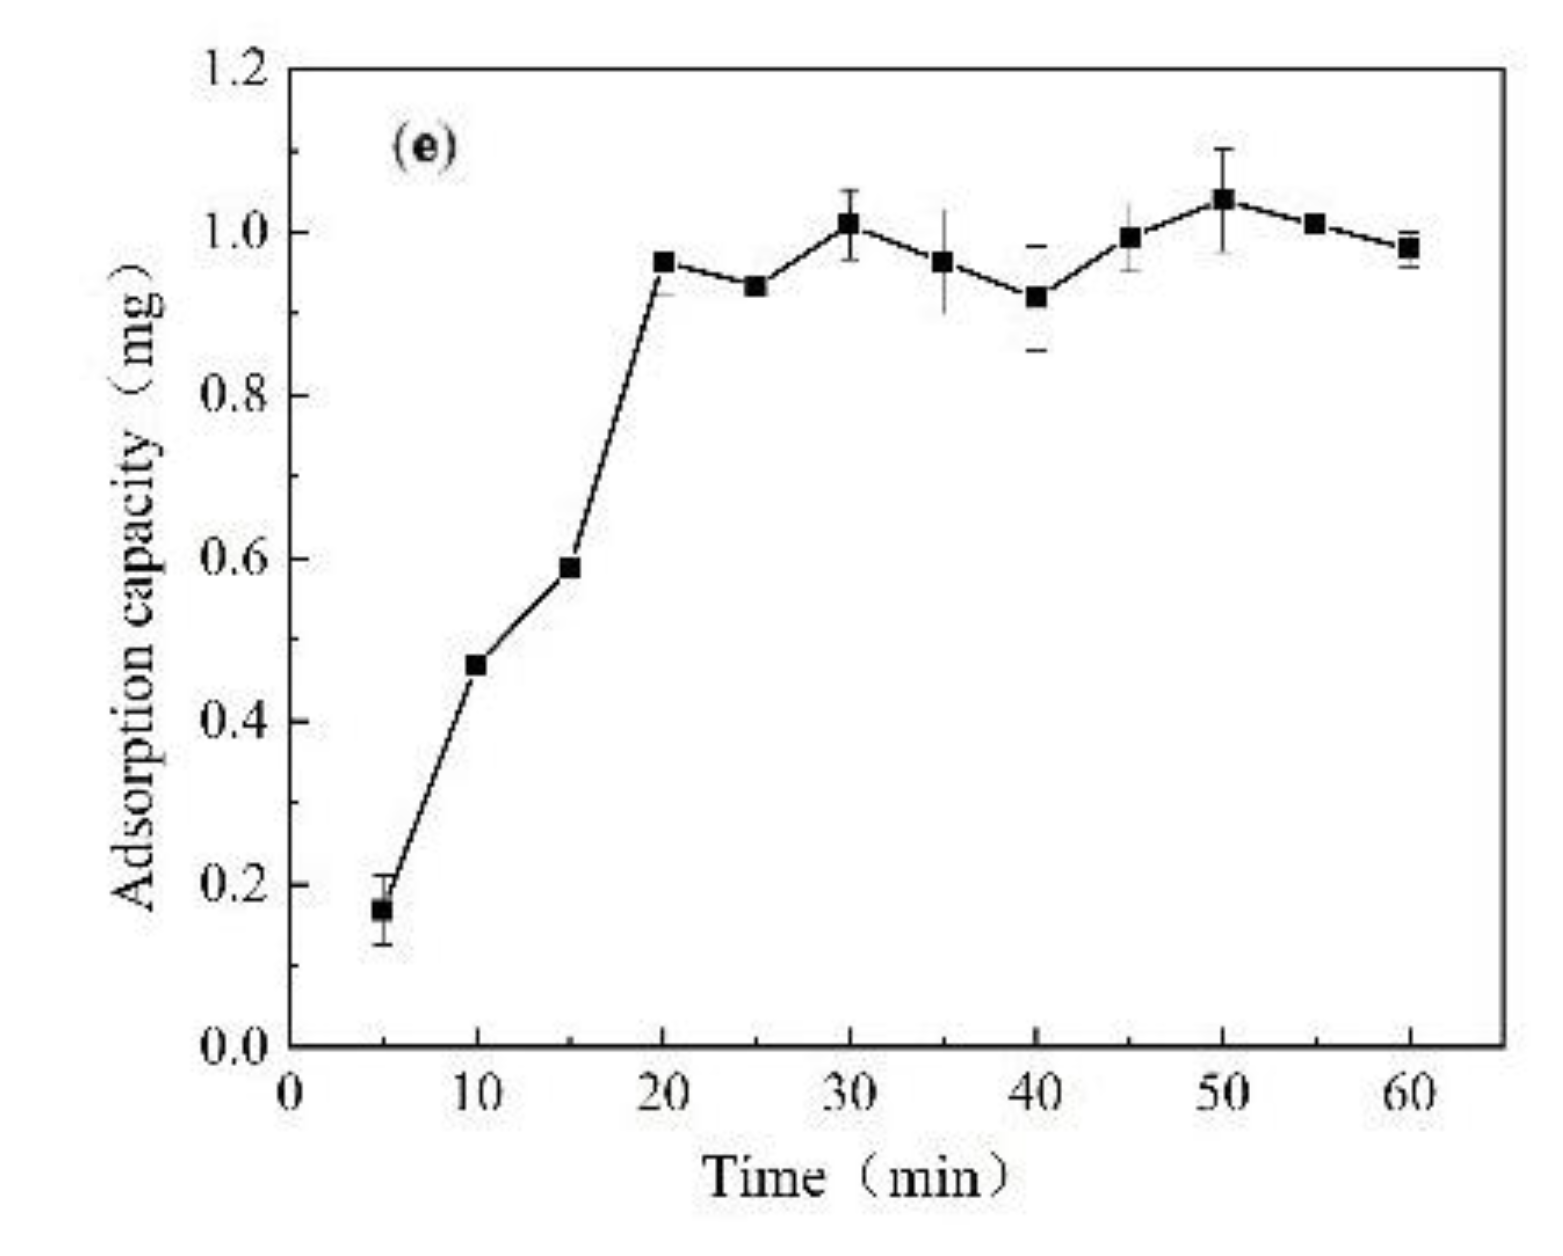
3.4. Effect of the Adsorption Time on Ammonia Nitrogen Adsorption

The adsorption experiment was carried out under the condition of a resin addition amount of 0.5 g, ammonium chloride concentration of 100 mg/L, adsorption temperature of 30 °C, pH value of 7 and shaker speed of 150 r/min. Samples were taken at 5, 10, 15, 20, 25, 30, 35, 40, 45 50, 55 and 60 min. After the absorbance was measured using the Nessler’s reagent spectrophotometer method, the ammonia nitrogen adsorption capacity was calculated. The results are shown in Figure 5e.
As shown in Figure 5e, when the time increased, the adsorption capacity gradually increased within 5–20 min. The maximum adsorption capacity reached 0.96 mg at 20 min, and the adsorption capacity was in a dynamic equilibrium at 20–60 min. This result from our study was consistent with the result of Zhu [32]. This may be because the number of adsorption sites decreased when the time increased, and the concentration of Na+ gradually increased. After 20 min, the NH4+ and Na+ competed with each other for adsorption, which caused the ammonia nitrogen concentration to form a stable fluctuation phenomenon. In order to ensure that the adsorption capacity reached the maximum, 30 min was selected as the adsorption time.

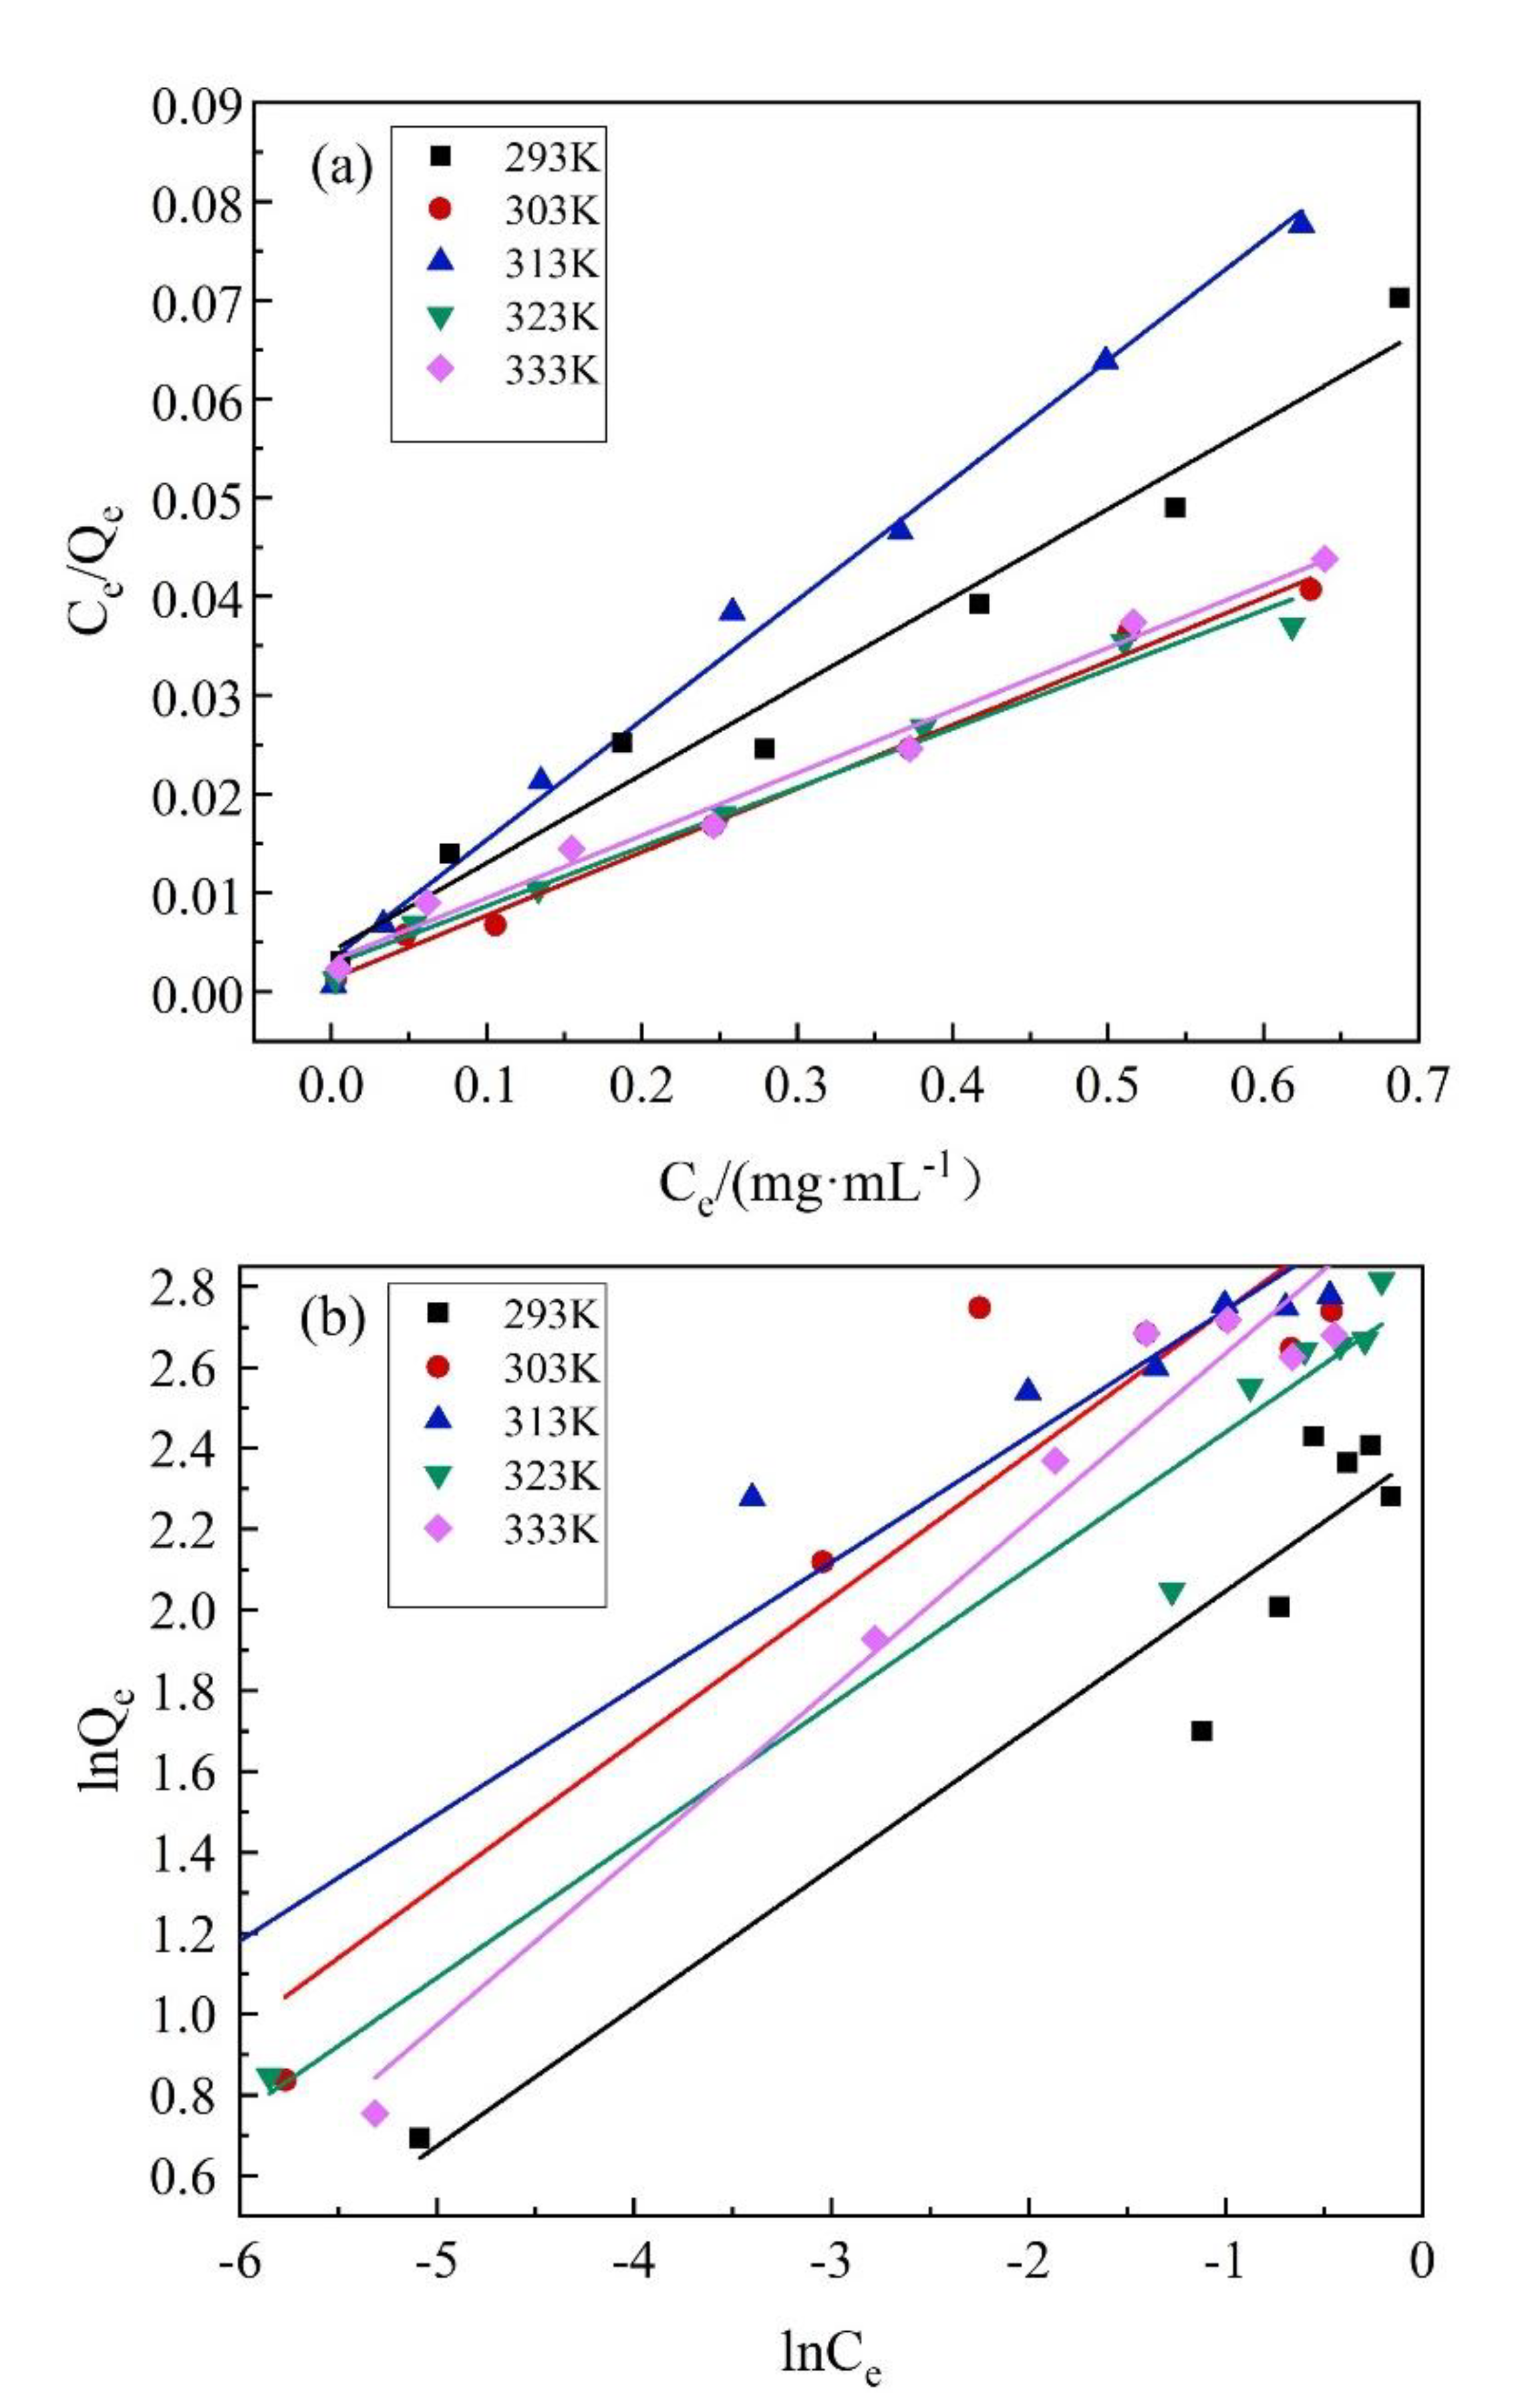
3.5. Adsorption Isotherm

The data from the experiment of the effect of the ammonia nitrogen concentration on the ammonia nitrogen adsorption at different temperatures were fitted by the Langmuir and Freundlich adsorption isotherm equations (Equations (1) and (2)) [33]. The isotherm adsorption curve was drawn, and the relevant parameters were calculated. The results are shown in Figure 6 and Table 1.
According to Figure 6 and Table 1, the correlation coefficients R2 of the Langmuir isothermal equation fitting at temperatures of 293 K, 303 K, 313 K, 323 K and 333 K were 0.9704, 0.9932, 0.9949, 0.9856 and 0.9811, respectively, and the correlation coefficients R2 of the Freundlich isothermal equation fitting were 0.9182, 0.8836, 0.9462, 0.9605 and 0.9682, respectively. The Langmuir isothermal equation was more suitable for describing the adsorption process, which was single-molecule layer adsorption.

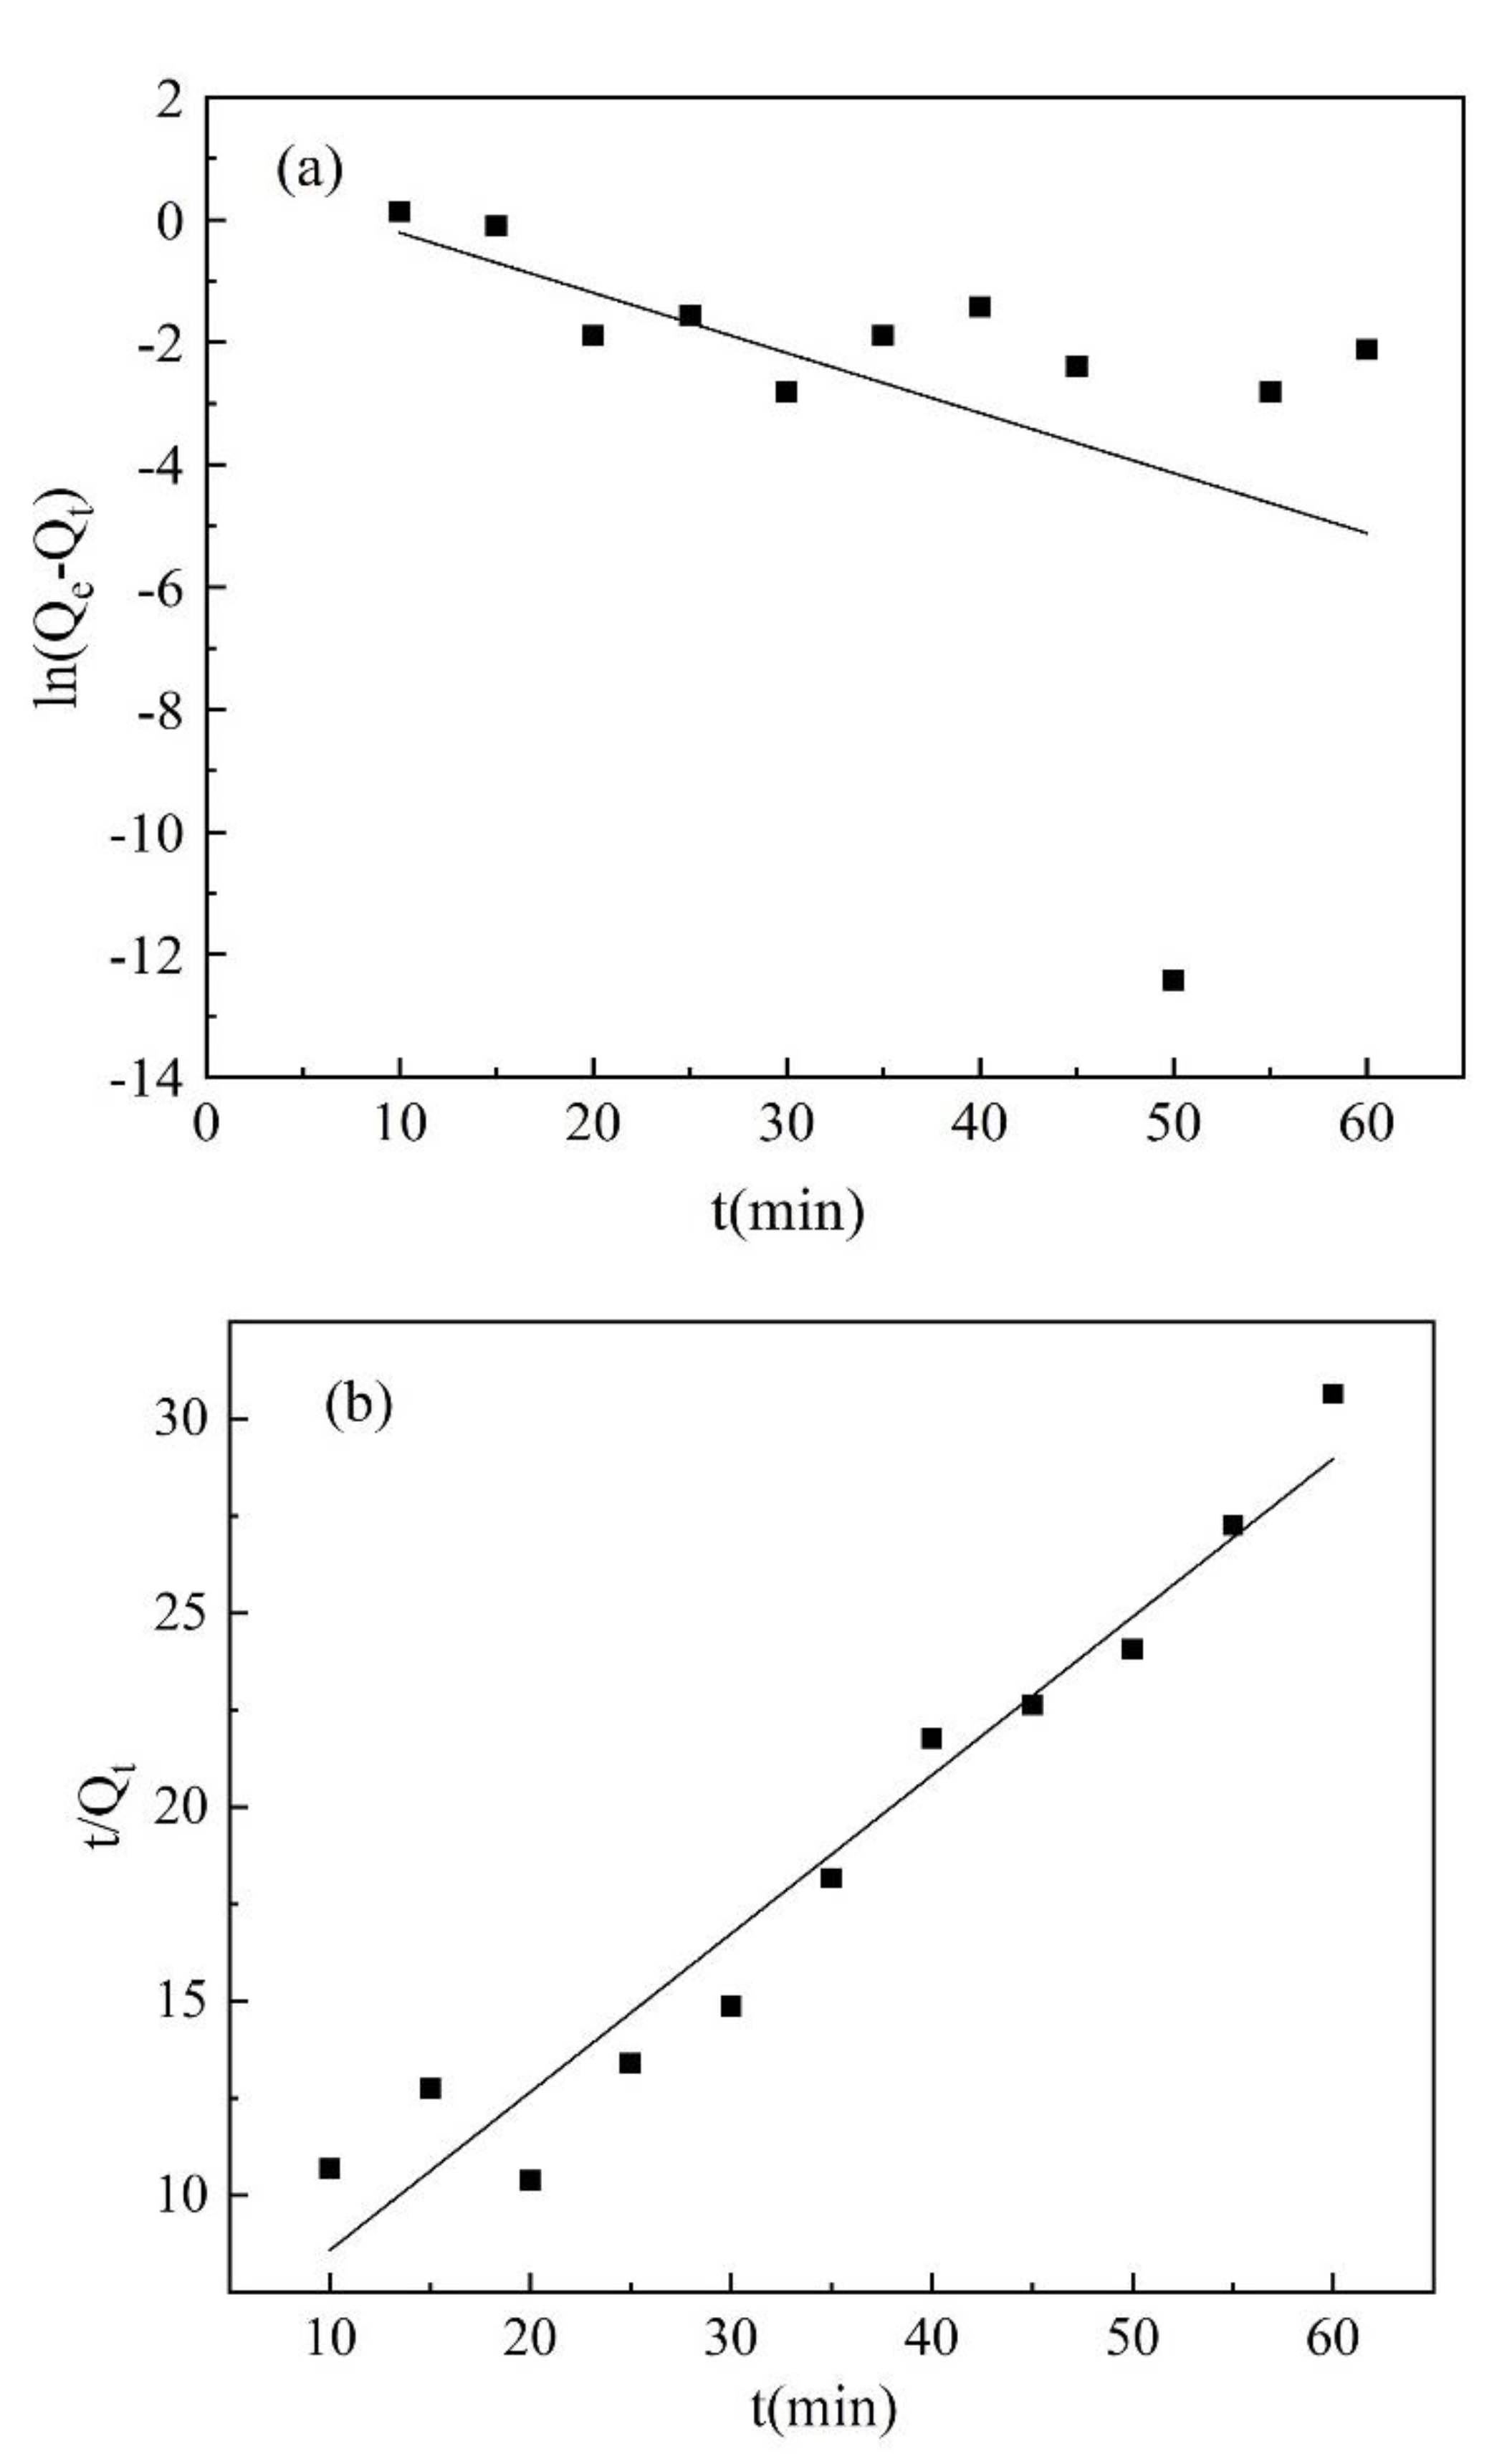
3.6. Adsorption Kinetics

According to the data obtained from the test of the effect of the adsorption time on ammonia nitrogen adsorption, two kinetic equations were used for the fitting curve (Equations (3) and (4)) [34]. Then, the fitting curve was drawn, and the relevant parameters were calculated. The results are shown in Figure 7 and Table 2.
According to Figure 7 and Table 2, the correlation coefficient R2 fitted by the quasi-first-order kinetic equation was 0.2325, and the correlation coefficient R2 fitted by the quasi-second-order kinetic equation was 0.9496. The ammonia nitrogen adsorption process by the resin was more in line with the quasi-second-order kinetic equation.

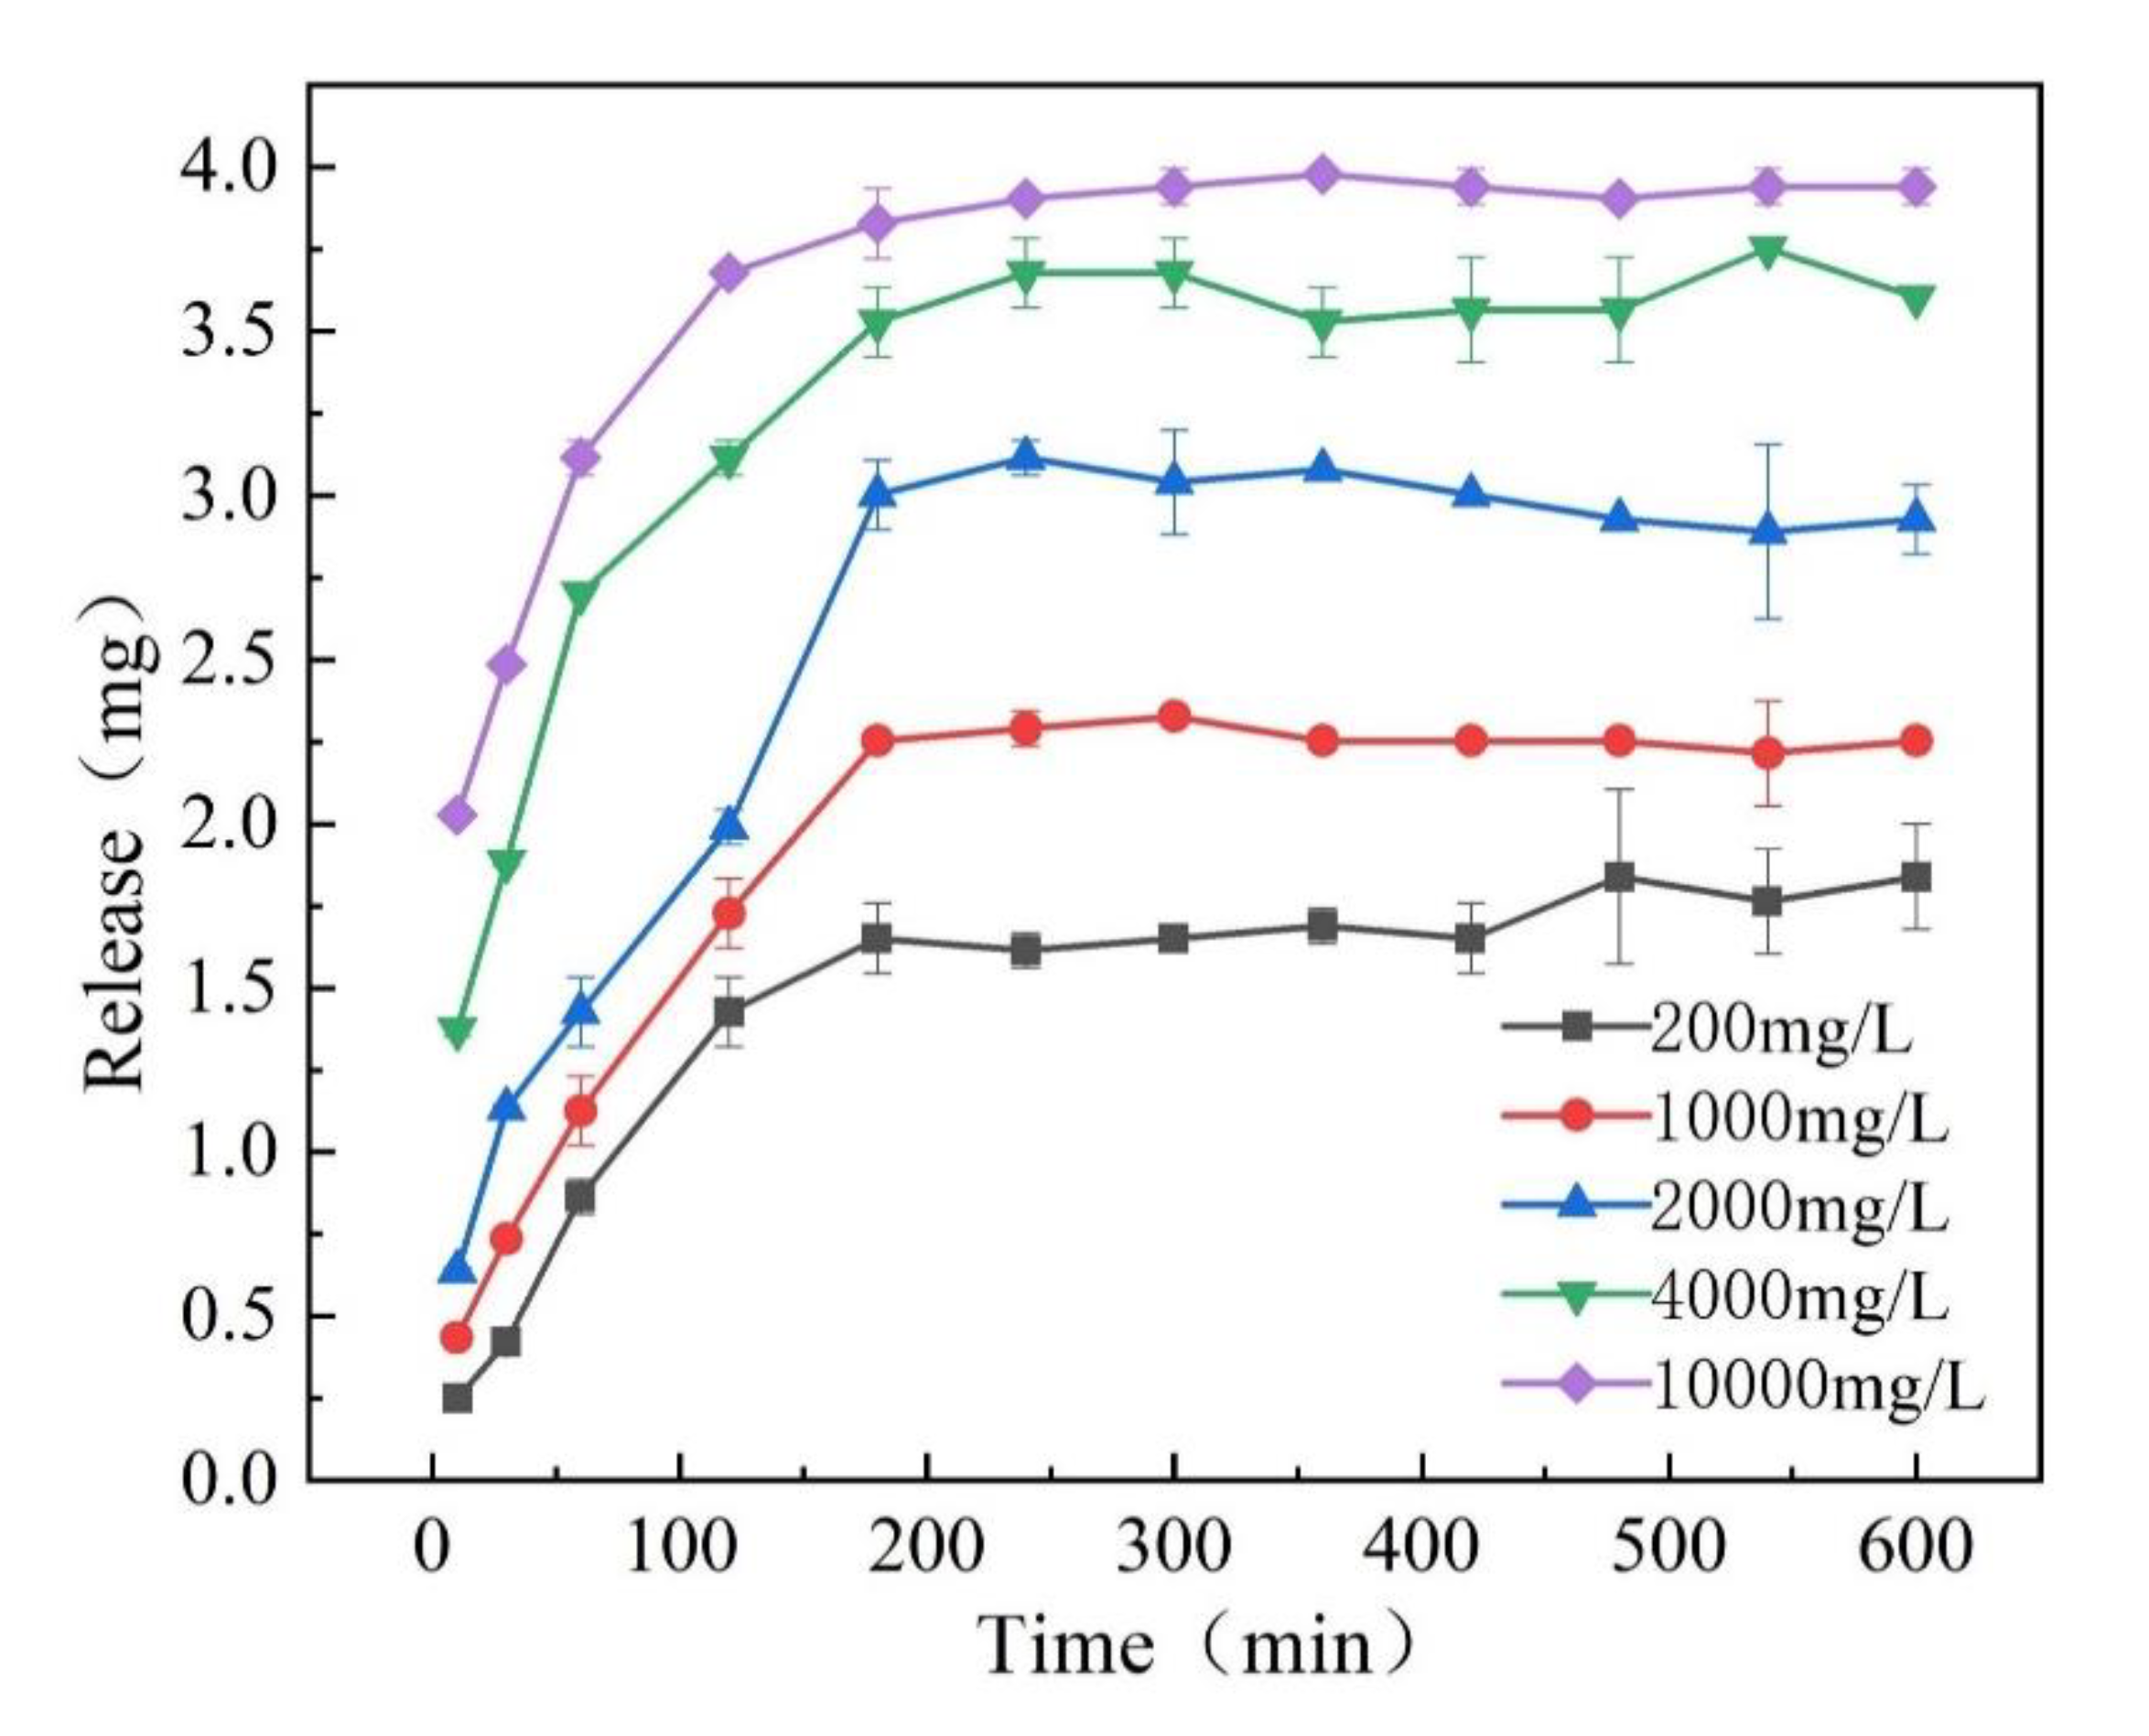
3.7. Effect of Different NaCl Concentrations on the Slow Release of Ammonia Nitrogen

The adsorption test was performed under the conditions of a resin addition amount of 3 g, ammonium chloride concentration of 1500 mg/L, adsorption temperature of 30 °C, adsorption pH value of 7, adsorption time of 30 min and shaker speed of 150 r/min. After the adsorption was completed, the resin was separated by filtration. The resin was placed in a drying box for drying to prepare a resin loaded with ammonia nitrogen. The NaCl solutions with concentrations of 200 mg/L, 1000 mg/L, 2000 mg/L, 4000 mg/L and 10,000 mg/L (50 mL) were configured in Erlenmeyer flasks of 100 mL. The resin loaded with ammonia nitrogen (0.5 g) was placed in an Erlenmeyer flask and remained still. Samples were taken at 10 min, 30 min, 60 min, 120 min, 180 min, 240 min, 300 min, 360 min, 420 min, 480 min, 540 min and 600 min, respectively. The absorbance was measured by the Nessler’s reagent spectrophotometer method before the ammonia nitrogen slow-release amount was calculated. The results are shown in Figure 8.
Figure 8 shows that when the concentration of the NaCl solution was 200 mg/L, the slow-release amount of the resin was the lowest, reaching 2 mg in the stable stage and accounting for 40% of the total. At 10,000 mg/L, the slow-release amount of the resin reached 4 mg at the stable stage and accounted for 80% of the total. The slow-release amount had a significant difference (p < 0.05) between each concentration. The slow-release amount increased with the increase in concentration of the NaCl solution. In the initial stage of slow release, the efficiency was the highest, and then it gradually decreased to a stabilized value. The reason for this was that during the initial stage of slow release, more Na+ could be exchanged with the NH4+ on the resin. As the exchange continued, the exchange sites continued to decrease, and the exchange rate gradually slowed down. The concentration of the NaCl solution was flexibly adjusted according to the specific slow-release requirements and the salinity tolerance of the crops to achieve better results.

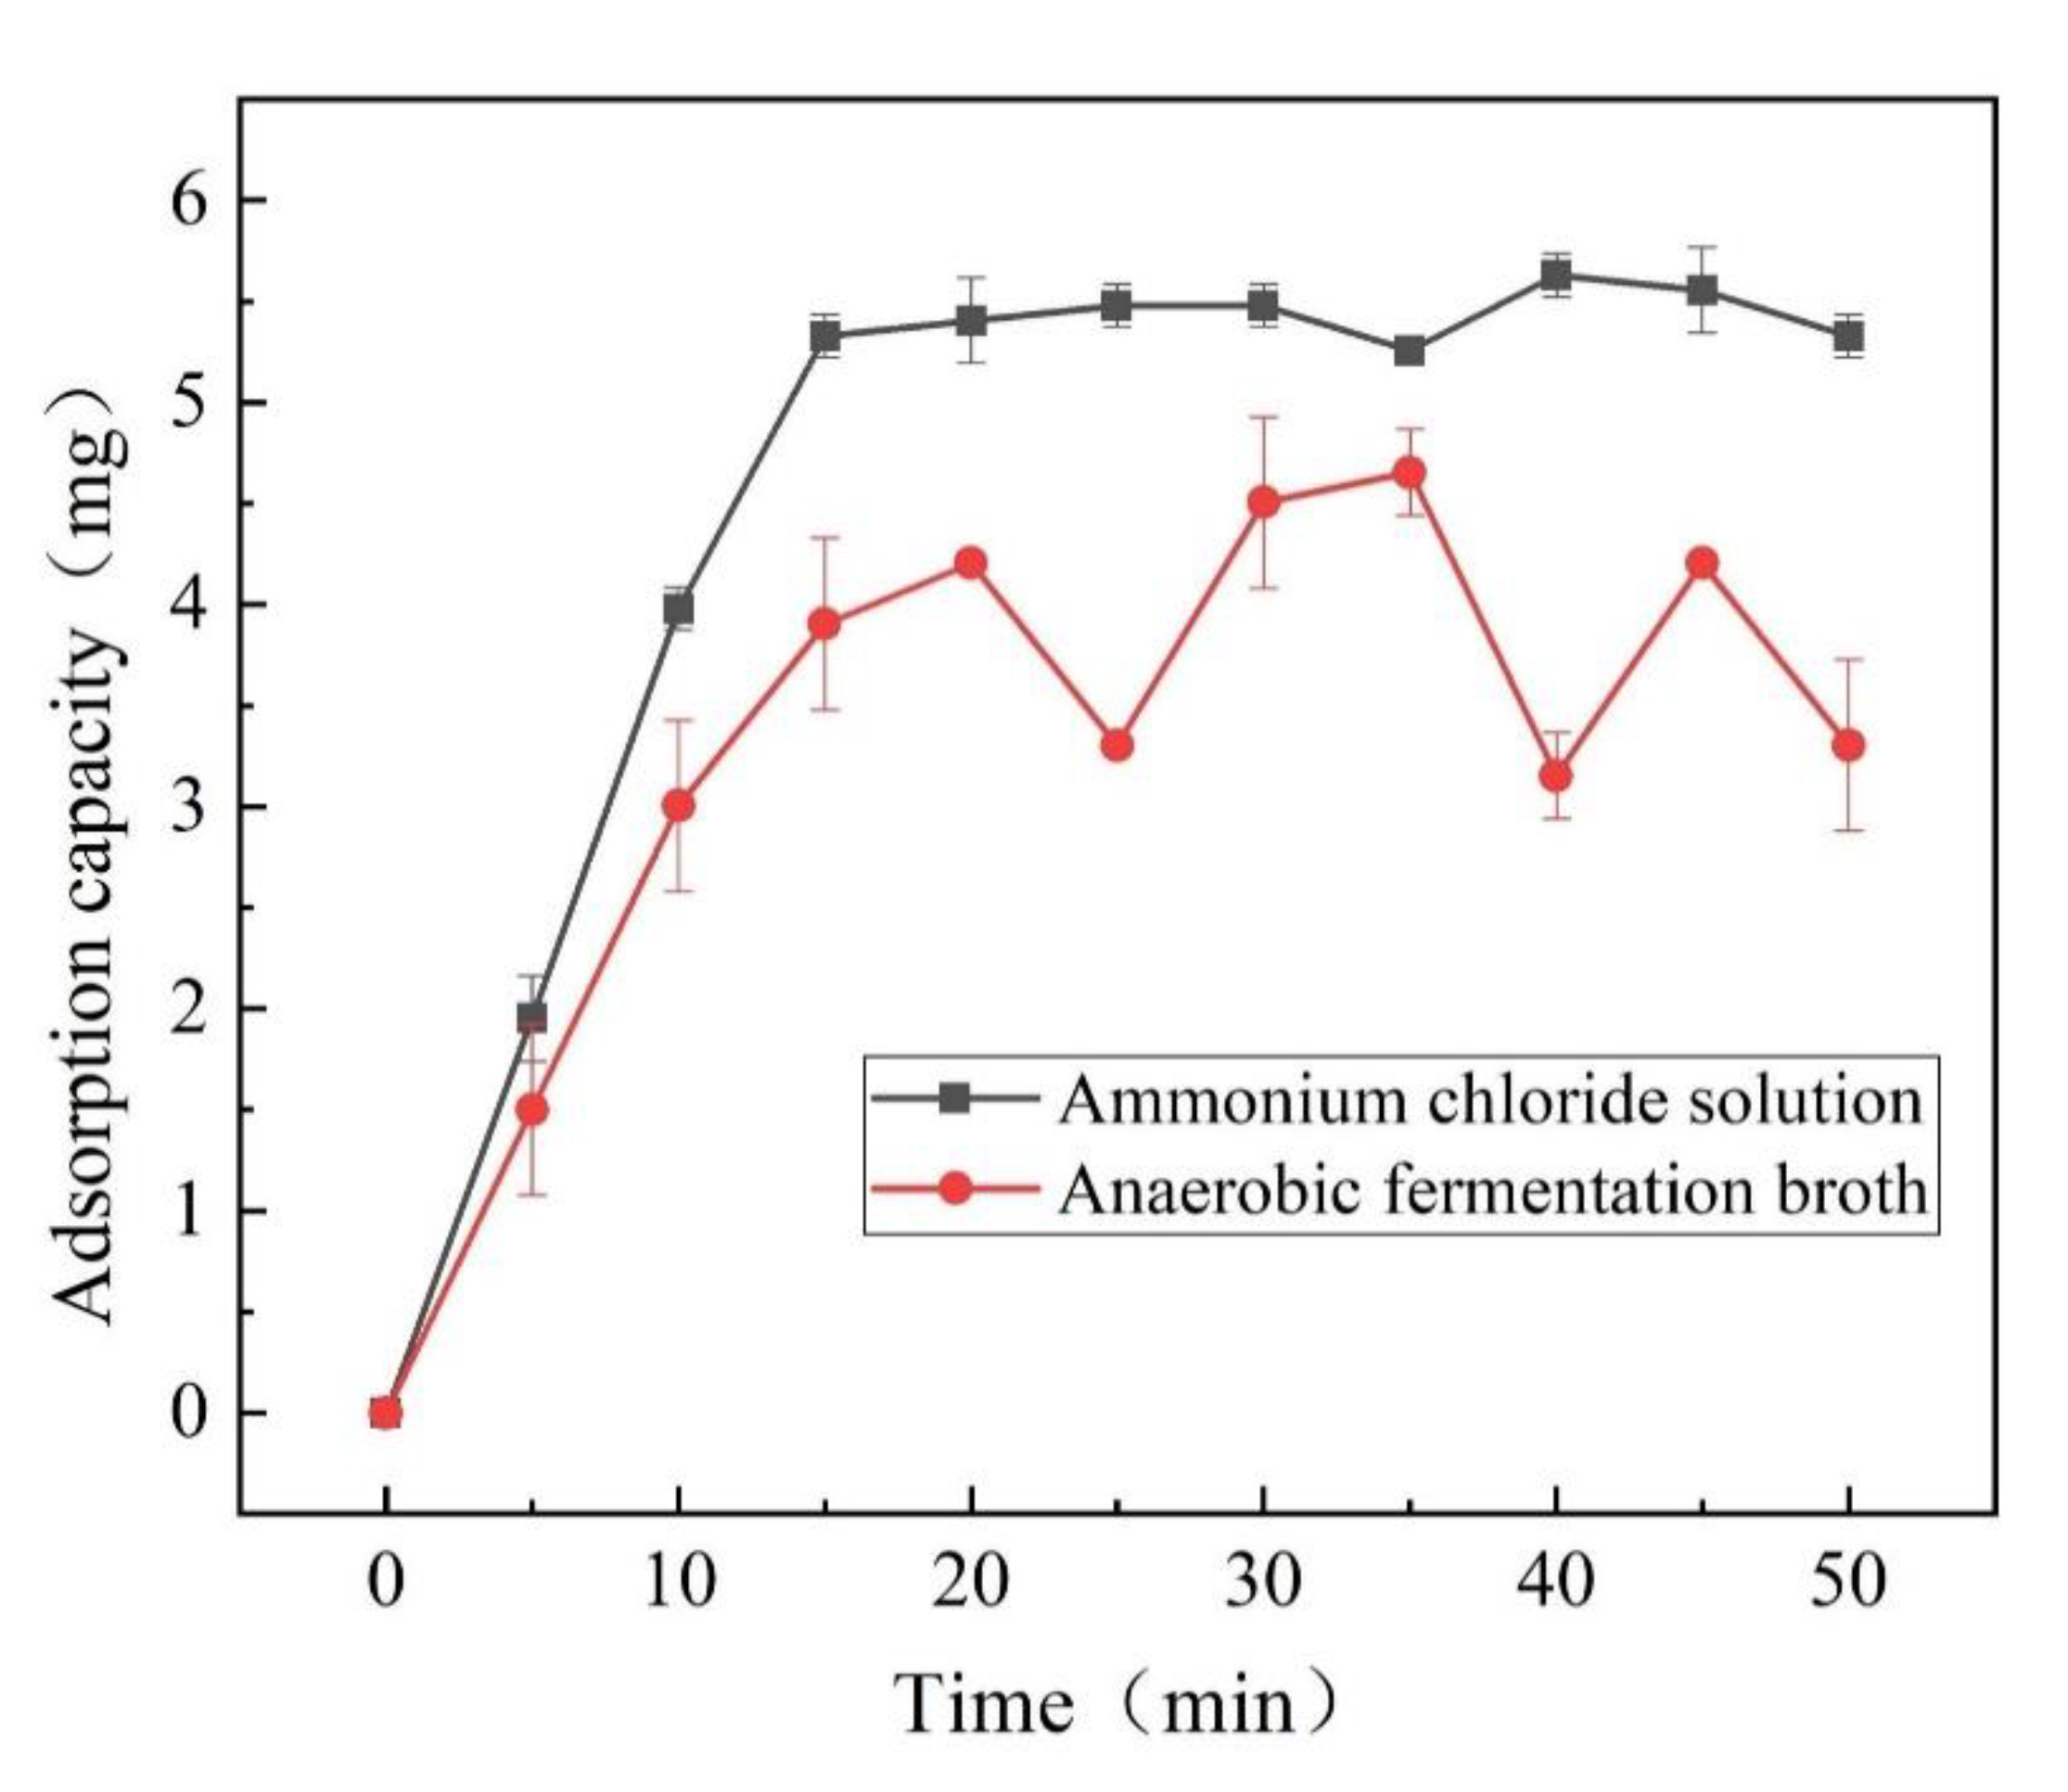
3.8. Comparison of the Adsorption Ammonium Nitrogen Effect of Resin from Biogas Slurry and the Ammonia Chloride Solution

The biogas slurry was centrifuged before 50 mL of supernatant was taken. Then, the ammonia nitrogen concentration without adsorption was scaled. The other Erlenmeyer flask contained 50 mL of the ammonium chloride solution with the same concentration of ammonia nitrogen as the biogas slurry. The adsorption test was performed under the conditions of a resin addition amount of 0.5 g, adsorption temperature of 30 °C, adsorption pH value of 7 and shaker speed of 150 r/min. Samples were taken at 5, 10, 15, 20, 25, 30, 35, 40, 45 and 50 min. After the absorbance was measured by Nessler’s reagent spectrophotometer method, the ammonia nitrogen adsorption capacity was calculated. The results are shown in Figure 9.
Figure 9 shows that the maximum adsorption capacity by the resin from the biogas slurry was 4.8 mg, and the maximum adsorption capacity in the ammonia chloride solution was 5.5 mg. There was a significant difference (p < 0.05) in the adsorption capacity. The ability of resin to adsorb ammonia nitrogen from the biogas slurry significantly reduced. In the process of adsorption of ammonia nitrogen in biogas slurry, the ammonia nitrogen concentration fluctuated greatly in the later period. This was because the biogas slurry contained a large number of interfering ions such as K ions, which would preempt the exchange site with NH4+, resulting in a decrease in the adsorption capacity of ammonia nitrogen [35]. When the ammonia nitrogen concentration in the solution dropped to a certain value, the relative concentration of K+ increased, and the exchange capacity of K+ was better than that of NH4+. The ammonia nitrogen adsorbed by the resin was exchanged, resulting in an increase of the ammonia nitrogen concentration. Then, the adsorption capacity of the resin for NH4+ was better than K+ again, and from there, the concentration of ammonia nitrogen entered a state of fluctuation.

4. Conclusions

The effects and characteristics of adsorption and the slow release of ammonia nitrogen by D113 resin under different conditions were studied. The results showed that increasing the initial ammonia concentration, resin addition amount, temperature and time could improve the adsorption capacity of ammonia nitrogen, and the optimum conditions for adsorption were comprehensively analyzed. Under acidic conditions, hydrogen ions would compete with ammonium ions for adsorption sites, and under alkaline conditions, hydroxide ions would combine with ammonium ions in the solution to form free nitrogen, which greatly affected the adsorption capacity of the resin for ammonia nitrogen. Therefore, the optimal pH value is seven. The adsorption process for ammonia nitrogen is an endothermic process. The adsorption capacity will increase with the increase in temperature and become stable after reaching 30 °C.
The process of ammonia nitrogen adsorption was in accordance with the Langmuir isothermal curve and the quasi-second-order kinetic model. The process of adsorbing ammonia nitrogen is monolayer adsorption and a combination of multiple diffusions. The composition of biogas slurry is very complex, containing a large amount of organic matter and some metal ions, which will affect the adsorption process. Thus, the adsorption efficiency and adsorption capacity of resin for ammonia nitrogen in biogas slurry were lower than those in the NH4Cl solution. Aside from that, the release of ammonia nitrogen can be controlled by adjusting the solubility of the sodium chloride solution. In the process of application, the concentration of the sodium chloride solution can be selected according to the actual situation and the properties of the crop itself. The aim of this study was to solve the problem of a low utilization rate of biogas slurry. The results provide theoretical and practical support for the harmless treatment of biogas slurry and agricultural safety production. The focus of the next research is to further improve the adsorption efficiency of the resin for ammonia nitrogen in biogas slurry and to optimize the slow-release effect of slow-release insecticides.

Author Contributions

Conceptualization, Q.Z. and Z.L.; methodology, Z.L.; software, Z.L.; formal analysis, Z.L.; investigation, Z.L.; data curation, Z.L.; writing—original draft preparation, Z.L.; writing—review and editing, C.L., Y.L. and Z.Z.; supervision, V.P. and F.P.; project administration, H.Z.; funding acquisition, Q.Z. All authors have read and agreed to the published version of the manuscript.

Funding

The present study was financed by the National Key R&D Program of China (2018YFE0206600), National Natural Science Foundation of China (52076068), and China Postdoctoral Science Foundation (2020M681069).

Institutional Review Board Statement

Not applicable.

Informed Consent Statement

Not applicable.

Data Availability Statement

The data are not publicly available due to the need for further research work.

Conflicts of Interest

We declare that we have no conflict of interest to this work. We declare that we do not have any commercial or associative interest that represents a conflict of interest in connection with the work submitted.

References

  1. Perlatti, B.; de Souza Bergo, P.L.; da Silva, M.F.D.G.F.; Batista, J.; Rossi, M. Polymeric Nanoparticle-Based Insecticides: A Controlled Release Purpose for Agrochemicals. Insectic. Dev. Safer More Eff. Technol. 2013, 523–550. [Google Scholar] [CrossRef] [Green Version]
  2. Kaonga, C.C.; Takeda, K.; Sakugawa, H. Concentration and degradation of alternative biocides and an insecticide in surface waters and their major sinks in a semi-enclosed sea, Japan. Chemosphere 2016, 145, 256–264. [Google Scholar] [CrossRef] [PubMed]
  3. Mattos, B.; Rojas, O.; Magalhaes, W. Biogenic silica nanoparticles loaded with neem bark extract as green, slow-release biocide. J. Clean. Prod. 2017, 142, 4206–4213. [Google Scholar] [CrossRef]
  4. Ghormade, V.; Deshpande, M.V.; Paknikar, K. Perspectives for nano-biotechnology enabled protection and nutrition of plants. Biotechnol. Adv. 2011, 29, 792–803. [Google Scholar] [CrossRef] [PubMed]
  5. Colson, A.O.; Besler, B.; Close, D.M.; Sevilla, M.D. Ab initio molecular orbital calculations of DNA bases and their radical ions in various protonation states: Evidence for proton transfer in GC base pair radical anions. J. Phys. Chem. 1992, 96, 661–668. [Google Scholar] [CrossRef]
  6. Bollag, J.-M.; Myers, C.J.; Minard, R.D. Biological and chemical interactions of pesticides with soil organic matter. Sci. Total. Environ. 1992, 123–124, 205–217. [Google Scholar] [CrossRef]
  7. Joshi, P.P.; Van Cleave, A.; Held, D.W.; Howe, J.A.; Auad, M.L. Preparation of slow release encapsulated insecticide and fertilizer based on superabsorbent polysaccharide microbeads. J. Appl. Polym. Sci. 2020, 137, 49177. [Google Scholar] [CrossRef]
  8. Wang, P.; Zhang, X.; Gouda, S.G.; Yuan, Q. Humidification-dehumidification process used for the concentration and nutrient recovery of biogas slurry. J. Clean. Prod. 2019, 247, 119142. [Google Scholar] [CrossRef]
  9. Shi, M.; He, Q.; Feng, L.; Wu, L.; Yan, S. Techno-economic evaluation of ammonia recovery from biogas slurry by vacuum membrane distillation without pH adjustment. J. Clean. Prod. 2020, 265, 121806. [Google Scholar] [CrossRef]
  10. Ma, H. A Brief Analysis on Comprehensive Utilization Strategies of Biogas Slurry. NEBEFS 2012, 36, 5. [Google Scholar]
  11. Baştabak, B.; Koçar, G. A review of the biogas digestate in agricultural framework. J. Mater. Cycles Waste Manag. 2020, 22, 1318–1327. [Google Scholar] [CrossRef]
  12. You, L.; Yu, S.; Liu, H.; Wang, C.; Zhou, Z.; Zhang, L.; Hu, D. Effects of biogas slurry fertilization on fruit economic traits and soil nutrients of Camellia oleifera Abel. PLoS ONE 2019, 14, e0208289. [Google Scholar] [CrossRef] [Green Version]
  13. Wang, L.; Yu, G.; Li, J.; Feng, Y.; Peng, Y.; Zhao, X.; Tang, Y.; Zhang, Q. Stretchable hydrophobic modified alginate double-network nanocomposite hydrogels for sustained release of water-insoluble pesticides. J. Clean. Prod. 2019, 226, 122–132. [Google Scholar] [CrossRef]
  14. Margulis-Goshen, K.; Magdassi, S. Nanotechnology: An Advanced Approach to the Development of Potent Insecticides. Adv. Technol. Manag. Insect Pests 2012, 295–314. [Google Scholar] [CrossRef]
  15. Pang, W.; Hou, D.; Wang, H.; Sai, S.; Wang, B.; Ke, J.; Wu, G.; Li, Q.; Holtzapple, M. Preparation of Microcapsules of Slow-Release NPK Compound Fertilizer and the Release Characteristics. J. Braz. Chem. Soc. 2018, 29, 2397–2404. [Google Scholar] [CrossRef]
  16. Bramhanwade, K.; Shende, S.; Bonde, S.; Gade, A.; Rai, M. Fungicidal activity of Cu nanoparticles against Fusarium causing crop diseases. Environ. Chem. Lett. 2015, 14, 229–235. [Google Scholar] [CrossRef]
  17. Zhuang, C.; Shi, C.; Tao, F.; Cui, Y. Honeycomb structural composite polymer network of gelatin and functional cellulose ester for controlled release of omeprazole. Int. J. Biol. Macromol. 2017, 105, 1644–1653. [Google Scholar] [CrossRef] [PubMed]
  18. Li, Q.; Fu, L.; Wang, Z.; Li, A.; Shuang, C.; Gao, C. Synthesis and characterization of a novel magnetic cation exchange resin and its application for efficient removal of Cu2+ and Ni2+ from aqueous solutions. J. Clean. Prod. 2017, 165, 801–810. [Google Scholar] [CrossRef]
  19. Chen, X.; Sun, S.; Wang, X.; Wen, J.; Wang, Y.; Cao, X.; Yuan, T.; Wang, S.; Shi, Q.; Sun, R. One-pot preparation and characterization of lignin-based cation exchange resin and its utilization in Pb (II) removal. Bioresour. Technol. 2019, 295, 122297. [Google Scholar] [CrossRef] [PubMed]
  20. Kawamoto, D.; Yamanishi, Y.; Ohashi, H.; Yonezu, K.; Honma, T.; Sugiyama, T.; Kobayashi, Y.; Okaue, Y.; Miyazaki, A.; Yokoyama, T. A new and practical Se(IV) removal method using Fe3+ type cation exchange resin. J. Hazard. Mater. 2019, 378, 120593. [Google Scholar] [CrossRef]
  21. Leng, X.; Zhong, Y.; Xu, D.; Wang, X.; Yang, L. Mechanism and kinetics study on removal of Iron from phosphoric acid by cation exchange resin. Chin. J. Chem. Eng. 2018, 27, 1050–1057. [Google Scholar] [CrossRef]
  22. Adelli, G.R.; Balguri, S.P.; Bhagav, P.; Raman, V.; Majumdar, S. Diclofenac sodium ion exchange resin complex loaded melt cast films for sustained release ocular delivery. Drug Deliv. 2017, 24, 370–379. [Google Scholar] [CrossRef] [PubMed] [Green Version]
  23. Atyabi, F.; Sharma, H.; Mohammad, H.; Fell, J. Controlled drug release from coated floating ion exchange resin beads. J. Control. Release 1996, 42, 25–28. [Google Scholar] [CrossRef]
  24. Tarpeh, W.A.; Udert, K.M.; Nelson, K.L. Comparing Ion Exchange Adsorbents for Nitrogen Recovery from Source-Separated Urine. Environ. Sci. Technol. 2017, 51, 2373–2381. [Google Scholar] [CrossRef] [PubMed] [Green Version]
  25. Aljerf, L. High-efficiency extraction of bromocresol purple dye and heavy metals as chromium from industrial effluent by adsorption onto a modified surface of zeolite: Kinetics and equilibrium study. J. Environ. Manag. 2018, 225, 120–132. [Google Scholar] [CrossRef] [PubMed]
  26. Cheng, H.; Zhu, Q.; Xing, Z. Adsorption of ammonia nitrogen in low temperature domestic wastewater by modification bentonite. J. Clean. Prod. 2019, 233, 720–730. [Google Scholar] [CrossRef]
  27. Zhuang, H.; Zhong, Y.; Yang, L. Adsorption equilibrium and kinetics studies of divalent manganese from phosphoric acid solution by using cationic exchange resin. Chin. J. Chem. Eng. 2020, 28, 2758–2770. [Google Scholar] [CrossRef]
  28. Kim, J.; Park, C.W.; Lee, K.-W.; Lee, T.S. Adsorption of Ethylenediaminetetraacetic Acid on a Gel-Type Ion-Exchange Resin for Purification of Liquid Waste Containing Cs Ions. Polymers 2019, 11, 297. [Google Scholar] [CrossRef] [PubMed] [Green Version]
  29. Jatoi, A.S.; Baloch, H.A.; Mazari, S.A.; Mubarak, N.M.; Sabzoi, N.; Aziz, S.; Soomro, S.A.; Abro, R.; Shah, S.F. A review on extractive fermentation via ion exchange adsorption resins opportunities, challenges, and future prospects. Biomass Convers. Biorefin. 2021, 1–12. [Google Scholar] [CrossRef]
  30. Qiu, M.; Hu, C.; Liu, J.; Chen, C.; Lou, X. Removal of High Concentration of Ammonia from Wastewater by the Ion Exchange Resin. Nat. Environ. Pollut. Technol. 2017, 16, 261–264. [Google Scholar]
  31. Ren, Z.; Jia, B.; Zhang, G.; Fu, X.; Wang, Z.; Wang, P.; Lv, L. Study on adsorption of ammonia nitrogen by iron-loaded activated carbon from low temperature wastewater. Chemosphere 2020, 262, 127895. [Google Scholar] [CrossRef] [PubMed]
  32. Zhu, X.; Li, W.; Zhang, C. Extraction and removal of vanadium by adsorption with resin 201 * 7 from vanadium waste liquid. Environ. Res. 2019, 180, 108865. [Google Scholar] [CrossRef] [PubMed]
  33. Bhattacharya, A.; Naiya, T.K.; Mandal, S.; Das, S. Adsorption, kinetics and equilibrium studies on removal of Cr(VI) from aqueous solutions using different low-cost adsorbents. Chem. Eng. J. 2008, 137, 529–541. [Google Scholar] [CrossRef]
  34. Tang, X.; Li, Z.; Chen, Y. Adsorption behavior of Zn(II) on calcinated Chinese loess. J. Hazard. Mater. 2009, 161, 824–834. [Google Scholar] [CrossRef] [PubMed]
  35. Ranjan, R.; Thust, S.; Gounaris, C.; Woo, M.; Floudas, C.A.; von Keitz, M.; Valentas, K.J.; Wei, J.; Tsapatsis, M. Adsorption of fermentation inhibitors from lignocellulosic biomass hydrolyzates for improved ethanol yield and value-added product recovery. Microporous Mesoporous Mater. 2009, 122, 143–148. [Google Scholar] [CrossRef]
Figure 1. (a) Adsorption process. (b) Slow-release process.
Processes 09 01461 g001
Figure 2. Schematic diagram of the molecular structure of the D113 resin.
Processes 09 01461 g002
Figure 3. Standard curve.
Processes 09 01461 g003
Figure 4. Schematic of the experimental procedures.
Processes 09 01461 g004
Figure 5. The effect of (a) resin addition on the ammonia nitrogen adsorption capacity, (b) the initial ammonia nitrogen concentration on the ammonia nitrogen adsorption capacity and (c) the ammonia nitrogen adsorption ratio, (d) pH and (e) time on the ammonia nitrogen adsorption capacity.
Processes 09 01461 g005aProcesses 09 01461 g005b
Figure 6. Adsorption isotherm. (a) Langmuir isotherms. (b) Freundlich isotherms.
Processes 09 01461 g006
Figure 7. Adsorption kinetics. (a) Fitting curve of the quasi-first order kinetic equation. (b) Fitting curve of the quasi-second-order kinetic equation.
Processes 09 01461 g007
Figure 8. The effect of different NaCl concentrations on the slow release of ammonia nitrogen.
Processes 09 01461 g008
Figure 9. Comparison of resin adsorption capacities from the biogas slurry and ammonia chloride solution.
Processes 09 01461 g009
Table 1. Fitting parameters of the adsorption isotherm.
Temperature (K)LangmuirFreundlich
Qm
(mg/g)
Kb
(mL/mg)
R2KfnR2
29311.173221.82920.970410.90912.91210.9182
30315.552149.46150.993222.14472.80660.8836
31316.556336.52940.994921.19153.20410.9462
32316.722422.14820.985616.06912.96300.9605
33316.722416.16220.981121.69322.36290.9682
Table 2. Fitting parameters of the kinetic equations.
Quasi-First Order Kinetic EquationQuasi-Second-Order Kinetic Equation
Qe
mg/g
K1
min−1
R2Qe
mg/g
K2
g/(mg·min)
R2
2.15780.09810.23252.45100.036990.9496
Publisher’s Note: MDPI stays neutral with regard to jurisdictional claims in published maps and institutional affiliations.

