
Experimental Simulation of Hydrate Formation Process in a Circulating Device †


Department of Power Engineering, Faculty of Mechanical Enginneering, University of Žilina, Univerzitna 1, 010 26 Žilina, Slovakia
*
Author to whom correspondence should be addressed.
†
This paper is an extended version of paper published in the international conference: XXII International Scientific Conference—The Application of Experimental and Numerical Methods in Fluid Mechanics and Energy 2020 (AEaNMiFMaE-2020), Piešťany, Slovakia, 7–9 October 2020.
Processes 2021, 9(9), 1529; https://0-doi-org.brum.beds.ac.uk/10.3390/pr9091529
Submission received: 8 June 2021
/
Revised: 23 July 2021
/
Accepted: 25 August 2021
/
Published: 28 August 2021
(This article belongs to the Special Issue Experimental and Numerical Methods in Fluid Mechanics and Energy)
Abstract
:This paper focuses on the model of gas hydrate formation in an experimental device, which allows the circulation of the resulting mixture (water and gas) and significantly accelerates the process of hydrate formation in the laboratory. A 3D model was developed to better imagine the placement of individual parts of the device. The kinetics of hydrate formation were predicted from equilibrium values of chemical potentials. The aim of solving the equations of state gases in the mathematical model was to optimize the parameters involved in the formation of hydrates. The prediction of the mathematical model was verified by numerical simulation. The mathematical model and numerical simulation predict the chemical reaction evolving over time and determine the amount of crystallized water in the reactor. A remarkable finding is that the deviation of the model and simulation at the initiation the calculation of crystallized water starts at 76% and decreases over time to 2%. Subsequently, the number of moles of bound gas in the hydrate acquires the same percentage deviations. The amount of water supplied to the reactor is expressed by both methods identically with a maximum deviation of 0.10%. The different character is shown by the number of moles of gas remaining in the reactor. At the beginning of the calculation, the deviation of both methods is 0%, but over time the deviation slowly increases, and at the end it expresses the number of moles in the reactor with a deviation of 0.14%. By previous detection, we can confirm that the model successfully determines the amount of methane hydrate formed in the reactor of the experimental equipment. With the attached pictures from the realized experiment, we confirmed that the proposed method of hydrate production is tested and takes minutes. The article calculates the energy efficiency of natural gas hydrate in the proposed experimental device.
1. Introduction
Global warming is largely caused by increasing concentrations of CO2 and high amounts of greenhouse gases released into the atmosphere. Natural gas produces less CO2 during combustion and can therefore be an alternative fuel to oil and coal. In addition, their amount is demonstrably reduced by the storage of these gases in stable hydrate structures, and we quickly need to reach a consensus on limiting global warming. As a result, the challenge is to develop technologies for the storage and transmission of natural gas. Natural gas is currently transported mainly in the form of liquefied natural gas (LNG), compressed natural gas (CNG) and pipelines [1].In recent years, the potential for hydrate treatment of natural gas has been explored. It is currently at a very early stage in the development of natural gas hydrates. The transition from scientific theory to practical extraction is underway. Developments towards viable energy efficiency are currently not feasible, although the potential of this new source of hydrocarbons is undeniable. The main reasons are storage capacity, non-explosive character, higher temperature compared to LNG and lower pressure compared to CNG. Therefore, they are beginning to be considered as an energy source for the next decade. However, its industrial use discourages random induction time, slow rate of formation, low gas absorption and energy intensity of formation. These basic disadvantages need to be implemented for hydrates to enter into industrial transport.
The search for an answer to the current issue of natural gas accumulation in hydrate structures is the subject of the work of several foreign institutions and authors around the world. The most used method of accelerating the production of hydrocarbon gas hydrates is mechanical rotary mixing. Studies suggest that rotational agitation can continuously disrupt the surface area at the gas–water interface, shortening the induction time and accelerating hydrate formation at an early stage [2,3]. In addition, during the hydration phase, the viscosity of the resulting suspension increases, and thus the force required to mix it increases. As a result, rotary mixing energy is required on a large scale. However, it is further mentioned that prolonged stirring may result in decomposition of the hydrate formed [4]. A similar study based on the mechanical principle of an impactor is being conducted by a university in China [5]. Scientists have designed a reactor in which the body moves in a reciprocating motion. The main aim is to achieve the displacement of excess in the interspace, which has a negative impact on storage capacity. The impactor acts as a stirrer that crushes the floating hydrated film [5].
Bubble column methods, including injecting water into a gas-filled reactor, are being introduced to accelerate hydrate formation. Properly dispersed gas or water in the reactor will allow faster hydrate formation and higher gas absorption. Scientists from the National Laboratory of Energy Technologies (NETL) are investigating increasing the rate of synthesis of gas hydrates, using variously designed industrially available nozzles. The two-fluid nozzles utilize the interaction of gas resistance to break the surface tension of the liquid into a droplet. Depending on the spraying environment and the resistance of the gas, the surface tension of larger droplets can be overcome, while they are able to form droplets of smaller diameters. Increasing the surface area of water in contact with the gas is a decisive factor for the rapid and favorable formation of the hydrate. The results showed that the fastest continuous formation of methane hydrates is when using a dual fluid nozzle using a solid cone spray pattern [6]. Another study [7] describes hydrate formation in a spray reactor. As in the previous example (NETL), the main part of the experimental equipment is a high-pressure vessel fitted with a nozzle. The main difference was in the design of the nozzle, where during the experiment there was no mixing of water and gas in the nozzle but in the reactor space. The predictions of the mathematical model are remarkable. On the graphs from the numerical simulation, we can notice a very short time of the experiment (370 s), during which the methane hydrate was formed [7]. However, these reactors cause several practical problems, including the formation of foam material and a hydrated shell on the surface of the slurry, which are difficult to break [8]. The long time required to convert large amounts of water and gas into a hydrate is also considered a disadvantage [9].
A completely different approach is presented by systems that simulate marine localities. Water is injected into the porous material, creating a hydrate deposit with high water saturation similar to marine sediments [10,11]. Experimental measurements are usually carried out in a reactor to which a known amount of gas is added, which is filled with dry porous mass, in our case sand. Subsequently, water is fed to the reactor. The phase distribution of the medium in the porous medium was shown to be heterogeneous. This indicated that the hydrates may not be evenly distributed in the porous layer of the medium, as the formation of hydrates is, in practice, random [12]. Although these materials can be shown to accelerate gas absorption and hydrate formation, the main disadvantage is the large volume of the bearing with a relatively low storage capacity [13].
Most published articles evaluate the introduction of additives known as the kinetic promoter very positively. They are surfactants that remarkably improve the kinetics of hydrate formation without affecting thermodynamic conditions [14]. Of these surfactants, the most used promoter is sodium dodecyl sulfate (SDS) [15,16]. Research [17] suggests that the addition of SDS will allow the methane absorption value to reach 97% of the theoretical limit. They concluded that SDS is the most suitable additive to improve the formation of methane hydrate. However, some disadvantages of using SDS in hydrate formation have significantly reduced the possibility of industrial use. When additives are used, the structure of the resulting hydrate is like snow, which reduces the density and increases the storage capacity [18]. Second, the hydrate formed from the SDS solution forms a considerable foam during the dissociation of the hydrate and is less stable than that formed from pure water [19].
Many foreign institutions and authors are currently involved in optimizing temperature and pressure conditions in the field of hydrate formation. The reason for the experiments was to find out how the chosen range of operating temperature and pressure will affect the rate of hydrate formation. The temperature in the reactor was maintained in the range of −15.2 to 0.8 °C and the pressure at 3 to 9 MPa. The result of the experiment states that at too low a temperature (below 0 °C) water freezes, which causes ice to form together with the hydrate in the reactor. It follows that the overall quality of the hydrate was affected by the presence of ice, which reduced the rate of nucleation of water and gas [7].
These and other similar devices provide very suitable conditions for the formation of hydrocarbon gas hydrates. The process of creation can be considered verified and therefore possible in laboratory conditions. Previous foreign studies have provided us with enough data needed to optimize the process of gas accumulation in stable hydrate structures. The results of the experiments helped us to adjust the boundary conditions, which resulted in an increase in the accuracy of the prediction of the mathematical model. Our aim is to focus on the model of gas hydrate formation in an experimental device that allows the circulation of the resulting mixture (water and gas) by means of a pump until the desired hydrate structure is formed. This increases the interaction of the hydrocarbon gas and the water molecules, which can significantly speed up the hydrate formation process. Therefore, it is assumed that, although with different conditions, the hydrate formation modeling will proceed similarly. A similar device has not been analyzed in the world so far; therefore, it is necessary to verify the proposed solution by mathematical model and numerical simulation.
2. Design of Experimental Device
As part of the project, an experimental device was constructed. The design was based on a proven system of injecting water droplets into a gaseous continuous phase using a mixing nozzle. The hydrate formation process then takes place in a high-pressure vessel. Previous findings have made it clear to us that the set pressure conditions play a significant role in the formation process. In our case, they acquired a value of 10 MPa. Temperatures below 0 °C would lead to freezing of excess water, which of course we want to prevent. For this reason, we asset the temperature at 2 °C. The spray angle was 150°, as we can cover a wider area of the container with small particles. The volume of the upper high-pressure vessel was 5.7 L, and the bottom high-pressure vessel was 15 L. The nozzle was designed as a mixer with the possibility of setting the volume flow ratio (1/150). In our case, the upper vessel was pressurized to the required pressure, and the nozzle in this case did not act as a mixer, but it sprayed a mixture of water and dissolved natural gas and a jet of atomized mixture flowed into the pressurized natural gas section and disturbed the levels of water, natural gas and hydrate.
2.1. Process of the Experiment
Before starting the device into operation, it is necessary to fill the system with water. We removed unwanted air from the device by opening the exhaust in the uppermost part of the device, so that the entire space can be filled with water. Before starting the measurement, the liquid was drained from the lower position along the determined lower edge of the sapphire window in the upper high-pressure vessel. We observed the discharge of water through the mentioned sapphire window. The free space was filled with cooled compressed natural gas. Opening the ball valve inserted before entering the nozzle, the cooled compressed natural gas expanded into the upper vessel. When the set pressure was reached, the ball valve was closed. Then we started the pump, which ensures the circulation of a mixture of water and natural gas at high pressure. From this moment on, the experimental measurement was started, and the ongoing processes were monitored through a sapphire lens mounted on high-pressure vessel. Circulation of water in a closed-circuit plunger pump sucked and compressed water to a pressure of 10 MPa. After the water was at a certain pressure, the entire circuit was kept at the required temperature by means of a cooling device. Water under a pressure of 10 MPa will flow through the hose, through the non-return valve towards the nozzle. The pressure in the whole device was up to 10 MPa. Both high-pressure vessels were equipped with a safety valve, which protected the device in the event of a fault, such as an unexpected increase in pressure. The diagram includes a pressure reducing valve for reducing the pressure from 10 MPa to a pressure of approximately 0.5 MPa, as well as an expansion vessel, which has the task of compensating for pressure differences in the system and ensuring the presence of water on the pump suction. The accumulator was used to maintain sufficient pressure to suck in the pump. In the diagram of the experimental device, we can notice the location of several sensors with an electronic output for measuring temperature (NiCrNi thermocouple with measurement accuracy at 0 °C ± 2.5 °C), and the piezoresistive pressure sensor contains an AD converter with a digital output that senses overpressure at atmospheric pressure with a range of measurements 0 … 300 bar (measuring accuracy: 0.05% range at −10 … +40 °C). The position of the sensors is shown in the Figure 1. Temperature sensors were fitted in front of the pump inlet and behind the pump outlet due to how the operation of the pump affects the medium temperature, and hydrate production is sensitive to temperature changes.
The total pressure in the high-pressure circuit was recorded by an absolute pressure sensor located between the upper and lower high-pressure vessels. The pump operates as a circulator, and the pressure behind it is determined by the pressure resistance of the nozzle and the reduction valve. For us, the flow rate was decisive, which we regulated by the pump speed using a frequency converter.
In the experiment, we used transit natural gas with the composition specified in Table 1 and distilled water. After pressurization, the system was isochoric or partially adiabatic with thermal insulation of approximately 20 mm by Armacel.
In the experiment, we used a plunger water pump with an output of 4.7 kW, a maximum pressure of 450 bar and an engine speed of 1420 rpm. To set the optimum flow, the motor speed was regulated by means of a frequency converter. In contrast to a piston pump, the plunger pump does not move with the piston, but it has a fixed seal in the stuffing box. The high-pressure seal of the piston pump destroys faster and cannot handle such a high pressure. Its other advantage is resistance to dirt because the piston does not rest on the walls of the cylinder and the dirt has nowhere to hold.
2.2. Visualization of Experimental Device
In Figure 2 you can see a 3D model of the layout of the individual components of the experimental device.
3. Hydrate Formation Modeling
This section describes selected parameters needed to determine the hydrate formation model. Hydrate formation in a water particle spray system in a gaseous environment was subjected to a process of heterogeneous nucleation that occurred at the gas–solution interface.
3.1. Spraying of Water in the Nozzle
Sauter mean diameter (SMD) expresses the average particle size of sprayed water molecules by a nozzle. It is calculated according to the formula [20]:
where σ = 0.065 kg·s−2, Δpw = 1.107 Pa, and μw = dynamic viscosity of water. Sauter mean diameter is 1.21 × 10⁻⁵ m.
3.2. Chemical Equilibrium between Solution and Gas
The impetus for the development of a new treatment is the difference between the chemical potentials of the old and the new reaction. This difference is called supersaturation and is determined as Δμ. The phase equilibrium between the solution and the hydrate is characterized by Δμ = 0. At the selected temperature T, the supersaturation becomes zero at the so-called equilibrium pressure Pe [20]. Integrating the fugacity definition equation between reference and final states and then substituting for the fugacity fraction we get the equation between the change in chemical potential (in the evaluated state compared to the reference state) and in the activity in the evaluated state. Equation is defined by:
where k is the Boltzmann’s constant (); T is the temperature (K); is the fugacity coefficient (−); is the reactor pressure (Pa); is the equilibrium pressure (Pa); is the volume difference (m3). The supersaturation is 4.12 × 10⁻²¹ Joules. In this case, a long enough period has elapsed for the aqueous and gaseous phases to reach equilibrium upon contact with each other [20].
3.3. Kinetic Parameter for Heterogeneous Nucleation
The kinetic parameter of heterogeneous nucleation particles of the same size is given as [21]:
wherein Z is the Zeldovich factor 0.01 (−); is the sticking coefficient for nucleation (−); c = 4.8 is the constant for spherical nucleus (−); = 2.16 × 10⁻²⁸ is the volume of hydrate unit (m3); = 1 × 10⁻⁹ is the diffusion coefficient of the gas molecules in the bulk of the solution (m2/s); = 3 × 1025 is the concentration of dissolved gas at phase equilibrium between hydrate and solution (m−3); ns = 50 is the nucleus size (−); Ap = 1 × 10⁻¹⁴ is the surface area of such a particle (m2); Cp = 1 × 10¹⁵, the concentration of nucleation-active particles in the solution volume (m−3); = 1.2 × 10⁻¹⁹ is the area occupied by a water molecule on the particle surface (m2) [21]. The kinetic factor represents a specific mechanism of attachment of hydrate building blocks to the hydrate core. This factor can be considered independent, and in general hydrate nucleation is controlled by volume diffusion of dissolved gas molecules toward the hydrate nuclei [22]. The kinetic factor for heterogeneous nucleation is 4.31 × 1026 m−3·s−1.
3.4. Nucleation Rate
The nucleation process is classified as progressive, meaning that during the crystallization process, the growth of hydrate crystals is continuous. [21] The equation is given as:
where = 0.014 is the specific surface energy (J·m2). Numerically expressed shape factor c = 4.84 (−). The nucleation rate is 3.30 × 10¹² m−3·s−1, the other terms in the equation are mentioned in the previous part of the article.
3.5. Crystal Growth Constant
Water particles sprayed in a gaseous medium by diffusion of dissolved gas penetrate through the standing layer formed when the mixture is stirred. The correlation for such a growth constant G1 is given by [23]:
wherein D is the diffusion coefficient (m2·s−1); is the concentration of dissolved gas at phase equilibrium between hydrate and solution (m3); is the thickness of the stagnant layer at the crystallite surface (m) [21]. Calculates growth constant during injection has a value 1.28 × 10⁻⁵ m·s−1.
3.6. Fraction of Solution Crystallised
The crystal fraction of the initial amount of water supplied crystallized at a given time into a solid volume is given by following formula [24]:
wherein m is the growth rate exponent for the injection period, growth rate exponent for injection period, and it is a value 1,6 (−); t is the time (s); b is the shape factor of crystals (−).
3.7. Hydrate Formation Rate Constant
The rate constant of hydrate formation at any time during the injection period can be calculated by deriving the crystallization fraction over time using the following equation:
3.8. Calculate the Amount of H2O in the Reactor
The molar balance of water in the experimental device at any time is a variable component of the amount of water injected into the pressure vessel and is given by the equation [25]:
The aim of solution is always to find the molar concentration of H2O in the reaction volume (mol·m−3). The reaction volume is the volume in the reactor that is filled with something, is the initial molar concentration of water at time 0 s. Then, the water is only in a liquid state. After editing Equation (8), it changes to the next equation:
where in x is the time (s); y is the molar concentration of H2O (mol·m−3); is the constant values 6.49 × 10⁻¹² (m−3·s−1). This is an ordinary linear differential equation of the first order, in which only the first derivative of the sought solution y (x) appears. Equation (9) can only be solved numerically, which means that we cannot find any function of the variable x that would be its solution. There are many methods to find at a given time the most inaccurate approximation of the derivative. The simplest method of numerical solution of ordinary differential equations is the Euler method. The solution is based on an approximate calculation of the derivative of the function y′ (x) in Equation (9) using the finite difference approximation method. In the calculation, we proceed in accordance with the recurrent formula of the Euler method:
where n is the number of differences in the solved interval, and i is the selected steps.
3.9. Total Hydrate Formation
The initial amount of gas in the reactor at the specified pressure and temperature conditions can be calculated using the equation of the gas law [7]:
wherein is the reactor pressure (Pa); z is the z–Factor (−); Rc is the universal gas constant (J·K−1·mol−1), and is the volume of the reactor (m3) [26].
The moles of water remaining in the system, in the form of ice, can be calculated at any time as follows according to the formula:
where during the spraying phase of the water in the gas moles of H2O will be supplied in the system at each time t; at this same time moles will be crystallized from them in the hydrate. This means that at any time moles of H2O will be in the system.
We supply water with a flow Q. The flow Q is the volume of water delivered in 1 s. In our case, we substitute the value 0.0021 l·s−1 at a pressure of 100 bar for the flow. Then the number of moles of H2O delivered at time is:
where is the molar mass of water (g.mol−1); is the molar concentration of water fed to the reactor (mol·m−3); Q is the flow (l·s−1), the number of moles of water injected into the experimental device.
The number of moles of crystallized water during the injection process is calculated by the following formula:
The moles of gas bound in the hydrate structure are calculated according to the equation [27]:
where β = 1/6 is the is the equilibrium molar ratio between gas and water in hydrates (−).
The moles of gas present in the reactor at any time during the experiment are calculated according to the formula:
the initial amount of gas . We supply the total amount of gas to the system right at the beginning, and we do not supply any gas during the experiment. We always have a constant amount of gas . Hydrate formation is shown in graphical form (Figure 3).
Mwi is the number of moles of water injected in a liquid state at a certain flow rate; therefore, it increases linearly in Figure 3. Mwc is the number of moles of water crystallized into the hydrate structure. Mgr is an indication of the total amount of gas to the system right at the beginning, and we do not supply any gas during the experiment. Mgh is the number of moles of gas bound in the hydrate.
4. Numerical Simulation
The MATLAB software interface specializes in modeling dynamic systems based on the use of algorithms, which mainly solve numerically nonlinear differential equations. In our case, we work with an ordinary differential equation (ODE) of the first order:
which contains one derivative of the dependent variable y with respect to the independent variable t, which denotes time. There are several solvers in MATLAB to solve differential equations. When choosing a solver, we reached for ODE 45, which is universal and works properly for most problems, so it was our first choice. Solver ODE 45 works based on the Runge–Kutta method, which is one of the most commonly used one-step methods. It is basically based on Taylor’s evolution of the function, but indirectly so that we do not have to determine the values of the derivatives of the function. These values are approximated by calculating the function itself at appropriately chosen strategic points [28]. The ODE 45 integrates the differential equation (Equation (9)) of the interval from 10.01 to 900.01 with a time step of 30 s, with the initial condition y0 = 5.56 × 10⁴ mol·m−3, which represents the initial molar concentration of water, when the water is only in its liquid state. The resulting output is a column vector of time points x and a solution field y. Each line y corresponds to the time in the corresponding line x. The parameters entered the numerical simulation are defined in the Table 2.
5. Discussion
The aim of the experiment was to subject a specific application to numerical simulations and then compare the results with a mathematical model. By comparing the results, we can evaluate the extent to which the mathematical model is reliable and able to simulate the formation of hydrate structures over time. An apparent deviation arose from the crystallization of water (Table 3), where both methods predicted the same exponential course (Figure 4). This difference is partly due to the calculation of the differential equation, where the numerical simulation solves the equation based on the Runge–Kutta method and the mathematical model by a simpler Euler method. This comparison shows that a significant part of the components entering the process of forming hydrate structures in a mathematical model had a similar process as assumed by numerical simulation.
6. Experiment
In the experimental measurement with a set pressure of 100 bar and cooling of the device to temperatures between 1.9 and 1.7, the conditions were deeply embedded in formation of hydrate structures. Due to the saturation of the water with gas, there was a sharp drop in pressure. The pressure conditions recorded during the measurement are shown in Figure 5.
From the time evolution of the pressure profile shown in Figure 5, we can see that the experimental device reached a pressure of 88.4 bar at the end of the experiment. The total pressure drop was 11.6 bar.
In order to achieve a high rate of hydrate formation, it is necessary to stabilize the temperature conditions with the smallest possible deviation from the desired value during the measurement. Hydrate formation is characterized by an increase in temperature, which is manifested by heating the upper vessel where the process of injecting water fragments into the gaseous medium takes place (Figure 6). The heat released by the formation of the hydrate is effectively dissipated into the aqueous phase and transferred to the walls of the vessel, which are continuously cooled. Over time, the hydrates formed flowed into the lower vessel, where they caused a slight increase in temperature, which was captured by temperature sensors mounted on the lower vessel.
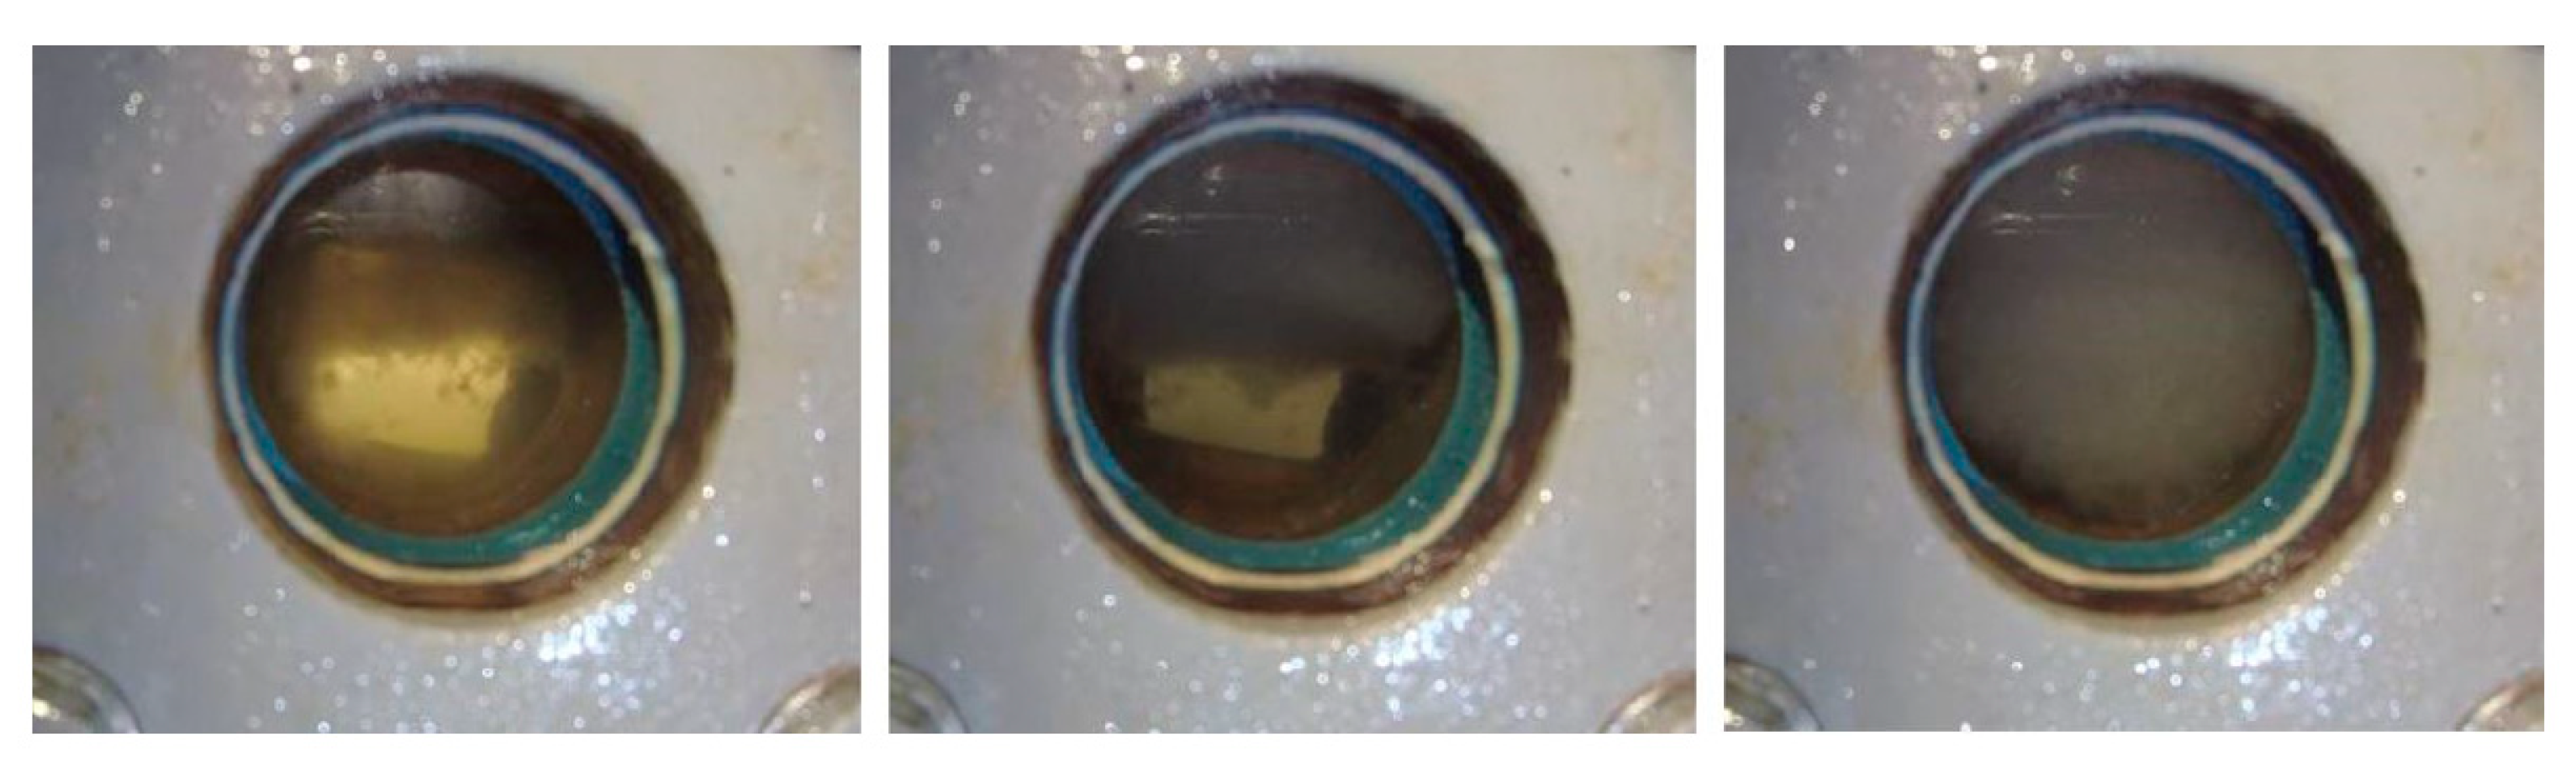
Natural gas with a volume of 2.89 m3 was forced into the device. The numerical simulation predicted the highest methane absorption from 400 to 900 s during the circulation of water by the high-pressure pump. During the experiment, the high-pressure pump was shut down within 820 s due to a visual change in the surroundings at the bottom of the pressure vessel. The resulting mass of crystallized water and hydrate was collected on a sieve at the bottom and clogged the circulation circuit. Based on the change in the sound of the pump, we concluded that the suction line was not flooded, and the pump did not work at all. To ensure the protection of the pump, it was subsequently shut down. The hydrate stability zone is maintained after the pump is disconnected from operation. A record of the gradual formation of the hydrate is shown in the Figure 7.
When the hydrate formation was considered complete based on a visual assessment of the hydrate through a sapphire window, a process of reducing the pressure occurred. The depressurization step was initiated by opening the drain valve at the bottom of the vessel. The pressure drop was accompanied by the discharge of water from the system. After draining the water, the system was purged with cooled natural gas until the dried hydrate was completely dried and compacted. After unscrewing the flange placed on the lower high-pressure recruitment, we can in Figure 8 notice the hydrate formed dried by compressed natural gas.
7. Energy Utilization of Natural Gas Hydrates Produced in an Experimental Device
The EROEI coefficient expresses the ratio of used energy obtained from certain energy source to the amount of energy invested. It is sometimes referred to as EROEI. Energy consumption can be generally expressed by the following equation:
The whole calculation is designed as a framework with limited data. In this case energy inputs are related to primary energy. It is further assumed that the hydrate will be melted by waste heat. The energy expended is divided into four parts [29].
Primary energy of gas filling: Ec = 335,605 J. Energy for cooling the gas circuit: Eg = 68,834 J. Pump energy Ep = 22,444 J and energy for water cooling Ew = 15,058 J.
Usable energy calculates the calorimetric value of natural gas QCV = 34 × 106 J·m−3 and volume of natural gas synthesized into hydrate structures VNG = 0.1746 m3. The primary usable energy EPE is given by:
then:
after substituting into Equation (19) is = 5936.4 kJ and to Equation (20) is EROEI = 13.43. Hydrate production with this coefficient value is generally favorable. According to a study [18] in their experiment simulating the marine sediment environment, they reached the highest EROEI value of 11.31.
8. Conclusions
The article deals with the design of an experimental device designed for the continuous production of synthetic methane hydrate. Hydrates of natural gas or methane have an interesting potential in terms of storage capacity, and therefore the future need for energy from hydrocarbon sources may be a requirement to improve the synthetic processes of hydrate formation. At the beginning of the article, a circuit diagram of the experimental device with a complete description and principle of operation is proposed. A 3D model was developed to better imagine the placement of individual parts of the device. The kinetics of hydrate formation were predicted from equilibrium values of chemical potentials. The prediction of the mathematical model was verified by numerical simulation. In both cases, the hydrate formation process was exponential. Comparing the mathematical model and the numerical simulation, we found that the values of water crystallization and the values of bound gas in the hydrate during the experiment at 100 s reached the highest recorded deviation of 76%. An interesting finding is that the deviation decreased over time and reached only 2% in 820 s. The amount of water supplied to the reactor was expressed by both methods identically with a deviation of 0.10% in a time of 10 s, and in a time of 280 to 820 s the deviation was 0%. The different process showed the number of moles of gas remaining in the reactor . At the beginning of the experiment, the deviation of both methods was 0%, but over time the deviation slowly increased, and the mathematical model and numerical simulation at 820 s indicated the number of moles in the reactor with a deviation of 0.14%. From the previous data we can confirm that the model successfully determines the amount of methane hydrate formed in the reactor of the experimental device.
The proposed model can be adapted by changing the adjustable parameters to any other gas. For example, it would find use to address the current issue of the growing amount of greenhouse gases released into the atmosphere. Their amount is demonstrably reduced by depositing these gases in stable hydrate structures.
Author Contributions
Conceptualization, D.H. and P.M.; methodology, M.H.; software, D.H. and A.K.; validation, A.K., M.H. and P.M.; formal analysis, P.M.; investigation, D.H.; resources, M.H.; data curation, D.H.; writing—original draft preparation, D.H.; visualization, P.M. and D.H.; supervision, A.K.; project administration, M.H. All authors have read and agreed to the published version of the manuscript.
Funding
This paper was written with financial support from the granting agency KEGA within the Project Solution No. 046ŽU-4/2021, from the granting agency KEGA within the Project Solution No. 021ŽU-4/2021, from the granting agency APVV within the Project Solution No. PP-COVID-20-0113.
Institutional Review Board Statement
Not applicable.
Informed Consent Statement
Not applicable.
Data Availability Statement
Data available in a publicly accessible repository.
Conflicts of Interest
The authors declare no conflict of interest.
References
- Sloan, E.D., Jr. Fundamental principles and applications of natural gas hydrates. Nature 2003, 426, 353–363. [Google Scholar] [CrossRef]
- He, Y.Y.; Rudolph, E.S.J.; Zitha, P.L.J.; Golombok, M. Kinetics of CO2 and methane hydrate formation: An experimental analysis in the bulk phase. Fuel 2011, 90, 272–279. [Google Scholar] [CrossRef]
- Linga, P.; Daraboina, N.; Ripmeester, J.A.; Englezos, P. Enhanced rate of gas hydrate formation in a fixed bed column filled with sand compared to a stirred vessel. Chem. Eng. Sci. 2012, 68, 617–623. [Google Scholar] [CrossRef]
- Hao, W.F.; Wang, J.Q.; Fan, S.-S.; Hao, W.B. Study on methane hydration process in a semi-continuous stirred tank reactor. Energy Convers. Manag. 2007, 48, 954–960. [Google Scholar] [CrossRef]
- Xiao, P.; Yang, X.-M.; Sun, C.-Y.; Cui, J.-L.; Li, N.; Chen, G.-J. Enhancing methane hydrate formation in bulk water using vertical reciprocating impact. Chem. Eng. J. 2018, 336, 649–658. [Google Scholar] [CrossRef]
- Brown, D.T.; Taylor, E.C.H.; Bernardo, P.M. Rapid Gas Hydrate Formation Processes: Will They Work? Energies 2010, 3, 1154–1175. [Google Scholar] [CrossRef] [Green Version]
- Gnanendran, N.; Amin, R. Modelling hydrate formation kinetics of a hydrate promoter-water-natural gas system in a semi-batch spray reactor. Chem. Eng. Sci. 2004, 59, 3849–3863. [Google Scholar] [CrossRef]
- Luo, Y.T.; Zhu, J.-H.; Fan, S.-S.; Chen, G.-J. Study on the kinetics of hydrate formation in a bubble column. Chem. Eng. Sci. 2007, 62, 1000–1009. [Google Scholar] [CrossRef]
- Linga, P.; Haligva, C.; Nam, S.C.; Ripmeester, J.A.; Englezos, P. Gas Hydrate Formation in a Variable Volume Bed of Silica Sand Particles. Energy Fuels 2009, 23, 5496–5507. [Google Scholar] [CrossRef]
- Zhong, D.L.; Lu, Y.Y.; Sun, D.J.; Zhao, W.L.; Li, Z. Performance evaluation of methane separation from coal mine gas by gas hydrate formation in a stirred reactor and in a fixed bed of silica sand. Fuel 2015, 143, 586–594. [Google Scholar] [CrossRef]
- Linga, P.; Haligva, C.; Nam, S.C.; Ripmeester, J.A.; Englezos, P. Recovery of methane from hydrate formed in a variable volume bed of silica sand particles. Energy Fuels 2009, 23, 5508–5516. [Google Scholar] [CrossRef]
- Chong, Z.R.; Pujar, G.A.; Yang, M.; Linga, P. Methane hydrate formation in excess water simulation marine locations and the impact of thermal stimulation on energy recovery. Appl. Energy 2016, 177, 409–421. [Google Scholar] [CrossRef]
- Linga, P.; Clarke, M.A. A review of reactor designs and materials employed for increasing the rate of gas hydrate formation. Energy Fuels 2017, 31, 1–13. [Google Scholar] [CrossRef]
- Karaaslan, U.; Parlaktuna, M. Surfactants as hydrate promoters. Energy Fuels 2000, 14, 1103–4273. [Google Scholar] [CrossRef]
- Kumar, A.; Bhattacharjee, G.; Kulkarni, B.D.; Kumar, R. Role of surfactants in promoting gas hydrate formation. Ind. Eng. Chem. Res. 2015, 54, 12217–12232. [Google Scholar] [CrossRef]
- Mohammadi, A.; Manteghian, M.; Haghtalab, A.; Mohammadi, A.H.; Rahmati-Abkenar, M. Kinetic study of carbon dioxide hydrate formation in presence of silver nanoparticles and SDS. Chem. Eng. J. 2014, 237, 387–395. [Google Scholar] [CrossRef]
- Link, D.D.; Ladner, E.P.; Elser, H.A.; Taylor, C.E. Formation and dissociation studies for optimizing the uptake of methane by methane hydrates. Fluid Phase Equilib. 2003, 211, 1–10. [Google Scholar] [CrossRef]
- Gayet, P.; Dicharry, C.; Marion, G.; Graciaa, A.; Lachaise, J.; Nesterov, A. Experimental determination of methane hydrate dissociation curve up to 55 MPa by using a small amount of surfactant as hydrate promoter. Chem. Eng. Sci. 2005, 60, 5751–5758. [Google Scholar] [CrossRef]
- Lin, W.; Chen, G.-J.; Sun, C.-Y.; Guo, X.-Q.; Wu, Z.-K.; Liang, M.-Y.; Chen, L.-T.; Yang, L.-Y. Effect of surfactant on the formation and dissociation kinetic behavior of methane hydrate. Chem. Eng. Sci. 2004, 59, 4449–4455. [Google Scholar] [CrossRef]
- Kashchiev, D.; Firoozabadi, A. Driving force for crystallization of gas hydrates. J. Cryst. Growth 2002, 241, 220–230. [Google Scholar] [CrossRef]
- Kashchiev, D.; Firoozabadi, A. Induction time in crystallization of gas hydrates. J. Cryst. Growth 2003, 250, 499–515. [Google Scholar] [CrossRef]
- Kashchiev, D.; Firoozabadi, A. Nucleation of gas hydrates. J. Cryst. Growth 2002, 243, 476–489. [Google Scholar] [CrossRef]
- Mullin, J.W. Crystallization, 4th ed.; Butterworth-Heinemann: Oxford, UK, 2001; pp. 216–284. [Google Scholar]
- Kashchiev, D. Nucleation, 1st ed.; Butterworth-Heinemann: Oxford, UK, 2000; pp. 30–40. [Google Scholar]
- Froment, G.F.; Bischoff, K.B. Chemical Reactor Analysis and Design, 1st ed.; John Wiley & Sons: New York, NY, USA, 1990; pp. 106–129. [Google Scholar]
- Almeida, J.; Barbieri, R.; Velásquez, J.A. A Methodology for Calculating the Nature Gas Compressibility Factor for a Distribution Network. Pet. Sci. Technol. 2014, 32, 2616–2624. [Google Scholar] [CrossRef]
- Gnanendran, N.; Amin, R. Equilibrium hydrate formation conditions for hydrotrope-water-natural gas systems. Fluid Phase Equilib. 2004, 221, 175–187. [Google Scholar] [CrossRef]
- MathWorks. Available online: https://ch.mathworks.com/help/matlab/ref/ode45.html (accessed on 15 April 2021).
- Kantová, N.Č.; Sladek, S.; Jandačka, J.; Čaja, A.; Nosek, R. Simulation of Biomass Combustion with Modified Flue Gas Tract. Appl. Sci. 2021, 11, 1278. [Google Scholar] [CrossRef]
Figure 1.
Scheme of experimental device.

Figure 2.
3-D model of experimental device.

Figure 3.
Changes in reactor components over time as predicted by a mathematical model.

Figure 4.
Comparison of hydrate prediction mathematical model and numerical simulation.

Figure 5.
Pressure profiles.

Figure 6.
Temperature profiles.

Figure 7.
Hydrate formation record, scale 1:2.

Figure 8.
Formed natural gas hydrate, scale 1:1.


Table 1.
Composition of natural gas.
| Composition of Natural Gas [mol%] | ||||||||||
|---|---|---|---|---|---|---|---|---|---|---|
| Methane | Ethane | Propane | Isobutane | n-Butane | iso-Pentane | n-Pentane | neo-Pentane | Hexane | CO2 | N |
| 94.605 | 2.988 | 0.703 | 0.102 | 0.111 | 0.025 | 0.019 | 0.001 | 0.028 | 0.603 | 0.815 |
Table 2.
Hydrate reactor model parameters.
| Description | Units | Value |
|---|---|---|
| Pressure | MPa | 10 |
| Temperature | °C | 2 |
| Water flow rate | l·s−1 | 2.1 × 10⁻³ |
| Reactor volume | m3 | 20.7 × 10⁻³ |
Table 3.
Comparison of hydrate prediction mathematical model and numerical simulation using percentage change.
Table 3.
Comparison of hydrate prediction mathematical model and numerical simulation using percentage change.
| Time | Mathematic Model | Numerical Simulation | Percentage Change | |||||||||
|---|---|---|---|---|---|---|---|---|---|---|---|---|
| t (s) | (mol) | (mol) | (mol) | (mol) | (mol) | (mol) | (mol) | (mol) | % | % | % | % |
| 10 | 0 | 0 | 1.15 | 118.36 | 0 | 0 | 1.17 | 118.36 | 0 | 0 | 0.10 | 0 |
| 100 | 8.64 × 10⁻⁴ | 1.50 × 10⁻⁴ | 11.66 | 118.36 | 1.51 × 10⁻³ | 2.62 × 10⁻⁴ | 11.67 | 118.36 | 76 | 76 | 0.01 | 0 |
| 190 | 0.03 | 4.99 × 10⁻³ | 22.16 | 118.36 | 0.04 | 6.50 × 10⁻³ | 22.17 | 118.36 | 30 | 30 | 0.01 | 0 |
| 280 | 0.22 | 0.04 | 32.67 | 118.33 | 0.26 | 4.50 × 10⁻² | 32.67 | 118.32 | 19 | 19 | 0 | 0.01 |
| 370 | 0.92 | 0.16 | 43.17 | 118.20 | 1.04 | 0.18 | 43.17 | 118.18 | 13 | 13 | 0 | 0.02 |
| 460 | 2.75 | 0.48 | 53.67 | 117.89 | 3.02 | 0.52 | 53.67 | 117.84 | 10 | 10 | 0 | 0.04 |
| 550 | 6.64 | 1.15 | 64.17 | 117.21 | 7.14 | 1.24 | 64.17 | 117.12 | 8 | 8 | 0 | 0.07 |
| 640 | 13.70 | 2.37 | 74.67 | 115.99 | 14.46 | 2.51 | 74.67 | 115.86 | 6 | 6 | 0 | 0.11 |
| 730 | 24.86 | 4.31 | 85.17 | 114.06 | 25.80 | 4.47 | 85.17 | 113.89 | 4 | 4 | 0 | 0.14 |
| 820 | 40.45 | 7.01 | 95.67 | 111.35 | 41.36 | 7.17 | 95.67 | 111.19 | 2 | 2 | 0 | 0.14 |
Publisher’s Note: MDPI stays neutral with regard to jurisdictional claims in published maps and institutional affiliations. |
© 2021 by the authors. Licensee MDPI, Basel, Switzerland. This article is an open access article distributed under the terms and conditions of the Creative Commons Attribution (CC BY) license (https://creativecommons.org/licenses/by/4.0/).
Share and Cite
MDPI and ACS Style
Hečko, D.; Mičko, P.; Holubčík, M.; Kapjor, A. Experimental Simulation of Hydrate Formation Process in a Circulating Device. Processes 2021, 9, 1529. https://0-doi-org.brum.beds.ac.uk/10.3390/pr9091529
AMA Style
Hečko D, Mičko P, Holubčík M, Kapjor A. Experimental Simulation of Hydrate Formation Process in a Circulating Device. Processes. 2021; 9(9):1529. https://0-doi-org.brum.beds.ac.uk/10.3390/pr9091529
Chicago/Turabian StyleHečko, Dávid, Pavol Mičko, Michal Holubčík, and Andrej Kapjor. 2021. "Experimental Simulation of Hydrate Formation Process in a Circulating Device" Processes 9, no. 9: 1529. https://0-doi-org.brum.beds.ac.uk/10.3390/pr9091529
Note that from the first issue of 2016, this journal uses article numbers instead of page numbers. See further details here.