An Epidemic Grid Model to Address the Spread of Covid-19: A Comparison between Italy, Germany and France


Abstract
:1. Introduction
2. Materials and Methods
2.1. Related Work
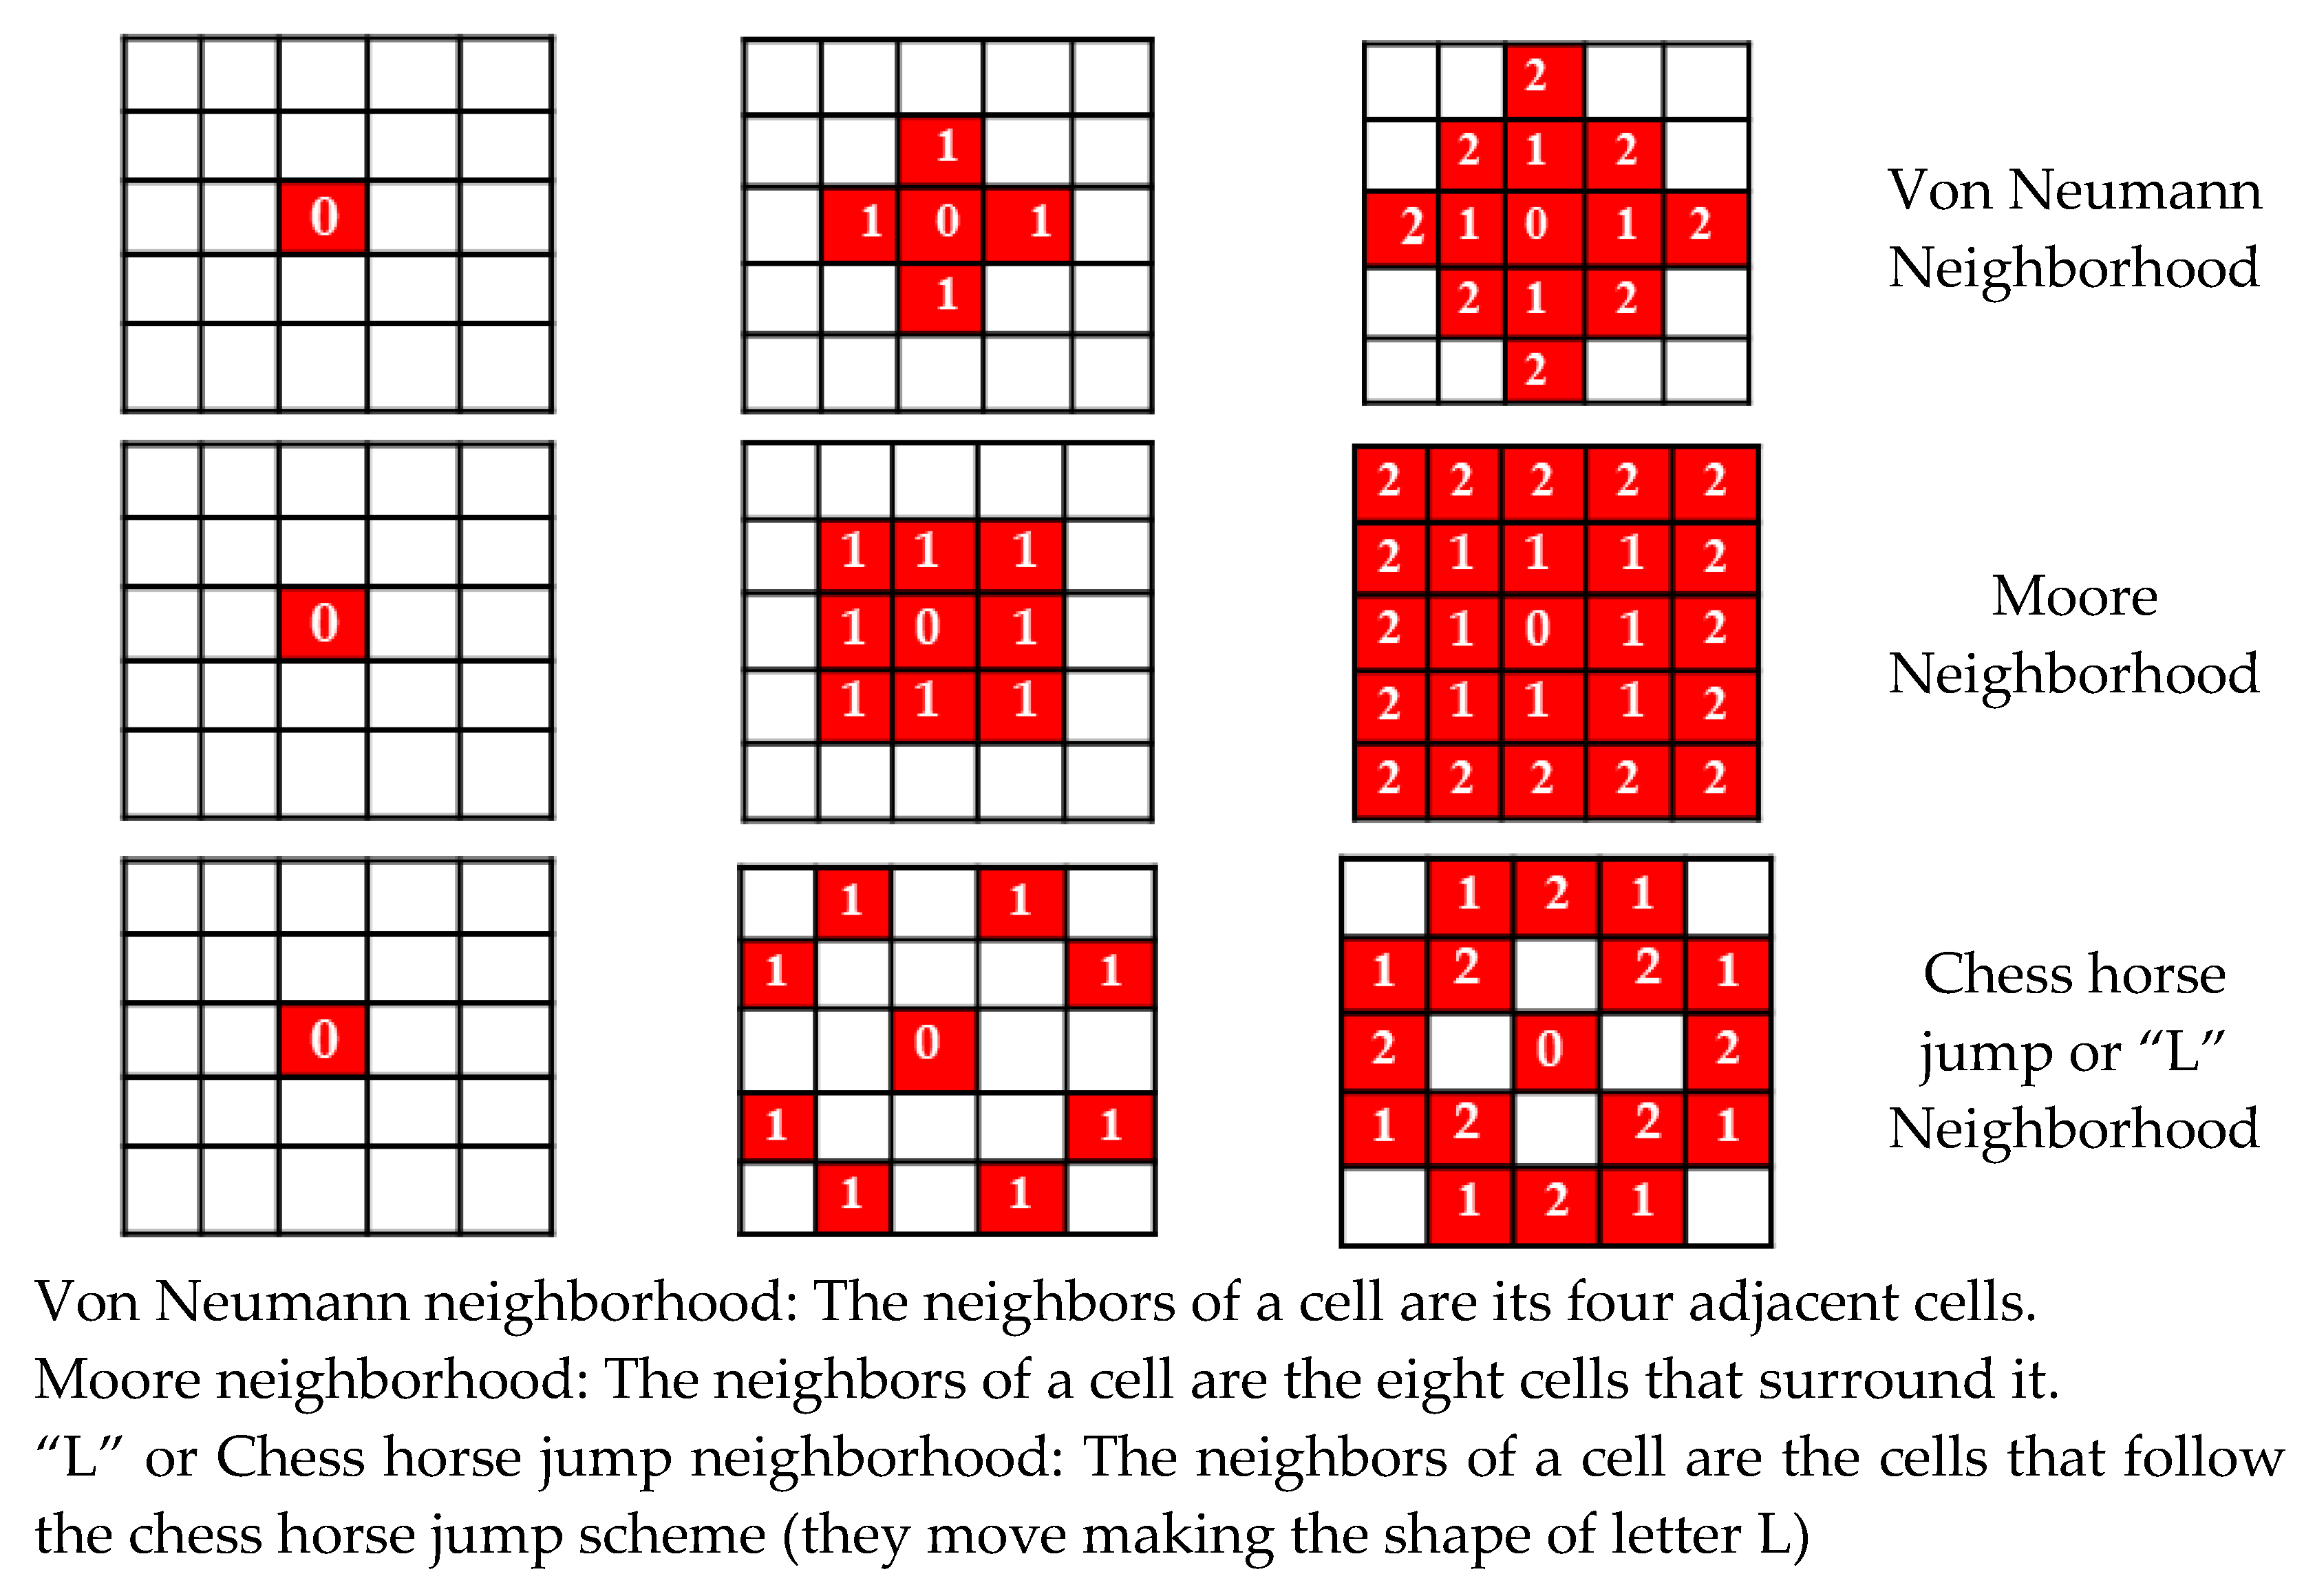
2.2. Method

3. Results
3.1. The Expansion of Covid-19 in three European Countries
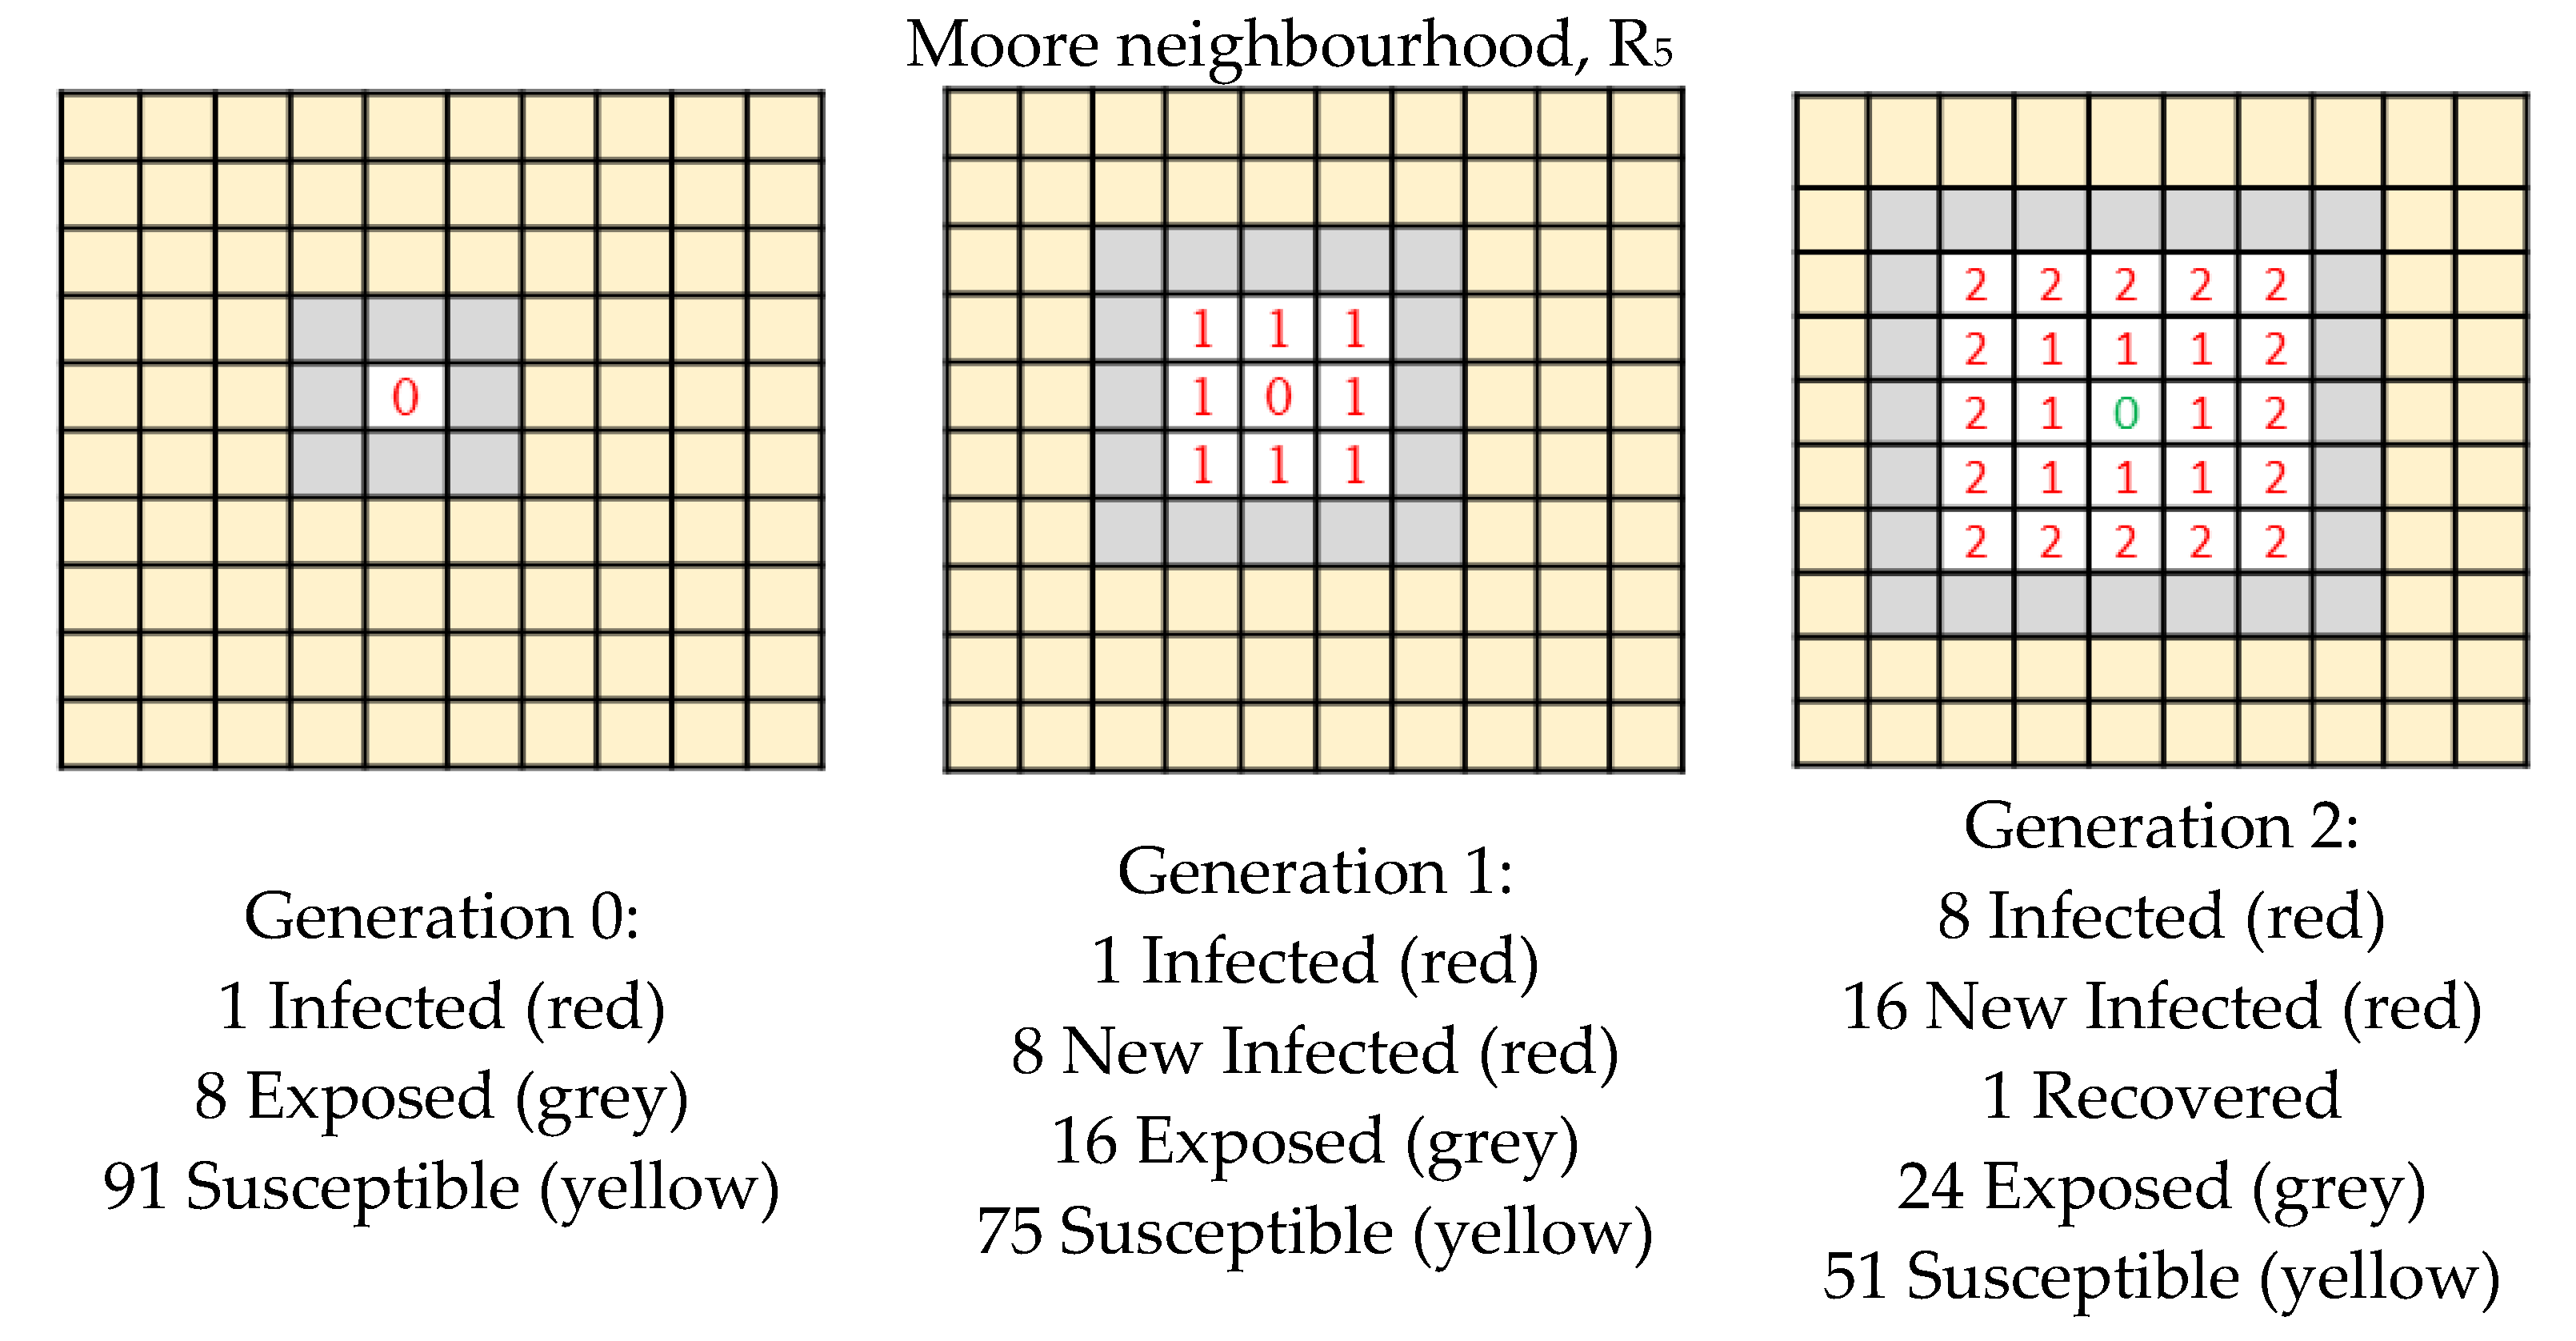
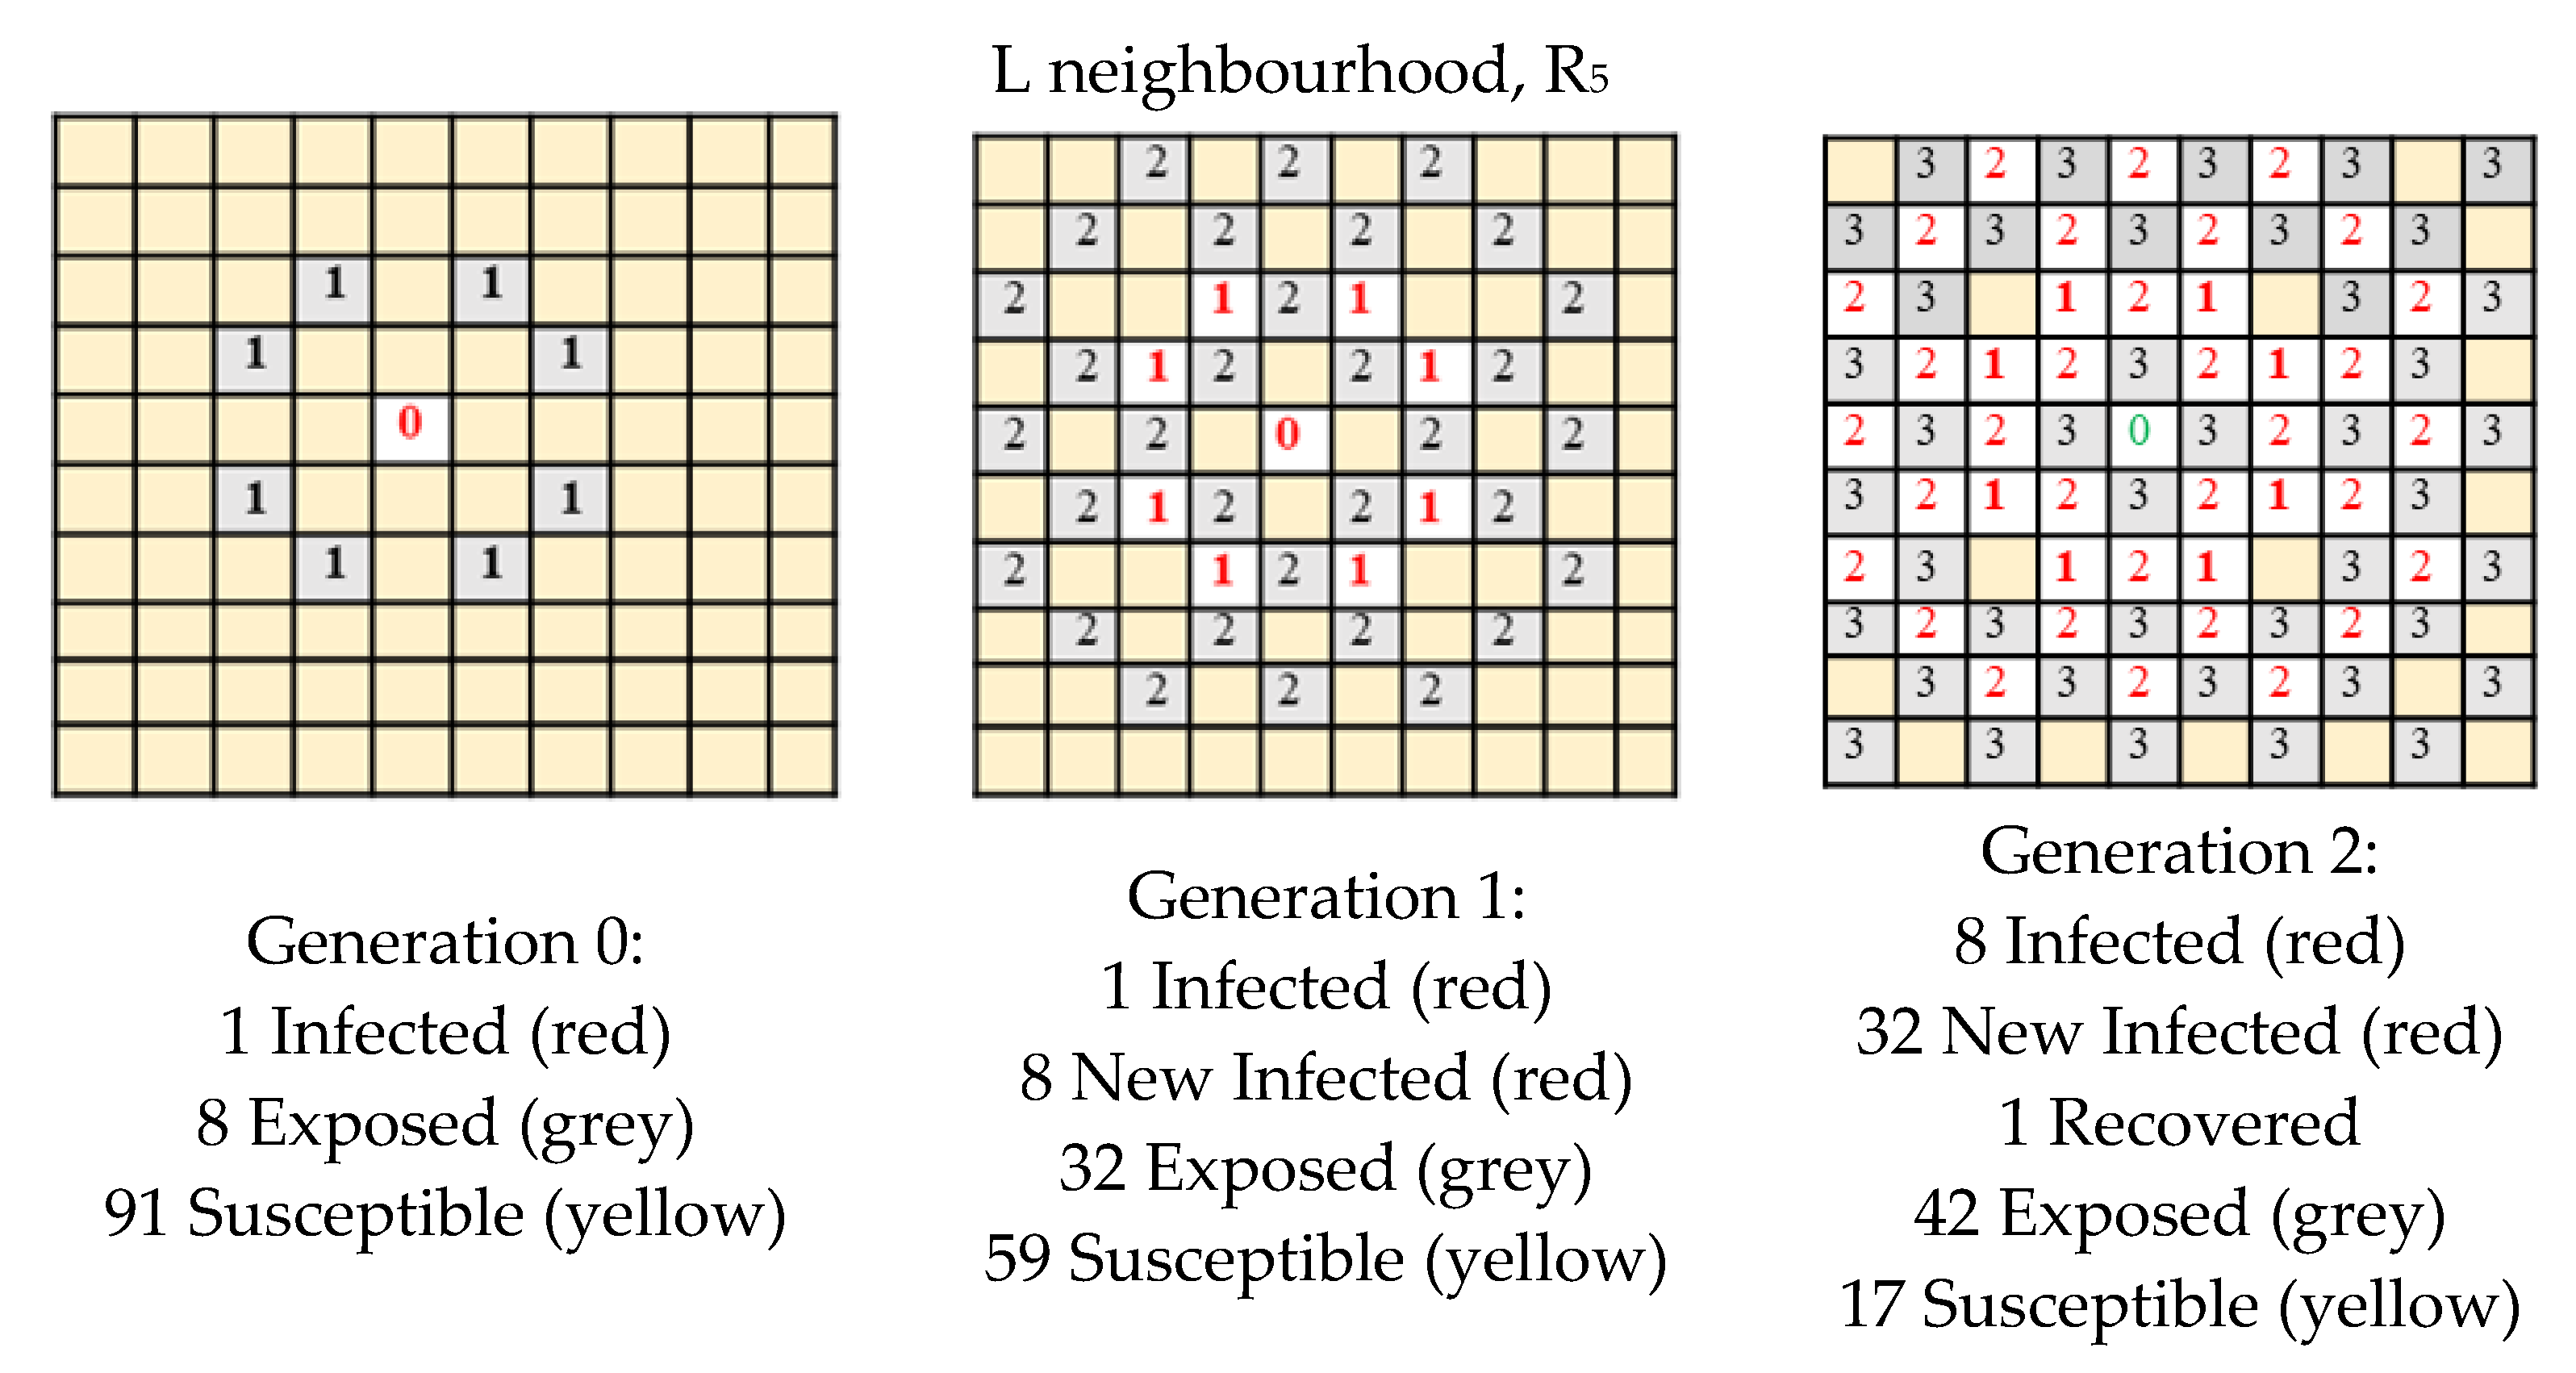
- infection: an infected cell (1) infects a susceptible cell (0) which updates its value to (1), that is to say (1 * 0) = 1
- healing: an infected cell (1) can spontaneously recover and update to (0), after a determined number of generations
- a susceptible cell has no effect on another susceptible cell so, (0 * 0) = 0
- an infected cell has no effect on another infected cell so, (1 * 1) = 1
3.2. Discussion
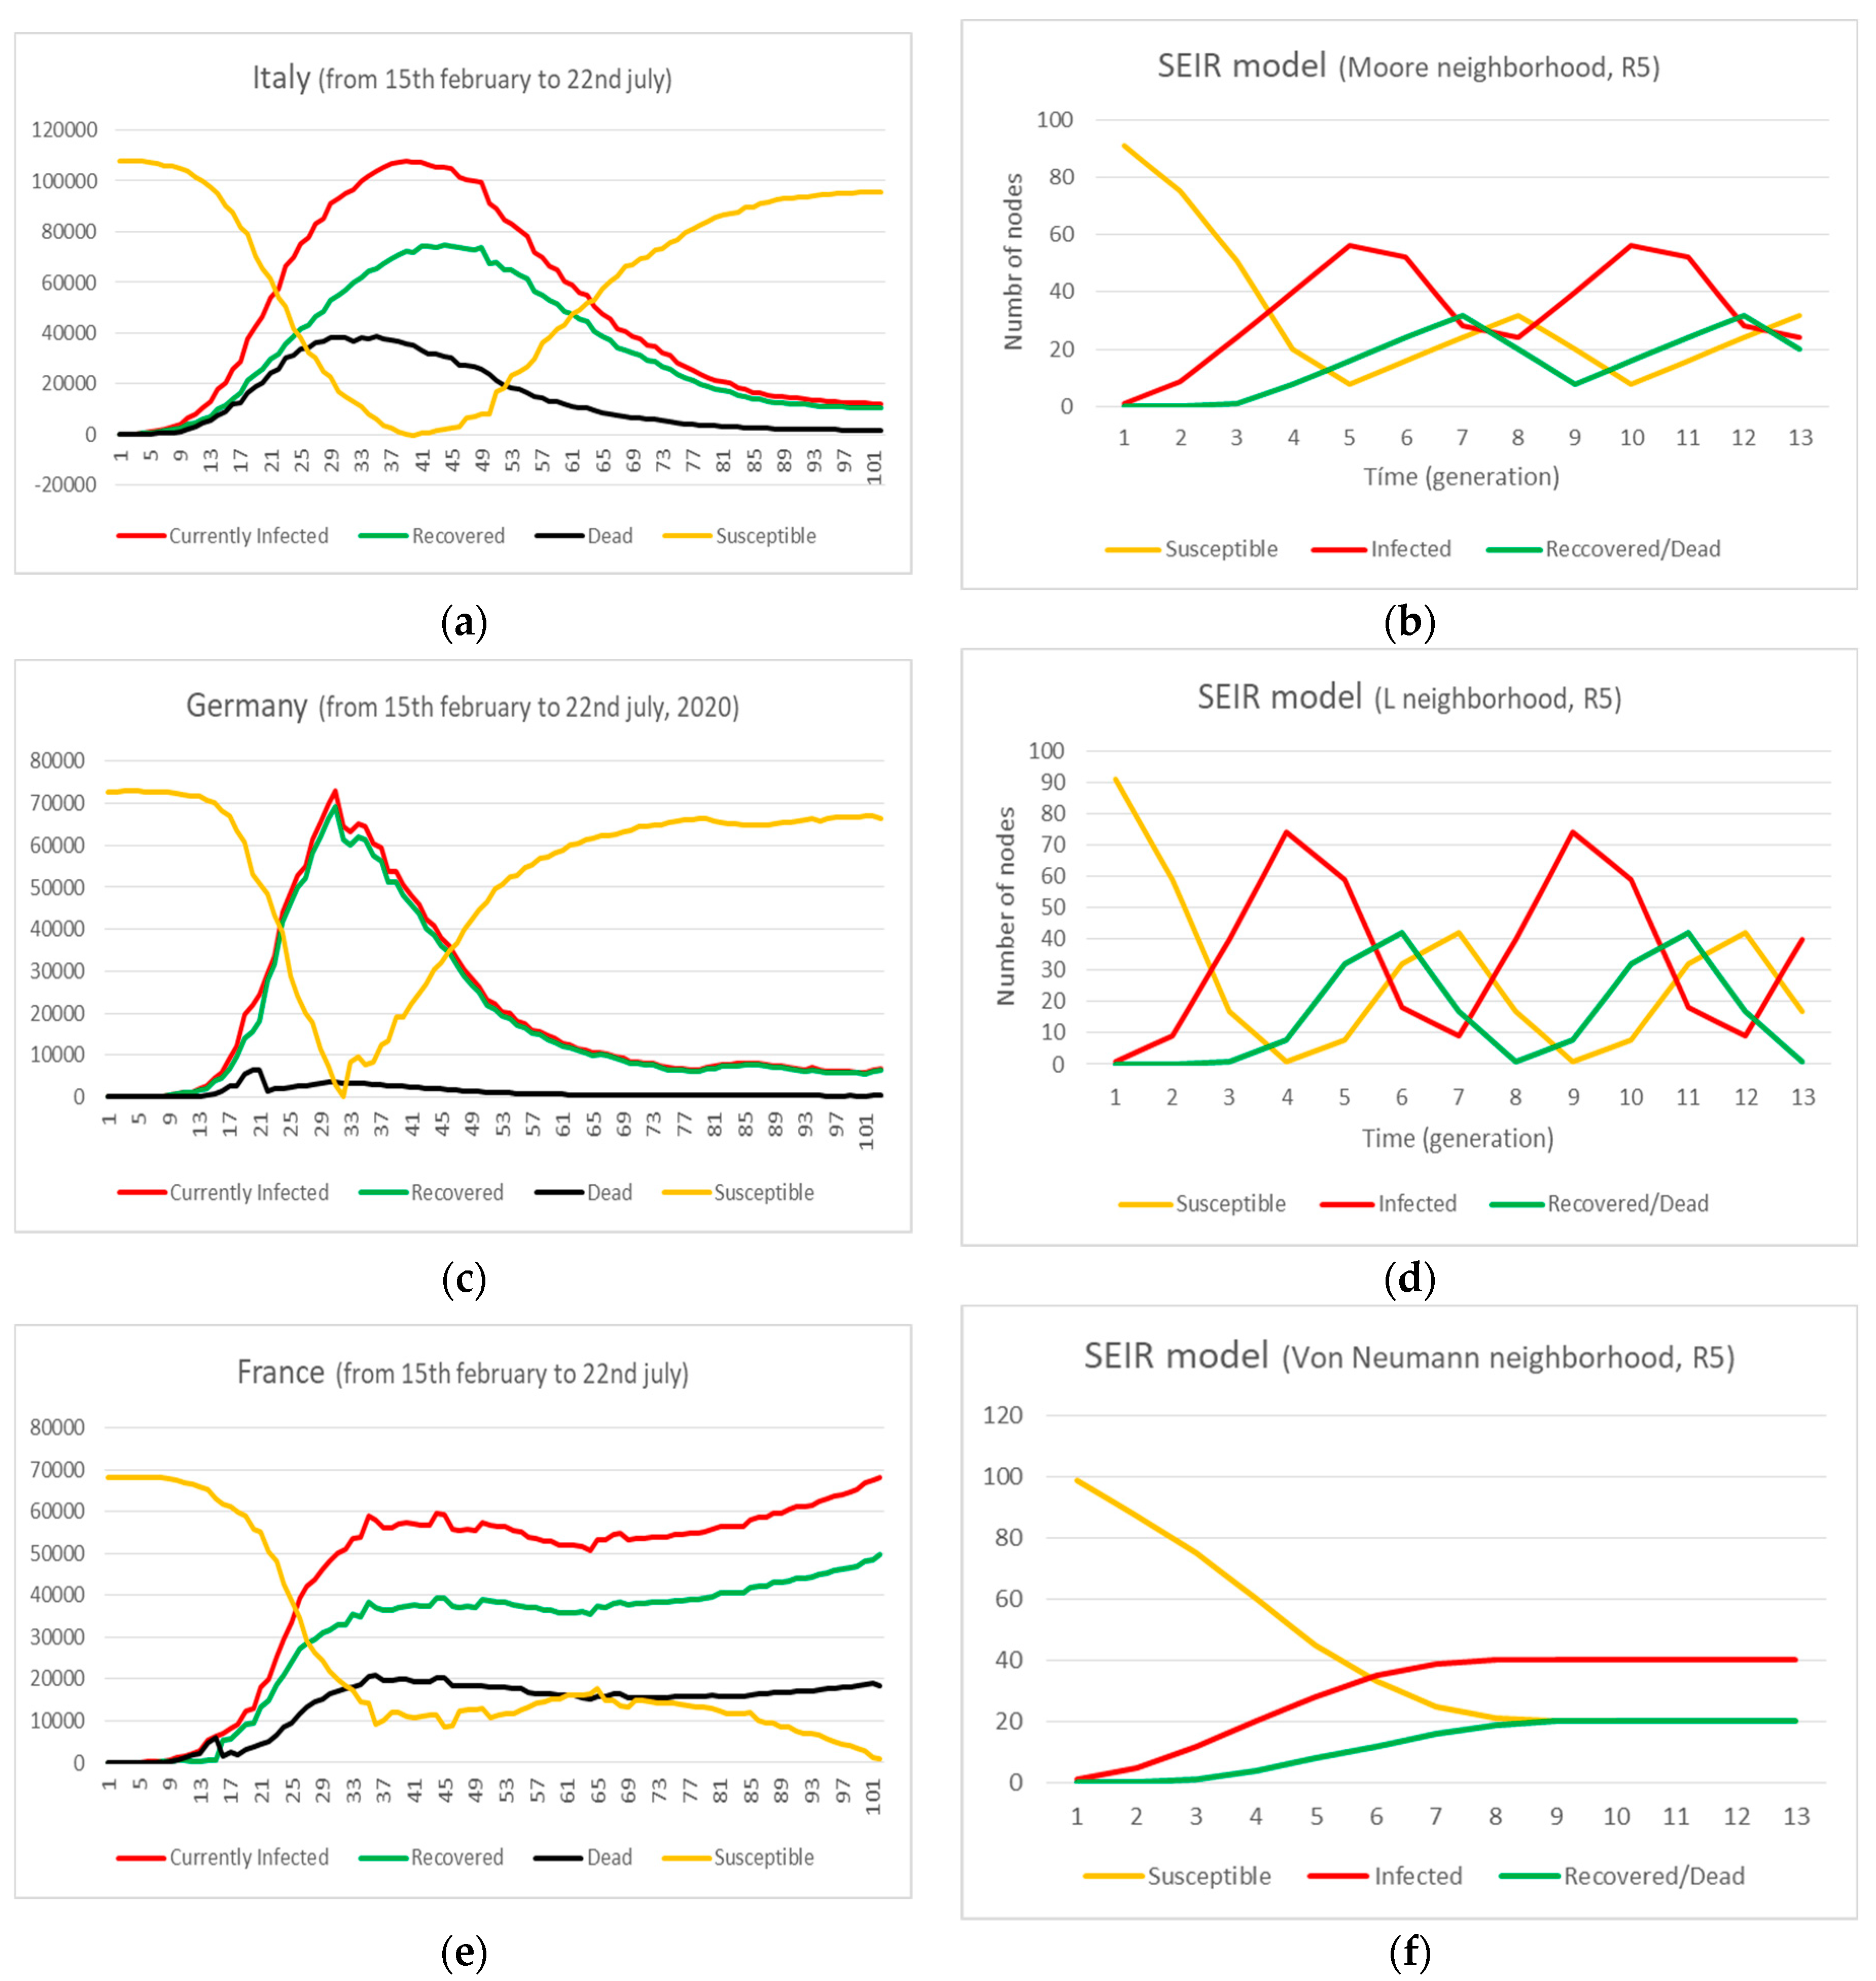
- Italy (Figure 3a,b):
- Germany (Figure 3c,d):
- France (Figure 3e,f):
4. Conclusions
Author Contributions
Funding
Conflicts of Interest
References
- Abou-Ismail, A. Compartmental Models of the COVID-19 Pandemic for Physicians and Physician-Scientists. SN Compr. Clin. Med. 2020, 2, 852–858. [Google Scholar] [CrossRef] [PubMed]
- Fosu, G.O.; Opong, J.M.; Appati, J.K. Construction of Compartmental Models for COVID-19 with Quarantine, Lockdown and Vaccine Interventions. SSRN Electron. J. 2020. [Google Scholar] [CrossRef]
- Wang, T.; Wu, Y.; Lau, J.Y.-N.; Yu, Y.; Liu, L.; Li, J.; Zhang, K.; Tong, W.; Jiang, B. A four-compartment model for the COVID-19 infection—Implications on infection kinetics, control measures, and lockdown exit strategies. Precis. Clin. Med. 2020, 3, 104–112. [Google Scholar] [CrossRef]
- Tang, L.; Zhou, Y.; Wang, L.; Purkayastha, S.; Zhang, L.; He, J.; Wang, F.; Song, P.X. A Review of Multi-Compartment Infectious Disease Models. Int. Stat. Rev. 2020, 88, 462–513. [Google Scholar] [CrossRef] [PubMed]
- Arino, J.; Portet, S. A simple model for COVID-19. Infect. Dis. Model. 2020, 5, 309–315. [Google Scholar] [CrossRef] [PubMed]
- Serhani, M.; Labbardi, H. Mathematical modeling of COVID-19 spreading with asymptomatic infected and interacting peoples. J. Appl. Math. Comput. 2020, 17, 1–20. [Google Scholar] [CrossRef] [PubMed]
- Bordehore, C.; Navarro, M.; Herrador, Z.; Fonfria, E.S. Understanding COVID-19 Spreading through Simulation Modeling and Scenarios Comparison: Preliminary Results. Available online: https://www.medrxiv.org/content/10.1101/2020.03.30.20047043v1.full.pdf (accessed on 5 February 2021).
- Burgos-Simón, C.; Cortés, J.C.; Lopez-Navarro, E.; Martinez-Rodriguez, D.; Martinez-Rodriguez, P.; Julián, R.S.; Villanueva, R.J. Modelo Para el Estudio de la Dinámica de Transmisión del SARS-COV-2 y la Enfermedad del COVID19. Descripción Técnica. Instituto Universitario de Matemática Multidisciplinar, Universitat Politècnica de Valencia, 46022. Available online: https://covid19.webs.upv.es/ (accessed on 5 February 2021).
- Signes-Pont, M.T.; Mora, H.M.; Cortés, A. The Susceptible-Infectious Model of disease expansion analysed under the scope of connectivity and neighbour rules. Comput. Sci. Inf. Technol. 2017, 7, 1–10. [Google Scholar]
- Signes-Pont, M.T.; Mora, H.M.; Castillo, A.C. A discrete approach of the Susceptible-Infectious-Susceptible (SIS) Model of Disease Expansion. Int. J. Comput. 2017, 2, 123–128. [Google Scholar]
- Signes-Pont, M.T.; Mora, H.M.; Castillo, A.C. The Susceptible-Infectious-Recovered (SIR) model of disease expansion: A new approach. In Proceedings of the 17th Edition of the Mathematical Modelling in Engineering and Human Behaviour Conference, Valencia, Spain, 8–10 July 2020. [Google Scholar]
- Signes-Pont, M.T.; Ramirez-Martinez, D.E.; García-Chamizo, J.M.; Mora, H. A multigrid approximation to the expansion of Xylella fastidiosa in almond trees. WSEAS Trans. Comput. 2019, 18, 19–30. [Google Scholar]
- Signes-Pont, M.T.; Cortés-Plana, J.J.; Mora, H.; Mollá-Sirvent, R. An epidemic model to address the spread of plant pests. The case of Xylella fastidiosa in almond trees. Kybernetes 2020. [Google Scholar] [CrossRef]
- Signes-Pont, M.T.; Mora, H.; Cortés-Castillo, A.; Mollá-Sirvent, R.A. A grid model to address the behaviour of the nodes in the dissemination of information. Kybernetes 2019, 49, 1953–1967. [Google Scholar] [CrossRef]
- Signes-Pont, M.T.; Mora-Mora, H.; Mollá-Sirvent, R.; Cortés-Castillo, A. A framework to address the impact of people’s behavior in the dissemination of information through mobile social networks. In Proceedings of the 6th Business Systems Laboratory International Symposium, Pavía, Italia, 21–23 January 2019. [Google Scholar]
- Cortés-Castillo, A. Modelización de la Propagación de Información a Través de las Redes Informáticas. Ph.D. Thesis, University of Alicante, Alicante, Spain, July 2020. [Google Scholar]
- COVID-19 Outbreak Live Update. Available online: https://www.worldometers.info/coronavirus/ (accessed on 14 March 2020).


Publisher’s Note: MDPI stays neutral with regard to jurisdictional claims in published maps and institutional affiliations. |
© 2021 by the authors. Licensee MDPI, Basel, Switzerland. This article is an open access article distributed under the terms and conditions of the Creative Commons Attribution (CC BY) license (http://creativecommons.org/licenses/by/4.0/).
Share and Cite
Signes-Pont, M.T.; Cortés-Plana, J.J.; Mora-Mora, H. An Epidemic Grid Model to Address the Spread of Covid-19: A Comparison between Italy, Germany and France. Math. Comput. Appl. 2021, 26, 14. https://0-doi-org.brum.beds.ac.uk/10.3390/mca26010014
Signes-Pont MT, Cortés-Plana JJ, Mora-Mora H. An Epidemic Grid Model to Address the Spread of Covid-19: A Comparison between Italy, Germany and France. Mathematical and Computational Applications. 2021; 26(1):14. https://0-doi-org.brum.beds.ac.uk/10.3390/mca26010014
Chicago/Turabian StyleSignes-Pont, Maria Teresa, José Juan Cortés-Plana, and Higinio Mora-Mora. 2021. "An Epidemic Grid Model to Address the Spread of Covid-19: A Comparison between Italy, Germany and France" Mathematical and Computational Applications 26, no. 1: 14. https://0-doi-org.brum.beds.ac.uk/10.3390/mca26010014