Article

Stability Improvement of the TDLAS-Based CO Monitoring Module in a Coal Mine by Using a Spectral Denoising Algorithm Based on SVR

1
Department of Public Basic Courses, Nanjing Vocational University of Industry Technology, Nanjing 210000, China
2
Nanjing Shuoning Photoelectric Technology Co., Ltd., Nanjing 210036, China
*
Author to whom correspondence should be addressed.
Submission received: 26 October 2023 / Revised: 13 December 2023 / Accepted: 21 December 2023 / Published: 23 December 2023
(This article belongs to the Special Issue Fiber Optic Sensors: Science and Applications)

Abstract

:
CO gas is not only lethal but also a significant forecasting indicator for the spontaneous combustion of coal mines. It is imperative that monitoring modules for CO gas that work well in the coal mine environment are available. A feasible solution is the detection of CO by using monitoring modules based on tunable diode laser absorption spectroscopy (TDLAS) over a mid-infrared waveband near 4.6 μm. However, in most cases, the mid-infrared TDLAS-based CO monitoring module tends to introduce severe interference fringe noise into the TDLAS spectral backgrounds which is difficult to filter out using traditional spectral filtering methods, reducing the detection performance of the module. In order to filter out the noise and improve the stability of the module in complex coal mine environments, this work proposed an algorithm based on support vector regression (SVR) to extract the TDLAS spectral backgrounds. Spectral analysis indicates that the TDLAS spectral background can be predicted over the entire scanning spectrum range by using this algorithm, and the noise in the spectral background can be effectively filtered out when calculating the absorbance spectrum based on the Lambert–Beer law. Compared to extracting spectral backgrounds using the traditional least square polynomial fit, the obtained correlation coefficients between regression models of spectral backgrounds and corresponding training point datasets were increased from below 0.998 to above 0.999. The peak-to-peak value of the obtained N2 absorbance spectrum was suppressed below 0.022 from nearly 0.045. The signal-to-noise ratio of the obtained 25 ppm CO absorbance spectrum was increased to 13.35 from 6.95. A CO monitoring module polluted by dust was used to conduct experiments to further test the SVR-based algorithm. The experiment results showed that after programming the SVR-based algorithm to the module, the estimated limit of detection of the module was reduced to 5.46 ppm from 29.08 ppm, and all the absolute measuring errors of the standard CO gases with different low concentrations were reduced to less than 4 ppm from a majority of the errors of more than 10 ppm, compared to least square polynomial fit. The CO monitoring module could still maintain the performance of high-precision quantitative detection when using the SVR-based algorithm even if it had been polluted severely. So, the CO monitoring module has good adaptability to harsh field environments, and its operation stability can be effectively improved by using the algorithm proposed in this work.

1. Introduction

Spontaneous combustion of coal is one of the main causes of coal mine fires and is widely present in coal mines [1,2,3,4]. At present, the detection of several signature gaseous products liberated during coal oxidation is the most fundamental and widely used means to forecast spontaneous combustion in practice [5]. Carbon monoxide (CO) usually starts to appear at the initial stage of coal–oxygen recombination and runs through the entire spontaneous combustion process [6,7]. Therefore, CO gas is a significant forecasting indicator for the spontaneous combustion of coal mines. Furthermore, CO will come out of the drill holes while drilling is performed in the mine, which represents a serious threat to all miners at the worksite since CO is lethal [8]. Due to these facts, a CO monitoring system is an important component of a coal mine safety monitoring system, and thus, it is imperative that monitoring modules for CO gas that work well in the coal mine environment are available. Currently, CO gas can be monitored by electrochemical sensors, catalytic combustion-type sensors, semiconductor sensors, or sensors based on traditional infrared absorption spectroscopy [9,10,11,12]. However, on one hand, these sensors will fail when interfering gas components are present simultaneously in the detection field; on the other hand, these sensors require frequent calibration, which is not suitable for the long-term monitoring of CO gas in coal mines.
Tunable diode laser absorption spectroscopy (TDLAS) has been widely used for the detection of various gases because of its use of a stable tunable diode laser source, the higher spectral resolution available, no need for frequent calibration and potentially a simple system construction for the in-the-field use [13]. Furthermore, TDLAS can detect gas through the absorption of low-power laser beams at the milliwatt or even microwatt level in the gas volume, which is usually seen as an intrinsically safe technology. Therefore, such TDLAS-based systems are well suited for the purposes of monitoring CO in coal mines. In recent years, there have been a number of papers discussing the use of TDLAS-based techniques for CO monitoring in industrial, environmental, medical, and other applications. Pan Yun reported using TDLAS detection of CO in thermal power plants, employing a DFB laser that operates over the second overtone wavelength range (6200~6400 c m 1 ) [14]. Zhang LW et al. described a sensitive CO sensor for industrial process control based on TDLAS with a DFB laser operating at 2.3 μ m [15]. Ghorbani R et al. reported a TDLAS sensor for real-time breath gas analysis of CO isotopes based on an interband cascade laser (ICL) operating at 4.69 μ m [16]. Nwaboh Javis A. et al. introduced an ICL-based absorption spectrometer for atmospheric CO amount fraction measurements [17]. Ivan Tadic et al. proposed measuring airborne CO by using a quantum cascade laser (QCL) emitting near 4.6 μ m [18].
The error requirement of CO measurement is less than ±4 ppm at 0–100 ppm in coal mines of China according to Chinese coal industry standard MT/T 757-2019 issued by the State Administration of Coal Mine Safety of China [19]. Most CO gas monitoring modules comply with this standard in coal mines in China. MT/T 757-2019 sets a high standard for the measurement performance of the CO monitoring modules in coal mines in China. Given that the line intensities of CO are strong enough over the mid-infrared fundamental band (near 4.6 μ m ) and there are no absorption characteristic spectral lines of other common gas components in coal mines over the same wavelength range, the detection of CO in coal mines by using TDLAS technology near 4.6 μ m is indeed a feasible solution. However, TDLAS technology based on the mid-infrared band is difficult to combine with optical fiber components, and the emitted laser beam can only be transmitted in open space and then tends to generate amounts of stray light, which is prone to cause etaloning and thus bring interference fringe noise into the TDLAS spectral backgrounds of CO gas. And this is more common in dusty coal mines. In field monitoring based on TDLAS, whether it is the direct absorption method or wavelength modulation method, the spectral backgrounds of TDLAS spectra are usually extracted first and then deducted based on the Lambert–Beer law so that the absorbance near the gas absorption characteristic peaks is used for gas concentration inversion. Therefore, the unavoidable spectral background noise is an important key factor that leads to poor detection accuracy and instability of CO monitoring modules in coal mines. Currently, methods such as wavelet transform and Kalman filtering are used for the TDLAS spectral denoising [20,21]. The wavelet transform method essentially uses the difference between the frequency characteristics of noise and the ones of the gas absorption spectrum to denoise the TDLAS spectrum. Therefore, the effectiveness of the wavelet transform method is reduced when the frequency characteristics of the noise are very close to the ones of the CO absorption peaks. The Kalman filtering method may increase the sensor response time since it denoises the spectrum by predicting the system state and system error at the current moment according to the previous ones. Another method that is currently most commonly used is directly fitting and extracting the spectral backgrounds using a least square polynomial fit and then filtering the noise out when calculating the absorbance spectra based on the Lambert–Beer law [22]. However, it is difficult to avoid underfitting when using the least square polynomial fit, and therefore, it is impossible to effectively filter out the noise when calculating the absorbance spectra. Given the drawbacks of the above methods, they are not very suitable for the field detection of CO gas in coal mines. Thus, at present, a method of denoising TDLAS spectra is still needed for the field monitoring of CO gas in coal mines and is worthy of further research.
This work proposes an algorithm for TDLAS spectral background extraction based on support vector regression (SVR) to effectively denoise the TDLAS spectra. The aim of this work was to improve the stability of the CO monitoring module which is integrated in the tube bundle monitoring system for coal mine spontaneous combustion by using the proposed algorithm. The tube bundle monitoring system mainly consists of a monitoring host, the sampling control device, the air extraction pump, the polyethylene bundle tubes, the sampling filtration device, and the gas monitoring module. The tube bundle monitoring system samples the air in the goaf, enclosed area, and roadway of the coal mine through polyethylene bundles. The sampled air samples are then sent to the gas monitoring module for analysis by the sampling control device and the air pump. The tube bundle monitoring system determines the danger level of spontaneous combustion based on the trend of gas changes. SVR is a small-sample regression algorithm that can be used to build a regression model with strong generalization ability through a small amount of training data [23]. Therefore, it is very suitable for real-time extraction of CO TDLAS spectral backgrounds. In this work, for the obtained CO TDLAS spectrum, the spectral background data on either side of the CO absorption characteristic peak were used as the training dataset, and the regression model of the spectral background was established, through which the entire TDLAS spectral background can be extracted. Related experiments were then conducted to verify the effectiveness of the SVR-based algorithm by using a CO monitoring module that was disassembled from a tube bundle monitoring system and had a gas absorption cell that was severely polluted by dust in a coal mine.

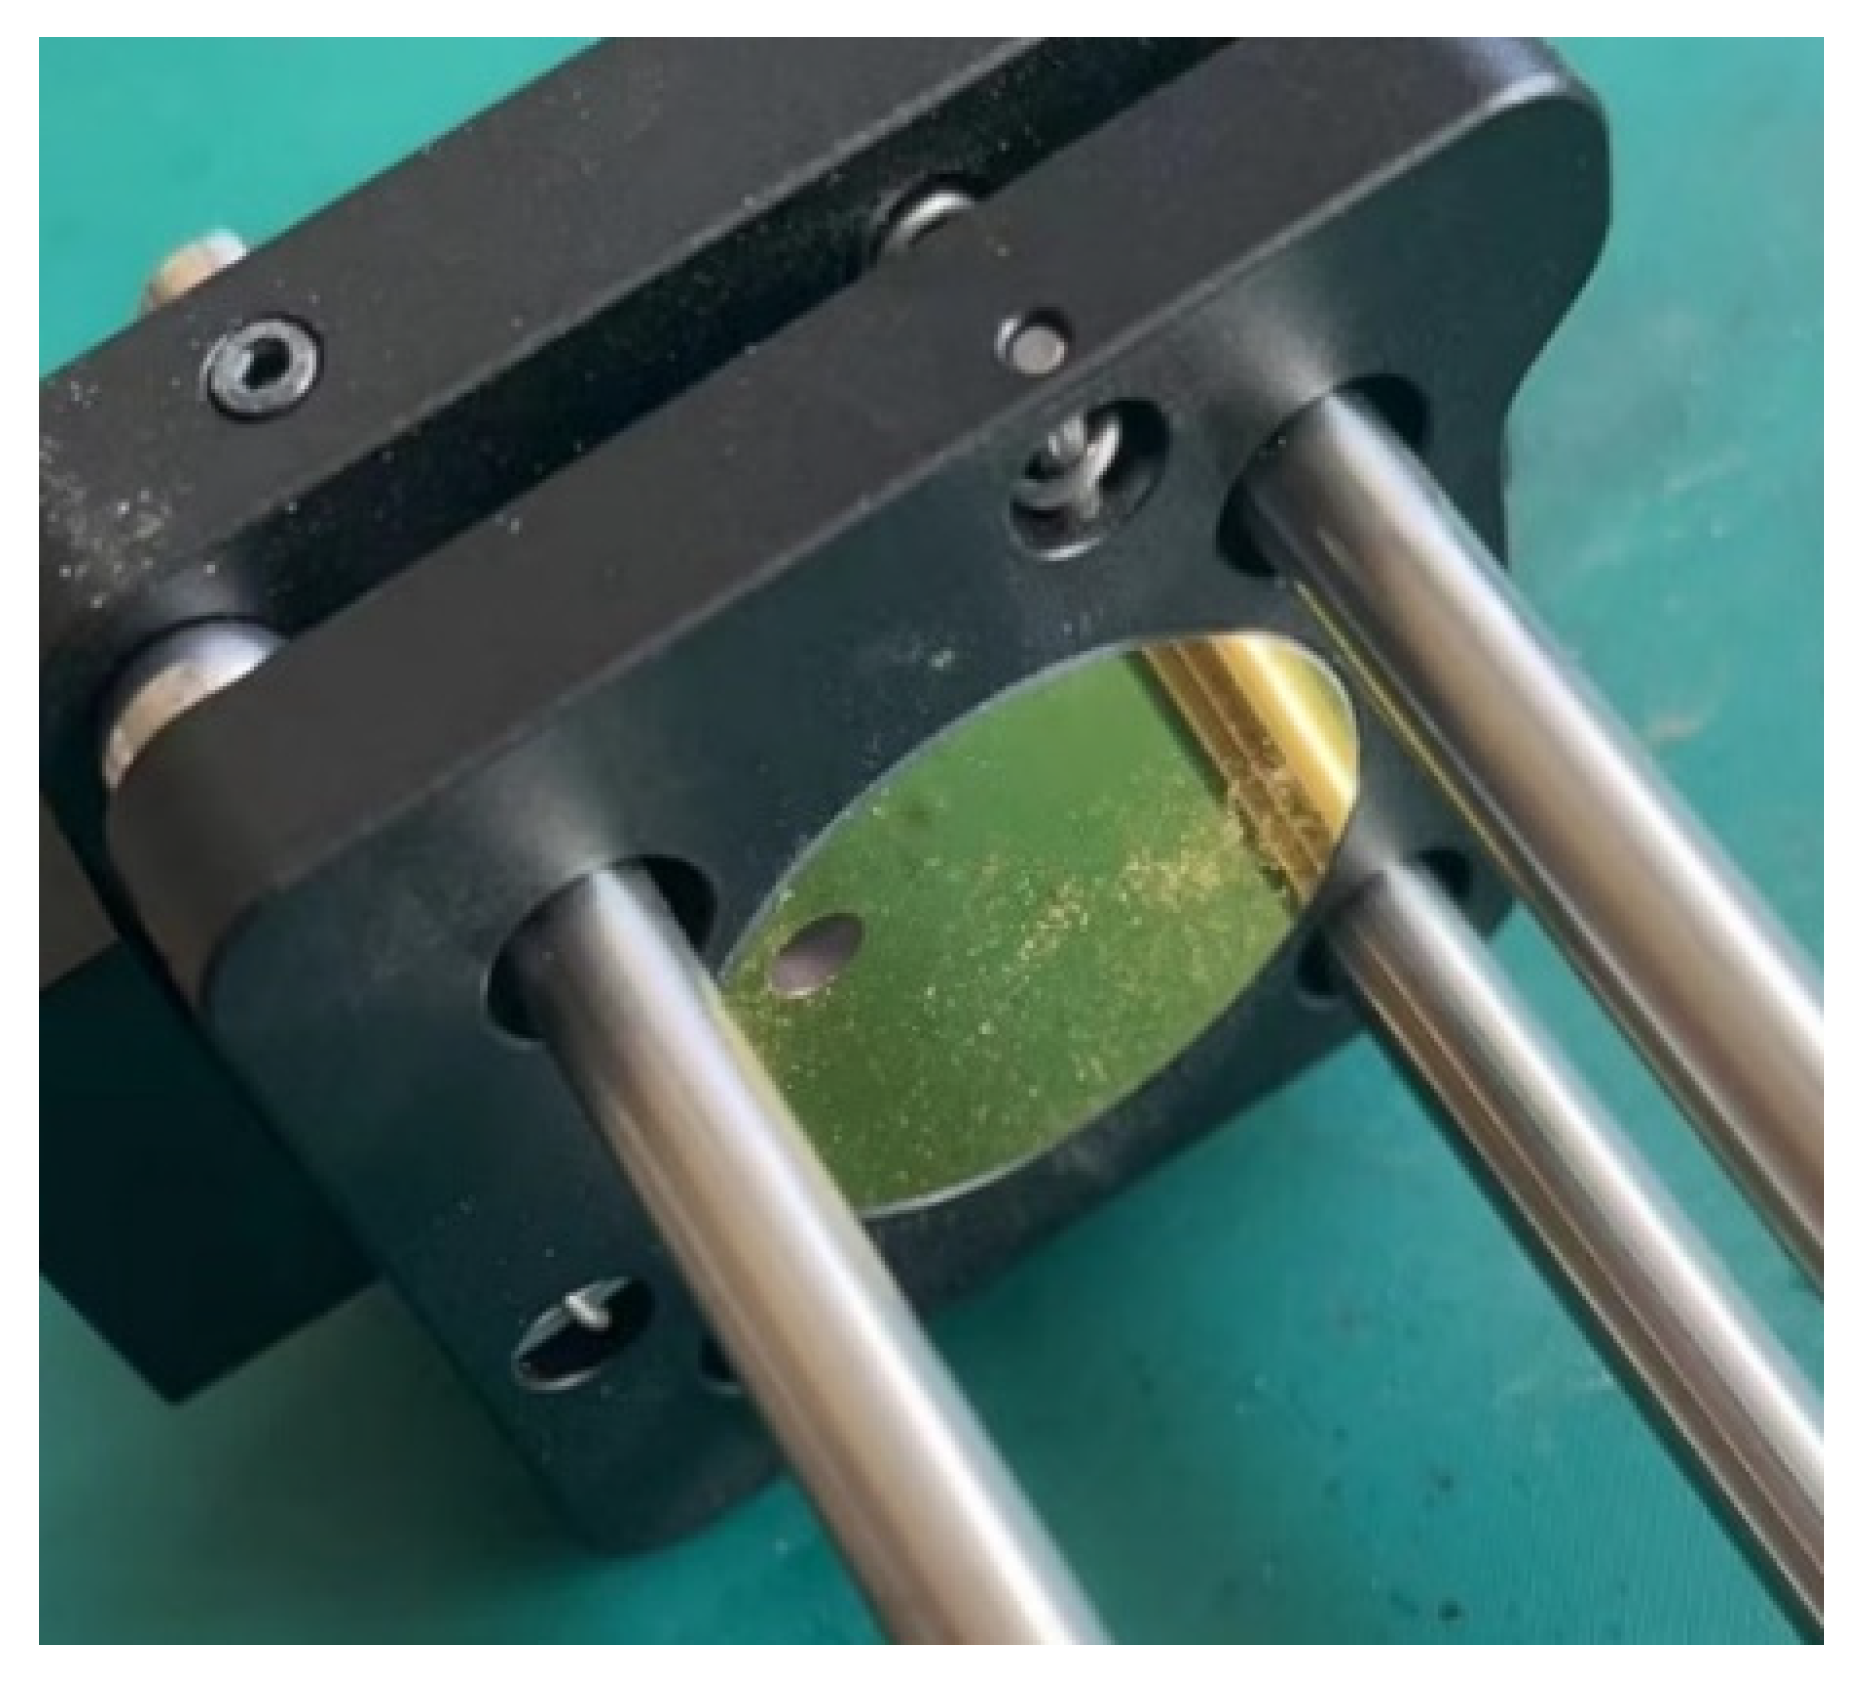
2. Set-Up of the CO Monitoring Module and the Spectroscopic Principle

The CO monitoring module (shown in Figure 1) is a subsystem integrated into the tube bundle monitoring system for coal mine spontaneous combustion. The measuring range of the module is 0 400   p p m with an accuracy of ± 4   p p m at 0 100   p p m and ± 4 % of the true value at 100   p p m 400   p p m . The module utilizes an ICL laser operating near 4588   n m and a gas absorption cell with an optical path of more than 450   m m as shown in Figure 1b. The ICL laser is driven by a laser driver which allows the current to vary from 45 mA to 60 mA to scan for the output wavelength range with the center of 4588   n m . The ICL laser operates in temperature-controlled mode at 5 °C by using the thermoelectric cooler circuit. The laser beam collimated by an aspheric lens travels 5 times after 4 reflections in the gas absorption cell, with a total optical path of more than 450 m m . The aspheric mirror turns and focuses the laser beam to the InAsSb photodetector where the residual intensity of the laser beam is measured after being absorbed in the gas cell. The photocurrent generated by the photodetector is converted to a voltage signal by a preamplifier circuit and then further converted to the raw TDLAS spectral dataset by an AD converter. Each set of raw TDLAS spectral data contains 310 sampling points with the central wavelength of the CO absorption characteristic peak located near the 155th sampling point. The data are then read by a microcontrol unit (MCU) for the quantitative analysis of CO. The module is also equipped with a communication interface (such as RS485 and WIFI) to transmit the final detected CO gas concentration values to the upper computer systems. The module has advantages such as high integration and fast response. Its power consumption is below 2 watts.
Under normal pressure, the absorption characteristic peak of CO gas is the Lorentz line. as shown in Figure 2. Figure 2 shows the standard characteristic absorbance spectrum of 100 ppm CO gas near 4588   n m in the HITRAN database, with the absorption optical path length of 15   c m , temperature of 298   K , and pressure of 1   a t m .
Thus, in theory, when the spectral wavelength scanning range is wide enough, the intensity values of the spectral edge far from the absorption characteristic peak are approximately equal to the intensity values of the spectral background. Therefore, it is possible to predict the TDLAS spectral background I b f over the entire wavelength scanning range by using the points at the TDLAS spectral edge as the training dataset. According to the Lambert–Beer law, the absorbance of CO gas, I a b s o r p t i o n , also known as the absorbance spectrum, can be approximately given as
I a b s o r p t i o n = ln I b f I = P c S ϕ L
where I is the raw TDLAS spectral dataset, also known as the raw absorption spectrum; P is the total pressure of the gas in the gas absorption cell; c is the concentration of CO gas; S is the spectral feature line strength near 4588   n m ; ϕ is Lorentz line shape function; and L is the overall absorption path length. Due to the fixed absorption optical path of the gas absorption cell, the absorbance value near the absorption characteristic peak of CO is proportional to the concentration of CO gas.
However, it is difficult to completely avoid the etaloning fringe noise which is mainly caused by the reflections between the surfaces of the two mirrors of the gas absorption cell, the surfaces of the detector windows, and so on. Usually, the etaloning fringe noise is small. However, in a sensor system for field applications, it is difficult to avoid environmental disturbance during field operation. The dust attached to the surfaces of the two mirrors of the gas absorption cell, the surfaces of the detector windows, and so on will not only reduce the signal-to-noise ratio by attenuating the intensity of spectral signals, but also make the etaloning fringe noise more severe by generating more stray light. The mentioned factors will introduce severe noise into the TDLAS spectral backgrounds. Figure 3a shows a raw TDLAS spectrum of pure nitrogen (N2) (using pure nitrogen as the blank sample for CO gas) with only small etaloning fringe noise (less noise), and Figure 3b shows the one of N2 with severe noise. Comparing Figure 3a with Figure 3b, it can be seen that although they are both the N2 raw TDLAS spectra, when there is severe noise in the spectra, there will be a noticeable concavity similar to the absorption peak near the CO absorption characteristic peak, which will bring about the illusion of CO gas absorption. Figure 4a shows the raw TDLAS spectrum of 25 ppm CO gas with less noise, while Figure 4b shows the one with severe noise. The 25 ppm CO gas is balanced by pure N2. Comparing Figure 4a with Figure 4b, it can be preliminarily inferred that the concavity near the central wavelength of the characteristic absorption peak is caused by both CO gas absorption and the noise in the spectral background. The severe noise in the spectral backgrounds will directly disturb the calculation of the absorbance values near the absorption characteristic peak of CO according to Formula (1), thereby deteriorating the accuracy of CO quantitative analysis.
Moreover, the frequency spectra of the mentioned noise are very similar to those of the absorption characteristic spectra of CO gas, as shown in Figure 5 and Figure 6. Figure 5a and Figure 6a show the frequency spectra of the N2 raw TDLAS spectrum with less noise and the 25 ppm CO raw TDLAS spectrum with less noise, respectively, while Figure 5b and Figure 6b show the ones of the N2 raw TDLAS spectrum with severe noise and the 25 ppm CO raw TDLAS spectrum with severe noise, respectively. Comparing Figure 5a,b as well as Figure 6a,b, it can be seen that the frequency spectra of the raw spectra with severe noise are very similar to the ones with less noise. This indicates the fundamental inability to filter the noise in the spectral backgrounds using traditional filtering methods such as wavelet transform. Therefore, this work proposed an SVR-based algorithm to accurately predict and extract the spectral backgrounds of CO gas so that the noise can be finally filtered out.

3. Principle of TDLAS Spectral Background Extraction for CO Gas

SVR is the application of the ideas and methods of support vector machine (SVM) in regression problems. SVR is a process of establishing the convex optimization problem based on the training data and analyzing this problem, aiming to find a regression model that minimizes the expected error relative to the training sample data. SVR only requires a small number of training samples to get a regression model with strong generalization ability, which is widely regarded as one of the best small sample regression algorithms currently available. In addition, the use of the kernel trick in SVR makes it highly suitable for nonlinear regression problems. According to the feature of the Lorentz line shape, the intensity values of the sampling points on both sides of the spectrum far from the absorption characteristic peak are approximately equal to the intensity values of the spectral background. Due to the advantage of SVR in constructing a regression model with strong generalization ability by using small samples, the TDLAS spectral background over the entire wavelength scanning range can be predicted by using the edge points at both sides of the CO TDLAS spectrum as training samples to construct a regression model based on SVR.
The primal problem of TDLAS spectral background extraction based on SVR can be given as
mim w , b ,   ξ , ξ               1 2 w 2 + C i = 1 K ξ i + ξ i
  s . t .           y i w · x i + b ε + ξ i ,   i = 1,2 , , K
ξ i ε y i w · x i + b ,   i = 1,2 , , K
ξ i 0 , i = 1,2 , , K
where ε is the deviation between the spectral background regression model and the intensity values of the spectral background training samples; w is the slope of the linear SVR regression line; ξ i is the upper bound slack variable, ξ i is the lower bound slack variable, and the two slack variables prevent the regression model curve from being disturbed by abnormal sample values and also avoid the occurrence of underfitting phenomena; C is the penalty factor used to limit the slack variables; b is the intercept of the regression line; x i represents the sampling point in the TDLAS spectrum; y i is the spectral intensity value of the x i th sampling point in the TDLAS spectrum; K represents the number of the spectral background training points. Formulas (2)–(6) indicate that SVR-based TDLAS spectral background extraction of CO is a convex optimization problem. In order to find the optimal solution to this problem, the primal problem is usually transformed into the dual problem. According to Formulas (2)–(6), the dual problem can be given as
mim   α , α     1 2 i = 1 K j = 1 K α i α i α j α j x i · x j + i = 1 K α i ε y i + α i ε + y i
s . t .           0 α i C , 0 α i C ,   i = 1,2 , , K
i = 1 K α i α i = 0
where α i and α i are the Lagrange multipliers corresponding to the constraint Formula (3) and the constraint Formula (4), respectively. In order to find the optimal solution to the dual problem fast, it is necessary to further organize the formulations of the dual problem; let
γ i =     1 ,                                   i = 1,2 , , K 1 ,       i = K + 1,2 K + 2 , , 2 K
t i =   x i ,                                   i = 1,2 , , K x i K ,       i = K + 1,2 K + 2 , , 2 K
β i = α i ,                                   i = 1,2 , , K α i K ,       i = K + 1,2 K + 2 , , 2 K
e i =     y i ε ,                                   i = 1,2 , , K ε y i K ,       i = K + 1,2 K + 2 , , 2 K
Then the objective function of the dual problem can be given as
mim   β               1 2 i = 1 2 K i = j 2 K β i β j γ i γ j t i · t j i = 1 2 K e i β i
Considering that the fitting of the CO gas TDLAS spectral background is nonlinear, the nonlinear Gaussian radial basis kernel function is introduced into the objective function, and then the dual problem can be finally given as follows [24]:
mim   β               1 2 i = 1 2 K i = j 2 K β i β j γ i γ j e x p t i t j 2 2 σ 2 i = 1 2 K e i β i
s . t .                       i = 1 2 K γ i β i = 0    
0 β i C ,     i = 1,2 , , 2 K
where σ is the width argument of the Gaussian radial basis kernel function. The dual problem is actually to search for the optimal values of all the β i ( i = 1,2 , , 2 K ) which minimize the objective function (Formula (15)) subject to the constraints given by Formulas (16) and (17).
Finally, the dual problem (Formulas (15)–(17)) can be solved by using the sequence minimum optimization algorithm (SMO) [25], and then the above SVR nonlinear regression model can be given as
y = i = 1 2 K β i γ i e x p x t i 2 2 σ 2 + b
Formula (18) describes the prediction regression model for CO TDLAS spectral background, where x represents the spectral sampling points and y is the TDLAS spectral intensity value of CO predicted by the regression model at sampling point x . The regression model predicts the spectral background intensity value at any spectral sampling point, thus achieving the prediction and extraction of the CO TDLAS spectral background over the entire scanning spectrum range.

4. Analysis

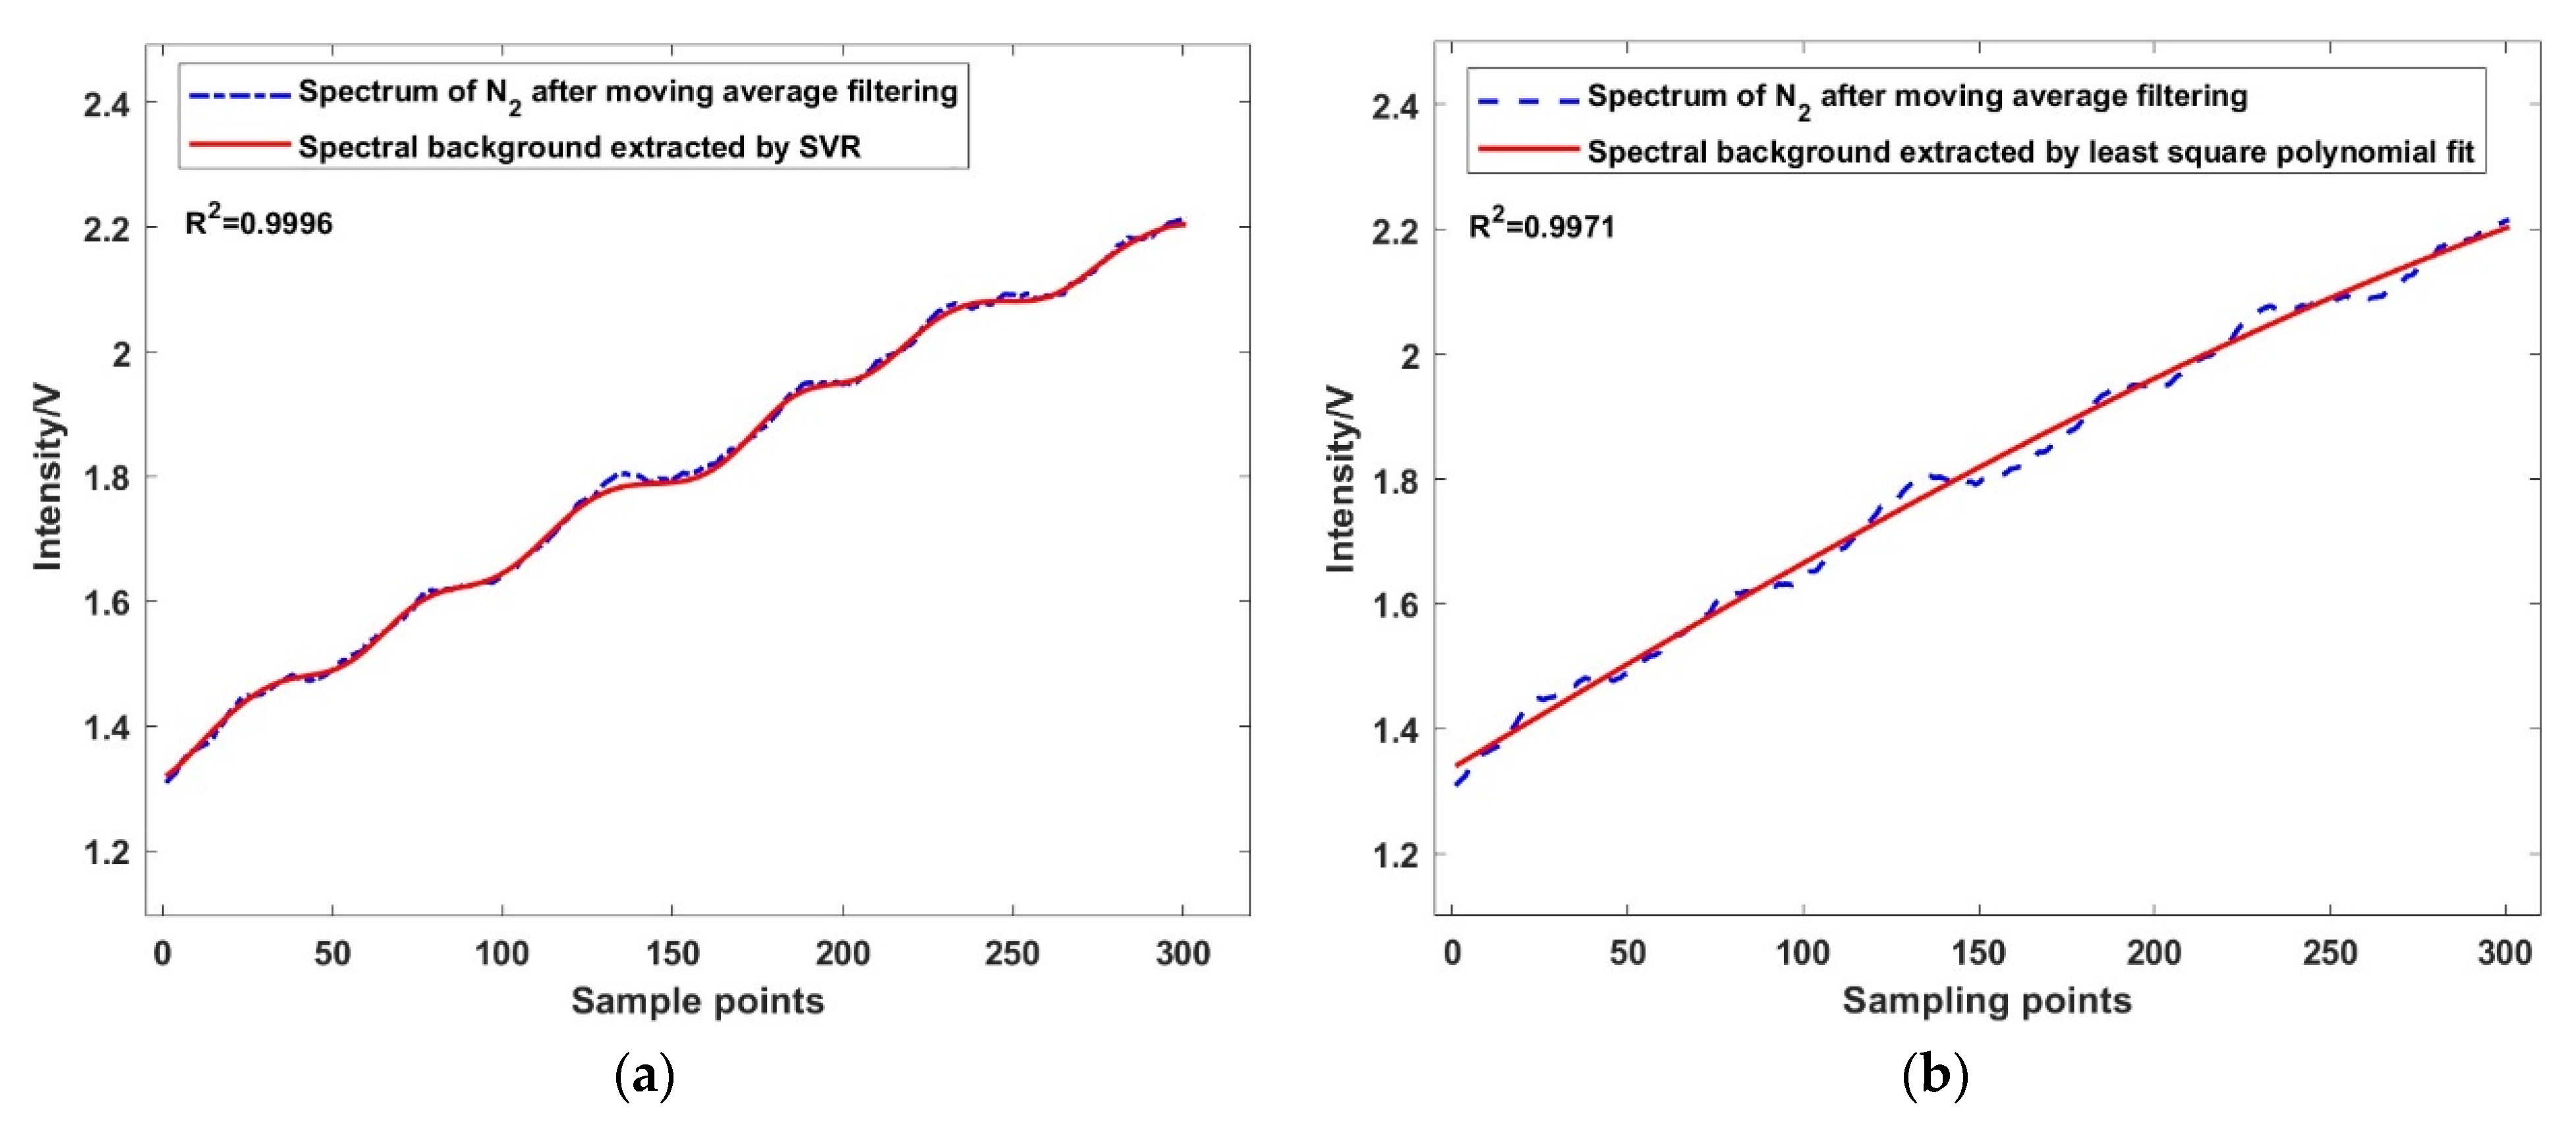
4.1. TDLAS Spectral Background Extraction

Due to the inherent high-frequency noise in the circuits and photodetector and the small high-frequency etaloning fringe noise, the spectra of the CO gas TDLAS spectra usually contain high-frequency noise. Therefore, the high-frequency noise over the entire spectrum is first filtered out by using a moving average before extracting the spectral background. Taking the raw TDLAS spectrum of N2 shown in Figure 3b and the one of 25 ppm CO gas shown in Figure 4b as examples, the spectra after moving average filtering are shown in Figure 7.
From Figure 7, it can be seen that although high-frequency noise is effectively filtered out, there are still significant fluctuations caused by the noise in the spectra, and the line shapes of these fluctuations are very similar to the CO absorption characteristic peak. Therefore, it is necessary to extract the TDLAS spectral background by using the SVR-based algorithm. According to the performance indicators of the module and the feature of the obtained TDLAS spectral data, multiple experiments were conducted to determine the penalty factor C = 200 , deviation ε = 0.005 , and the width parameter in Gaussian radial basis function δ = 18.5 . Then the backgrounds of the spectra shown in Figure 7 were extracted as shown in Figure 8a and Figure 9a.
Figure 8a and Figure 9a show the high predictive ability of the spectral background regression model obtained using the SVR-based algorithm. Whether it is N2 or 25 ppm CO gas, the correlation coefficients between the regression model and the training point dataset are both above 0.999. The spectral background extracted using the SVR-based algorithm provides a detailed prediction of the fluctuations near the CO absorption characteristic peak. There is no spectral absorption of N2 near the CO absorption characteristic peak, and the concavity here is completely caused by the noise. The SVR-based algorithm accurately predicts and identifies the concavity near the CO absorption characteristic peak as the spectral background, as shown in Figure 8a. Based on Formula (1), the absorbance spectrum of N2 calculated by using the extracted background is shown as the solid line in Figure 10. The noise is effectively filtered out, and the peak-to-peak value of the obtained absorbance spectrum is suppressed below 0.022. For the TDLAS spectrum of 25 ppm CO, the concavity near the CO absorption characteristic peak is generated by both the CO absorption and the noise. The SVR-based algorithm accurately identifies that the concavity is partially generated by the noise and predicts the detail of the spectral background near the CO absorption characteristic peak, as shown in Figure 9a. Based on Formula (1), the absorbance spectrum of 25 ppm CO gas calculated by using the extracted background is shown as the solid line in Figure 11. The noise in the spectral background is effectively filtered out, so that the absorbance values entirely depend on the absorption of CO gas, and the signal-to-noise ratio of the obtained absorbance spectrum is above 13.35.
As a comparison, the least square polynomial fit was also used to extract the spectral backgrounds of the same TDLAS spectra. However, there is a significant underfitting when using the least square polynomial fit to extract the spectral backgrounds, and the fitting correlation coefficients are both less than 0.998, as shown in Figure 8b and Figure 9b. Figure 8b and Figure 9b show that the spectral backgrounds extracted by using the least square polynomial fit have lost the fluctuation details of the real spectral backgrounds, and none of the concavities generated by the noise was predicted near the CO gas absorption characteristic peak. The corresponding absorbance spectrum of N2 is shown as the dashed line in Figure 10, and the peak-to-peak value of the absorbance spectrum is nearly 0.045. The corresponding absorbance spectrum of 25 ppm CO gas is shown as the dashed line in Figure 11, and the signal-to-noise ratio of the absorbance spectrum is below 6.9.
The comparison is further summarized in Table 1, which shows that the SVR-based algorithm can fit the fluctuating spectral backgrounds more accurately, especially accurately predicting the spectral background details near the CO gas absorption characteristic peak, and then the residual noise in the spectra can be effectively filtered out when calculating the absorbance spectra based on Formula (1).

4.2. Quantitative Analysis

In order to further verify that using the SVR-based algorithm to extract the TDLAS spectral backgrounds can effectively improve the adaptability of the CO monitoring module to adverse field environments and thus enhance its stability, a CO monitoring module was disassembled from a bundle system that had been working continuously in a coal mine for more than one year for experimental testing. Due to the damage and shutdown of the dust removal system in the bundle tube system, the dust pollution was severe inside the module, as shown in Figure 12. Dust causes amounts of stray light, resulting in significant noise in the TDLAS spectral backgrounds, as shown in Figure 3b and Figure 4b, and Figure 7.
The algorithms based on SVR and least square polynomial fit were programmed in the microcontrol unit of the module. Considering that the measuring range of the module is from 0 to 400 ppm, 20 standard CO gases with different concentrations which were set to range from 10 ppm to 390 ppm (in increments of 20 ppm) were taken as the training samples for the quantitative regression model. All the standard CO gas samples were balanced with pure N2 gas. The 20 standard CO gases were detected by the CO monitoring module obtaining the corresponding raw TDLAS spectra. The TDLAS spectral backgrounds of the 20 standard gas samples were extracted using the SVR-based algorithm first. Thereafter, the absorbance spectra of the 20 standard gas samples were calculated based on Formula (1), and the maximum absorbance value near the CO absorption characteristic peak was found for each corresponding absorbance spectrum. Finally, a linear quantitative regression model between the CO concentration value and the corresponding maximum absorbance value was set up, as shown in Figure 13a. As a comparison, least square polynomial fit was also used to extract the spectral backgrounds of the same set of TDLAS spectra, and the corresponding quantitative regression model was set up, as shown in Figure 13b.
Figure 13a,b show that the fitting correlation coefficients between the two quantitative regression lines and their respective training sample points are similar and the slopes of the lines are also approximately the same, but over the low concentration range (0–100 ppm), the correlation between the quantitative regression line set up by using SVR-based algorithm to extract the TDLAS spectral backgrounds and the training sample points is significantly higher than the one set up by using the least square polynomial fit. When extracting the spectral backgrounds by using the least square polynomial fit, the quantitative regression line shows underfitting to the corresponding training points over the low concentration range, and the training points deviate from the quantitative regression line significantly. In addition, the intercept value of the quantitative regression line corresponding to the SVR-based algorithm is only 0.0033 (less than 1 10 of the intercept value of the quantitative regression line corresponding to the least square polynomial fit), which is more in line with the theoretical fact described by Formula (1). This also indicates that the SVR-based algorithm removes the noise in the TDLAS spectral backgrounds more completely, thereby suppressing the bias of the quantitative regression line effectively. The quantitative regression lines can be used to further calculate the limit of detection of the CO monitoring module:
C L = 3 S b k
where the confidence level is set to 3, k is the slope of the corresponding quantitative regression line, and S is the standard deviation of the background values of the corresponding absorbance spectrum. In this work, the standard deviation of the absorbance values of the points at the edge of the absorbance spectrum (the 1st to 90th sampling points and the 211th to 300th sampling points) of each standard CO gas sample was calculated, and then the average of the corresponding standard deviations of all the 20 standard CO gases was calculated as the value of S . Compared to the least square polynomial fit, the estimated limit of detection was reduced to 5.46 ppm from 29.08 ppm when extracting the TDLAS spectral backgrounds by using the SVR-based algorithm.
Considering that over the low concentration range (0–100 ppm), the quantitative analysis performance of the CO monitoring module was more susceptible to adverse environmental factors (such as dust pollution in the gas absorption cell), making it difficult to satisfy the design indicators (with an accuracy of ±4 ppm at 0–100 ppm), the standard CO gases with concentrations of 17 ppm, 25 ppm, and 40 ppm (with N2 as the balance gas) were selected to continue testing the module. The CO monitoring module was placed in a high- and low-temperature environment test chamber for testing. During the testing process, the temperature of the chamber was controlled to switch from 0 °C to 40 °C in a square wave cycle with a switching period of 2 h. The standard CO gases with concentrations of 17 ppm, 25 ppm, and 40 ppm were successively pumped into the CO monitoring module. Each of the gases was continuously detected for 24 h. A raw TDLAS spectrum was obtained every minute, and the TDLAS spectral background was subsequently extracted by using the SVR-based algorithm and least square polynomial fit. The corresponding continuous 24 h measurements of the standard CO gases are shown in Figure 14, and the absolute measurement errors are shown in Figure 15.
When extracting the TDLAS spectral backgrounds by using the SVR-based algorithm, the measured concentration values of the standard CO gases are all distributed near the true values, and the absolute measuring errors of all the measurements are less than 4 ppm. Therefore, even if the gas absorption cell of the CO monitoring module is severely polluted, its quantitative analysis performance for the standard CO gases still satisfies the design indicators, which further validates the stability of the module. However, when using the least square polynomial fit, the quantitative analysis performance is so poor that the measured concentration values of the standard CO gases deviate significantly from the true values and the majority of the absolute measuring errors are greater than 10 ppm, clearly no longer satisfying the design indicators of the module. The above comparison means that when the SVR-based algorithm is used to extract the TDLAS spectral backgrounds, it will effectively overcome the disturbance of adverse environmental factors in the quantitative analysis of CO gas, thereby improving the adaptability of the CO monitoring module to harsh application environments and its operation stability.

5. Conclusions and Discussion

In order to improve the field environmental adaptability of CO monitoring modules in coal mines and their stability in harsh environments, this work proposed an algorithm for TDLAS spectral background extraction based on SVR to predict the TDLAS spectral background over the entire wavelength scanning range. In harsh operating environments (such as in the case of severe dust pollution inside the gas absorption cell), the raw TDLAS spectral backgrounds contain amounts of noise that are difficult to filter out only through traditional methods of spectral filtering. However, using the SVR-based algorithm to extract the TDLAS spectral backgrounds can accurately predict the spectral background fluctuations, thereby effectively filtering out the noise in the TDLAS spectral backgrounds when calculating the absorbance spectra based on Formula (1). Compared to the widely used traditional least square polynomial fit, when using the SVR-based algorithm to extract the TDLAS spectral backgrounds, the obtained correlation coefficients between regression models of spectral backgrounds and corresponding training point datasets were increased from below 0.998 to above 0.999. The peak-to-peak value of the obtained N2 absorbance spectrum was suppressed below 0.022 from nearly 0.045. The signal-to-noise ratio of the obtained 25 ppm CO absorbance spectrum was increased to 13.35 from 6.95. A CO monitoring module which was disassembled from a bundle tube system in the coal mine and had severe dust pollution inside its gas absorption cell was used to conduct further experimental testing. The corresponding quantitative regression models were set up by using the SVR-based algorithm and least square polynomial to extract the TDLAS spectral backgrounds. Twenty-four-hour testing experiments on three standard CO gases of low concentrations were conducted based on the corresponding quantitative regression models. Compared to the least square polynomial fit, the estimated limit of detection was reduced to 5.46 ppm from 29.08 ppm, and all the absolute measuring errors of the tests for the standard CO gases were reduced to within 4 ppm from large values. The testing experiments further indicate the obvious advantages in quantitative analysis when using the SVR algorithm.
In summary, even if the CO monitoring module is severely polluted by dust and then amounts of stray light bring noise into the raw TDLAS spectrum of CO gas, the module can overcome the noise by using the SVR-based algorithm to predict the TDLAS spectral background over the entire scanning spectrum range and thus still maintain the performance of high-precision quantitative detection. So, the CO monitoring module has good adaptability to harsh application field environments, and its operation stability in various complex environments has been effectively improved. The SVR-based algorithm provides an effective technical means to improve the stability performance of the module. When the proposed algorithm is combined with other technical methods, it will definitely extend the maintenance cycle and operation life of the module in a coal mine. In addition, the SVR-based algorithm proposed in this work not only is suitable for improving the stability of CO detection in coal mines, but also provides a method reference for TDLAS detection of other gases, especially for the TDLAS technology based on the mid-infrared waveband. It also has the potential to be used in applications that need high-precision in situ monitoring of specific gases and have relatively complex field operation environments, such as environmental protection and industrial process control.

Author Contributions

Conceptualization, Y.W.; methodology, Y.W. and L.L.; software, Y.W.; validation, L.L., H.L., and F.H.; formal analysis, P.Q.; investigation, P.Q.; data curation, Y.W., L.L., and H.L.; writing—original draft preparation, Y.W.; writing—review and editing, H.L. and F.H.; visualization, L.L. and P.Q.; supervision, P.Q.; project administration, Y.W. and L.L.; funding acquisition, Y.W. and P.Q. All authors have read and agreed to the published version of the manuscript.

Funding

This research was funded by the Natural Science Foundation of the Jiangsu Higher Education Institutions of China (21KJB510005) and the Natural Science Foundation of the Jiangsu Higher Education Institutions of China (20KJB130003). This research was also funded by Jiangsu Shuangchuang Ph.D. Award and the Research Foundation of the Nanjing Vocational University of Industry Technology (YK20-12-05).

Institutional Review Board Statement

Not applicable.

Informed Consent Statement

Not applicable.

Data Availability Statement

Data available online: https://www.researchgate.net/publication/376456359_research_data (accessed on 21 December 2023).

Conflicts of Interest

The authors declare no conflicts of interest. The funders had no role in the design of the study; in the collection, analyses, or interpretation of data; in the writing of the manuscript; or in the decision to publish the results.

References

  1. Carras, J.N.; Day, S.J.; Saghafi, A.; Williams, D.J. Greenhouse gas emissions from low-temperature oxidation and spontaneous combustion at open-cut coal mines in Australia. Int. J. Coal Geol. 2009, 78, 161–168. [Google Scholar] [CrossRef]
  2. Lu, Y.; Qin, B.T. Dentification and Contral of Spontaneous Combustion of Coal Pillars: A Case Study in the Qianyingzi Mine, China. Nat. Hazards 2015, 75, 2679–2683. [Google Scholar] [CrossRef]
  3. Tosun, A. Development of a technology to prevent spontaneous combustion of coal in underground coal mining. J. South. Afr. Inst. Min. Metall. 2017, 117, 1133–1138. [Google Scholar] [CrossRef]
  4. Ozcelik, M. Spontaneous combustion of coal seams in the Bengiler coal mine in Turkey. Euro-Mediterr. J. Environ. Integr. 2023, 8, 665–674. [Google Scholar] [CrossRef]
  5. Liang, Y.; Zhang, J.; Wang, L.; Luo, H.; Ren, T. Forecasting Spontaneous Combustion of Coal in Underground Coal Mines by Index Gases: A Review. J. Loss Prev. Process Ind. 2019, 57, 208–222. [Google Scholar] [CrossRef]
  6. Wen, H.; Yu, Z.J.; Fan, S.; Zhai, X.; Liu, W. Prediction of Spontaneous Combustion Potential of Coal in the Gob Area Using CO Extreme Concentration: A Case Study. Combust. Sci. Technol. 2017, 189, 1713–1727. [Google Scholar] [CrossRef]
  7. Kursunoglu, N.; Ankara, H. Application of Statistical Process Control to Monitor Underground Coal Mine Fires Based on CO Emissions. Combust. Sci. Technol. 2022, 196, 142–159. [Google Scholar] [CrossRef]
  8. Wang, L. Design and Implementation of Carbon Monoxide Wireless Sensor in Coal Mine Safety Monitoring System. Colliery Mech. Electr. Technol. 2020, 41, 5–8. [Google Scholar]
  9. Ariyaratne, R.; Elangasinghe, M.A.; Zamora, M.L.; Karunaratne, D.G.G.P.; Manipura, A.; Jinadasa, K.B.S.N.; Abayalath, K.H.N. Understanding the effect of temperature and relative humidity on sensor sensitivities in field environments and improving the calibration models of multiple electrochemical carbon monoxide (CO) sensors in a tropical environment. Sens. Actuators B Chem. 2023, 390, 133935. [Google Scholar] [CrossRef]
  10. Ueda, T.; Matsuo, T.; Hyodo, T.; Shimizu, Y. Effects of Heat Treatments of Pt-loaded Al2O3 on Catalytic Activities of CO Oxidation and Combustion-type CO Sensors. J. Mater. Sci. 2023, 58, 9459–9472. [Google Scholar] [CrossRef]
  11. Daniel, T.T.; Yadav, V.K.S.; Abraham, E.E.; Paily, R.P. Carbon Monoxide Sensor Based on Printed ZnO. IEEE Sens. J. 2022, 22, 10910–10917. [Google Scholar] [CrossRef]
  12. Ma, Z.; Li, Y.; Lu, Y.; Song, F.; Zheng, C.; Wang, Y. Infrared Carbon Monoxide Sensor System for Early Fire Detection. Acta Photonica Sin. 2022, 51, 0530002. [Google Scholar]
  13. Lin, S.; Chang, J.; Sun, J.; Xu, P. Improvement of the Detection Sensitivity for Tunable Diode Laser Absorption Spectroscopy: A Review. Front. Phys. 2022, 10, 853966. [Google Scholar] [CrossRef]
  14. Pan, Y. Research on Carbon Monoxide Gas Monitoring Method in Thermal Power Plants based on TDLAS. In Institute of Optics, Fine Mechanics and Physics; Chinese Academy of Sciences: Changchun, China, 2021; pp. 41–69. [Google Scholar]
  15. Lewen, Z.; Zhirong, Z.; Qianjin, W.; Pengshuai, S.; Bian, W.; Tao, P.; Hua, X.; Sigrist, M.W. A Sensitive Carbon Monoxide Sensor for Industrial Process Control Based on Laser Absorption Spectroscopy with a 2.3 μm Distributed Feedback Laser. Opt. Lasers Eng. 2022, 152, 106950. [Google Scholar] [CrossRef]
  16. Ghorbani, R.; Schmidt, F.M. ICL-based TDLAS sensor for real-time breath gas analysis of carbon monoxide isotopes. Optics Express 2017, 25, 12743–12752. [Google Scholar] [CrossRef] [PubMed]
  17. Nwaboh, J.A.; Qu, Z.C.; Werhahn, O.; Ebert, V. Interband Cascade Laser-based Optical Transfer Standard for Atmospheric Carbon Monoxide Measurements. Appl. Opt. 2017, 56, E84–E93. [Google Scholar] [CrossRef] [PubMed]
  18. Tadic, I.; Parchatka, U.; Königstedt, R.; Fischer, H. In-flight Stability of Quantum Cascade Laser-band Infrared Absorption Spectroscopy Measurements of Atmospheric Carbon Monoxide. Appl. Phys. B 2017, 123, 146. [Google Scholar] [CrossRef]
  19. State Administration of Coal Mine Safety of the People’s Republic of China, The coal industry standard of People’s Republic of China MT/T 757-2019, General Technical Conditions of the Tube Bundle Monitoring System for Coal Mine Spontaneous Combustion 2019. Available online: https://english.www.gov.cn/state_council/2014/10/06/content_281474992926692.htm (accessed on 12 December 2022).
  20. Liang, C.Q.; Lv, D.; Zhu, H.; Lu, X. Detection of Methane Concentration Based on TDLAS Technology and Wavelet Transform Denoising Algrithm. Infrared Technol. 2023, 45, 209–216. [Google Scholar]
  21. Zhang, P.Q.; Fan, W.; Xiang, T. The Research on High-performance CO2 Gas Measurement Using the Kalman-wavelet Algorithm. Microw. Opt. Technol. Lett. 2023, 65, 1271–1276. [Google Scholar] [CrossRef]
  22. Xu, Z.Y. Research on Temperature Measurement and 2D Distribution for Transient Combustion Process by Infrared Absorption; Hefei Institutes of Physical Science, Chinese Academy of Sciences: Hefei, China, 2012; pp. 48–51. [Google Scholar]
  23. Li, H. Statistical Learning Method, 2nd ed.; Tsinghua University Press: Beijing, China, 2019; pp. 111–152. [Google Scholar]
  24. Hofmann, T.; Scholkopf, B.; Smola, A.J. Kernel methods in machine learning. Ann. Stat. 2008, 36, 1171–1220. [Google Scholar] [CrossRef]
  25. Fast Training of Support Vector Machines Using Sequential Minimal Optimization. Available online: https://research.microsoft.com/apps/pubs/?id=68391 (accessed on 1 January 1998).
Figure 1. Physical image and schematic diagram of the CO monitoring module: (a) schematic diagram of the CO monitoring module; (b) physical image of the CO monitoring module.
Photonics 11 00011 g001
Figure 2. The standard characteristic absorbance spectrum of 100 ppm CO gas near 4588   n m in the HITRAN database (The absorption optical path length is 15   c m , the temperature is 298   K and the pressure is 1   a t m ).
Photonics 11 00011 g002
Figure 3. The N2 spectrum with less noise and the one with severe noise: (a) spectrum with less noise; (b) spectrum with severe noise.
Photonics 11 00011 g003
Figure 4. The 25 ppm CO spectrum with less noise and the one with severe noise: (a) spectrum with less noise; (b) spectrum with severe noise.
Photonics 11 00011 g004
Figure 5. The frequency spectra of N2 absorption spectrum data with less noise and the ones with severe noise: (a) frequency spectrum of N2 TDLAS spectrum data with less noise; (b) frequency spectrum of N2 TDLAS spectrum data with severe noise.
Photonics 11 00011 g005
Figure 6. The frequency spectra of the 25 ppm CO TDLAS spectrum data with less noise and the ones with severe noise: (a) frequency spectrum of 25 ppm CO TDLAS spectrum data with less noise; (b) frequency spectrum of 25 ppm CO TDLAS spectrum data with severe noise.
Photonics 11 00011 g006
Figure 7. The TDLAS spectra of N2 and 25 ppm CO gas after moving average filtering: (a) the N2 TDLAS spectrum after moving average filtering; (b) the 25 ppm CO TDLAS spectrum after moving average filtering.
Photonics 11 00011 g007
Figure 8. The extraction of N2 TDLAS spectral background based on SVR and that based on least square polynomial fit: (a) the extraction of N2 TDLAS spectral background by the SVR-based algorithm; (b) the extraction of N2 TDLAS spectral background by least square polynomial fit.
Photonics 11 00011 g008
Figure 9. The extraction of 25 ppm CO TDLAS spectral background based on SVR and that based on least square polynomial fit: (a) the extraction of 25 ppm CO TDLAS spectral background based on SVR; (b) the extraction of 25 ppm CO TDLAS spectral background based on least square polynomial fit.
Photonics 11 00011 g009
Figure 10. The absorbance spectrum of N2 obtained by using SVR-based algorithm and the one by using least square polynomial fit.
Photonics 11 00011 g010
Figure 11. The absorbance spectrum of 25 ppm CO obtained by using SVR-based algorithm and the one by using least square polynomial fit.
Photonics 11 00011 g011
Figure 12. The mirror of the gas absorption cell polluted severely by dust.
Photonics 11 00011 g012
Figure 13. The quantitative regression line of CO gas when extracting the TDLAS spectral background by using the SVR-based algorithm and the one when extracting the TDLAS spectral background by using least square polynomial fit: (a) the quantitative regression line of CO gas when extracting the TDLAS spectral background by using the SVR-based algorithm; (b) the quantitative regression line of CO gas when extracting the TDLAS spectral background by using least square polynomial fit.
Photonics 11 00011 g013
Figure 14. Measurements of 17 ppm standard CO gas, 25 ppm standard CO gas, and 40 ppm standard CO gas: (a) measurements of 17 ppm standard CO gas; (b) measurements of 25 ppm standard CO gas; (c) measurements of 40 ppm standard CO gas.
Photonics 11 00011 g014
Figure 15. Absolute measurement errors of 17 ppm standard CO gas, 25 ppm standard CO gas, and 40 ppm standard CO gas: (a) absolute measurement errors of 17 ppm standard CO gas; (b) absolute measurement errors of 25 ppm standard CO gas; (c) absolute measurement errors of 40 ppm standard CO gas.
Photonics 11 00011 g015
Table 1. Comparisons of the values related to TDLAS spectral background extraction.
By Using the SVR-Based
Algorithm
By Using Least Square
Polynomial Fit
Correlation coefficients of the extracted spectral backgrounds for N2 and 25 ppm CON2: 0.9996
25 ppm CO: 0.9997
N2: 0.9971
25 ppm CO: 0.9962
Peak-to-peak values of N2
absorbance spectra
0.0220.045
Signal-to-noise ratios of 25 ppm CO absorbance spectra13.356.95
Disclaimer/Publisher’s Note: The statements, opinions and data contained in all publications are solely those of the individual author(s) and contributor(s) and not of MDPI and/or the editor(s). MDPI and/or the editor(s) disclaim responsibility for any injury to people or property resulting from any ideas, methods, instructions or products referred to in the content.

