
Lignocellulose-Degrading Enzymes: A Biotechnology Platform for Ferulic Acid Production from Agro-Industrial Side Streams

 ,
,  ,
,
Abstract
: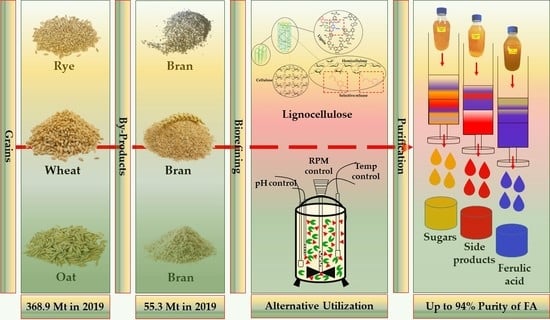
1. Introduction
2. Materials and Methods
2.1. Plant Material
2.2. Plant Material Preparation for Alkaline and Enzymatic Hydrolysis and Analysis of Hydroxycinnamates
2.3. Chemicals and Reagents
2.4. Enzymes
2.5. Enzymatic Hydrolysis of Rye, Wheat, and Oat Bran
2.6. Hydrolysis of Bran Samples under the 10- and 30-Fold Scale-Up Process
2.7. Recovery of FA from Bran Hydrolysates by Solid-Phase Extraction
2.8. Plant Material Preparation for SFE-SFC Extraction of Hydroxycinnamates
2.9. The Online SFE-SFC Extraction Conditions for Hydroxycinnamates
2.10. The Online SFE-SFC-TQ-MS/MS Analytical Conditions for Hydroxycinnamates
2.11. The HPLC-ESI-TQ-MS/MS Analytical Conditions for Phenolics
2.12. The HPLC-RID Analytical Conditions for Carbohydrates
2.13. Preparation of the Lipid Fraction by Alkaline-Assisted Hydrolysis and Liquid–Liquid Extraction
2.14. Preparation of Fatty Acids for GC/MS Analysis
2.15. The GC Conditions for FAME Analysis
2.16. The MS Conditions for FAME Detection
2.17. Statistical Analysis
3. Results and Discussion
3.1. Release of FA from Bran Using Enzyme-Assisted Hydrolysis
3.2. Release of FA from Bran Using Enzyme-Assisted Hydrolysis of the 10- and 30-Fold Scale-Up Process
3.3. Release of FA from Bran Using SFE-CO2 Extraction
3.4. Release of Mono- and Disaccharides from Bran Using Enzyme-Assisted Hydrolysis
3.5. Release of Mono- and Disaccharides from Bran Using Enzyme-Assisted Hydrolysis of the 10- and 30-Fold Scale-Up Process
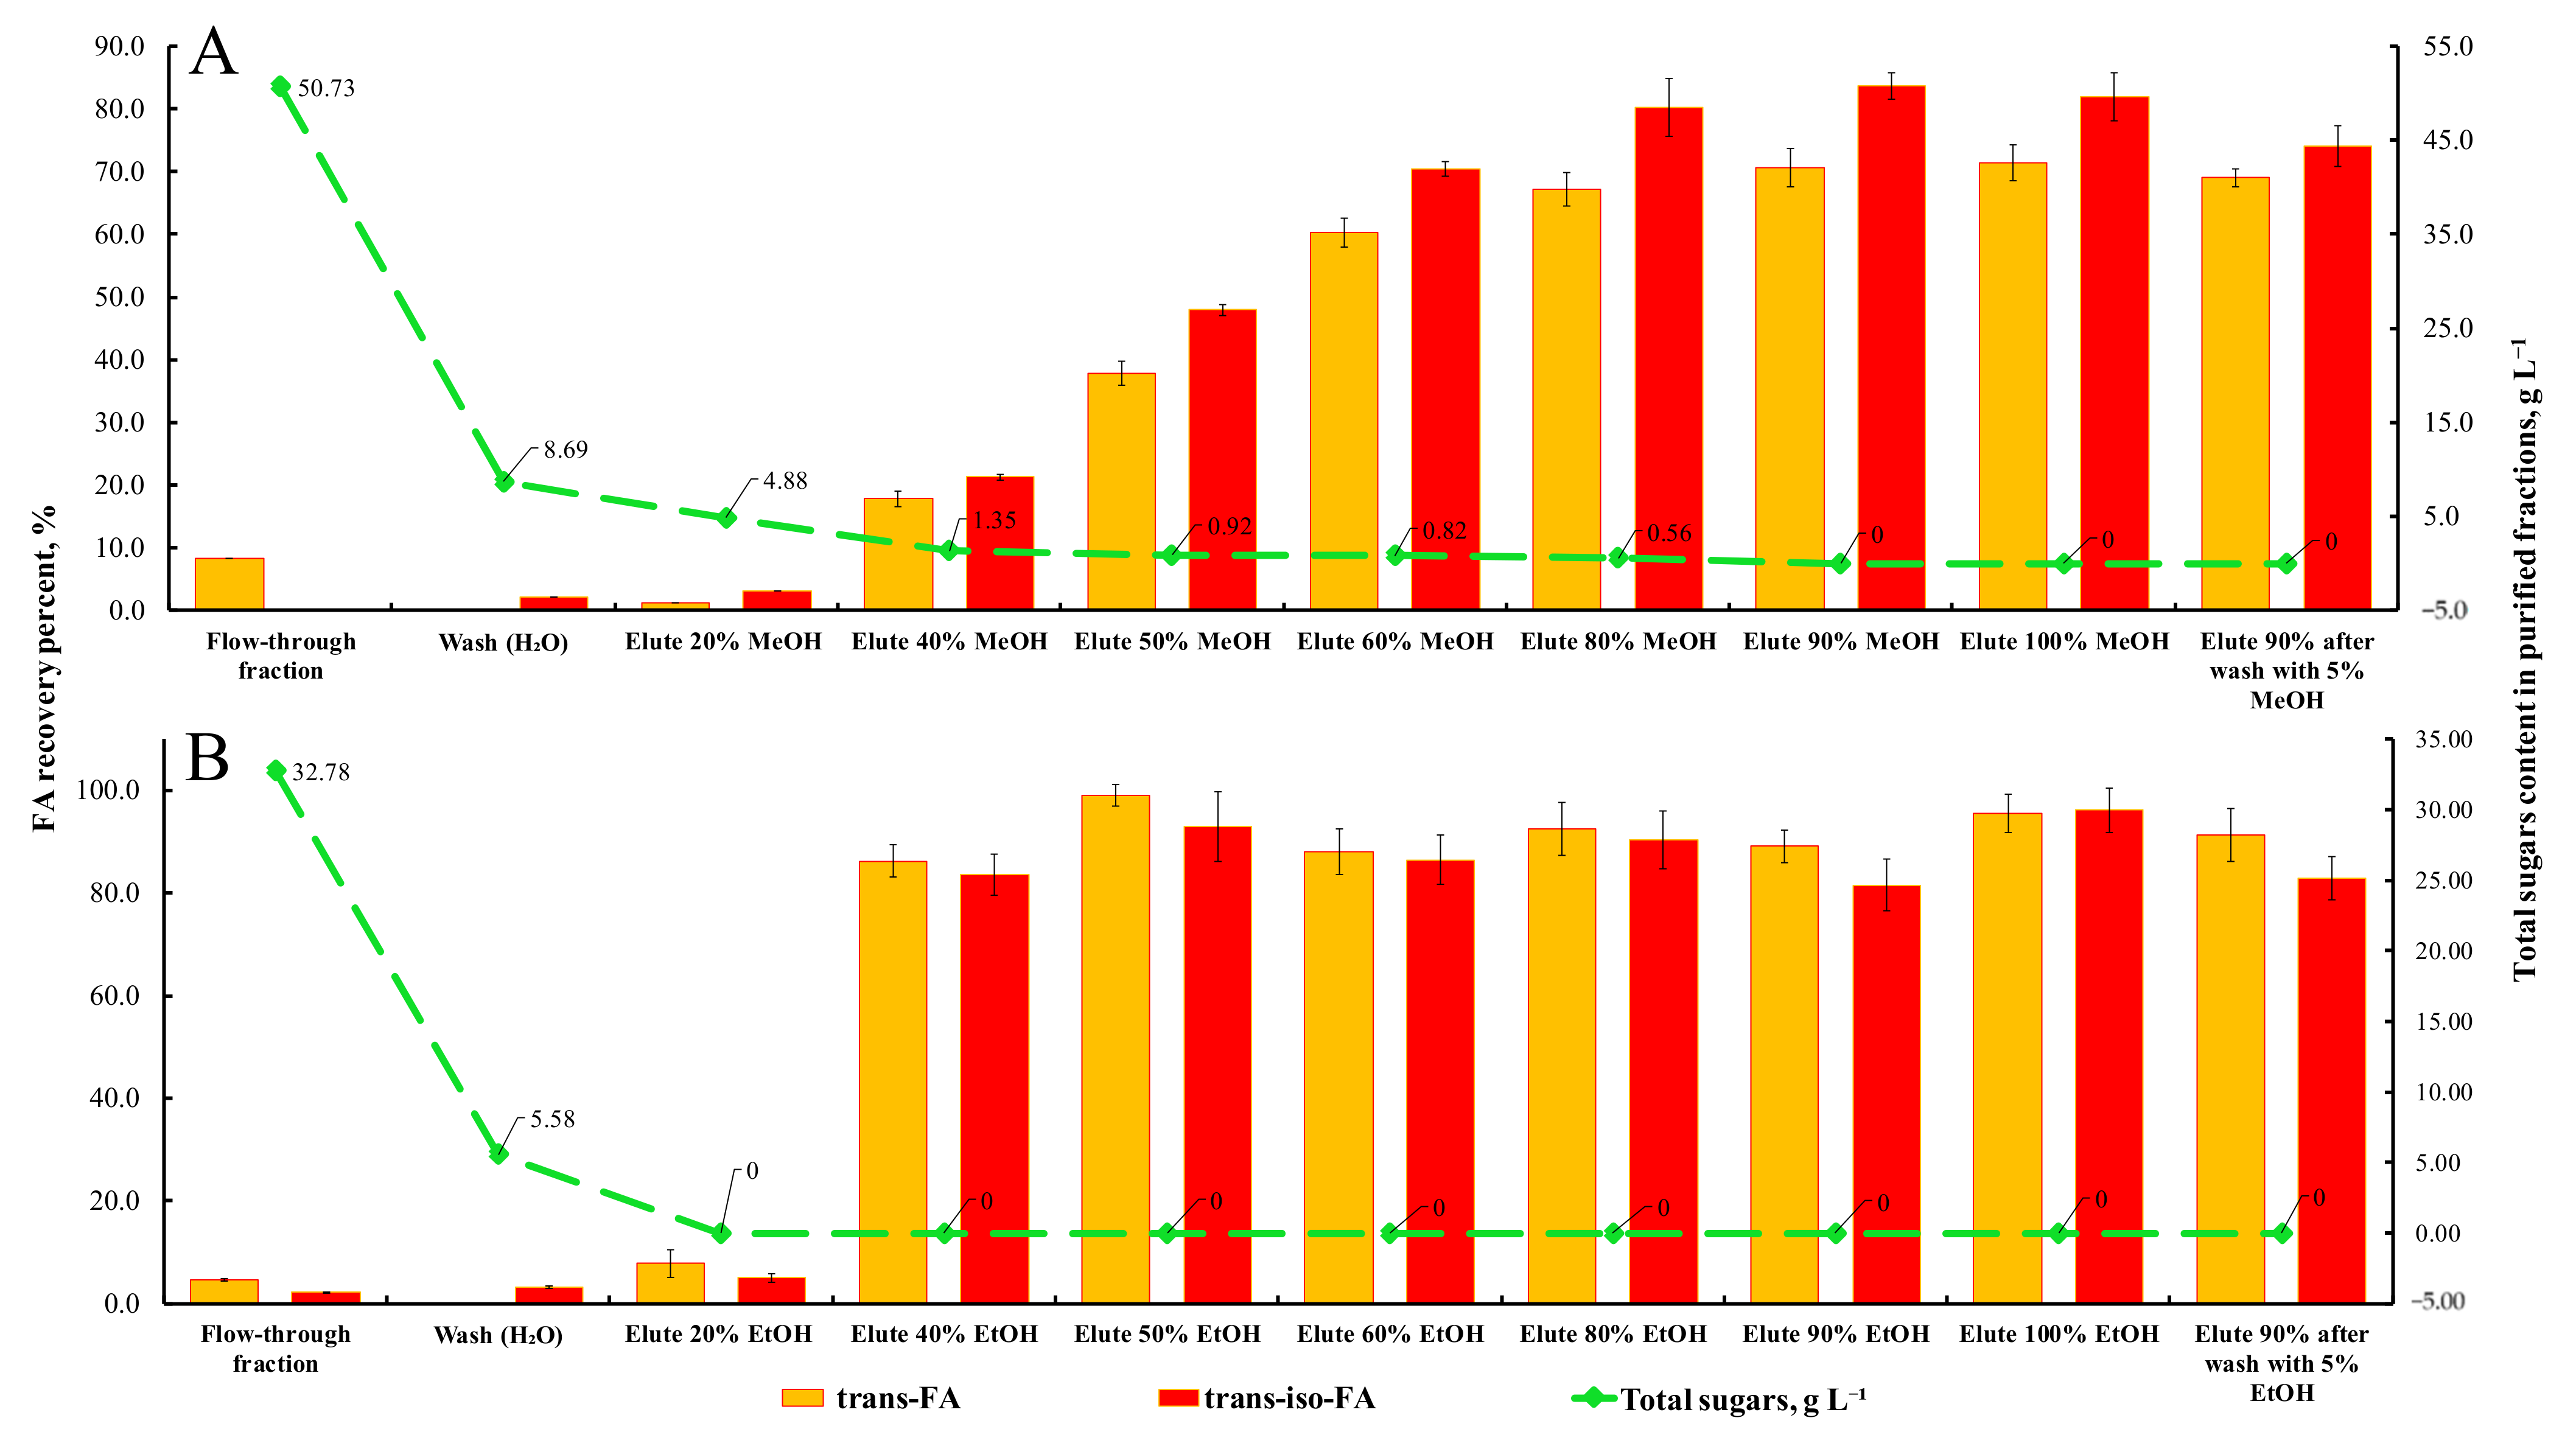
3.6. Recovery of FA from Bran Hydrolysates
3.7. Fatty Acid Composition of Brown Lipophilic Substance
4. Conclusions
Supplementary Materials
Author Contributions
Funding
Institutional Review Board Statement
Informed Consent Statement
Data Availability Statement
Conflicts of Interest
References
- FAOSTAT Global Crops Production Quantity. Available online: https://www.fao.org/faostat/en/#data/QCL (accessed on 14 October 2021).
- Luithui, Y.; Baghya Nisha, R.; Meera, M.S. Cereal by-products as an important functional ingredient: Effect of processing. J. Food Sci. Technol. 2019, 56, 1–11. [Google Scholar] [CrossRef] [PubMed]
- Wang, G.; Huang, D.; Li, Y.; Wen, J.; Jia, X. A metabolic-based approach to improve xylose utilization for fumaric acid production from acid pretreated wheat bran by Rhizopus oryzae. Bioresour. Technol. 2015, 180, 119–127. [Google Scholar] [CrossRef]
- Di Gioia, D.; Sciubba, L.; Setti, L.; Luziatelli, F.; Ruzzi, M.; Zanichelli, D.; Fava, F. Production of biovanillin from wheat bran. Enzym. Microb. Technol. 2007, 41, 498–505. [Google Scholar] [CrossRef]
- Radenkovs, V.; Juhnevica-Radenkova, K.; Górnaś, P.; Seglina, D. Non-waste technology through the enzymatic hydrolysis of agro-industrial by-products. Trends Food Sci. Technol. 2018, 77, 64–76. [Google Scholar] [CrossRef]
- Ferri, M.; Happel, A.; Zanaroli, G.; Bertolini, M.; Chiesa, S.; Commisso, M.; Guzzo, F.; Tassoni, A. Advances in combined enzymatic extraction of ferulic acid from wheat bran. New Biotechnol. 2020, 56, 38–45. [Google Scholar] [CrossRef] [PubMed]
- Martín-Diana, A.B.; Tomé-Sánchez, I.; García-Casas, M.J.; Martínez-Villaluenga, C.; Frías, J.; Rico, D. A novel strategy to produce a soluble and bioactive wheat bran ingredient rich in ferulic acid. Antioxidants 2021, 10, 969. [Google Scholar] [CrossRef]
- Koistinen, V.M.; Katina, K.; Nordlund, E.; Poutanen, K.; Hanhineva, K. Changes in the phytochemical profile of rye bran induced by enzymatic bioprocessing and sourdough fermentation. Food Res. Int. 2016, 89, 1106–1115. [Google Scholar] [CrossRef]
- Kapreliants, L.; Zhurlova, O. Technology of wheat and rye bran biotransformation into functional ingredients. Int. Food Res. J. 2017, 24, 1975–1979. [Google Scholar]
- Gani, A.; Sm, W.; Fa, M.; Hameed, G. Whole-grain cereal bioactive compounds and their health benefits: A review. J. Food Process. Technol. 2012, 3, 146–156. [Google Scholar] [CrossRef] [Green Version]
- Konopka, I.; Tańska, M.; Faron, A.; Czaplicki, S. Release of free ferulic acid and changes in antioxidant properties during the wheat and rye bread making process. Food Sci. Biotechnol. 2014, 23, 831–840. [Google Scholar] [CrossRef]
- Andreasen, M.F.; Christensen, L.P.; Meyer, A.S. Content of phenolic acids and ferulic acid dehydrodimers in 17 rye (Secale cereale L.) varieties. J. Agric. Food Chem. 2000, 48, 2837–2842. [Google Scholar] [CrossRef]
- Buksa, K.; Praznik, W.; Loeppert, R.; Nowotna, A. Characterization of water and alkali extractable arabinoxylan from wheat and rye under standardized conditions. J. Food Sci. Technol. 2016, 53, 1389–1398. [Google Scholar] [CrossRef] [PubMed] [Green Version]
- Juhnevica-Radenkova, K.; Kviesis, J.; Moreno, D.A.; Seglina, D.; Vallejo, F.; Valdovska, A.; Radenkovs, V. Highly-efficient release of ferulic acid from agro-industrial by-products via enzymatic hydrolysis with cellulose-degrading enzymes: Part i–the superiority of hydrolytic enzymes versus conventional hydrolysis. Foods 2021, 10, 782. [Google Scholar] [CrossRef]
- Martínez-Villaluenga, C.; Peñas, E. Health benefits of oat: Current evidence and molecular mechanisms. Curr. Opin. Food Sci. 2017, 14, 26–31. [Google Scholar] [CrossRef] [Green Version]
- Mattila, P.; Pihlava, J.-H.; Hellström, H. Contents of phenolic acids, alkyl- and alkenylresorcinols, and avenanthramides in commercial grain products. J. Agric. Food Chem. 2005, 53, 8290–8295. [Google Scholar] [CrossRef]
- Zhao, Z.; Moghadasian, M.H. Chemistry, natural sources, dietary intake and pharmacokinetic properties of ferulic acid: A review. Food Chem. 2008, 109, 691–702. [Google Scholar] [CrossRef]
- Radenkovs, V.; Kviesis, J.; Juhnevica-Radenkova, K.; Valdovska, A.; Püssa, T.; Klavins, M.; Drudze, I. Valorization of wild apple (Malus spp.) by-products as a source of essential fatty acids, tocopherols and phytosterols with antimicrobial activity. Plants 2018, 7, 90. [Google Scholar] [CrossRef] [PubMed] [Green Version]
- Ruiz, R.P. Gravimetric measurements of water. In Handbook of Food Analytical Chemistry, Water, Proteins, Enzymes, Lipids, and Carbohydrates; Wrolstad, R.E., Acree, T.E., Decker, E.A., Penner, M.H., Reid, D.S., Schwartz, S.J., Shoemaker, C.F., Smith, D., Sporns, P., Eds.; John Wiley and Sons: Hoboken, NJ, USA, 2005; pp. 5–33. ISBN 9780471709084. [Google Scholar]
- American Society for Testing and Materials Standard test methods for fatty and rosin acids in tall oil fractionation products by capillary gas chromatography. Annu. B ASTM Stand. 2001, 96, 1–3.
- European Council Directive 2010/75/EU Industrial Emissions. Off. J. Eur. Union 2010, L334, 17–119. [CrossRef]
- Ohra-Aho, T.; Niemi, P.; Aura, A.M.; Orlandi, M.; Poutanen, K.; Buchert, J.; Tamminen, T. Structure of Brewer’s spent grain lignin and its interactions with gut microbiota in vitro. J. Agric. Food Chem. 2016, 64, 812–820. [Google Scholar] [CrossRef]
- Mahmoudi, H.; Marzouki, M.; M’Rabet, Y.; Mezni, M.; Ait Ouazzou, A.; Hosni, K. Enzyme pretreatment improves the recovery of bioactive phytochemicals from sweet basil (Ocimum basilicum L.) leaves and their hydrodistilled residue by-products, and potentiates their biological activities. Arab. J. Chem. 2020, 13, 6451–6460. [Google Scholar] [CrossRef]
- Tang, Y.; Hao, J.; Fan, C.; Cao, X. Preparative separation of high-purity trans- and cis-ferulic acid from wheat bran by pH-zone-refining counter-current chromatography. J. Chromatogr. A 2021, 1636, 461772. [Google Scholar] [CrossRef] [PubMed]
- Schär, M.Y.; Corona, G.; Soycan, G.; Dine, C.; Kristek, A.; Alsharif, S.N.S.; Behrends, V.; Lovegrove, A.; Shewry, P.R.; Spencer, J.P.E. Excretion of avenanthramides, phenolic acids and their major metabolites following intake of oat bran. Mol. Nutr. Food Res. 2018, 62, 1700499. [Google Scholar] [CrossRef] [Green Version]
- Rybka, K.; Sitarski, J.; Raczyńska-Bojanowska, K. Ferulic acid in rye and wheat grain and grain dietary fiber. Cereal Chem. 1993, 70, 55–59. [Google Scholar]
- Zhang, J.; Ding, Y.; Dong, H.; Hou, H.; Zhang, X. Distribution of phenolic acids and antioxidant activities of different bran fractions from three pigmented wheat varieties. J. Chem. 2018, 2018, 6459243. [Google Scholar] [CrossRef] [Green Version]
- Guo, W.; Beta, T. Phenolic acid composition and antioxidant potential of insoluble and soluble dietary fibre extracts derived from select whole-grain cereals. Food Res. Int. 2013, 51, 518–525. [Google Scholar] [CrossRef]
- Li, X.; Lin, J.; Gao, Y.; Han, W.; Chen, D. Antioxidant activity and mechanism of Rhizoma cimicifugae. Chem. Cent. J. 2012, 6, 1–10. [Google Scholar] [CrossRef] [Green Version]
- Lee, J.E.; Kim, B.B.; Ko, Y.; Jeong, S.H.; Park, J.B. Effects of cimicifugae rhizoma on the osteogenic and adipogenic differentiation of stem cells. Exp. Ther. Med. 2017, 13, 443–448. [Google Scholar] [CrossRef] [Green Version]
- Li, J.-X.; Yu, Z.-Y. Cimicifugae Rhizoma: From origins, bioactive constituents to clinical outcomes. Curr. Med. Chem. 2006, 13, 2927–2951. [Google Scholar] [CrossRef]
- Kaszuba, J.; Kapusta, I.; Posadzka, Z. Content of phenolic acids in the grain of selected polish triticale cultivars and its products. Molecules 2021, 26, 562. [Google Scholar] [CrossRef]
- Achinivu, E.C.; Flourat, A.L.; Brunissen, F.; Allais, F. Valorization of waste biomass from oleaginous “oil-bearing” seeds through the biocatalytic production of sinapic acid from mustard bran. Biomass Bioenergy 2021, 145, 105940. [Google Scholar] [CrossRef]
- Kuhn, E.M.; O’Brien, M.H.; Ciesielski, P.N.; Schell, D.J. Pilot-scale batch alkaline pretreatment of corn stover. ACS Sustain. Chem. Eng. 2016, 4, 944–956. [Google Scholar] [CrossRef]
- Morales-Huerta, J.C.; Hernández-Meléndez, O.; Hernández-Luna, M.G.; Manero, O.; Bárzana, E.; Vivaldo-Lima, E. An experimental and modeling study on the pretreatment and alkaline hydrolysis of blue agave bagasse in twin-screw extruders. Ind. Eng. Chem. Res. 2021, 60, 12449–12460. [Google Scholar] [CrossRef]
- Ruiz, H.A.; Conrad, M.; Sun, S.N.; Sanchez, A.; Rocha, G.J.M.; Romaní, A.; Castro, E.; Torres, A.; Rodríguez-Jasso, R.M.; Andrade, L.P.; et al. Engineering aspects of hydrothermal pretreatment: From batch to continuous operation, scale-up and pilot reactor under biorefinery concept. Bioresour. Technol. 2020, 299, 122685. [Google Scholar] [CrossRef] [PubMed] [Green Version]
- Zuorro, A.; Iannone, A.; Lavecchia, R. Water-organic solvent extraction of phenolic antioxidants from brewers’ spent grain. Processes 2019, 7, 126. [Google Scholar] [CrossRef] [Green Version]
- Gammoh, S.; Alu’datt, M.H.; Alhamad, M.N.; Rababah, T.; Ereifej, K.; Almajwal, A.; Ammari, Z.A.; Al Khateeb, W.; Hussein, N.M. Characterization of phenolic compounds extracted from wheat protein fractions using high-performance liquid chromatography/liquid chromatography mass spectrometry in relation to anti-allergenic, anti-oxidant, anti-hypertension, and anti-diabetic propertie. Int. J. Food Prop. 2017, 20, 2383–2395. [Google Scholar] [CrossRef] [Green Version]
- Zavala-López, M.; García-Lara, S. An improved microscale method for extraction of phenolic acids from maize. Plant Methods 2017, 13, 1–11. [Google Scholar] [CrossRef] [Green Version]
- Ameer, K.; Shahbaz, H.M.; Kwon, J.H. Green extraction methods for polyphenols from plant matrices and their byproducts: A review. Compr. Rev. Food Sci. Food Saf. 2017, 16, 295–315. [Google Scholar] [CrossRef] [Green Version]
- Abbas, K.A.; Mohamed, A.; Abdulamir, A.S.; Abas, H.A. A review on supercritical fluid extraction as new analytical method. Am. J. Biochem. Biotechnol. 2008, 4, 345–353. [Google Scholar] [CrossRef]
- Pinto, T.I.; Coelho, J.A.; Pires, B.I.; Neng, N.R.; Nogueira, J.M.; Bordado, J.C.; Sardinha, J.P. Supercritical carbon dioxide extraction, antioxidant activity, and fatty acid composition of bran oil from rice varieties cultivated in Portugal. Separations 2021, 8, 115. [Google Scholar] [CrossRef]
- Ghafoor, K.; AL-Juhaimi, F.Y.; Choi, Y.H. Supercritical fluid extraction of phenolic compounds and antioxidants from grape (Vitis labrusca B.) seeds. Plant Foods Hum. Nutr. 2012, 67, 407–414. [Google Scholar] [CrossRef]
- Kraujalis, P.; Kraujalienė, V.; Kazernavičiūtė, R.; Venskutonis, P.R. Supercritical carbon dioxide and pressurized liquid extraction of valuable ingredients from Viburnum opulus pomace and berries and evaluation of product characteristics. J. Supercrit. Fluids 2017, 122, 99–108. [Google Scholar] [CrossRef]
- González, G.; Salvadó, J.; Montané, D. Reactions of vanillic acid in sub- and supercritical water. J. Supercrit. Fluids 2004, 31, 57–66. [Google Scholar] [CrossRef]
- Junior, M.R.M.; Leite, A.V.; Dragano, N.R.V. Supercritical fluid extraction and stabilization of phenolic compounds from natural sources—Review (supercritical extraction and stabilization of phenolic compounds). Open Chem. Eng. J. 2014, 4, 51–60. [Google Scholar] [CrossRef] [Green Version]
- Luque de Castro, M.; Valcarcel, M.; Tena, M. Analytical applications for supercritical fluid extraction. In Analytical Supercritical Fuid Extraction; Springer: Berlin/Heidelberg, Germany, 1994; ISBN 9783642786730. [Google Scholar]
- Hrncic, M.K.; Cör, D.; Verboten, M.T.; Knez, Z. Application of supercritical and subcritical fluids in food processing. Food Qual. Saf. 2018, 2, 59–67. [Google Scholar] [CrossRef] [Green Version]
- Shin, H.-D.; McClendon, S.; Le, T.; Taylor, F.; Chen, R.R. A Complete enzymatic recovery of ferulic acid from corn residues with extracellular enzymes from Neosartorya spinosa NRRL185. Biotechnol. Bioeng. 2006, 20, 1108–1115. [Google Scholar] [CrossRef] [PubMed]
- Gama, R.; Van Dyk, J.S.; Pletschke, B.I. Optimisation of enzymatic hydrolysis of apple pomace for production of biofuel and biorefinery chemicals using commercial enzymes. 3 Biotech 2015, 5, 1075–1087. [Google Scholar] [CrossRef] [PubMed] [Green Version]
- Xin, D.; Chen, X.; Wen, P.; Zhang, J. Insight into the role of α-arabinofuranosidase in biomass hydrolysis: Cellulose digestibility and inhibition by xylooligomers. Biotechnol. Biofuels 2019, 12, 1–11. [Google Scholar] [CrossRef]
- Bautista-Expósito, S.; Tomé-Sánchez, I.; Martín-Diana, A.B.; Frias, J.; Peñas, E.; Rico, D.; Casas, M.J.G.; Martínez-Villaluenga, C. Enzyme selection and hydrolysis under optimal conditions improved phenolic acid solubility, and antioxidant and anti-inflammatory activities of wheat bran. Antioxidants 2020, 9, 984. [Google Scholar] [CrossRef]
- Alrahmany, R.; Avis, T.J.; Tsopmo, A. Treatment of oat bran with carbohydrases increases soluble phenolic acid content and influences antioxidant and antimicrobial activities. Food Res. Int. 2013, 52, 568–574. [Google Scholar] [CrossRef]
- Wang, X.; Li, X.; Chen, D. Evaluation of antioxidant activity of isoferulic acid in vitro. Nat. Prod. Commun. 2011, 6, 1285–1288. [Google Scholar] [CrossRef] [PubMed] [Green Version]
- Salgado, J.M.; Max, B.; Rodríguez-Solana, R.; Domínguez, J.M. Purification of ferulic acid solubilized from agroindustrial wastes and further conversion into 4-vinyl guaiacol by Streptomyces setonii using solid state fermentation. Ind. Crops Prod. 2012, 39, 52–61. [Google Scholar] [CrossRef]
- Couteau, D.; Mathaly, P. Purification of ferulic acid by adsorption after enzymic release from a sugar-beet pulp extract. Ind. Crops Prod. 1997, 6, 237–252. [Google Scholar] [CrossRef]
- Guo, T.; Sun, Y.; Sui, Y.; Li, F. Determination of ferulic acid and adenosine in Angelicae radix by micellar electrokinetic chromatography. Anal. Bioanal. Chem. 2003, 375, 840–843. [Google Scholar] [CrossRef]
- Buranov, A.U.; Mazza, G. Extraction and purification of ferulic acid from flax shives, wheat and corn bran by alkaline hydrolysis and pressurised solvents. Food Chem. 2009, 115, 1542–1548. [Google Scholar] [CrossRef]
- Cardoso, R.V.C.; Fernandes, Â.; Pinela, J.; Dias, M.I.; Pereira, C.; Pires, T.C.S.P.; Carocho, M.; Vasallo, E.F.; Ferreira, I.C.F.R.; Barros, L. Valorization of cereal by-products from the milling industry as a source of nutrients and bioactive compounds to boost resource-use efficiency. Agronomy 2021, 11, 972. [Google Scholar] [CrossRef]
- Yilmaz, I.; Daǧlioǧlu, O. The effect of replacing fat with oat bran on fatty acid composition and physicochemical properties of meatballs. Meat Sci. 2003, 65, 819–823. [Google Scholar] [CrossRef]
- Wikiera, A.; Mika, M.; Grabacka, M. Multicatalytic enzyme preparations as effective alternative to acid in pectin extraction. Food Hydrocoll. 2015, 44, 156–161. [Google Scholar] [CrossRef]


| Major Nutrient Profile, g 100 g−1 DW | ||||||||
|---|---|---|---|---|---|---|---|---|
| FA, mg 100 g−1 | ||||||||
| Type of Bran | Moisture, % | CHs | Crude Lipids | Crude Proteins | DF | Free | Thermally Processed | Alkali- Hydrolyzed |
| Rye | 11.7± 0.2 a | 30.9 ± 0.5 b | 3.8 ± 0.1 c | 16.9± 0.5 a | 36.0 ± 1.9 b | 19.6 ± 0.6 b | 14.2 ± 0.1 b | 171.2 ± 3.2 b |
| Wheat | 11.9± 0.2 a | 20.3 ± 0.4 c | 4.5 ± 0.1 b | 16.2 ± 0.4 a | 46.5 ± 2.1 a | 32.1 ± 0.7 a | 19.9 ± 0.1 a | 273.3 ± 4.1 a |
| Oat | 12.4± 0.3 a | 50.0 ± 0.9 a | 6.7 ± 0.5 a | 14.0 ± 0.7 b | 14.0 ± 1.7 c | 5.7 ± 0.1 c | 10.5 ± 0.1 c | 45.7. ± 1.9 c |
| Commercial Enzyme | Declared Activity | Enzyme Activity | Source | EC Number |
|---|---|---|---|---|
| Viscoferm® | 222 FBG g−1 | Endo-1,4-β-xylanase, endo-1,3-(1,4)-β-d-glucanase | Aspergillus spp. | 3.2.1.8 3.2.1.4 |
| Viscozyme® L | 100 FBG g−1 | Endo-1,4-β-xylanase, non-reducing end α-L-arabinofuranosidase, endo-1,4-β-d-glucanase | Aspergillus aculeatus | 3.2.1.8 3.2.1.55 3.2.1.4 |
| Celluclast® 1.5 L | 700 EGU g−1 | Endo-1,4-β-d-glucanase | Trichoderma reesei | 3.2.1.4 |
| Experiment No. | Temperature, °C | Pressure, MPa | Co-Solvent Concentration, % | Extrication Time (Static to Dynamic Mode), min |
|---|---|---|---|---|
| 1 | 40 | 15 | 10 | 3:3 |
| 2 | 45 | 15 | 10 | 3:3 |
| 3 | 50 | 15 | 10 | 3:3 |
| 4 | 60 | 15 | 10 | 3:3 |
| 5 | 50 | 10 | 10 | 3:3 |
| 6 | 50 | 15 | 10 | 3:3 |
| 7 | 50 | 20 | 10 | 3:3 |
| 8 | 50 | 25 | 10 | 3:3 |
| 9 | 50 | 15 | 7.5 | 3:3 |
| 10 | 50 | 15 | 10 | 3:3 |
| 11 | 50 | 15 | 15 | 3:3 |
| 12 | 50 | 15 | 20 | 3:3 |
| 13 | 50 | 15 | 10 | 1:5 |
| 14 | 50 | 15 | 10 | 2:4 |
| 15 | 50 | 15 | 10 | 3:3 |
| 16 | 50 | 15 | 10 | 4:2 |
| 17 | 50 | 15 | 10 | 5:1 |
| Compound | Retention Time, min | Molecular Formula | Ionization Mode | MRM Transitions | Q1 Pre-Bias, V | Collision Energy, V | Q3 Pre-Bias, V | Dwell Time, msec |
|---|---|---|---|---|---|---|---|---|
| Eugenol | 1.953 | C10H12O2 | [M + H]+ | 165.0000→69.0000 | −11.0 | −22.0 | −15.0 | 20.0 |
| 165.0000→109.0000 | −11.0 | −24.0 | −13.0 | 20.0 | ||||
| 165.0000→137.0500 | −11.0 | −13.0 | −16.0 | 20.0 | ||||
| Gallic acid | 9.033 | C7H6O5 | [M − H]− | 169.0000→124.9000 | 12.0 | 17.0 | 10.0 | 20.0 |
| 169.0000→78.9500 | 12.0 | 24.0 | 15.0 | 20.0 | ||||
| 169.0000→68.9000 | 12.0 | 22.0 | 11.0 | 20.0 | ||||
| Neochlorogenic acid | 10.245 | C16H18O9 | [M − H]− | 353.1000→191.0500 | 13.0 | 22.0 | 20.0 | 20.0 |
| 353.1000→135.0000 | 13.0 | 31.0 | 12.0 | 20.0 | ||||
| 353.1000→179.0500 | 13.0 | 19.0 | 10.0 | 20.0 | ||||
| Protocatechuic acid | 11.515 | C7H6O4 | [M − H]− | 153.2000→108.9500 | 10.0 | 16.0 | 20.0 | 20.0 |
| 153.2000→107.9500 | 10.0 | 24.0 | 22.0 | 20.0 | ||||
| 153.2000→91.0500 | 10.0 | 26.0 | 17.0 | 20.0 | ||||
| Chlorogenic acid | 12.044 | C16H18O9 | [M − H]− | 353.1000→191.1000 | 19.0 | 22.0 | 20.0 | 20.0 |
| 353.1000→85.0500 | 13.0 | 43.0 | 16.0 | 20.0 | ||||
| 353.1000→127.0000 | 13.0 | 36.0 | 10.0 | 20.0 | ||||
| (+)−Catechin | 12.703 | C15H14O6 | [M − H]− | 288.9500→245.0000 | 14.0 | 15.0 | 14.0 | 20.0 |
| 288.9500→109.0000 | 14.0 | 26.0 | 19.0 | 20.0 | ||||
| 288.9500→123.0000 | 14.0 | 31.0 | 10.0 | 20.0 | ||||
| (−)−Epicatechin | 12.709 | C15H14O6 | [M − H]− | 289.0500→245.0000 | 14.0 | 16.0 | 14.0 | 20.0 |
| 289.0500→109.0000 | 14.0 | 26.0 | 20.0 | 20.0 | ||||
| 289.0500→123.0000 | 14.0 | 30.0 | 22.0 | 20.0 | ||||
| Syringic acid | 13.033 | C9H10O5 | [M − H]− | 197.1500→182.1000 | 20.0 | 15.0 | 10.0 | 20.0 |
| 197.1500→122.9500 | 17.0 | 24.0 | 19.0 | 20.0 | ||||
| 197.1500→95.1000 | 12.0 | 31.0 | 18.0 | 20.0 | ||||
| Vanillic acid | 13.248 | C8H8O4 | [M − H]− | 167.0500→152.0000 | 12.0 | 18.0 | 30.0 | 20.0 |
| 167.0500→107.9000 | 12.0 | 19.0 | 20.0 | 20.0 | ||||
| 167.0500→123.0000 | 12.0 | 14.0 | 19.0 | 20.0 | ||||
| Vanillin | 13.366 | C8H8O3 | [M + H]+ | 152.9500→65.1000 | −10.0 | −24.0 | −24.0 | 20.0 |
| 152.9500→93.0500 | −10.0 | −16.0 | −20.0 | 20.0 | ||||
| 152.9500→125.1000 | −10.0 | −15.0 | −15.0 | 20.0 | ||||
| 4-Vinylphenol | 13.747 | C8H8O | [M + H]+ | 121.0500→77.2000 | −20.0 | −23.0 | −16.0 | 20.0 |
| 121.0500→91.2000 | −21.0 | −19.0 | −18.0 | 20.0 | ||||
| 121.0500→51.2000 | −22.0 | −36.0 | −21.0 | 20.0 | ||||
| Caffeic acid | 13.714 | C9H8O4 | [M − H]− | 179.1500→135.0000 | 12.0 | 18.0 | 25.0 | 20.0 |
| 179.1500→134.0000 | 12.0 | 25.0 | 24.0 | 20.0 | ||||
| Sinapic acid | 14.361 | C11H12O5 | [M + H]+ | 224.9000→207.1000 | −15.0 | −10.0 | −16.0 | 20.0 |
| 224.9000→161.0000 | −10.0 | −10.0 | −18.0 | 20.0 | ||||
| 224.9000→91.1500 | −15.0 | −27.0 | −21.0 | 20.0 | ||||
| trans-Isoferulic acid | 14.728 | C10H10O4 | [M + H]+ | 194.9000→177.1000 | −13.0 | −11.0 | −13.0 | 20.0 |
| 194.9000→131.0000 | −13.0 | −11.0 | −15.0 | 20.0 | ||||
| 194.9000→89.1500 | −13.0 | −32.0 | −19.0 | 20.0 | ||||
| trans-Ferulic acid | 14.733 | C10H10O4 | [M − H]− | 193.0500→134.0000 | 10.0 | 18.0 | 23.0 | 20.0 |
| 193.0500→178.0500 | 10.0 | 15.0 | 15.0 | 20.0 | ||||
| para-Coumaric acid | 14.818 | C9H8O3 | [M − H]− | 163.0500→119.0500 | 11.0 | 16.0 | 21.0 | 20.0 |
| 163.0500→93.0500 | 12.0 | 31.0 | 17.0 | 20.0 | ||||
| 2-Methoxy-4- vinylphenol | 17.972 | C9H10O2 | [M + H]+ | 150.8000→91.2500 | −10.0 | −22.0 | −19.0 | 20.0 |
| 150.8000→65.2000 | −25.0 | −32.0 | −28.0 | 20.0 | ||||
| trans−Cinnamic acid | 18.600 | C9H8O2 | [M + NH4]+ | 165.0000→101.2000 | −12.0 | −12.0 | −20.0 | 20.0 |
| 165.0000→69.2000 | −12.0 | −23.0 | −29.0 | 20.0 | ||||
| 165.0000→133.2500 | −11.0 | −10.0 | −15.0 | 20.0 |
| Enzyme | Viscozyme L | Celluclast 1.5 L | Viscoferm | |||||||||
|---|---|---|---|---|---|---|---|---|---|---|---|---|
| Time, h | 12 | 24 | 48 | 72 | 12 | 24 | 48 | 72 | 12 | 24 | 48 | 72 |
| Carbohydrate Xyl | Rye Bran | |||||||||||
| 6.8 ± 0.6 c | 9.4 ± 0.5 b | 12.9 ± 0.0 a | 9.7 ± 0.0 b | 10.6 ± 0.6 b | 12.3 ± 1.0 a | 12.8 ± 0.6 a | 11.1 ± 0.4 b | 8.9 ± 0.5 c | 9.9 ± 0.5 b | 10.8 ± 0.2 a | 10.9 ± 0.6 a | |
| Ara | 5.3 ± 0.5 a | 4.2 ± 0.5 b | 5.1 ± 0.0 a | 3.2 ± 0.0 c | 2.5 ± 0.1 a | 2.7 ± 0.3 a | 2.5 ± 0.2 a | 2.2 ± 0.2 a | 8.0 ± 0.1 a | 7.4 ± 1.0 a | 4.6 ± 0.4 c | 5.7 ± 0.4 b |
| Fru | 2.5 ± 0.3 c | 3.0 ± 0.3 b | 4.4 ± 0.1 a | 1.6 ± 0.0 d | 2.6 ± 0.1 a | 2.9 ± 0.0 a | 3.1 ± 0.1 a | 2.5 ± 0.2 a | 2.2 ± 0.2 b | 3.1 ± 0.4 a | 2.2 ± 0.1 b | 2.9 ± 0.1 a b |
| Glu | 22.2 ± 0.4 d | 34.1 ± 0.9 b | 39.9 ± 0.9 a | 31.5 ± 1.0 c | 11.5 ± 0.2 b | 13.4 ± 0.8 a | 13.3 ± 0.9 a | 11.8 ± 0.6 b | 10.8 ± 0.4 b | 10.8 ± 0.8 b | 10.7 ± 0.1 b | 19.9 ± 0.7 a |
| Suc | 0.2 ± 0.0 | 0.0 ± 0.0 | 0.0 ± 0.0 | 0.0 ± 0.0 | 0.0 ± 0.0 | 0.0 ± 0.0 | 0.0 ± 0.0 | 0.0 ± 0.0 | 0.4 ± 0.1 | 0.0 ± 0.0 | 0.0 ± 0.0 | 0.0 ± 0.0 |
| Mal | 0.8 ± 0.1 b | 1.4 ± 0.0 a | 1.3 ± 0.0 a b | 1.4 ± 0.0 a | 0.6 ± 0.0 a | 1.3 ± 0.1 a | 1.4 ± 0.1 a | 1.5 ± 0.0 a | 0.5 ± 0.1 b | 1.8 ± 0.1 a | 1.7 ± 0.0 a | 1.7 ± 0.1 a |
| Total | 37.8 ± 1.9 d | 52.1 ± 2.2 b | 63.6 ± 1.02 a | 47.4 ± 1.0 c | 27.8 ± 1.0 b | 32.6 ± 2.2 a | 33.1 ± 1.7 a | 29.1 ± 1.4 a b | 30.8 ± 1.4 c | 33.0 ± 2.8 b | 30.0 ± 0.8 c | 41.1 ± 1.9 a |
| Carbohydrate Xyl | Wheat Bran | |||||||||||
| 6.4 ± 0.6 c | 8.2 ± 0.1 b | 10.6 ± 0.4 a | 8.9 ± 0.6 b | 8.6 ± 0.4 d | 10.7 ± 0.2 b | 12.1 ± 0.2 a | 9.5 ± 0.2 c | 1.4 ± 0.1 c | 8.6 ± 0.4 b | 9.7 ± 0.5 a | 10.3 ± 0.5 a | |
| Ara | 1.9 ± 0.1 c | 3.1 ± 0.2 b | 5.1 ± 0.2 a | 2.8 ± 0.3 b | 2.1 ± 0.2 b | 3.6 ± 0.1 a | 4.1 ± 0.1 a | 2.0 ± 0.1 b | 1.2 ± 0.1 c | 4.0 ± 0.4 b | 4.3 ± 0.2 a b | 5.0 ± 0.2 a |
| Fru | 1.0 ± 0.1 c | 1.9 ± 0.1 b | 4.0 ± 0.1 a | 1.5 ± 0.2 b c | 2.5 ± 0.1 b | 3.4 ± 0.2 a | 3.7 ± 0.2 a | 2.6 ± 0.1 b | 0.9 ± 0.0 c | 1.8 ± 0.1 b | 2.5 ± 0.1 a b | 2.9 ± 0.4 a |
| Glu | 13.8 ± 0.4 c | 19.0 ± 0.8 b | 25.1 ± 0.1 a | 18.7 ± 0.3 b | 5.9 ± 0.1 c | 6.2 ± 0.2 b c | 6.7 ± 0.3 a b | 7.4 ± 0.3 a | 17.3 ± 0.4 a | 6.6 ± 0.1 c | 7.4 ± 0.1 c | 16.0 ± 0.7 b |
| Suc | 1.2 ± 0.1 a | 0.6 ± 0.1 a | 0.4 ± 0.0 a | 0.1 ± 0.0 b | 0.5 ± 0.1 | 0.0 ± 0.0 | 0.0 ± 0.0 | 0.0 ± 0.0 | 0.0 ± 0.0 | 0.0 ± 0.0 | 0.0 ± 0.0 | 0.0 ± 0.0 |
| Mal | 1.0 ± 0.1 a | 1.6 ± 0.1 a | 1.6 ± 0.1 a | 1.9 ± 0.0 a | 1.1 ± 0.1 a | 1.1 ± 0.0 a | 1.3 ± 0.0 a | 1.3 ± 0.1 a | 0.4 ± 0.1 b | 1.3 ± 0.1 a | 1.4 ± 0.1 a | 1.6 ± 0.1 a |
| Total | 25.3 ± 1.4 c | 34.4 ± 1.4 b | 46.8 ± 0.9 a | 33.9 ± 1.4 b | 20.7 ± 1.0 d | 25.0 ± 0.7 b | 27.9 ± 0.8 a | 22.8 ± 0.8 c | 21.2 ± 0.7 d | 22.3 ± 1.1 c | 25.3 ± 1.0 b | 35.8 ± 1.9 a |
| Carbohydrate Xyl | Oat Bran | |||||||||||
| 1.2 ± 0.1 a | 1.4 ± 0.1 a | 1.6 ± 0.1 a | 1.9 ± 0.1 a | 1.6 ± 0.1 b | 3.1 ± 0.1 a | 1.5 ± 0.1 b | 1.9 ± 0.0 b | 1.4 ± 0.0 a | 1.4 ± 0.0 a | 1.6 ± 0.1 a | 1.8 ± 0.1 a | |
| Ara | 1.1 ± 0.1 a | 1.2 ± 0.1 a | 1.1 ± 0.1 a | 1.6 ± 0.1 a | 0.0 ± 0.1 | 0.0 ± 0.0 | 0.0 ± 0.0 | 0.0 ± 0.0 | 1.3 ± 0.1 a | 1.1 ± 0.1 a | 1.1 ± 0.1 a | 1.3 ± 0.0 a |
| Fru | 0.0 ± 0.0 | 0.0 ± 0.0 | 0.0 ± 0.0 | 0.0 ± 0.0 | 0.0 ± 0.0 | 0.0 ± 0.0 | 0.0 ± 0.0 | 0.0 ± 0.0 | 0.7 ± 0.0 a | 0.8 ± 0.1 a | 0.9 ± 0.1 a | 1.0 ± 0.1 a |
| Glu | 56.6 ± 1.9 c | 62.3 ± 1.6 a | 59.5 ± 1.2 b | 55.5 ± 2.1 c | 7.0 ± 0.3 d | 10.4 ± 0.6 c | 12.6 ± 0.4 b | 17.1 ± 0.4 a | 13.9 ± 0.6 d | 16.2 ± 0.9 c | 20.3 ± 0.1 b | 22.6 ± 0.5 a |
| Suc | 0.0 ± 0.0 | 0.4 ± 0.1 | 0.0 ± 0.0 | 0.0 ± 0.0 | 0.0 ± 0.0 b | 1.1 ± 0.1 a | 1.4 ± 0.1 a | 1.6 ± 0.1 a | 0.0 ± 0.0 | 0.0 ± 0.0 | 0.0 ± 0.0 | 0.0 ± 0.0 |
| Mal | 0.6 ± 0.1 a | 1.0 ± 0.0 a | 1.0 ± 0.1 a | 1.0 ± 0.1 a | 0.3 ± 0.1 a | 0.5 ± 0.0 a | 0.5 ± 0.1 a | 0.6 ± 0.1 a | 0.4 ± 0.1 b | 1.5 ± 0.1 a | 2.2 ± 0.1 a | 2.1 ± 0.1 a |
| Total | 59.5 ± 2.2 c | 66.3 ± 1.9 a | 63.2 ± 1.5 b | 60.0 ± 2.4 c | 8.9 ± 0.6 d | 15.1 ± 0.8 c | 16.0 ± 0.7 b | 21.2 ± 0.6 a | 17.7 ± 0.8 d | 21.0 ± 1.2 c | 26.1 ± 0.5 b | 28.8 ± 0.91 a |
| Type of Bran | HM | Fatty Acid, % w/v | |||||||
|---|---|---|---|---|---|---|---|---|---|
| SFA | MUFA | PUFA | |||||||
| C16:0 | C18:0 | C18:1n9c | C18:1n9t | C20:1n9c | C18:2n6c | C18:3n3c | C20:3n3c | ||
| Rye | KOH (10% in MeOH) | 5.46 ± 0.06 | 0.33 ± 0.00 | 4.18 ± 0.19 | nd | 0.06 ± 0.01 | 14.92 ± 0.13 | 1.27 ± 0.04 | <LOQ |
| Viscozyme L | 14.24 ± 1.16 | 0.89 ± 0.13 | 12.13 ± 1.36 | nd | 2.46 ± 0.74 | 36.10 ± 1.24 | 2.62 ± 0.26 | nd | |
| Celluclast 1.5 L | 7.97 ± 0.61 | 0.37 ± 0.09 | 5.88 ± 0.44 | nd | nd | 22.72 ± 0.26 | 1.58 ± 0.10 | nd | |
| Viscoferm | 4.39 ± 0.10 | 0.31 ± 0.02 | 3.22 ± 0.34 | nd | nd | 12.92 ± 0.36 | 0.59 ± 0.20 | nd | |
| Wheat | KOH (10% in MeOH) | 5.62 ± 0.08 | 0.38 ± 0.02 | 5.40 ± 0.08 | nd | 0.01 ± 0.0 0 | 14.80 ± 0.68 | 1.10 ± 0.07 | 0.02 ± 0.01 |
| Viscozyme L | 10.19 ± 0.29 | 0.67 ± 0.06 | 10.86 ± 0.91 | 0.05 ± 0.02 | 0.23 ± 0.05 | 27.00 ± 0.99 | 2.34 ± 0.14 | nd | |
| Celluclast 1.5 L | 22.88 ± 0.39 | 1.22 ± 0.01 | 21.06 ± 0.31 | nd | nd | 57.09 ± 0.42 | 4.34 ± 0.06 | nd | |
| Viscoferm | 6.80 ± 0.30 | 0.45 ± 0.12 | 6.64 ± 0.30 | nd | nd | 17.87 ± 0.40 | 0.72 ± 0.03 | nd | |
| Oat | KOH (10% in MeOH) | 7.12 ± 0.05 | 0.54 ± 0.01 | 13.15 ± 0.66 | nd | 0.12 ± 0.01 | 15.30 ± 0.35 | 0.54 ± 0.10 | nd |
| Viscozyme L | 12.37 ± 1.35 | 1.01 ± 0.08 | 29.02 ± 3.75 | nd | 0.43 ± 0.05 | 28.14 ± 4.49 | 1.10 ± 0.19 | nd | |
| Celluclast 1.5 L | 12.20 ± 0.25 | 0.75 ± 0.15 | 27.88 ± 0.27 | nd | nd | 25.89 ± 0.70 | 0.66 ± 0.28 | nd | |
| Viscoferm | 8.32 ± 0.01 | 0.66 ± 0.08 | 18.62 ± 0.31 | nd | nd | 18.35 ± 0.38 | 0.19 ± 0.10 | nd | |
Publisher’s Note: MDPI stays neutral with regard to jurisdictional claims in published maps and institutional affiliations. |
© 2021 by the authors. Licensee MDPI, Basel, Switzerland. This article is an open access article distributed under the terms and conditions of the Creative Commons Attribution (CC BY) license (https://creativecommons.org/licenses/by/4.0/).
Share and Cite
Radenkovs, V.; Juhnevica-Radenkova, K.; Kviesis, J.; Lazdina, D.; Valdovska, A.; Vallejo, F.; Lacis, G. Lignocellulose-Degrading Enzymes: A Biotechnology Platform for Ferulic Acid Production from Agro-Industrial Side Streams. Foods 2021, 10, 3056. https://0-doi-org.brum.beds.ac.uk/10.3390/foods10123056
Radenkovs V, Juhnevica-Radenkova K, Kviesis J, Lazdina D, Valdovska A, Vallejo F, Lacis G. Lignocellulose-Degrading Enzymes: A Biotechnology Platform for Ferulic Acid Production from Agro-Industrial Side Streams. Foods. 2021; 10(12):3056. https://0-doi-org.brum.beds.ac.uk/10.3390/foods10123056
Chicago/Turabian StyleRadenkovs, Vitalijs, Karina Juhnevica-Radenkova, Jorens Kviesis, Danija Lazdina, Anda Valdovska, Fernando Vallejo, and Gunars Lacis. 2021. "Lignocellulose-Degrading Enzymes: A Biotechnology Platform for Ferulic Acid Production from Agro-Industrial Side Streams" Foods 10, no. 12: 3056. https://0-doi-org.brum.beds.ac.uk/10.3390/foods10123056