
Effects of Non-Nutritive Sweeteners on Energy Intake, Body Weight and Postprandial Glycemia in Healthy and with Altered Glycemic Response Rats

 , , ,
, , ,  and
and
Abstract
:
1. Introduction
2. Materials and Methods
2.1. Experimental Animals
2.2. Diets
2.3. Sweeteners
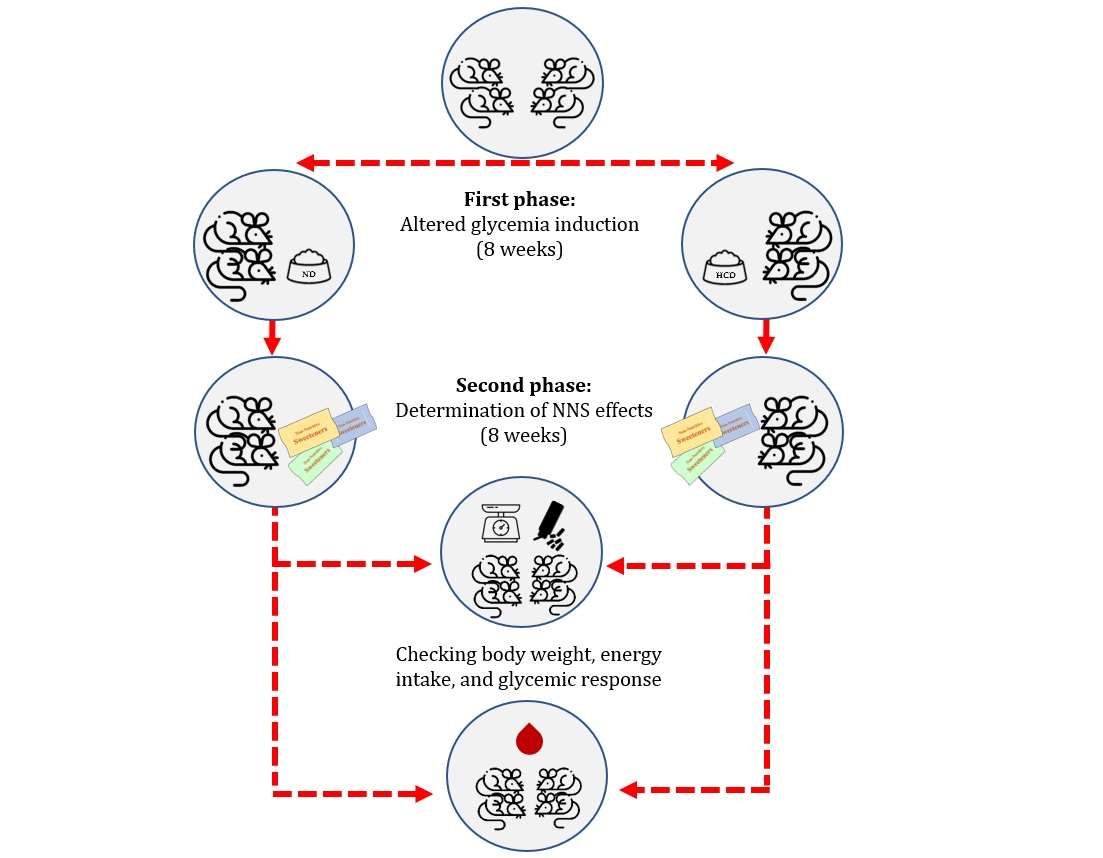
2.4. Study Design
2.4.1. Phase 1: Altered Glycemia Induction
2.4.2. Phase 2: Determination of NNS Effects
2.5. Measurements of Food Consumption, Total Energy Intake and Body Weight
2.6. Oral Starch Tolerance Test (OSTT)
2.7. Biochemical Measurements
2.8. Statistical Analysis
3. Results
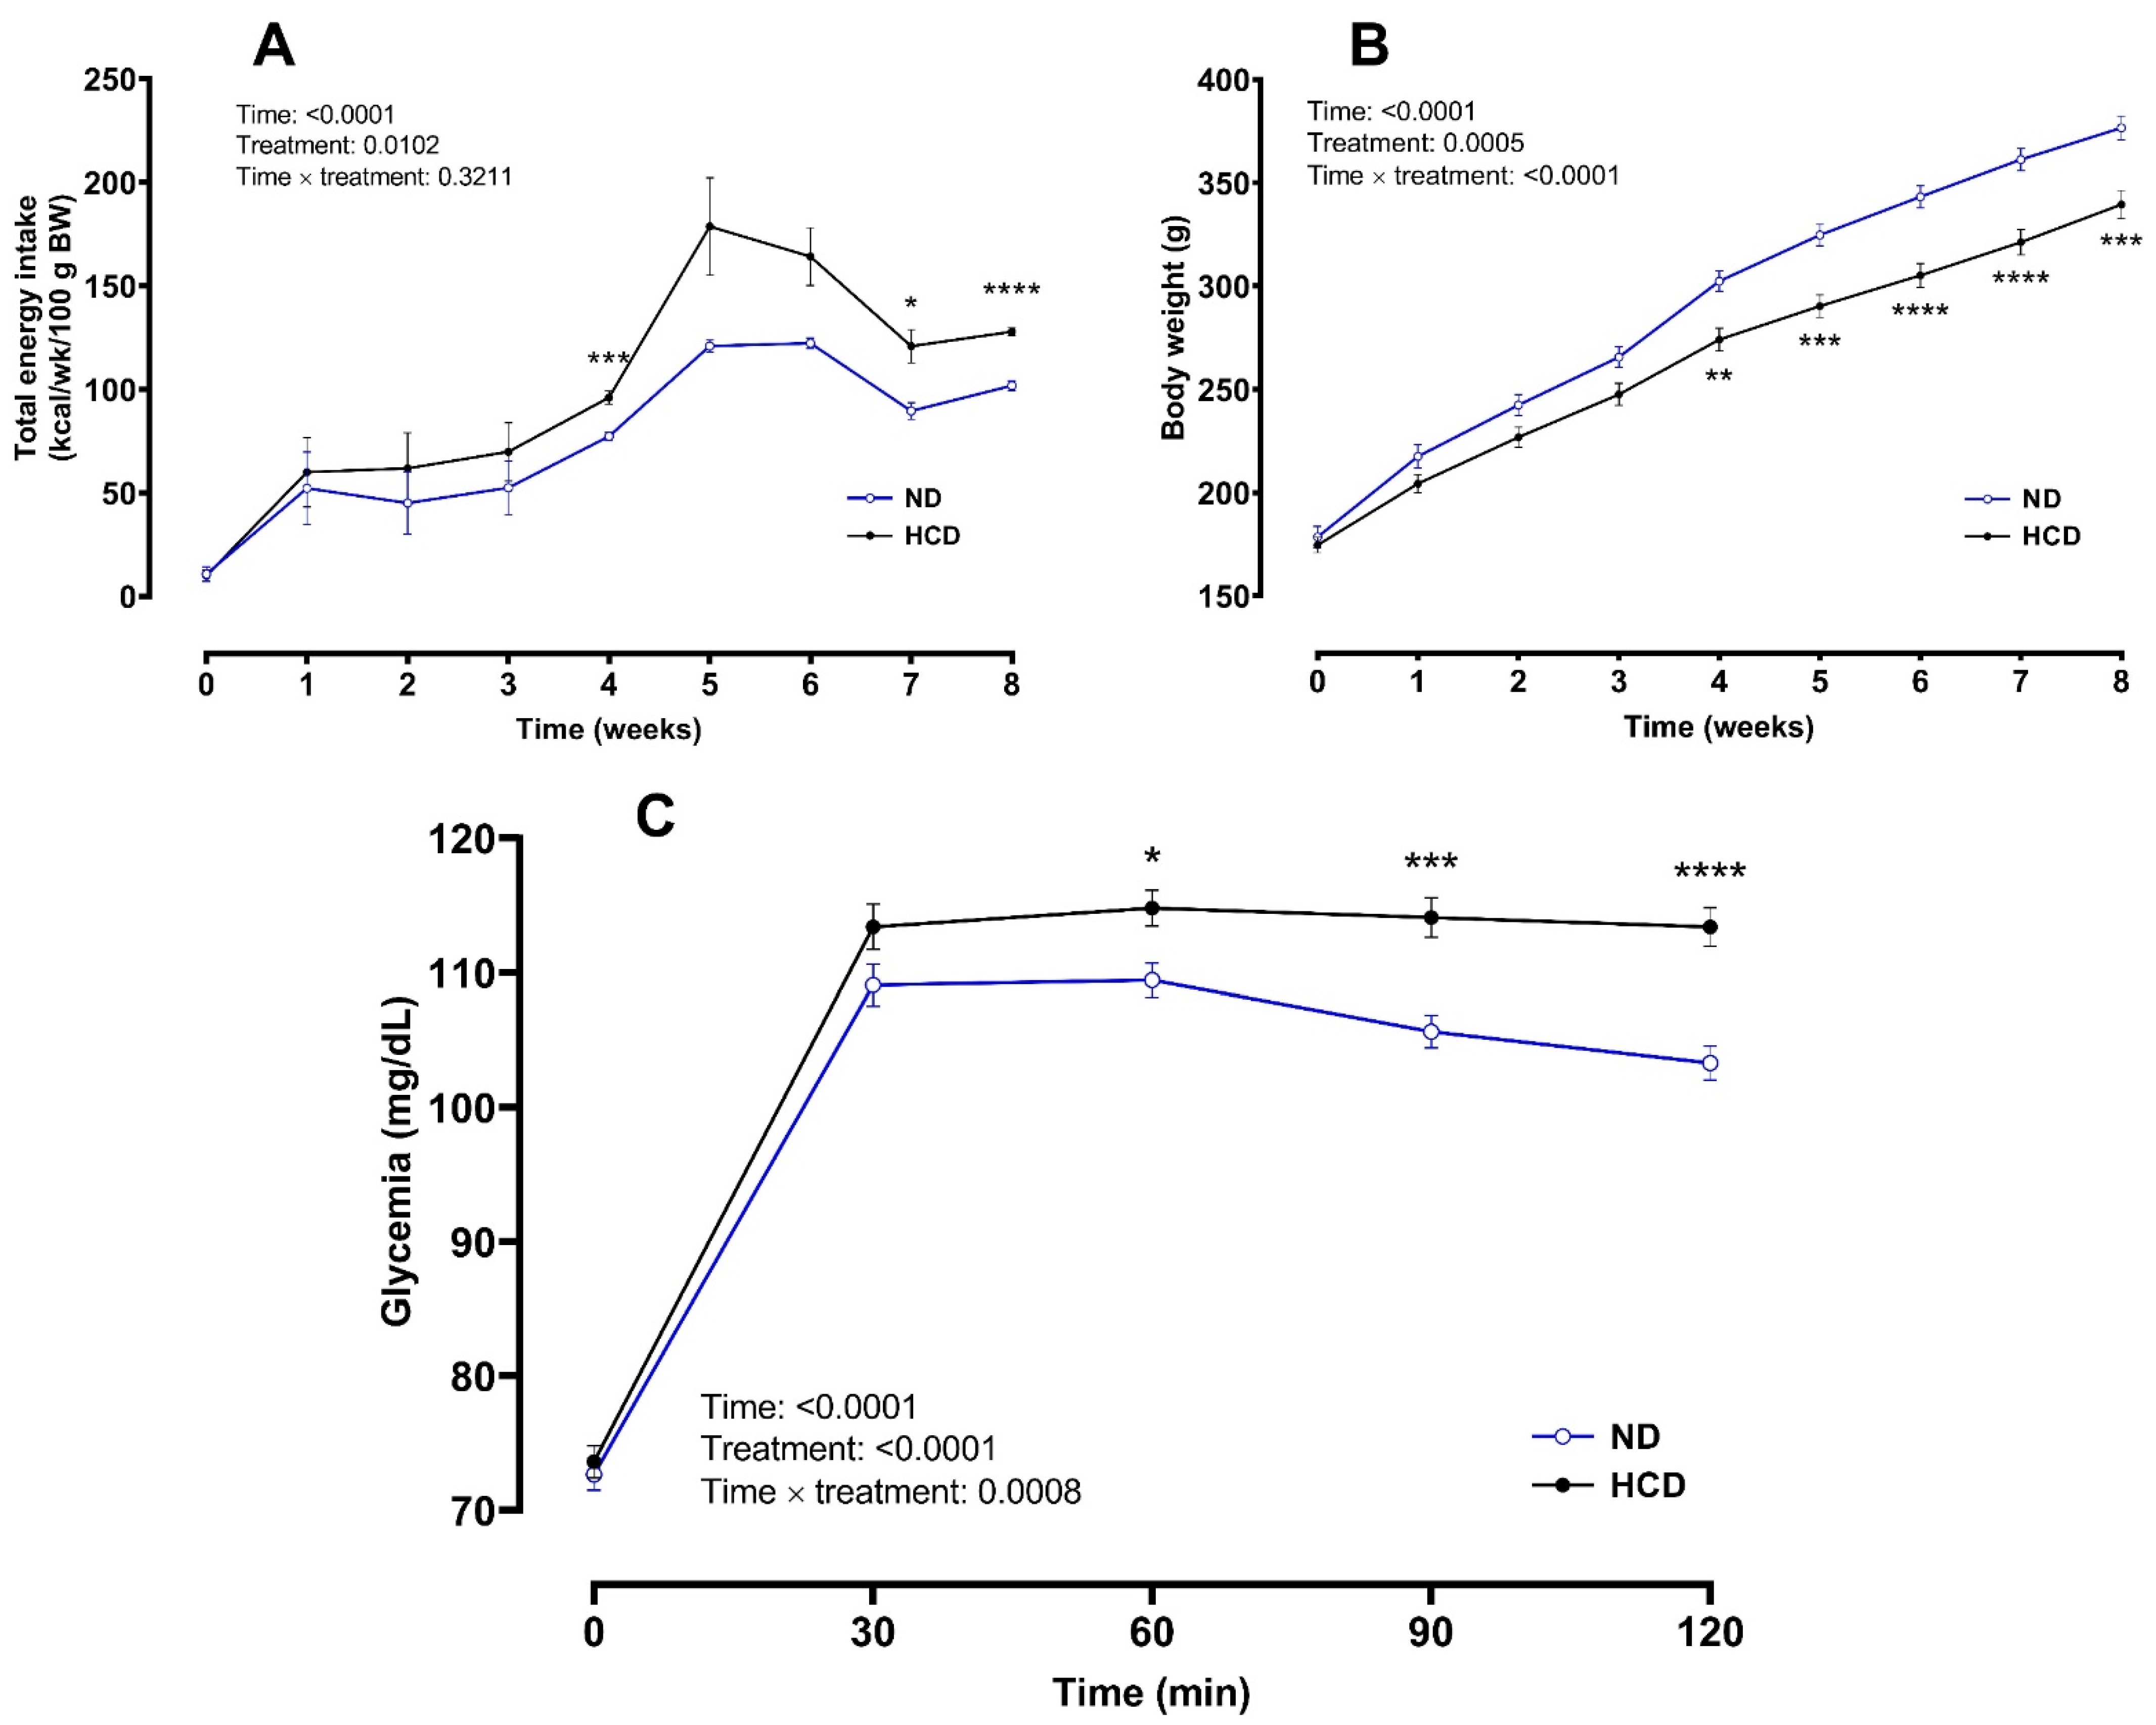
3.1. Phase 1: Altered Glycemic Response Induction
3.2. Phase 2: Effects of NNS
3.2.1. Effects of NNS on Energy Intake and Body Weight
3.2.2. Effects of NNS on Glycemic Response
3.2.3. Effects of NNS on Fasting Biochemical Parameters
4. Discussion
5. Conclusions
Supplementary Materials
Author Contributions
Funding
Institutional Review Board Statement
Data Availability Statement
Conflicts of Interest
References
- Lazzarino, G.P.; Acutain, M.F.; Canesini, G.; Andreoli, M.F.; Ramos, J.G. Cafeteria diet induces progressive changes in hypothalamic mechanisms involved in food intake control at different feeding periods in female rats. Mol. Cell. Endocrinol. 2019, 498, 110542. [Google Scholar] [CrossRef] [PubMed]
- Das, A.; Chakraborty, R. An introduction to sweeteners. In Sweeteners: Pharmacology, Biotechnology, and Applications; Mérillon, J.-M., Ramawat, K.G., Eds.; Springer International Publishing: Cham, Switzerland, 2018; pp. 1–13. [Google Scholar]
- Dunford, E.; Taillie, L.; Miles, D.; Eyles, H.; Tolentino-Mayo, L.; Ng, S. Non-nutritive sweeteners in the packaged food supply—an assessment across 4 countries. Nutrients 2018, 10, 257. [Google Scholar] [CrossRef] [Green Version]
- Martyn, D.; Darch, M.; Roberts, A.; Lee, H.Y.; Yaqiong Tian, T.; Kaburagi, N.; Belmar, P. Low-/no-calorie sweeteners: A review of global intakes. Nutrients 2018, 10, 357. [Google Scholar] [CrossRef] [Green Version]
- Romo-Romo, A.; Aguilar-Salinas, C.A.; Gómez-Díaz, R.; Brito-Córdova, G.X.; Gómez-Velasco, D.V.; López-Rocha, M.J.; Almeda-Valdes, P. Non-nutritive sweeteners: Evidence on their association with metabolic diseases and potential effects on glucose metabolism and appetite. Rev. Investig. Clin. 2017, 69, 129–138. [Google Scholar] [CrossRef]
- Laviada, H.; Molina Segui, F. Posición de la Sociedad Mexicana de Nutrición y Endocrinología sobre los edulcorantes no calóricos. Rev. Mex. Endocrinol. Metab. Nutr. 2017, 4, 24–41. [Google Scholar]
- Pearlman, M.; Obert, J.; Casey, L. The association between artificial sweeteners and obesity. Curr. Gastroenterol. Rep. 2017, 19, 64. [Google Scholar] [CrossRef] [PubMed]
- Olivier-Van Stichelen, S.; Rother, K.I.; Hanover, J.A. Maternal exposure to non-nutritive sweeteners impacts progeny’s metabolism and microbiome. Front. Microbiol. 2019, 10. [Google Scholar] [CrossRef] [Green Version]
- Pepino, M.Y.; Bourne, C. Non-nutritive sweeteners, energy balance, and glucose homeostasis. Curr. Opin. Clin. Nutr. Metab. Care 2011, 14, 391–395. [Google Scholar] [CrossRef] [PubMed]
- Fantino, M.; Fantino, A.; Matray, M.; Mistretta, F. Beverages containing low energy sweeteners do not differ from water in their effects on appetite, energy intake and food choices in healthy, non-obese French adults. Appetite 2018, 125, 557–565. [Google Scholar] [CrossRef]
- Ford, H.E.; Peters, V.; Martin, N.M.; Sleeth, M.L.; Ghatei, M.A.; Frost, G.S.; Bloom, S.R. Effects of oral ingestion of sucralose on gut hormone response and appetite in healthy normal-weight subjects. Eur. J. Clin. Nutr. 2011, 65, 508. [Google Scholar] [CrossRef] [PubMed] [Green Version]
- Pinto, D.E.; Foletto, K.C.; Nunes, R.B.; Lago, P.D.; Bertoluci, M.C. Long-term intake of saccharin decreases post-absortive energy expenditure at rest and is associated to greater weight gain relative to sucrose in wistar rats. Nutr. Metab. 2017, 14, 18. [Google Scholar] [CrossRef] [Green Version]
- Pepino, M.Y.; Tiemann, C.D.; Patterson, B.W.; Wice, B.M.; Klein, S. Sucralose affects glycemic and hormonal responses to an oral glucose load. Diabetes Care 2013, 36, 2530–2535. [Google Scholar] [CrossRef] [PubMed] [Green Version]
- Suez, J.; Korem, T.; Zeevi, D.; Zilberman-Schapira, G.; Thaiss, C.A.; Maza, O.; Israeli, D.; Zmora, N.; Gilad, S.; Weinberger, A.; et al. Artificial sweeteners induce glucose intolerance by altering the gut microbiota. Nature 2014, 514, 181–186. [Google Scholar] [CrossRef]
- Romo-Romo, A.; Aguilar-Salinas, C.A.; Brito-Córdova, G.X.; Gómez-Díaz, R.A.; Almeda-Valdes, P. Sucralose decreases insulin sensitivity in healthy subjects: A randomized controlled trial. Am. J. Clin. Nutr. 2018, 108, 485–491. [Google Scholar] [CrossRef]
- Higgins, K.A.; Considine, R.V.; Mattes, R.D. Aspartame consumption for 12 weeks does not affect glycemia, appetite, or body weight of healthy, lean adults in a randomized controlled trial. J. Nutr. 2018, 148, 650–657. [Google Scholar] [CrossRef] [PubMed] [Green Version]
- Bonnet, F.; Tavenard, A.; Esvan, M.; Laviolle, B.; Viltard, M.; Lepicard, E.M.; Lainé, F. Consumption of a carbonated beverage with high-intensity sweeteners has no effect on insulin sensitivity and secretion in nondiabetic adults. J. Nutr. 2018, 148, 1293–1299. [Google Scholar] [CrossRef] [PubMed]
- Andrejić, B.M.; Mijatović, V.M.; Samojlik, I.N.; Horvat, O.J.; Ćalasan, J.D.; Đolai, M.A. The influence of chronic intake of saccharin on rat hepatic and pancreatic function and morphology: Gender differences. Bosn. J. Basic Med. Sci. 2013, 13, 94–99. [Google Scholar] [CrossRef] [PubMed]
- Lobach, A.R.; Roberts, A.; Rowland, I.R. Assessing the in vivo data on low/no-calorie sweeteners and the gut microbiota. Food. Chem. Toxicol. 2019, 124, 385–399. [Google Scholar] [CrossRef]
- Mattes, R.D.; Popkin, B.M. Nonnutritive sweetener consumption in humans: Effects on appetite and food intake and their putative mechanisms. Am. J. Clin. Nutr. 2009, 89, 1–14. [Google Scholar] [CrossRef] [PubMed] [Green Version]
- FDA. Additional Information about High-Intensity Sweeteners Permitted for Use in Food in the United States. Available online: https://www.fda.gov/food/food-additives-petitions/additional-information-about-high-intensity-sweeteners-permitted-use-food-united-states (accessed on 22 September 2019).
- Sengupta, P. The laboratory rat: Relating its Age with human’s. Int. J. Prev. Med. 2013, 4, 624–630. [Google Scholar]
- Wolever, T.M.S.; Vuksan, V.; Palmason, C. Less variation of postprandial blood glucose after starchy test meals than oral glucose. Nutr. Res. 1996, 16, 899–905. [Google Scholar] [CrossRef]
- Ble-Castillo, J.L.; Aparicio-Trapala, M.A.; Juárez-Rojop, I.E.; Torres-Lopez, J.E.; Mendez, J.D.; Aguilar-Mariscal, H.; Olvera-Hernández, V.; Palma-Cordova, L.C.; Diaz-Zagoya, J.C. Differential effects of high-carbohydrate and high-fat diet composition on metabolic control and insulin resistance in normal rats. Int. J. Environ. Res. Public Health 2012, 9, 1663–1676. [Google Scholar] [CrossRef] [Green Version]
- Mooradian, A.D.; Smith, M.; Tokuda, M. The role of artificial and natural sweeteners in reducing the consumption of table sugar: A narrative review. Clin. Nutr. ESPEN 2017, 18, 1–8. [Google Scholar] [CrossRef] [PubMed]
- Rosales-Gomez, C.A.; Martinez-Carrillo, B.E.; Resendiz-Albor, A.A.; Ramirez-Duran, N.; Valdes-Ramos, R.; Mondragon-Velasquez, T.; Escoto-Herrera, J.A. Chronic consumption of sweeteners and its effect on glycaemia, cytokines, hormones, and lymphocytes of GALT in CD1 mice. BioMed Res. Int. 2018, 2018, 1345282. [Google Scholar] [CrossRef] [PubMed]
- Barrios-Correa, A.A.; Estrada, J.A.; Martel, C.; Olivier, M.; Lopez-Santiago, R.; Contreras, I. Chronic intake of commercial sweeteners induces changes in feeding behavior and signaling pathways related to the control of appetite in BALB/c mice. BioMed Res. Int. 2018, 2018, 3628121. [Google Scholar] [CrossRef] [Green Version]
- Matthews, D.R.; Hosker, J.P.; Rudenski, A.S.; Naylor, B.A.; Treacher, D.F.; Turner, R.C. Homeostasis model assessment: Insulin resistance and β-cell function from fasting plasma glucose and insulin concentrations in man. Diabetologia 1985, 28, 412–419. [Google Scholar] [CrossRef] [PubMed] [Green Version]
- la Fleur, S.E.; Luijendijk, M.C.M.; van Rozen, A.J.; Kalsbeek, A.; Adan, R.A.H. A free-choice high-fat high-sugar diet induces glucose intolerance and insulin unresponsiveness to a glucose load not explained by obesity. Int. J. Obes. 2010, 35, 595–604. [Google Scholar] [CrossRef] [PubMed] [Green Version]
- Pagliassotti, M.J.; Prach, P.A.; Koppenhafer, T.A.; Pan, D.A. Changes in insulin action, triglycerides, and lipid composition during sucrose feeding in rats. Am. J. Physiol. 1996, 271, R1319–R1326. [Google Scholar] [CrossRef]
- Ceolín, P.; Franca, S.A.D.; Froelich, M.; Santos, M.P.D.; Pereira, M.P.; Queiroz, T.S.; Silva, F.H.S.D.; Lisboa, P.C.; Andrade, C.M.B.; Baviera, A.M.; et al. A low-protein, high carbohydrate diet induces increase in serum adiponectin and preserves glucose homeostasis in rats. An. Acad. Bras. Cienc. 2019, 91, e20180452. [Google Scholar] [CrossRef]
- Gatineau, E.; Savary-Auzeloux, I.; Migné, C.; Polakof, S.; Dardevet, D.; Mosoni, L. Chronic intake of sucrose accelerates sarcopenia in older male rats through alterations in insulin sensitivity and muscle protein synthesis. J. Nutr. 2015, 145, 923–930. [Google Scholar] [CrossRef] [PubMed] [Green Version]
- Burgeiro, A.; Cerqueira, M.G.; Varela-Rodriguez, B.M.; Nunes, S.; Neto, P.; Pereira, F.C.; Reis, F.; Carvalho, E. Glucose and lipid dysmetabolism in a rat model of prediabetes induced by a high-sucrose diet. Nutrients 2017, 9, 638. [Google Scholar] [CrossRef]
- Gomez-Crisostomo, N.P.; De la Cruz-Hernandez, E.N.; Mendez Mendez, E.R.; Hernandez-Landero, M.F.; Camacho Lievano, J.U.; Martinez-Abundis, E. Differential effect of high-fat, high-sucrose and combined high-fat/high-sucrose diets consumption on fat accumulation, serum leptin and cardiac hypertrophy in rats. Arch. Physiol. Biochem. 2020, 126, 258–263. [Google Scholar] [CrossRef] [PubMed]
- Mazlan, N.; Horgan, G.; Stubbs, R.J. Energy density and weight of food effect short-term caloric compensation in men. Physiol. Behav. 2006, 87, 679–686. [Google Scholar] [CrossRef]
- Rowland, N.E.; Nasrallah, N.; Robertson, K.L. Accurate caloric compensation in rats for electively consumed ethanol–beer or ethanol–polycose mixtures. Pharmacol. Biochem. Behav. 2005, 80, 109–114. [Google Scholar] [CrossRef]
- Bissonnette, D.J.; List, S.; Knoblich, P.; Hadley, M. The effect of nonnutritive sweeteners added to a liquid diet on volume and caloric intake and weight gain in rats. Obesity 2017, 25, 1556–1563. [Google Scholar] [CrossRef] [Green Version]
- Feijó, F.d.M.; Ballard, C.R.; Foletto, K.C.; Batista, B.A.M.; Neves, A.M.; Ribeiro, M.F.M.; Bertoluci, M.C. Saccharin and aspartame, compared with sucrose, induce greater weight gain in adult Wistar rats, at similar total caloric intake levels. Appetite 2013, 60, 203–207. [Google Scholar] [CrossRef] [PubMed]
- Garcia-Vazquez, C.; Ble-Castillo, J.L.; Arias-Cordova, Y.; Cordova-Uscanga, R.; Tovilla-Zarate, C.A.; Juarez-Rojop, I.E.; Olvera-Hernandez, V.; Alvarez-Villagomez, C.S.; Nolasco-Coleman, A.M.; Diaz-Zagoya, J.C. Effects of Resistant Starch Ingestion on Postprandial Lipemia and Subjective Appetite in Overweight or Obese Subjects. Int. J. Environ. Res. Public Health 2019, 16, 3827. [Google Scholar] [CrossRef] [PubMed] [Green Version]
- Ble-Castillo, J.L.; Juárez-Rojop, I.E.; Tovilla-Zárate, C.A.; García-Vázquez, C.; Servin-Cruz, M.Z.; Rodríguez-Hernández, A.; Araiza-Saldaña, C.I.; Nolasco-Coleman, A.M.; Díaz-Zagoya, J.C. Acute consumption of resistant starch reduces food intake but has no effect on appetite ratings in healthy subjects. Nutrients 2017, 9, 696. [Google Scholar] [CrossRef] [Green Version]
- Glendinning, J.I.; Hart, S.; Lee, H.; Maleh, J.; Ortiz, G.; Ryu, Y.S.; Sanchez, A.; Shelling, S.; Williams, N. Low-calorie sweeteners cause only limited metabolic effects in mice. Am. J. Physiol. Regul. Integr. Comp. Physiol. 2020, 318, R70–R80. [Google Scholar] [CrossRef]


Publisher’s Note: MDPI stays neutral with regard to jurisdictional claims in published maps and institutional affiliations. |
© 2021 by the authors. Licensee MDPI, Basel, Switzerland. This article is an open access article distributed under the terms and conditions of the Creative Commons Attribution (CC BY) license (https://creativecommons.org/licenses/by/4.0/).
Share and Cite
Ramos-García, M.; Ble-Castillo, J.L.; García-Vázquez, C.; Tovilla-Zárate, C.A.; Juárez-Rojop, I.E.; Olvera-Hernández, V.; Genis-Mendoza, A.D.; Córdova-Uscanga, R.; Álvarez-González, C.A.; Díaz-Zagoya, J.C. Effects of Non-Nutritive Sweeteners on Energy Intake, Body Weight and Postprandial Glycemia in Healthy and with Altered Glycemic Response Rats. Foods 2021, 10, 958. https://0-doi-org.brum.beds.ac.uk/10.3390/foods10050958
Ramos-García M, Ble-Castillo JL, García-Vázquez C, Tovilla-Zárate CA, Juárez-Rojop IE, Olvera-Hernández V, Genis-Mendoza AD, Córdova-Uscanga R, Álvarez-González CA, Díaz-Zagoya JC. Effects of Non-Nutritive Sweeteners on Energy Intake, Body Weight and Postprandial Glycemia in Healthy and with Altered Glycemic Response Rats. Foods. 2021; 10(5):958. https://0-doi-org.brum.beds.ac.uk/10.3390/foods10050958
Chicago/Turabian StyleRamos-García, Meztli, Jorge Luis Ble-Castillo, Carlos García-Vázquez, Carlos Alfonso Tovilla-Zárate, Isela Esther Juárez-Rojop, Viridiana Olvera-Hernández, Alma Delia Genis-Mendoza, Rubén Córdova-Uscanga, Carlos Alfonso Álvarez-González, and Juan Cuauhtémoc Díaz-Zagoya. 2021. "Effects of Non-Nutritive Sweeteners on Energy Intake, Body Weight and Postprandial Glycemia in Healthy and with Altered Glycemic Response Rats" Foods 10, no. 5: 958. https://0-doi-org.brum.beds.ac.uk/10.3390/foods10050958