
Molecular Evidence on the Inhibitory Potential of Metformin against Chlorpyrifos-Induced Neurotoxicity

 , and
, and
Abstract
:1. Introduction
2. Materials and Methods
2.1. Chemicals
2.2. Animals
2.3. Study Design
- Group 1 (Control corn oil): receiving oral gavage of corn oil;
- Group 2 (Control NS): receiving IP injection of NS;
- Group 3 (CPF): receiving oral gavage of 7.5 mg/kg (1/20 LD50) CPF;
- Group 4 (Met-30): receiving IP injection of 30 mg/kg/day metformin;
- Group 5 (Met-60): receiving IP injection of 60 mg/kg/day metformin;
- Group 6 (Met-120): receiving IP injection of 120 mg/kg/day metformin;
- Group 7 (CPF + Met-30): receiving oral gavage of 7.5 mg/kg CPF and IP injection of 30 mg/kg/day metformin;
- Group 8 (CPF + Met-60): receiving oral gavage of 7.5 mg/kg CPF and IP injection of 60 mg/kg/day metformin;
- Group 9 (CPF + Met-120): receiving oral gavage of 7.5 mg/kg CPF and IP injection of 120 mg/kg/day metformin.
2.4. Oxidative Stress Markers
2.4.1. Determination of ROS Level
2.4.2. Determination of MDA Level
2.5. Determination of SOD Activity
2.6. Determination of Inflammatory Cytokine Levels (TNFα and IL-1β)
2.7. Determination of AChE Inhibition
2.8. Gene Expression
2.9. Determination of ADP/ATP Ratio
2.10. Histopathological Studies
2.11. Statistical Analysis
3. Results
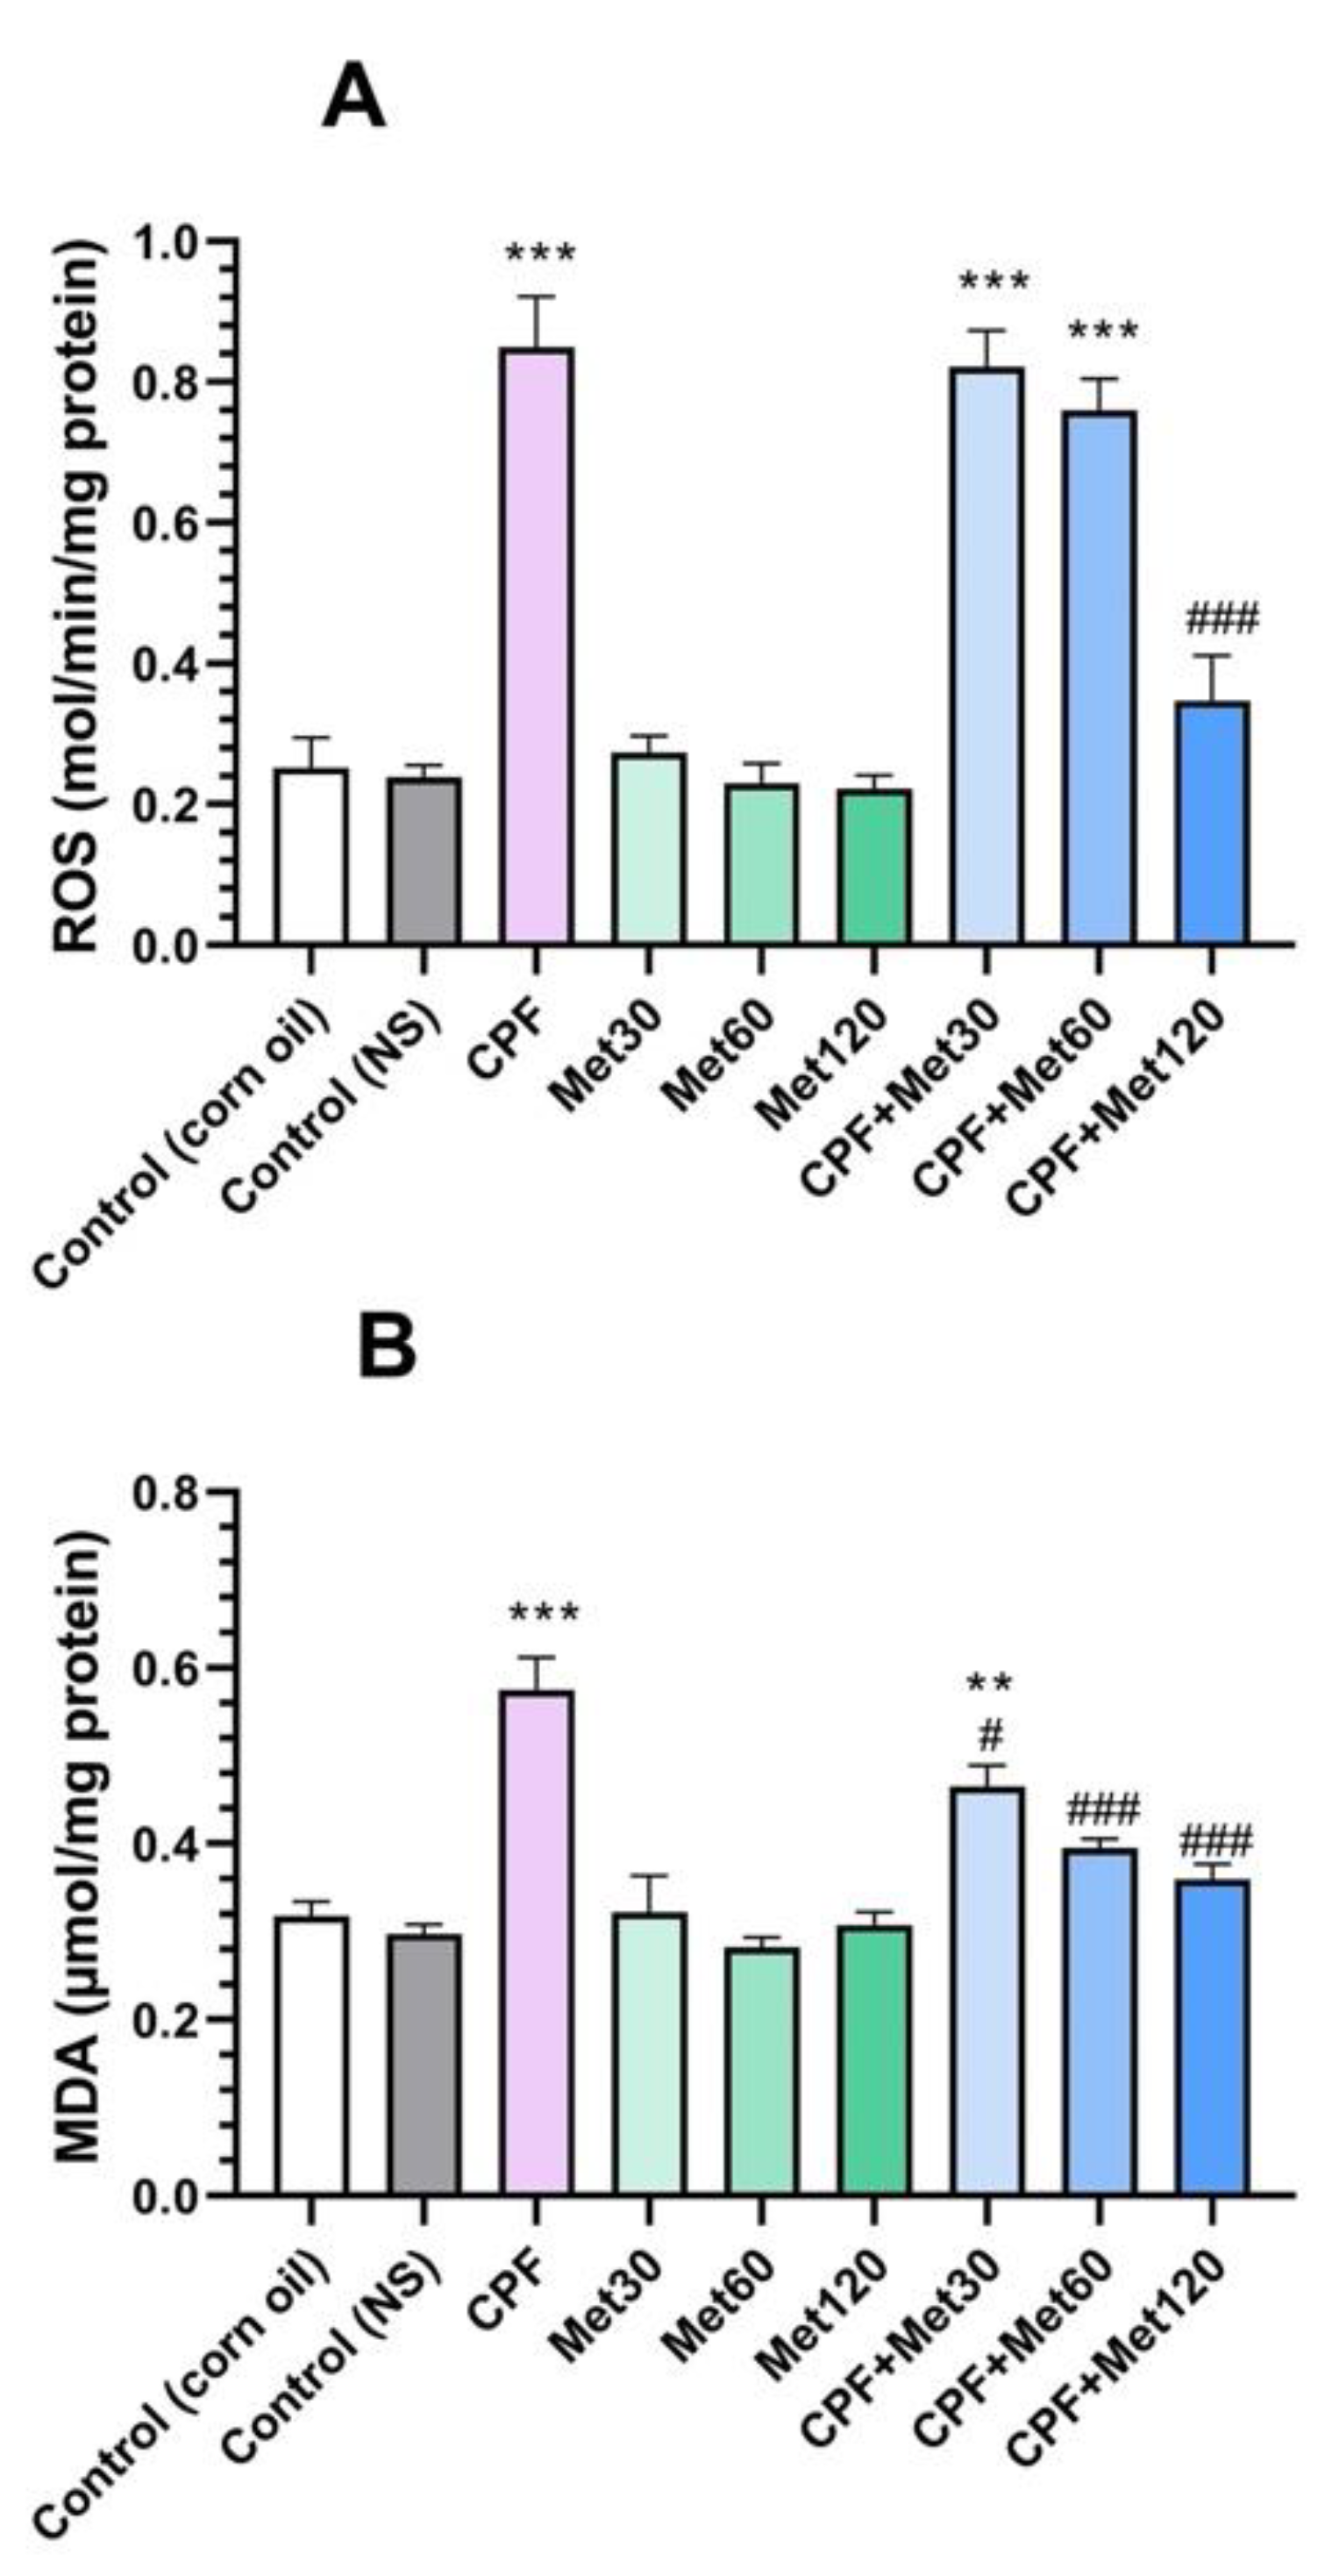
3.1. Oxidative Stress Biomarkers
3.1.1. ROS
3.1.2. MDA
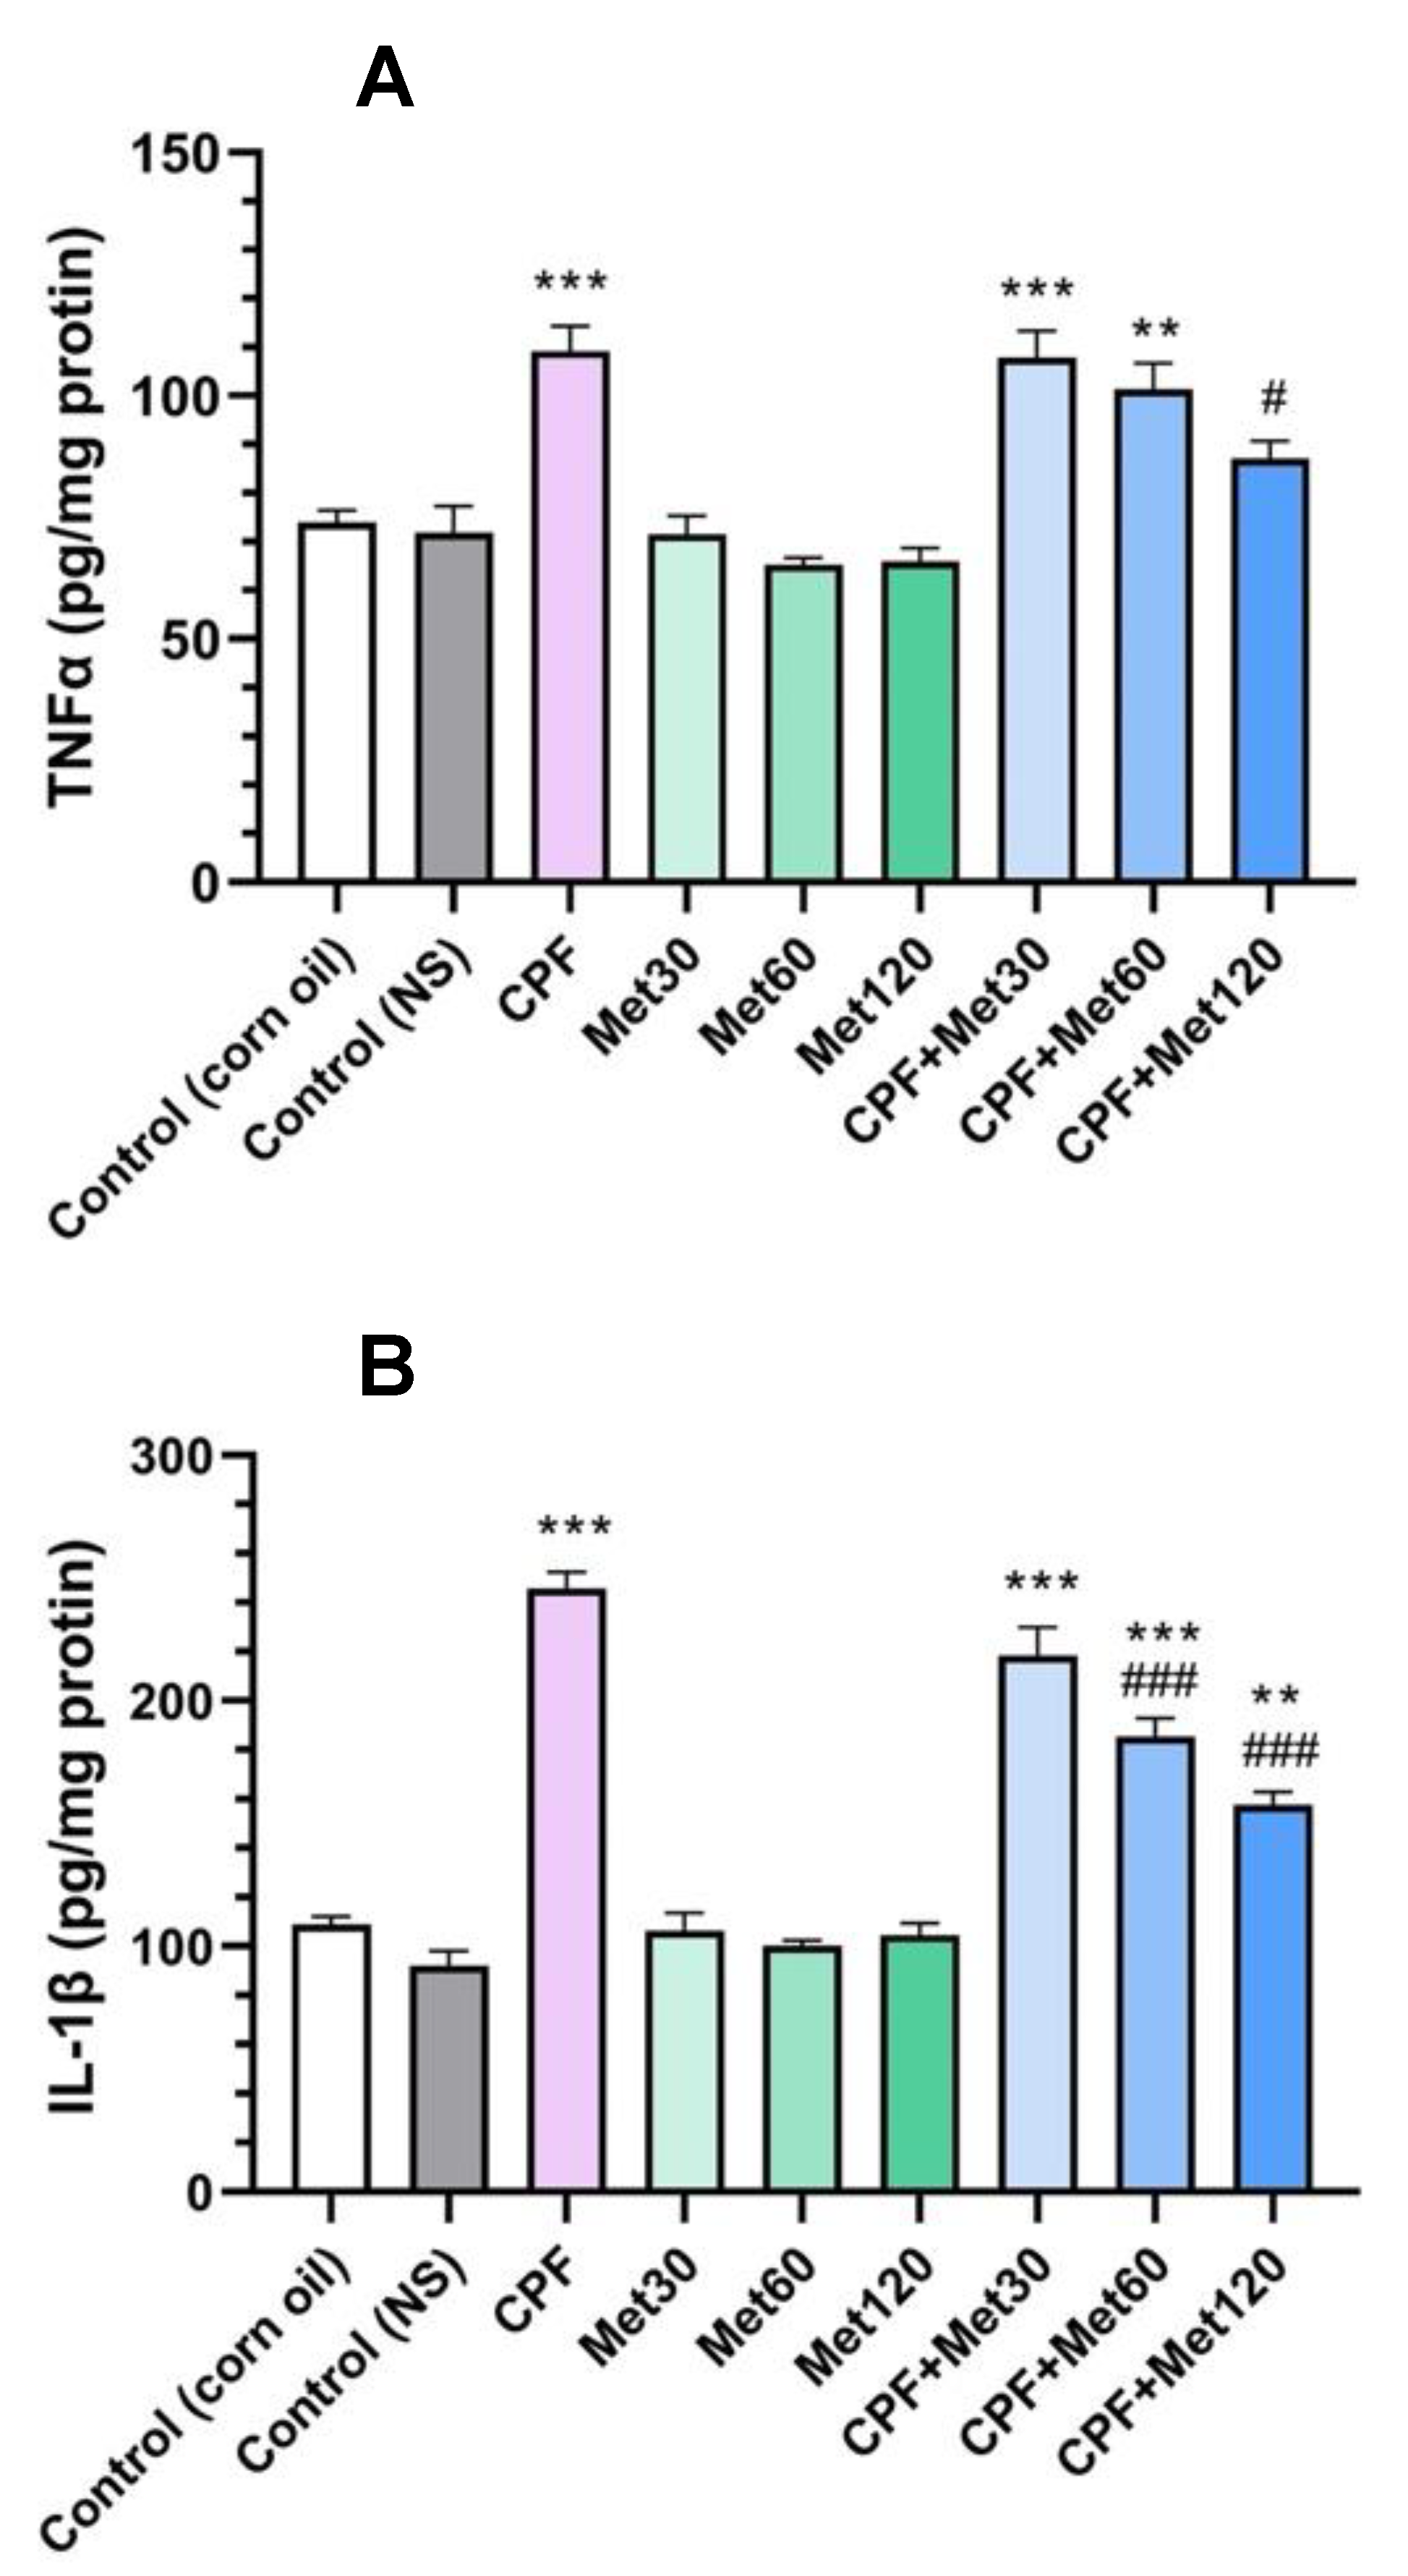
3.2. Inflammatory Cytokines
3.2.1. TNFα
3.2.2. IL-1β
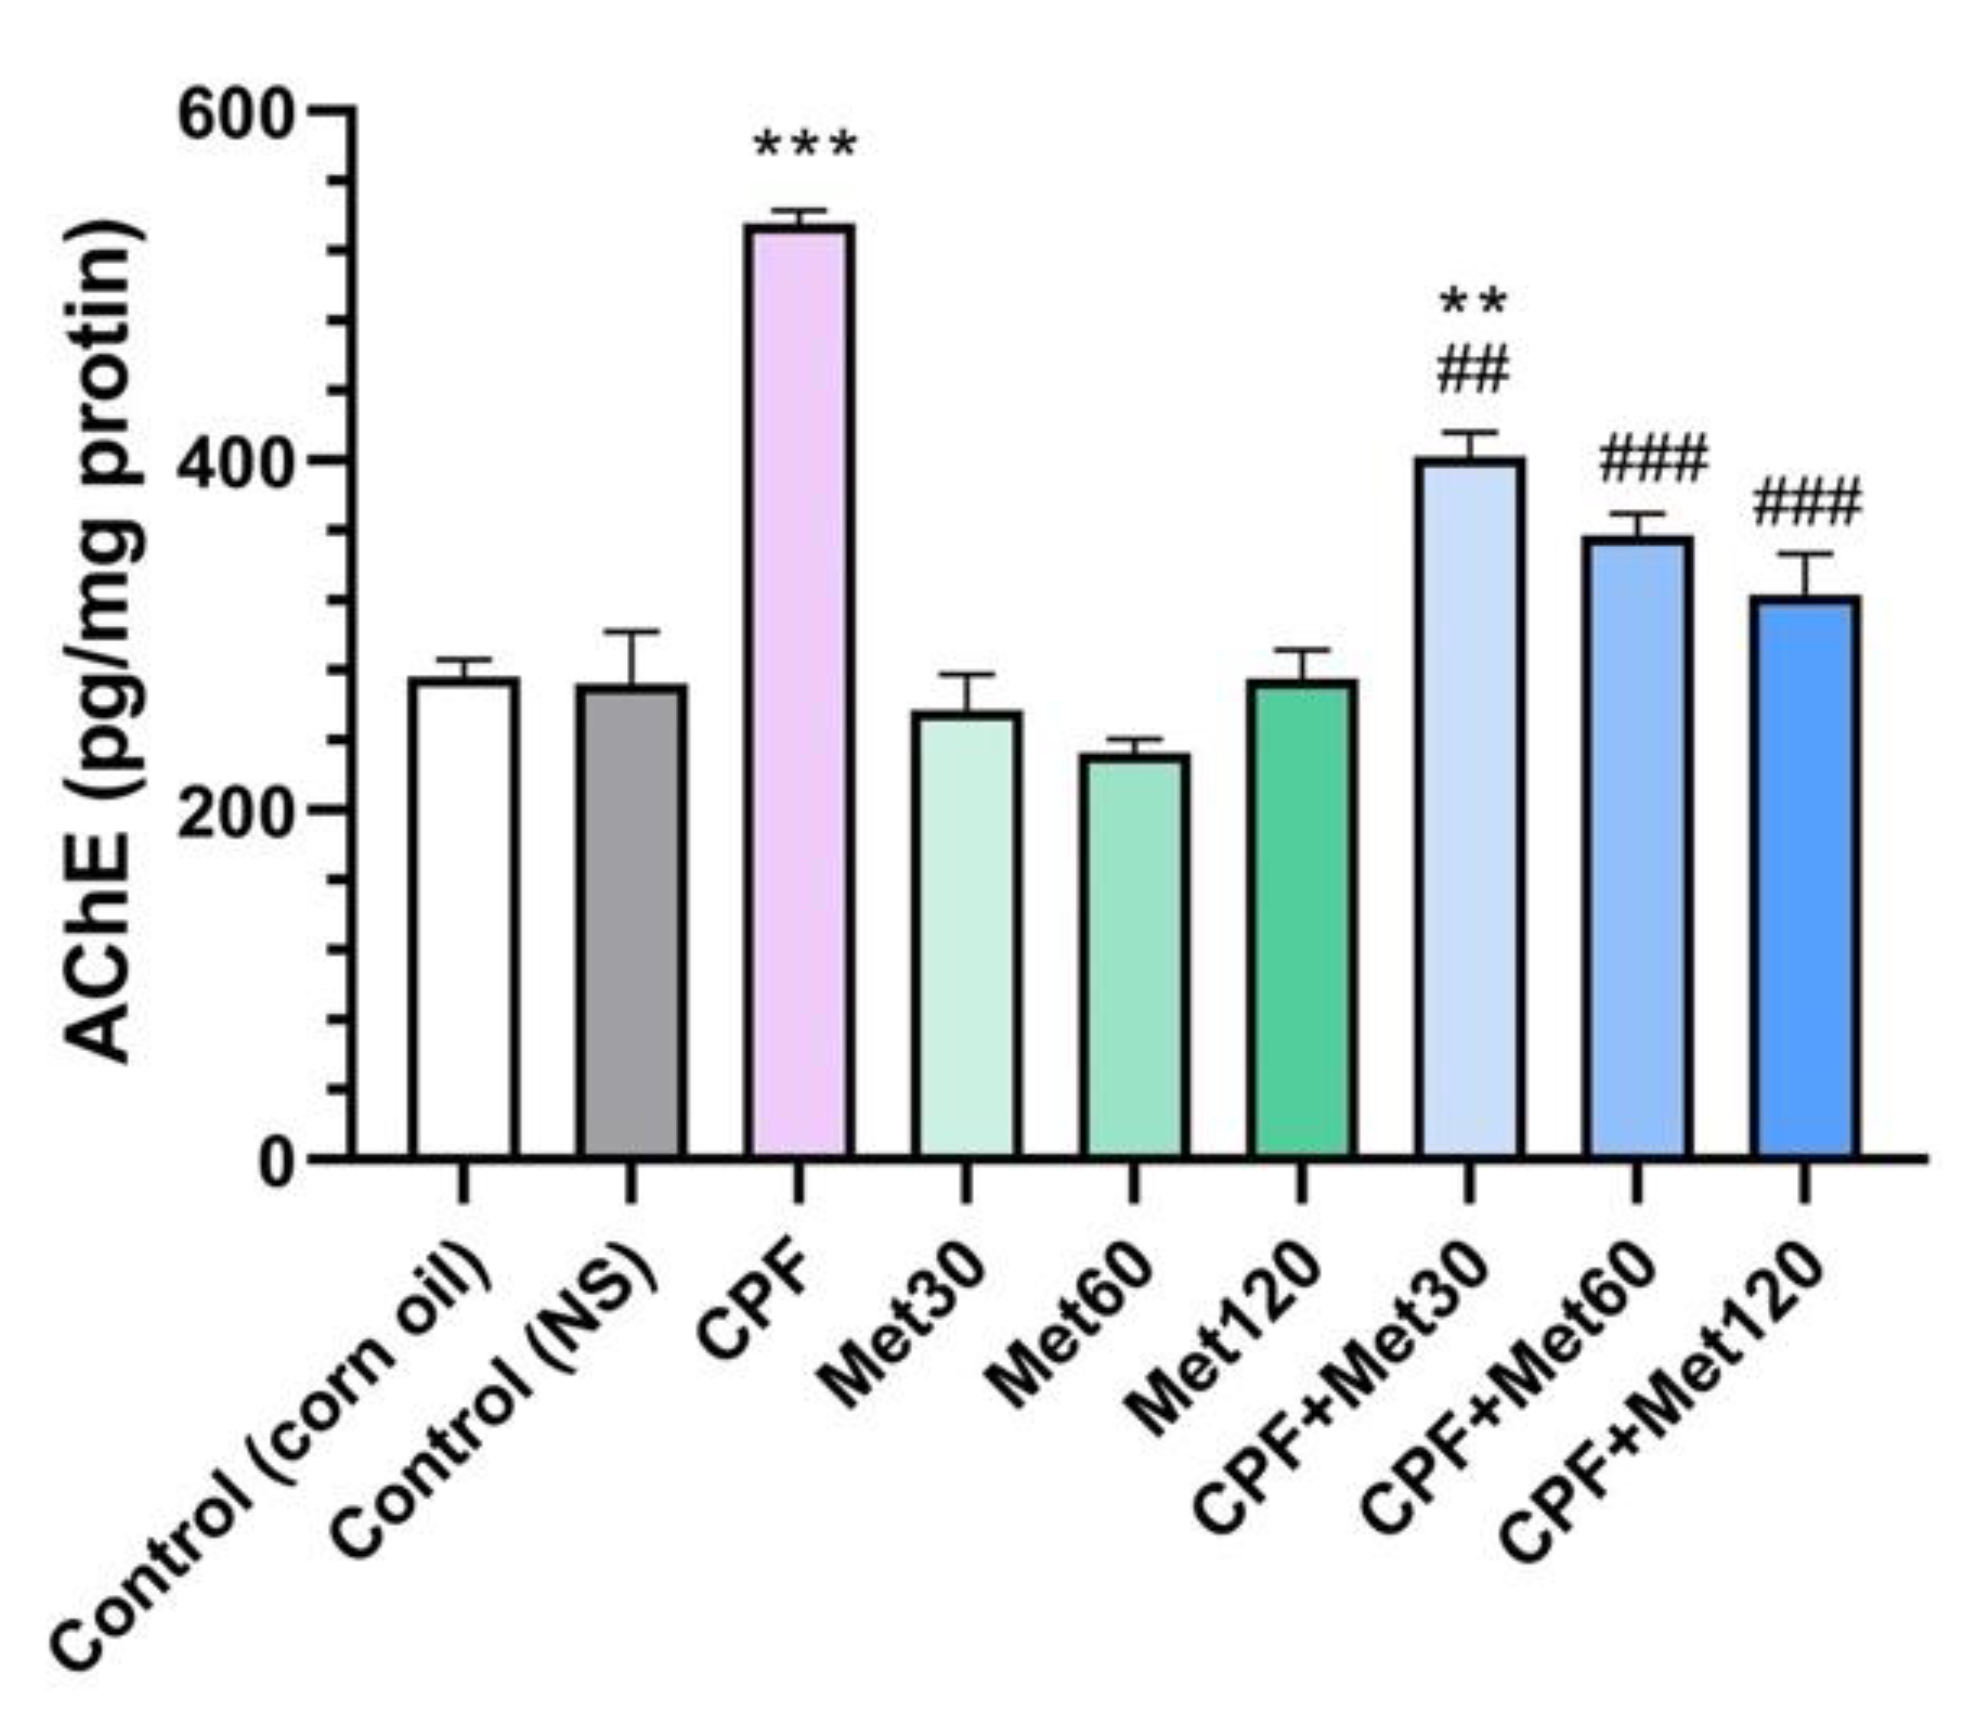
3.3. AChE Inhibition
3.4. SOD Activity
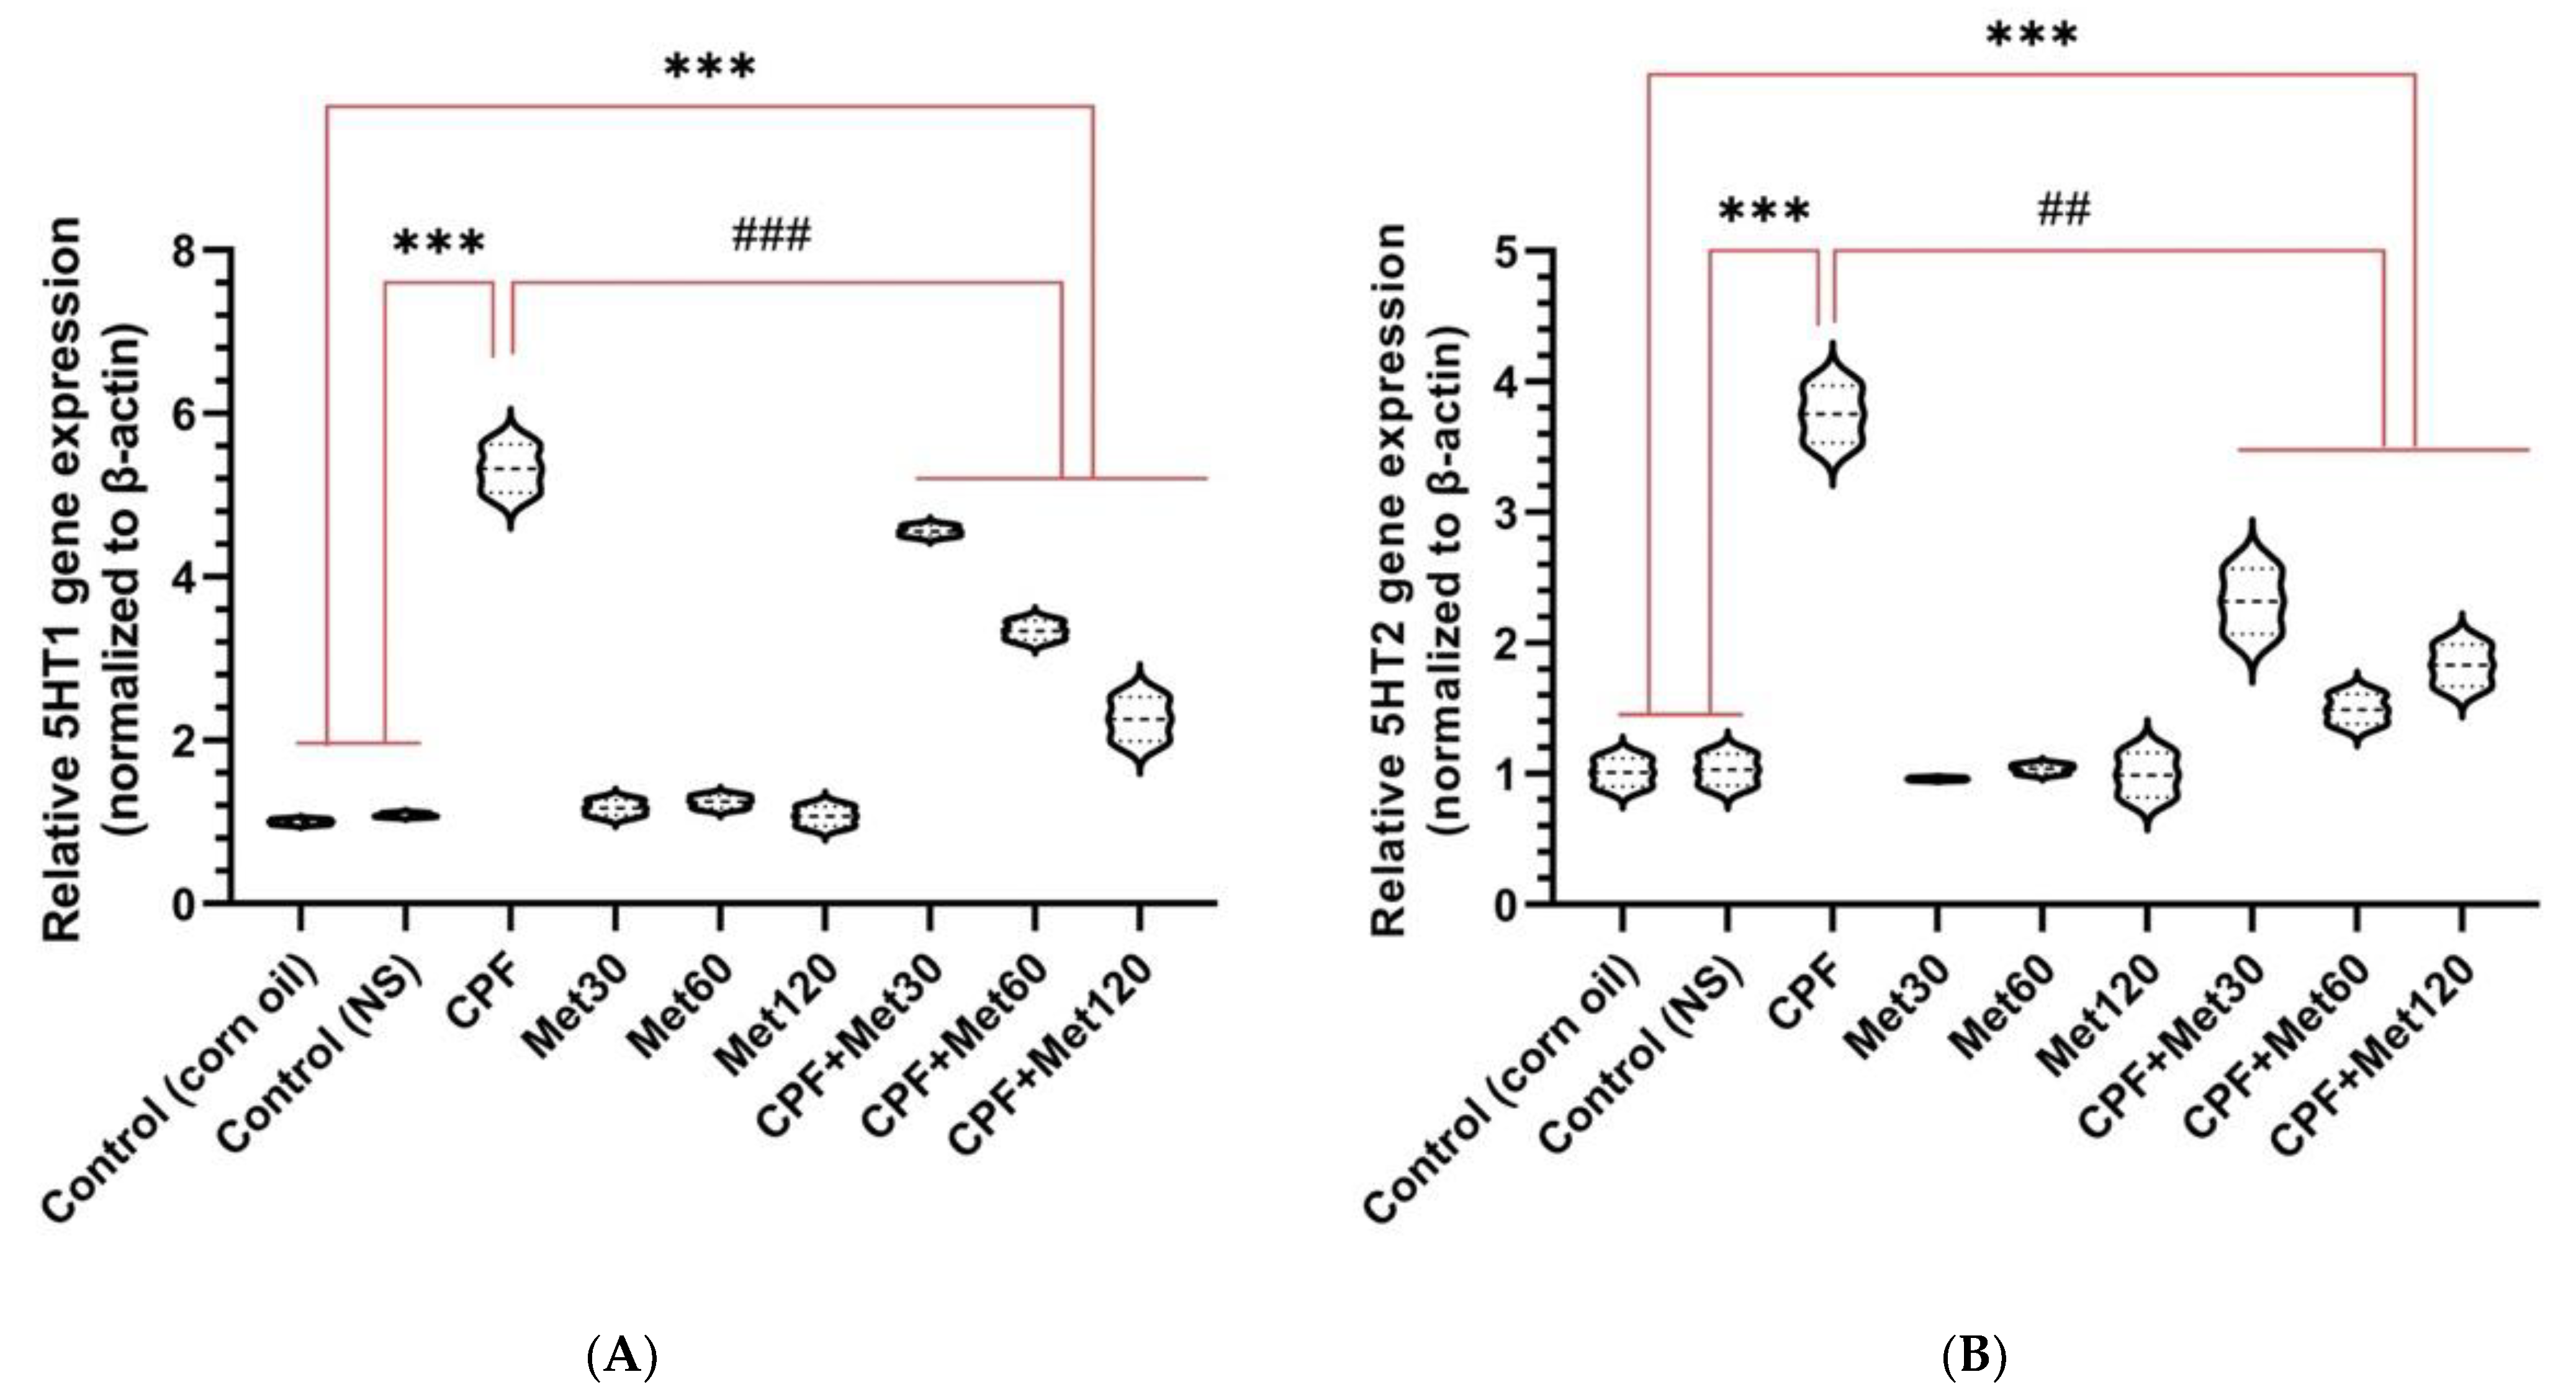
3.5. Serotonin Receptor Gene Expression
3.5.1. 5HT1
3.5.2. 5HT2
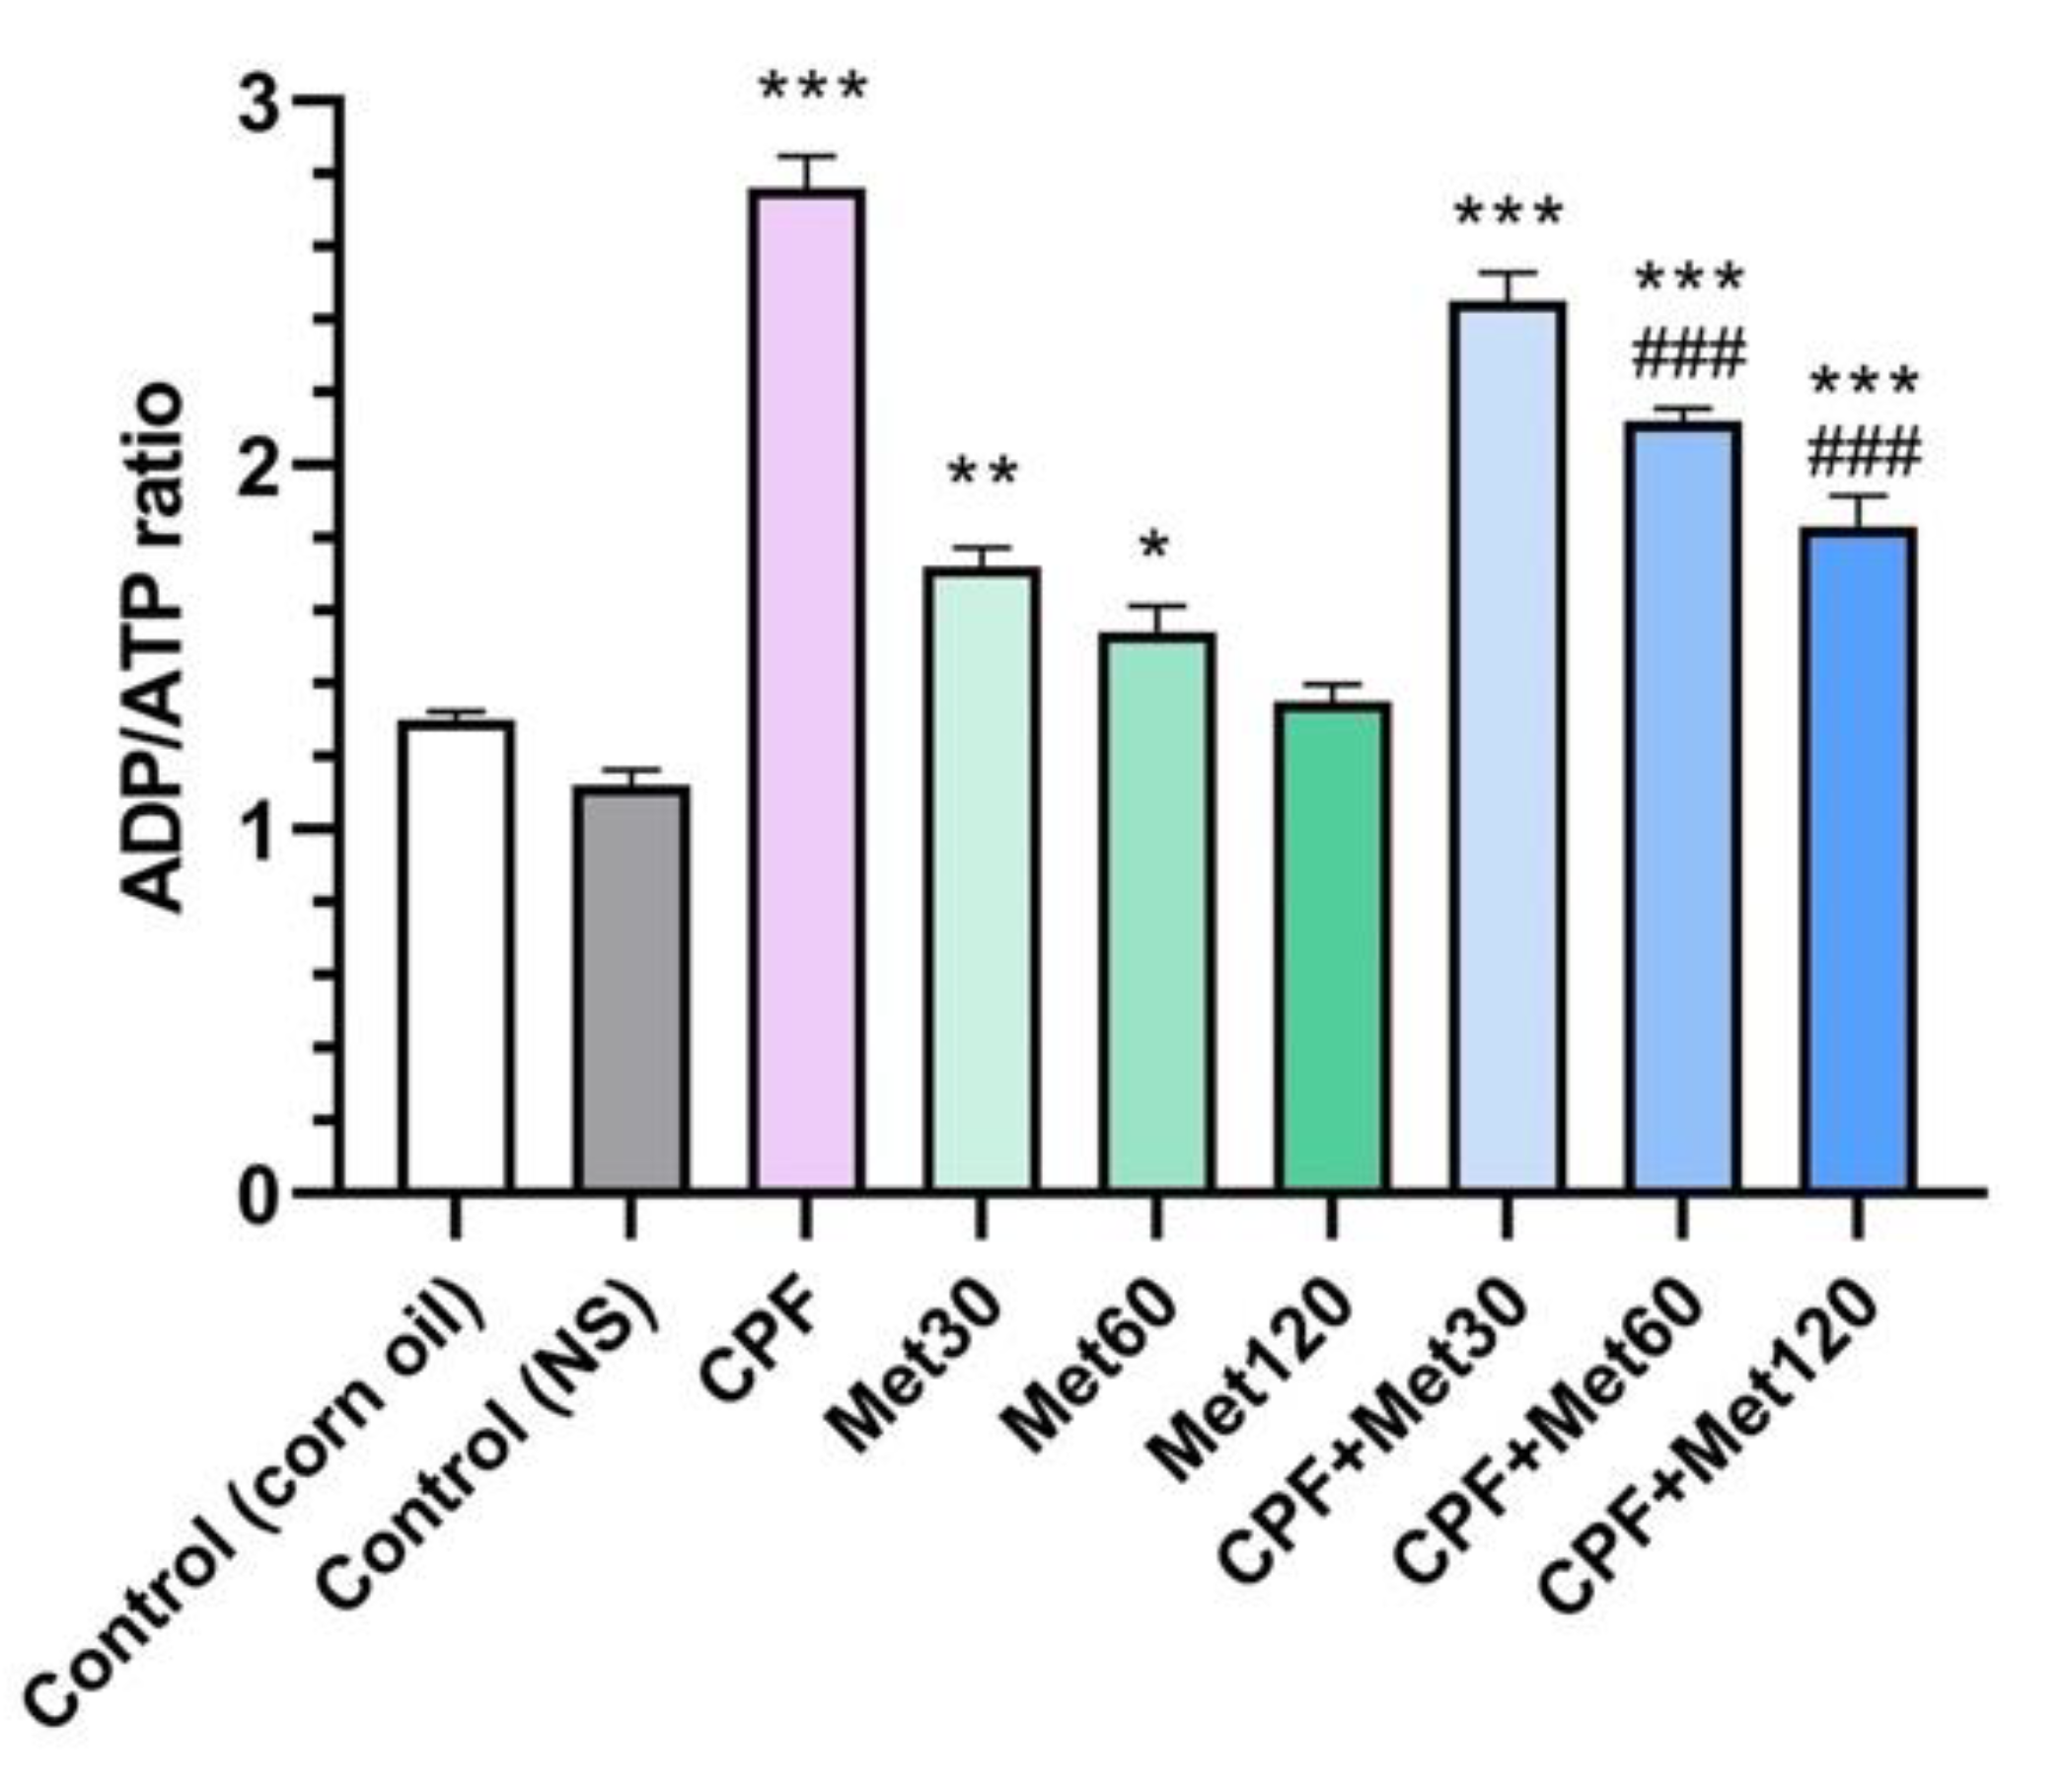
3.6. ADP/ATP Ratio
3.7. Histological Evaluation
4. Discussion
5. Conclusions
Author Contributions
Funding
Institutional Review Board Statement
Informed Consent Statement
Conflicts of Interest
References
- United States Environmental Protection Agency. EPA Proposes New Safety Measures for Chlorpyrifos; United States Environmental Protection Agency: Washington D.C., VA, USA, 2020. Available online: https://www.epa.gov/pesticides/epa-proposes-new-safety-measures-chlorpyrifos (accessed on 3 March 2022).
- Dutra Calda, E. CHLORPYRIFOS-METHYL (090). 2020. Available online: https://pubchem.ncbi.nlm.nih.gov/compound/Chlorpyrifos-methyl (accessed on 3 March 2022).
- Sharma, S.; Singh, P.; Chadha, P.; Saini, H.S. Toxicity Assessment of Chlorpyrifos on Different Organs of Rat: Exploitation of Microbial-Based Enzymatic System for Neutralization. Environ. Sci. Pollut. Res. 2019, 26, 29649–29659. [Google Scholar] [CrossRef] [PubMed]
- Qiao, D.; Seidler, F.J.; Padilla, S.; Slotkin, T.A. Developmental Neurotoxicity of Chlorpyrifos: What Is the Vulnerable Period? Environ. Health Perspect. 2002, 110, 1097–1103. [Google Scholar] [CrossRef] [PubMed] [Green Version]
- Burke, R.D.; Todd, S.W.; Lumsden, E.; Mullins, R.J.; Mamczarz, J.; Fawcett, W.P.; Gullapalli, R.P.; Randall, W.R.; Pereira, E.F.R.; Albuquerque, E.X. Developmental Neurotoxicity of the Organophosphorus Insecticide Chlorpyrifos: From Clinical Findings to Preclinical Models and Potential Mechanisms. J. Neurochem. 2017, 142 (Suppl. 2), 162–177. [Google Scholar] [CrossRef]
- Karmakar, S.; Lal, G. Role of Serotonin Receptor Signaling in Cancer Cells and Anti-Tumor Immunity. Theranostics 2021, 11, 5296–5312. [Google Scholar] [CrossRef] [PubMed]
- Aldridge, J.E.; Seidler, F.J.; Slotkin, T.A. Developmental Exposure to Chlorpyrifos Elicits Sex-Selective Alterations of Serotonergic Synaptic Function in Adulthood: Critical Periods and Regional Selectivity for Effects on the Serotonin Transporter, Receptor Subtypes, and Cell Signaling. Environ. Health Perspect. 2004, 112, 148–155. [Google Scholar] [CrossRef] [Green Version]
- Thomas, M. Weekly Dose: Metformin, the Diabetes Drug Developed from French Lilac. Conversation. 2016. Available online: https://theconversation.com/weekly-dose-metformin-the-diabetes-drug-developed-from-french-lilac-64430 (accessed on 3 March 2022).
- Bailey, C.; Day, C. Metformin: Its Botanical Background. Pract. Diab. Int. 2004, 21, 115–117. [Google Scholar] [CrossRef]
- Bailey, C.J. Metformin: Historical Overview. Diabetologia 2017, 60, 1566–1576. [Google Scholar] [CrossRef] [Green Version]
- Rena, G.; Hardie, D.G.; Pearson, E.R. The Mechanisms of Action of Metformin. Diabetologia 2017, 60, 1577–1585. [Google Scholar] [CrossRef] [Green Version]
- Ismail Hassan, F.; Didari, T.; Khan, F.; Niaz, K.; Mojtahedzadeh, M.; Abdollahi, M. A Review on The Protective Effects of Metformin in Sepsis-Induced Organ Failure. Cell J. 2019, 21, 363–370. [Google Scholar] [CrossRef]
- Ismail Hassan, F.; Didari, T.; Baeeri, M.; Gholami, M.; Haghi-Aminjan, H.; Khalid, M.; Navaei-Nigjeh, M.; Rahimifard, M.; Solgi, S.; Abdollahi, M.; et al. Metformin Attenuates Brain Injury by Inhibiting Inflammation and Regulating Tight Junction Proteins in Septic Rats. Cell J. 2020, 22, 29–37. [Google Scholar] [CrossRef]
- Didari, T.; Hassani, S.; Baeeri, M.; Navaei-Nigjeh, M.; Rahimifard, M.; Haghi-Aminjan, H.; Gholami, M.; Nejad, S.M.; Hassan, F.I.; Mojtahedzadeh, M.; et al. Short-Term Effects of Metformin on Cardiac and Peripheral Blood Cells Following Cecal Ligation and Puncture-Induced Sepsis. Drug Res. 2021, 71, 257–264. [Google Scholar] [CrossRef] [PubMed]
- Bharath, L.P.; Nikolajczyk, B.S. The Intersection of Metformin and Inflammation. Am. J. Physiol.-Cell Physiol. 2021, 320, C873–C879. [Google Scholar] [CrossRef] [PubMed]
- Bai, B.; Chen, H. Metformin: A Novel Weapon Against Inflammation. Front. Pharmacol. 2021, 12, 622262. [Google Scholar] [CrossRef]
- Tao, L.; Li, D.; Liu, H.; Jiang, F.; Xu, Y.; Cao, Y.; Gao, R.; Chen, G. Neuroprotective Effects of Metformin on Traumatic Brain Injury in Rats Associated with NF-ΚB and MAPK Signaling Pathway. Brain Res. Bull. 2018, 140, 154–161. [Google Scholar] [CrossRef]
- Selvin, E.; Hirsch, A.T. Contemporary Risk Factor Control and Walking Dysfunction in Individuals with Peripheral Arterial Disease: NHANES 1999–2004. Atherosclerosis 2008, 201, 425–433. [Google Scholar] [CrossRef] [PubMed] [Green Version]
- Bhutada, P.; Mundhada, Y.; Bansod, K.; Tawari, S.; Patil, S.; Dixit, P.; Umathe, S.; Mundhada, D. Protection of Cholinergic and Antioxidant System Contributes to the Effect of Berberine Ameliorating Memory Dysfunction in Rat Model of Streptozotocin-Induced Diabetes. Behav. Brain Res. 2011, 220, 30–41. [Google Scholar] [CrossRef] [PubMed]
- Saliu, J.A.; Oboh, G.; Omojokun, O.S.; Rocha, J.B.T.; Schetinger, M.R.; Guterries, J.; Stefanello, N.; Carvalho, F.; Schmatz, R.; Morsch, V.M.; et al. Effect of Dietary Supplementation of Padauk (Pterocarpus Soyauxii) Leaf on High Fat Diet/Streptozotocin Induced Diabetes in Rats’ Brain and Platelets. Biomed. Pharmacother. 2016, 84, 1194–1201. [Google Scholar] [CrossRef]
- Greig, N.H.; Utsuki, T.; Ingram, D.K.; Wang, Y.; Pepeu, G.; Scali, C.; Yu, Q.-S.; Mamczarz, J.; Holloway, H.W.; Giordano, T.; et al. Selective Butyrylcholinesterase Inhibition Elevates Brain Acetylcholine, Augments Learning and Lowers Alzheimer -Amyloid Peptide in Rodent. Proc. Natl. Acad. Sci. USA 2005, 102, 17213–17218. [Google Scholar] [CrossRef] [Green Version]
- Asadbegi, M.; Yaghmaei, P.; Salehi, I.; Ebrahim-Habibi, A.; Komaki, A. Neuroprotective Effects of Metformin against Aβ-Mediated Inhibition of Long-Term Potentiation in Rats Fed a High-Fat Diet. Brain Res. Bull. 2016, 121, 178–185. [Google Scholar] [CrossRef]
- Luchsinger, J.A.; Perez, T.; Chang, H.; Mehta, P.; Steffener, J.; Pradabhan, G.; Ichise, M.; Manly, J.; Devanand, D.P.; Bagiella, E. Metformin in Amnestic Mild Cognitive Impairment: Results of a Pilot Randomized Placebo Controlled Clinical Trial. J. Alzheimers Dis. 2016, 51, 501–514. [Google Scholar] [CrossRef] [Green Version]
- Mor, D.E.; Sohrabi, S.; Kaletsky, R.; Keyes, W.; Tartici, A.; Kalia, V.; Miller, G.W.; Murphy, C.T. Metformin Rescues Parkinson’s Disease Phenotypes Caused by Hyperactive Mitochondria. Proc. Natl. Acad. Sci. USA 2020, 117, 26438–26447. [Google Scholar] [CrossRef] [PubMed]
- Tang, B.L. Could Metformin Be Therapeutically Useful in Huntington’s Disease? Rev. Neurosci. 2020, 31, 297–317. [Google Scholar] [CrossRef] [PubMed]
- An Introduction to Reactive Oxygen Species-Measurement of ROS in Cells. Agilent. Available online: https://www.biotek.com/resources/white-papers/an-introduction-to-reactive-oxygen-species-measurement-of-ros-in-cells/#:~:text=Reactive%20Oxygen%20Species%20(ROS)%20is,bane%20to%20all%20aerobic%20species (accessed on 7 April 2021).
- Baeeri, M.; Shariatpanahi, M.; Baghaei, A.; Ghasemi-Niri, S.F.; Mohammadi, H.; Mohammadirad, A.; Hassani, S.; Bayrami, Z.; Hosseini, A.; Rezayat, S.M.; et al. On the Benefit of Magnetic Magnesium Nanocarrier in Cardiovascular Toxicity of Aluminum Phosphide. Toxicol. Ind. Health 2013, 29, 126–135. [Google Scholar] [CrossRef] [PubMed]
- Lapenna, D.; Cuccurullo, F. TBA Test and “Free” MDA Assay in Evaluation of Lipid Peroxidation and Oxidative Stress in Tissue Systems. Am. J. Physiol.-Heart Circ. Physiol. 1993, 265, H1030–H1032. [Google Scholar] [CrossRef]
- Abdollahi, M.; Esmaily, H.; Baeeri, M.; Asadi-Shahmirzadi, A.; Mozaffari, S.; Rahimi, R.; Sanei, Y.; Salehi-Surmaghi, M.-H. Effects of Hypericum Perforatum Extract on Rat Irritable Bowel Syndrome. Phcog. Mag. 2011, 7, 213. [Google Scholar] [CrossRef]
- Bocquené, G.; Galgani, F.; Truquet, P. Characterization and Assay Conditions for Use of ACHe Activity from Several Marine Species in Pollution Monitoring. Mar. Environ. Res. 1990, 30, 75–89. [Google Scholar] [CrossRef]
- Ghafour-boroujerdi, E.; Rahmani, S.; Sanadgol, N.; Baeeri, M.; Hassani, S. Investigation of Alpha-Lipoic Acid Effect on Memory Impairment Considering Strain-Dependent Differences in Mice. Life Sci. 2021, 281, 119766. [Google Scholar] [CrossRef]
- Abdolghaffari, A.H.; Baghaei, A.; Solgi, R.; Gooshe, M.; Baeeri, M.; Navaei-Nigjeh, M.; Hassani, S.; Jafari, A.; Rezayat, S.M.; Dehpour, A.R.; et al. Molecular and Biochemical Evidences on the Protective Effects of Triiodothyronine against Phosphine-Induced Cardiac and Mitochondrial Toxicity. Life Sci. 2015, 139, 30–39. [Google Scholar] [CrossRef]
- Hassani, S.; Maqbool, F.; Salek-Maghsoudi, A.; Rahmani, S.; Shadboorestan, A.; Nili-Ahmadabadi, A.; Amini, M.; Norouzi, P.; Abdollahi, M. Alteration of Hepatocellular Antioxidant Gene Expression Pattern and Biomarkers of Oxidative Damage in Diazinon-Induced Acute Toxicity in Wistar Rat: A Time-Course Mechanistic Study. EXCLI J. 2018, 17, 57–71. [Google Scholar] [CrossRef]
- Kaur, S.; Singla, N.; Dhawan, D.K. Neuro-Protective Potential of Quercetin during Chlorpyrifos Induced Neurotoxicity in Rats. Drug Chem. Toxicol. 2019, 42, 220–230. [Google Scholar] [CrossRef]
- Olsvik, P.A.; Berntssen, M.H.G.; Søfteland, L.; Sanden, M. Transcriptional Effects of Dietary Chlorpyrifos-methyl Exposure in Atlantic Salmon (Salmo Salar) Brain and Liver. Comp. Biochem. Physiol. Part D Genom. Proteom. 2019, 29, 43–54. [Google Scholar] [CrossRef] [PubMed]
- Gu, J.; Xu, S.; Liu, Y.; Chen, X. Chlorpyrifos-Induced Toxicity Has No Gender Selectivity in the Early Fetal Brain. J. Environ. Sci. Health Part B 2020, 55, 803–812. [Google Scholar] [CrossRef] [PubMed]
- Khokhar, J.Y.; Tyndale, R.F. Rat Brain CYP2B-Enzymatic Activation of Chlorpyrifos to the Oxon Mediates Cholinergic Neurotoxicity. Toxicol. Sci. 2012, 126, 325–335. [Google Scholar] [CrossRef] [PubMed] [Green Version]
- Abd El-Moneim Ibrahim, K.; Mohamed Abdelrahman, S.; Elhakim, H.K.A.; Ali Ragab, E. Single or Combined Exposure to Chlorpyrifos and Cypermethrin Provoke Oxidative Stress and Downregulation in Monoamine Oxidase and Acetylcholinesterase Gene Expression of the Rat’s Brain. Environ. Sci. Pollut. Res. 2020, 27, 12692–12703. [Google Scholar] [CrossRef]
- Garg, G.; Singh, S.; Singh, A.K.; Rizvi, S.I. Antiaging Effect of Metformin on Brain in Naturally Aged and Accelerated Senescence Model of Rat. Rejuvenat. Res. 2017, 20, 173–182. [Google Scholar] [CrossRef]
- Rotermund, C.; Machetanz, G.; Fitzgerald, J.C. The Therapeutic Potential of Metformin in Neurodegenerative Diseases. Front. Endocrinol. 2018, 9, 400. [Google Scholar] [CrossRef]
- Dehkordi, A.H.; Abbaszadeh, A.; Mir, S.; Hasanvand, A. Metformin and Its Anti-Inflammatory and Anti-Oxidative Effects; New Concepts. J. Ren. Inj. Prev. 2018, 8, 54–61. [Google Scholar] [CrossRef]
- Slotkin, T.A.; Seidler, F.J.; Ryde, I.T.; Yanai, J. Developmental neurotoxic effects of chlorpyrifos on acetylcholine and serotonin pathways in an avian model. Neurotoxicol. Teratol. 2008, 30, 433–439. [Google Scholar] [CrossRef] [Green Version]
- Li, J.-W.; Fang, B.; Pang, G.-F.; Zhang, M.; Ren, F.-Z. Age- and Diet-Specific Effects of Chronic Exposure to Chlorpyrifos on Hormones, Inflammation and Gut Microbiota in Rats. Pestic. Biochem. Physiol. 2019, 159, 68–79. [Google Scholar] [CrossRef]
- Ruegsegger, G.N.; Vanderboom, P.M.; Dasari, S.; Klaus, K.A.; Kabiraj, P.; McCarthy, C.B.; Lucchinetti, C.F.; Nair, K.S. Exercise and Metformin Counteract Altered Mitochondrial Function in the Insulin-Resistant Brain. JCI Insight 2019, 4, e130681. [Google Scholar] [CrossRef]
- Leech, T.; Chattipakorn, N.; Chattipakorn, S.C. The Beneficial Roles of Metformin on the Brain with Cerebral Ischaemia/Reperfusion Injury. Pharmacol. Res. 2019, 146, 104261. [Google Scholar] [CrossRef] [PubMed]
- Zhao, M.; Li, X.W.; Chen, D.Z.; Hao, F.; Tao, S.X.; Yu, H.Y.; Cheng, R.; Liu, H. Neuro-Protective Role of Metformin in Patients with Acute Stroke and Type 2 Diabetes Mellitus via AMPK/Mammalian Target of Rapamycin (MTOR) Signaling Pathway and Oxidative Stress. Med. Sci. Monit. 2019, 25, 2186–2194. [Google Scholar] [CrossRef] [PubMed]
- Clark, G.J.; Pandya, K.; Lau-Cam, C.A. The Effect of Metformin and Taurine, Alone and in Combination, on the Oxidative Stress Caused by Diabetes in the Rat Brain. In Taurine 10; Lee, D.-H., Schaffer, S.W., Park, E., Kim, H.W., Eds.; Advances in Experimental Medicine and Biology; Springer: Dordrecht, The Netherlands, 2017; Volume 975, pp. 353–369. ISBN 978-94-024-1077-8. [Google Scholar]
- Tang, G.; Yang, H.; Chen, J.; Shi, M.; Ge, L.; Ge, X.; Zhu, G. Metformin Ameliorates Sepsis-Induced Brain Injury by Inhibiting Apoptosis, Oxidative Stress and Neuroinflammation via the PI3K/Akt Signaling Pathway. Oncotarget 2017, 8, 97977–97989. [Google Scholar] [CrossRef] [PubMed] [Green Version]


| Name | Symbol | Primer Sequence |
|---|---|---|
| Rattus norvegicus actin, beta (Actb) | β-actin | F: AGGGAAATCGTGCGTGACAT R: CCGATAGTGATGACCTGACC |
| Rattus norvegicus 5-hydroxytryptamine receptor 1A (Htr1a) | 5HT1 | F: GTCCACTTGTTGAGCACCTG R: ACGTGACCTTCAGCTACCAA |
| Rattus norvegicus 5-hydroxytryptamine receptor 2A (Htr2a) | 5HT2 | F: TAGTTTGGCTCGAGTGCTGA R: TCCATGCCAATCCCAGTCTT |
Publisher’s Note: MDPI stays neutral with regard to jurisdictional claims in published maps and institutional affiliations. |
© 2022 by the authors. Licensee MDPI, Basel, Switzerland. This article is an open access article distributed under the terms and conditions of the Creative Commons Attribution (CC BY) license (https://creativecommons.org/licenses/by/4.0/).
Share and Cite
Daniali, M.; Baeeri, M.; Farhadi, R.; Gholami, M.; Hassani, S.; Navaei-Nigjeh, M.; Rahimifard, M.; Abdollahi, M. Molecular Evidence on the Inhibitory Potential of Metformin against Chlorpyrifos-Induced Neurotoxicity. Toxics 2022, 10, 197. https://0-doi-org.brum.beds.ac.uk/10.3390/toxics10040197
Daniali M, Baeeri M, Farhadi R, Gholami M, Hassani S, Navaei-Nigjeh M, Rahimifard M, Abdollahi M. Molecular Evidence on the Inhibitory Potential of Metformin against Chlorpyrifos-Induced Neurotoxicity. Toxics. 2022; 10(4):197. https://0-doi-org.brum.beds.ac.uk/10.3390/toxics10040197
Chicago/Turabian StyleDaniali, Marzieh, Maryam Baeeri, Ramtin Farhadi, Mahdi Gholami, Shokoufeh Hassani, Mona Navaei-Nigjeh, Mahban Rahimifard, and Mohammad Abdollahi. 2022. "Molecular Evidence on the Inhibitory Potential of Metformin against Chlorpyrifos-Induced Neurotoxicity" Toxics 10, no. 4: 197. https://0-doi-org.brum.beds.ac.uk/10.3390/toxics10040197