Structural, Thermodiffusive and Thermoelectric Properties of Maghemite Nanoparticles Dispersed in Ethylammonium Nitrate

 , , , , , , , , and
Abstract
:1. Introduction
2. Review on the Former Works Dealing with Colloidal Dispersions in EAN
2.1. Ethylammonium Nitrate
2.2. Maghemite Nanoparticles and Their Aqueous Dispersions
2.3. Properties of the Dispersions of Maghemite NPs in EAN
3. Preparation and Structure of the Dispersions in EAN
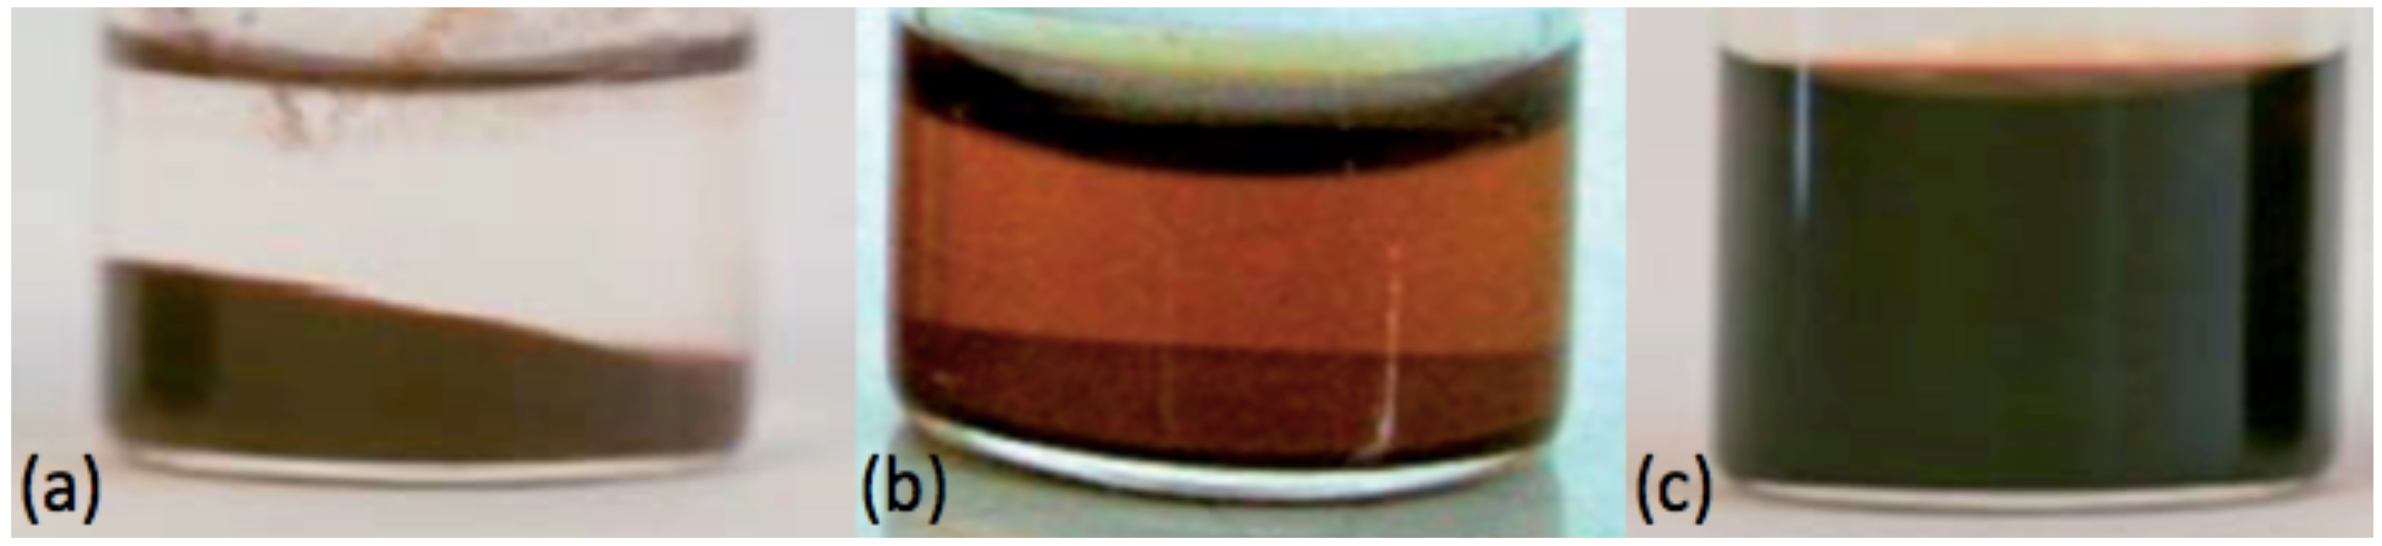
3.1. Preparation of the Samples
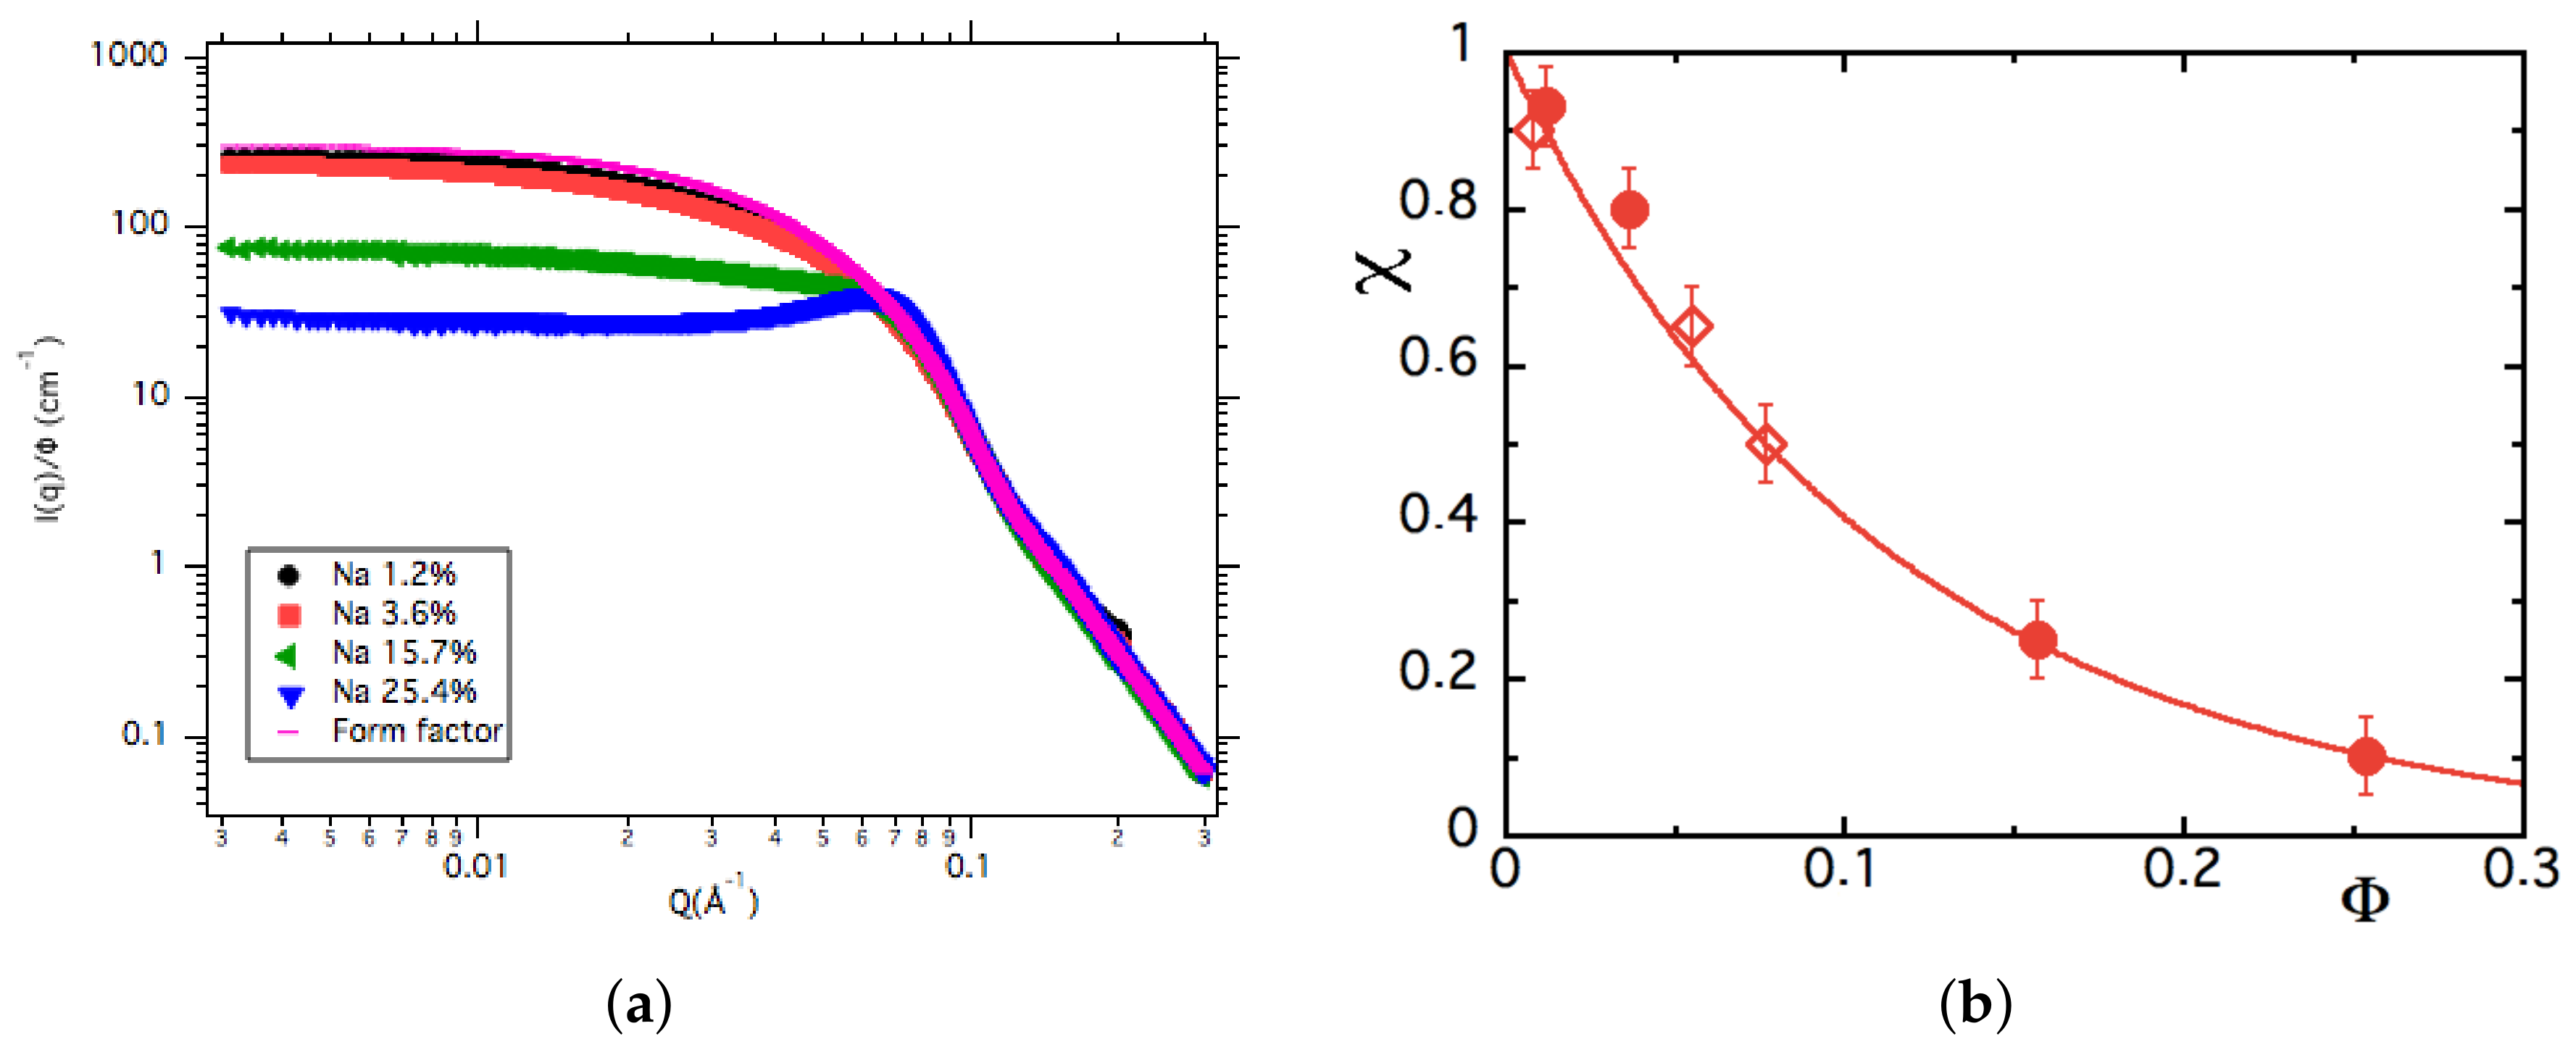
3.2. Structure from Small Angle X-ray Scattering (SAXS) at Room Temperature
3.3. Chemical Titrations of Alkaline Ions
3.4. Discussion on the Structure
4. Thermodiffusive Properties
4.1. Theoretical Background
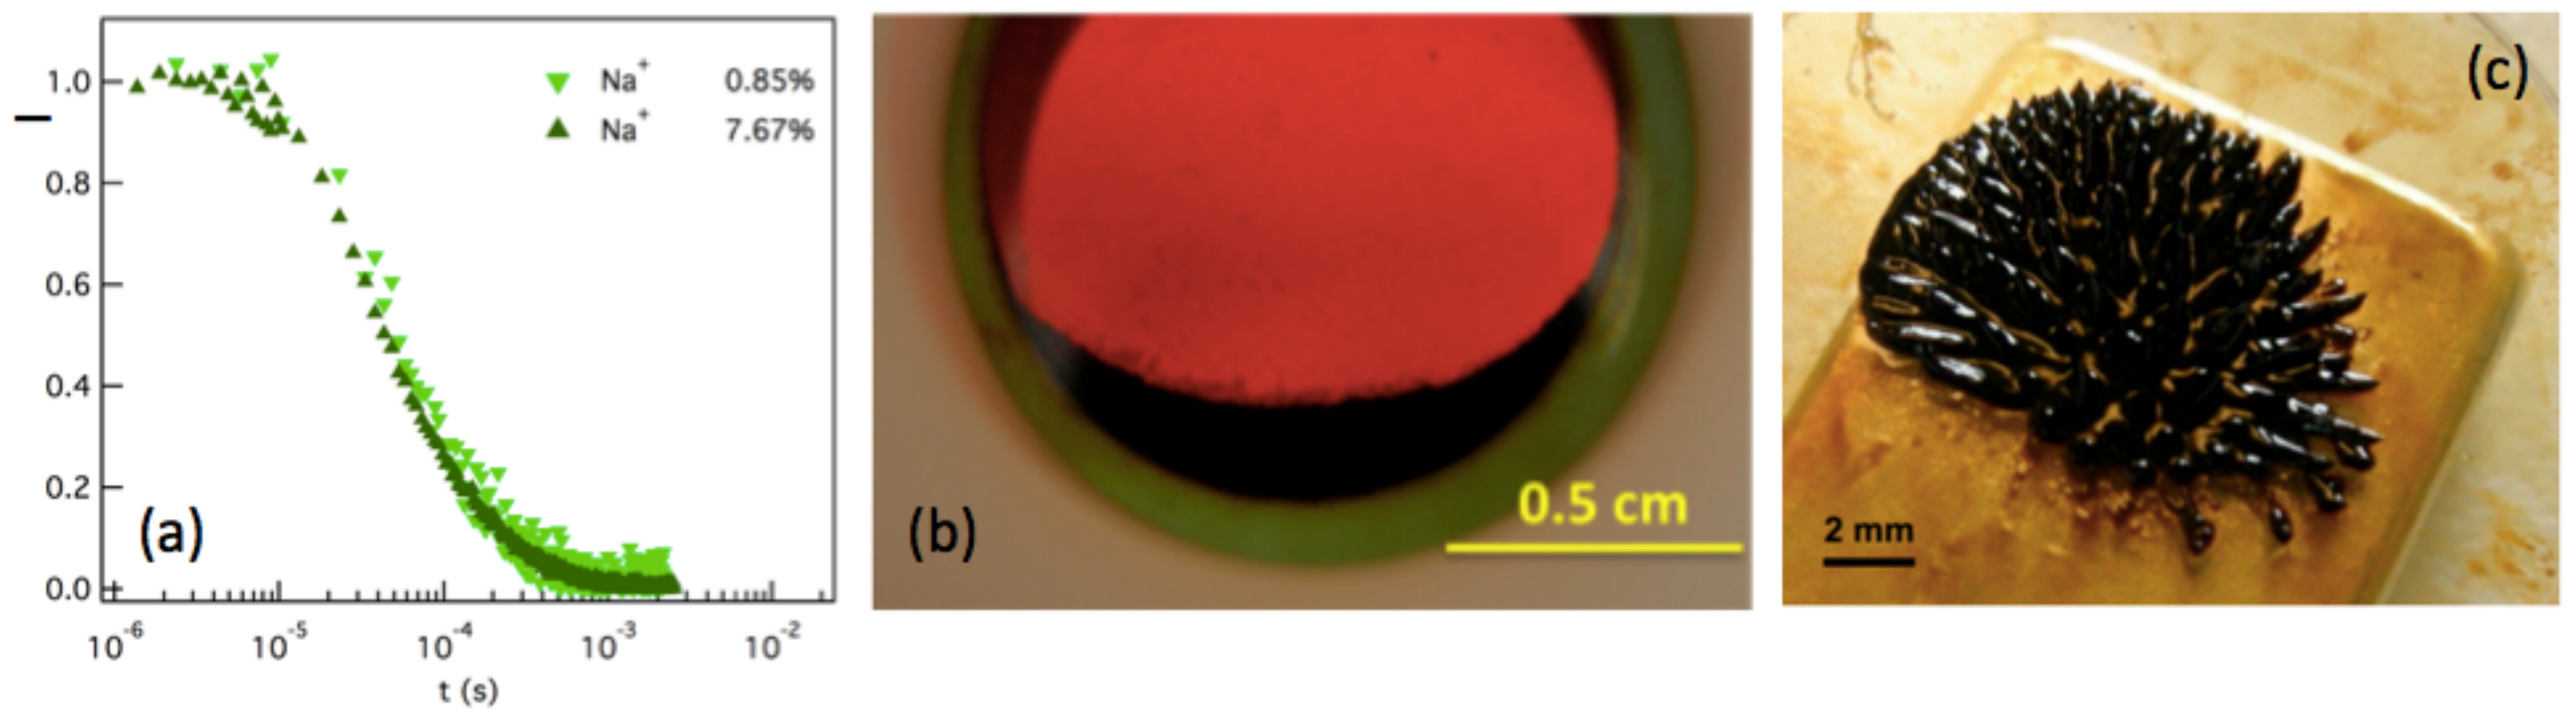
4.2. Forced Rayleigh Scattering Experiment
4.3. FRS Experimental Results
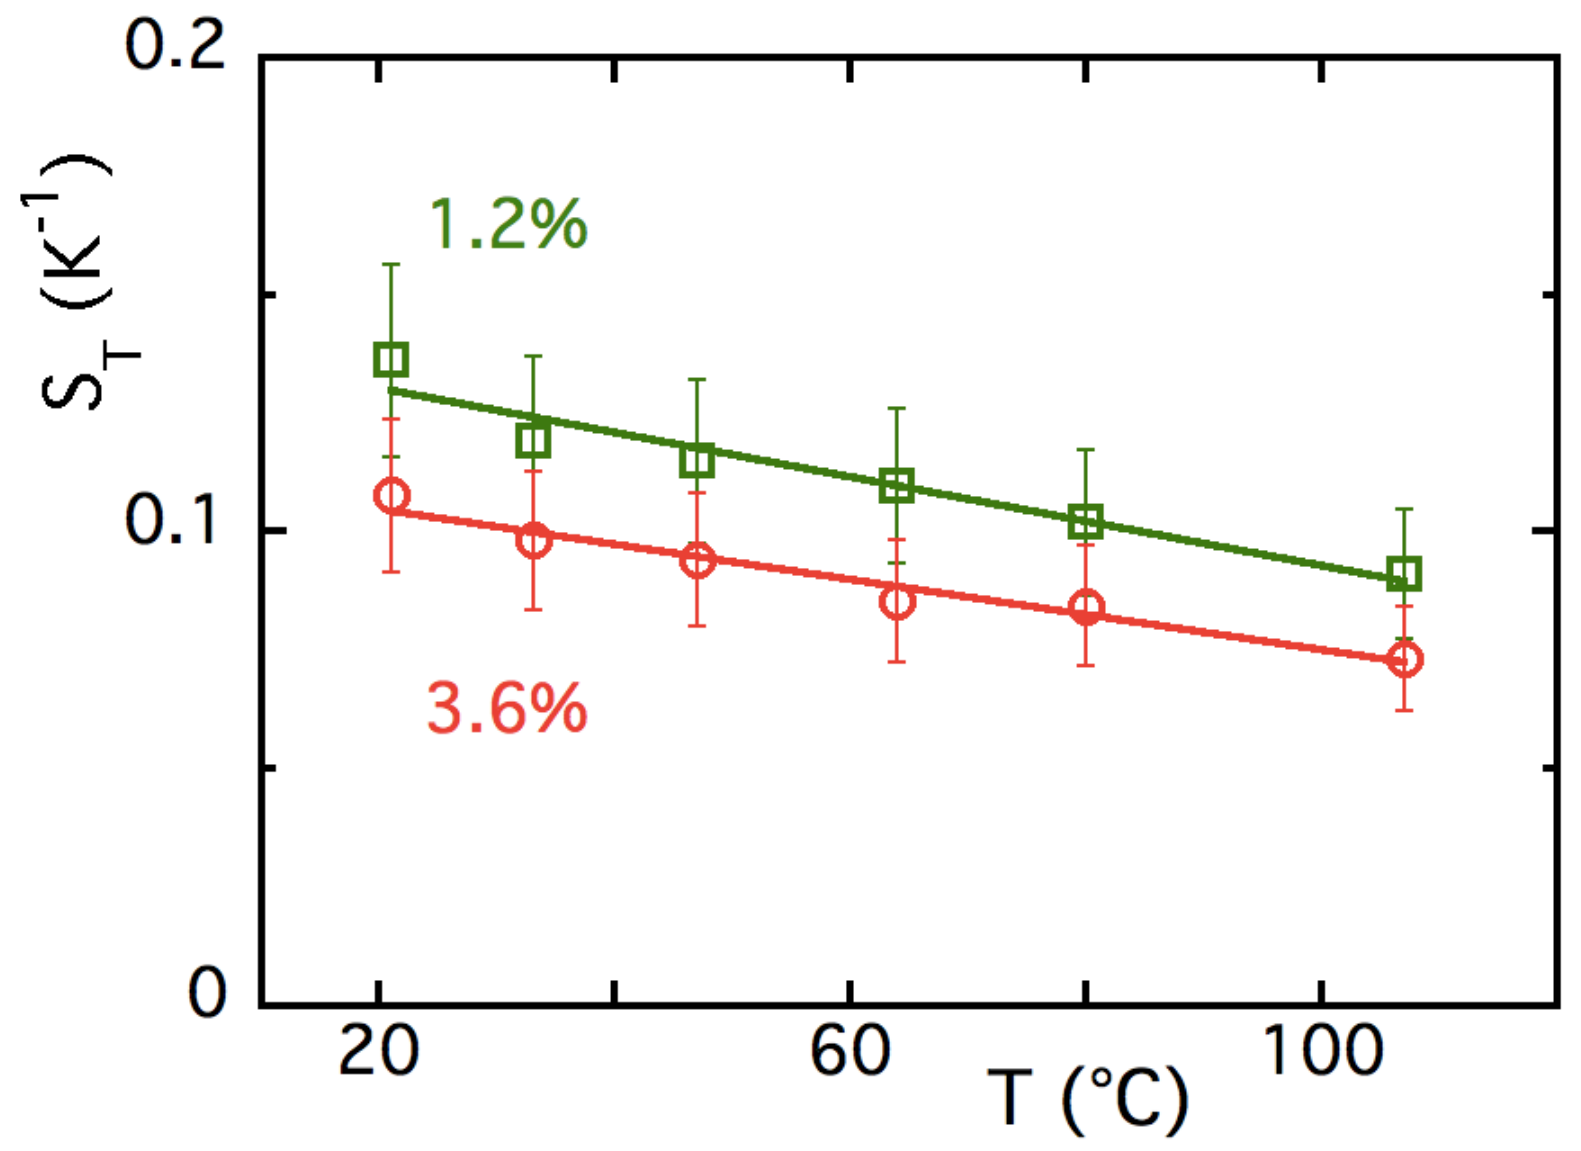
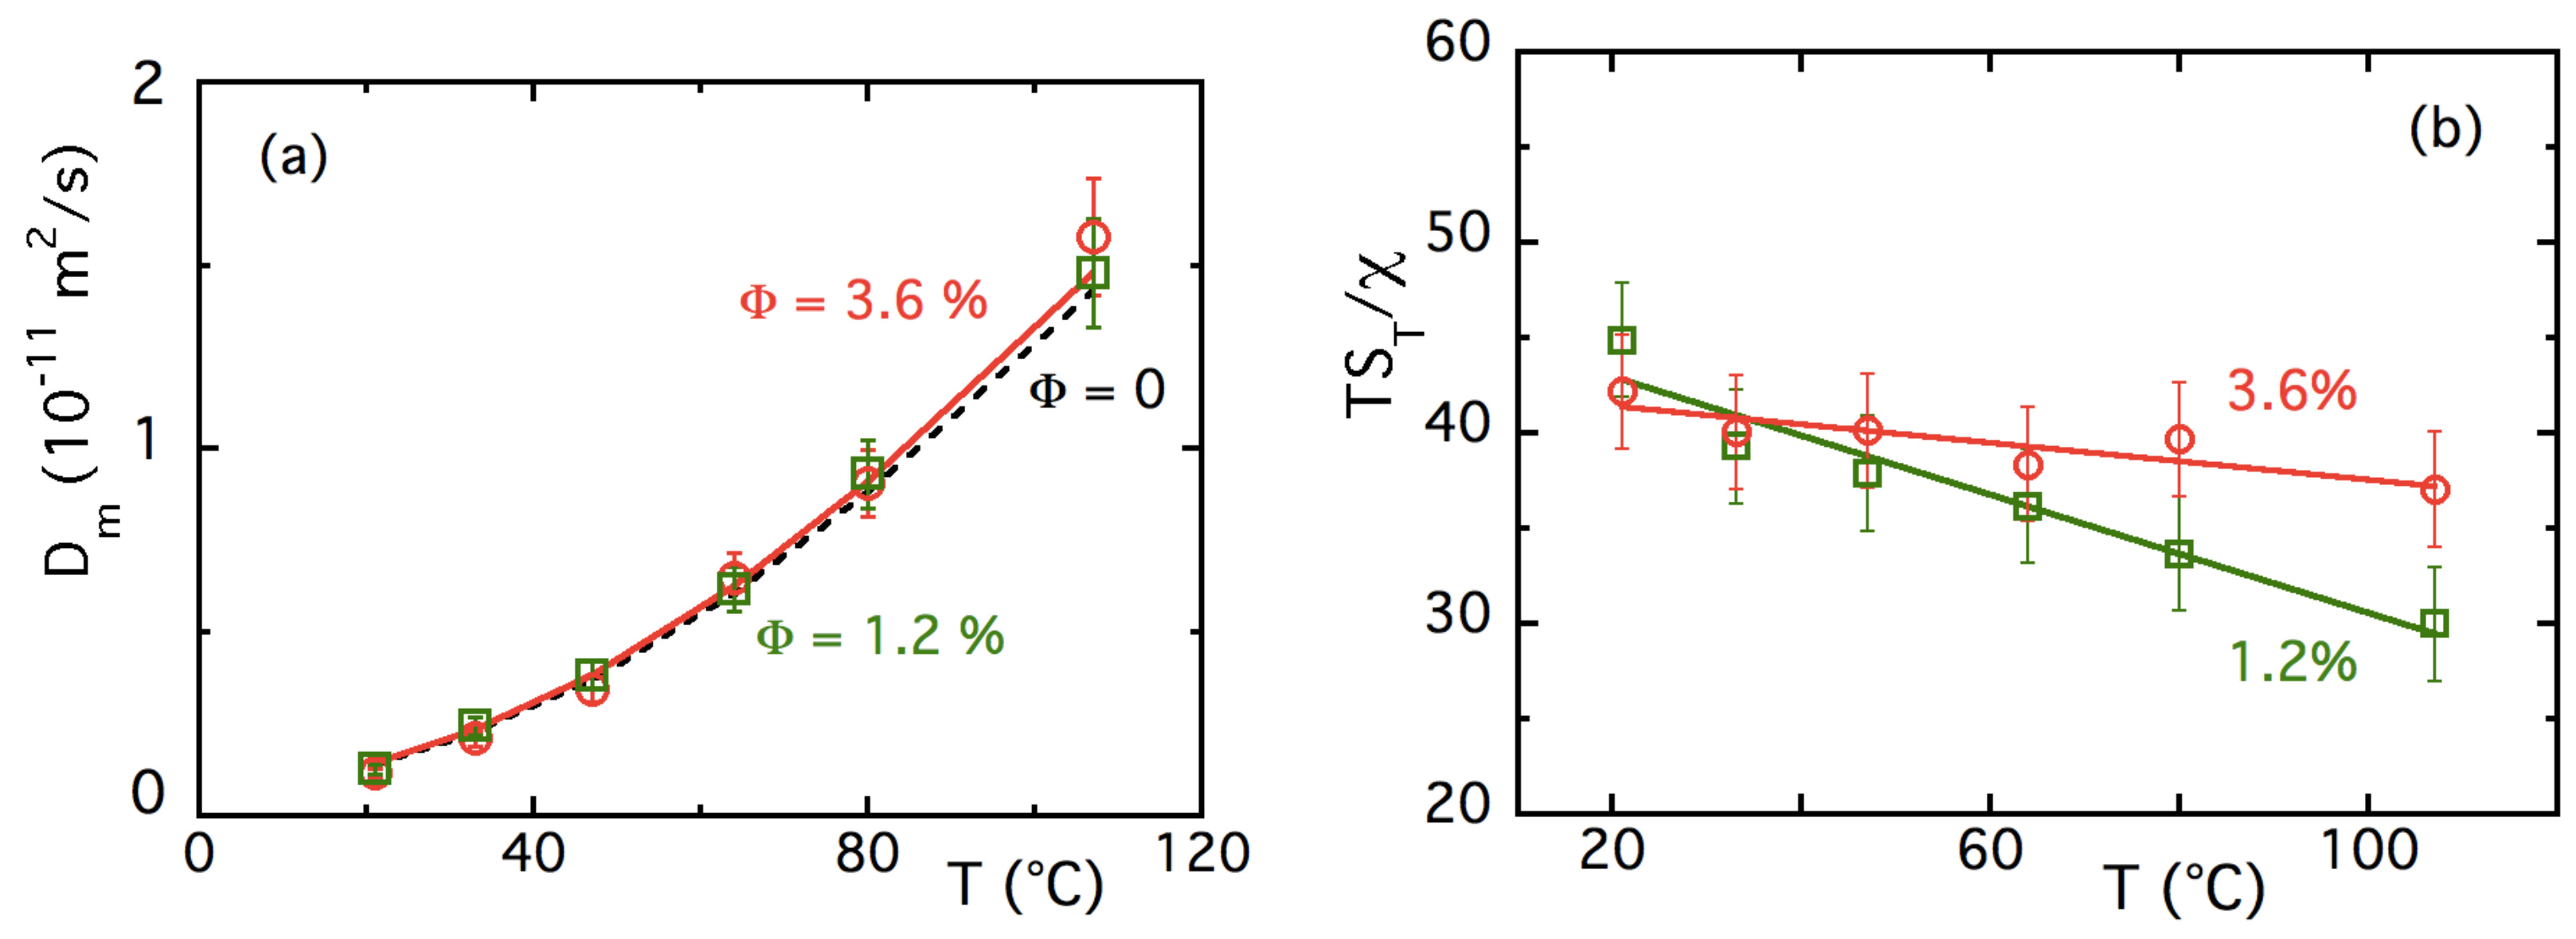
4.3.1. T-Dependences at and
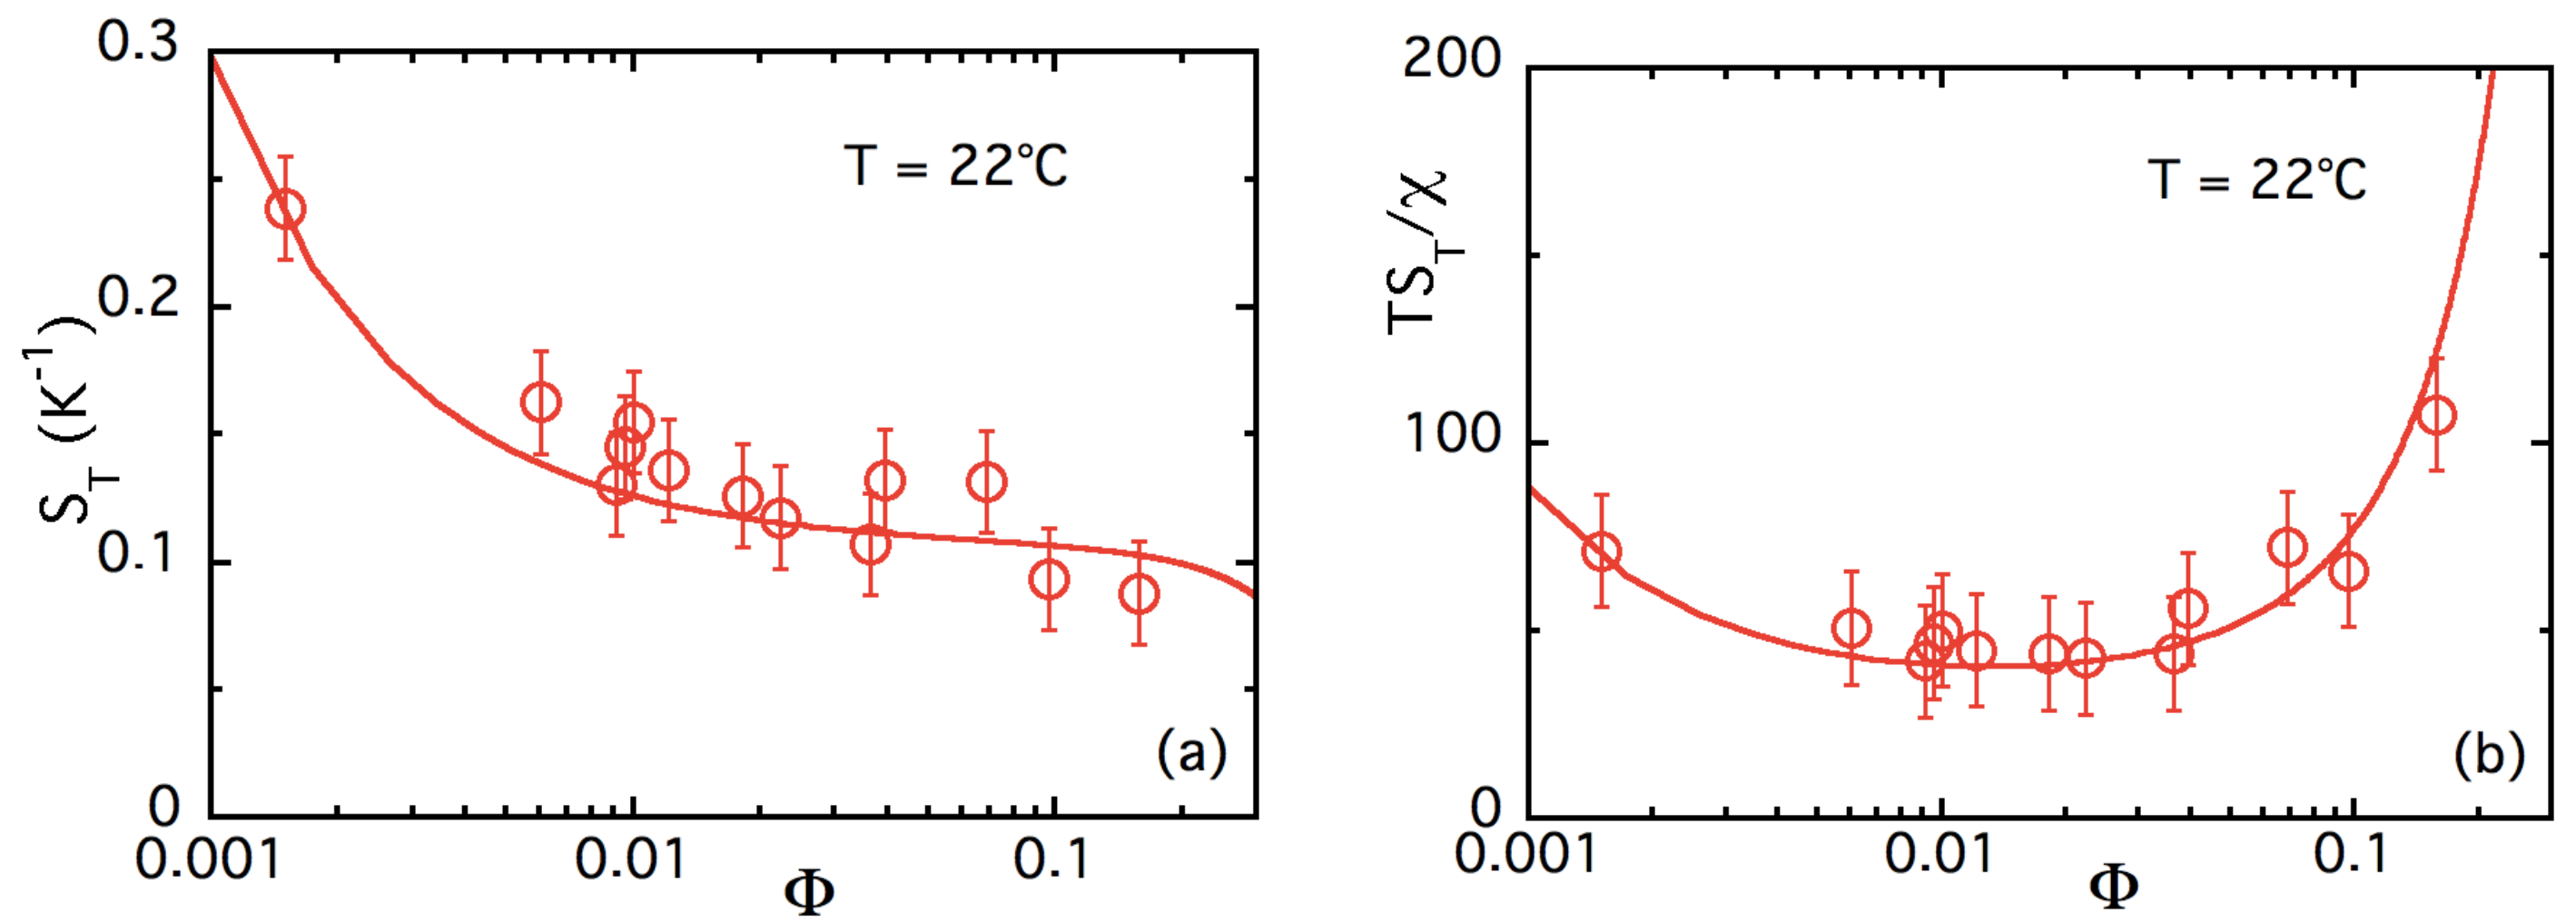
4.3.2. -Dependence of up to ≈16% at Room Temperature
5. Thermoelectric Properties
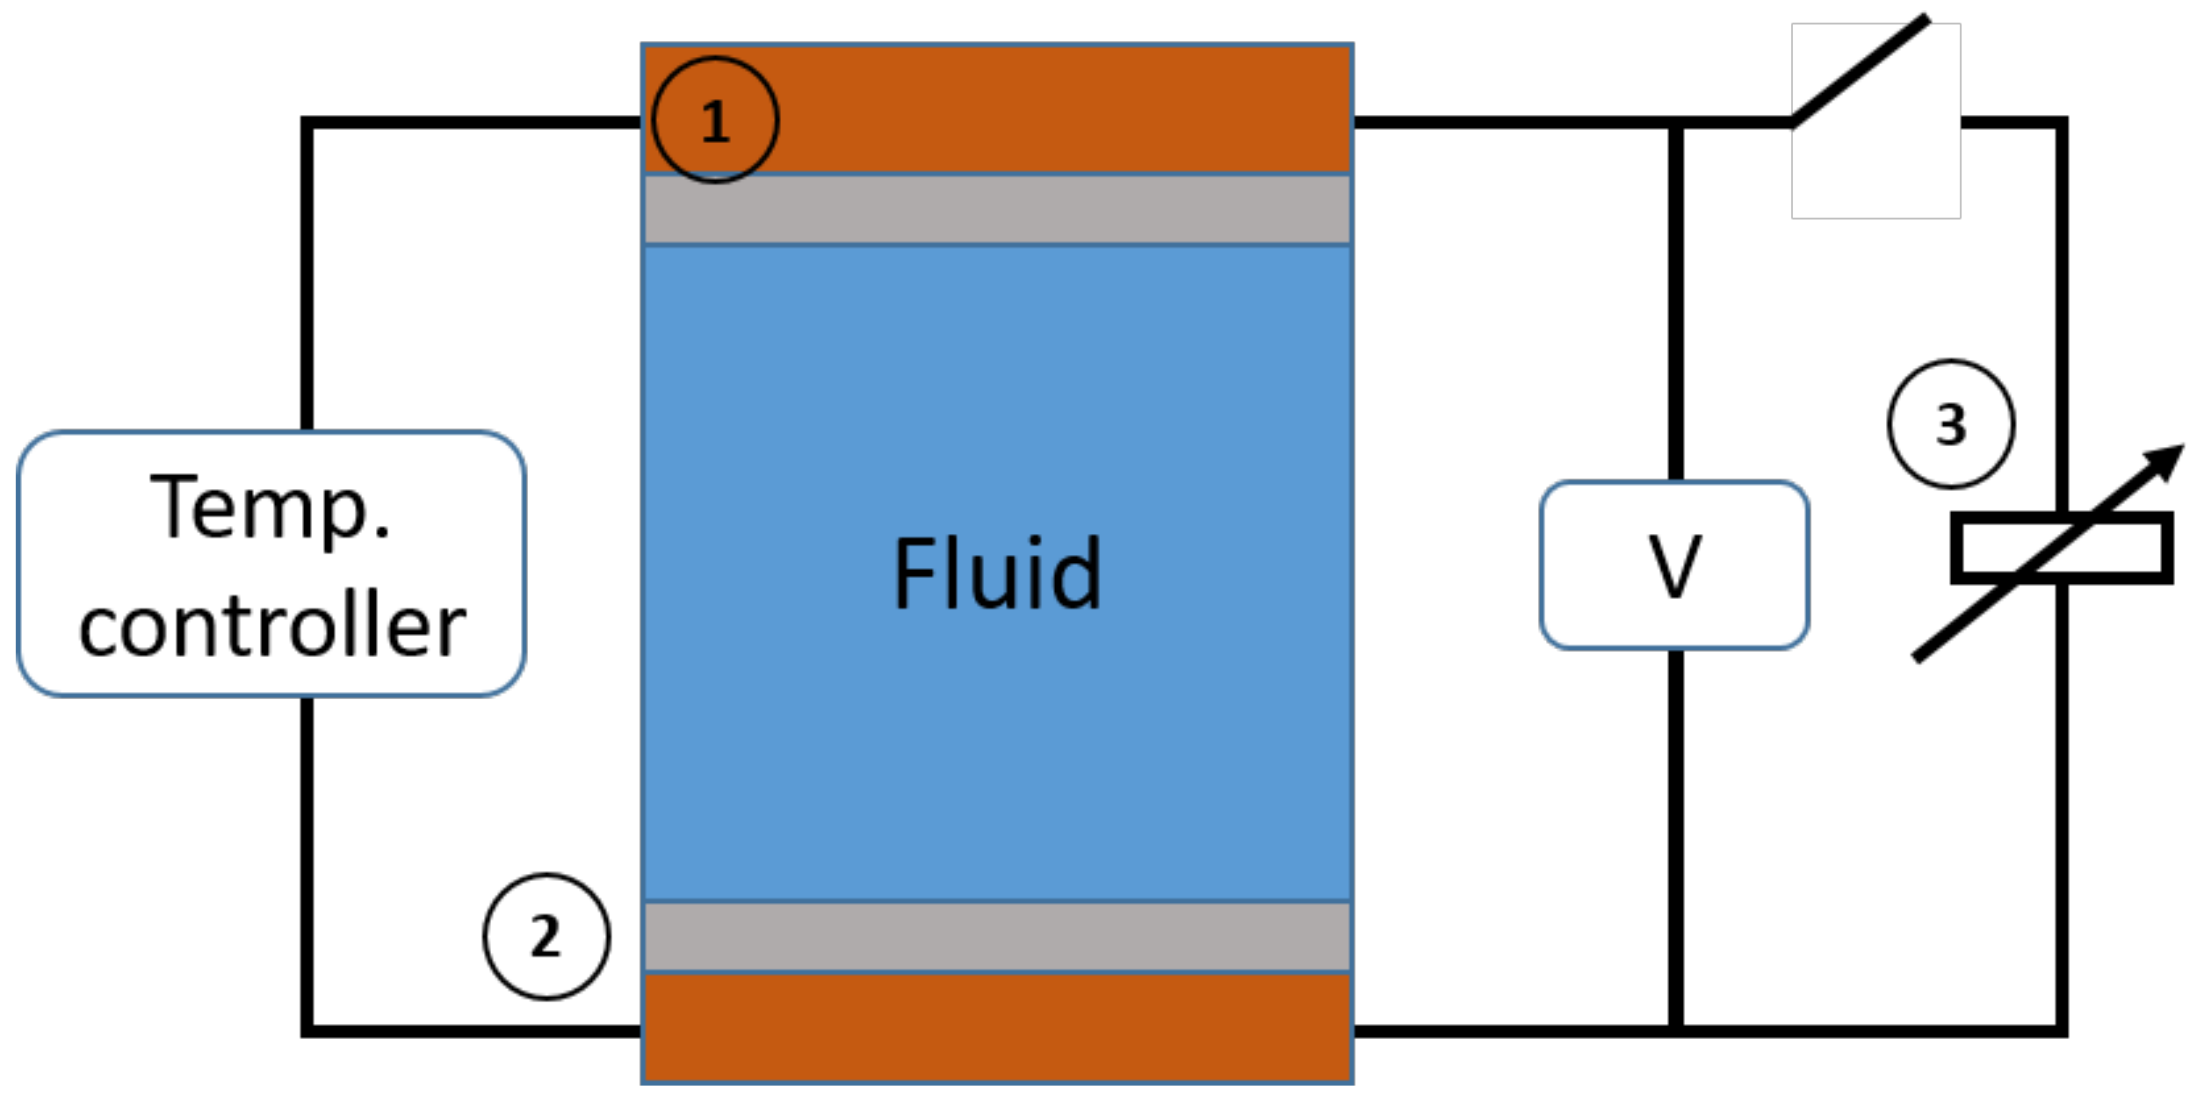
5.1. Production of Thermoelectric Voltage in Liquid Thermogalvanic Cells
5.2. Experimental
5.2.1. Samples
5.2.2. Seebeck Coefficient Measurements
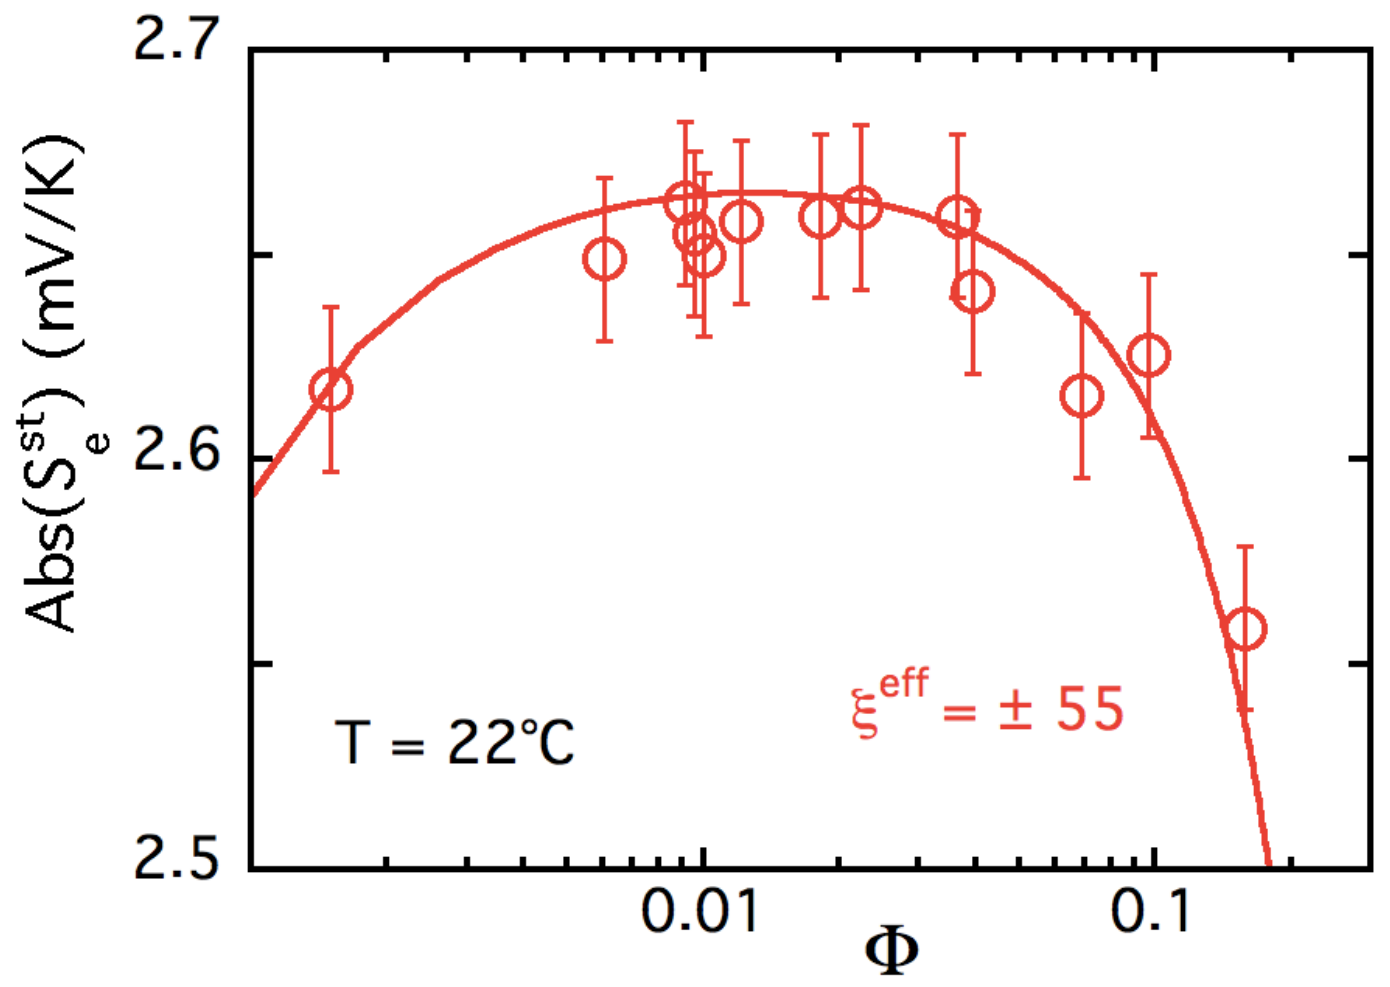
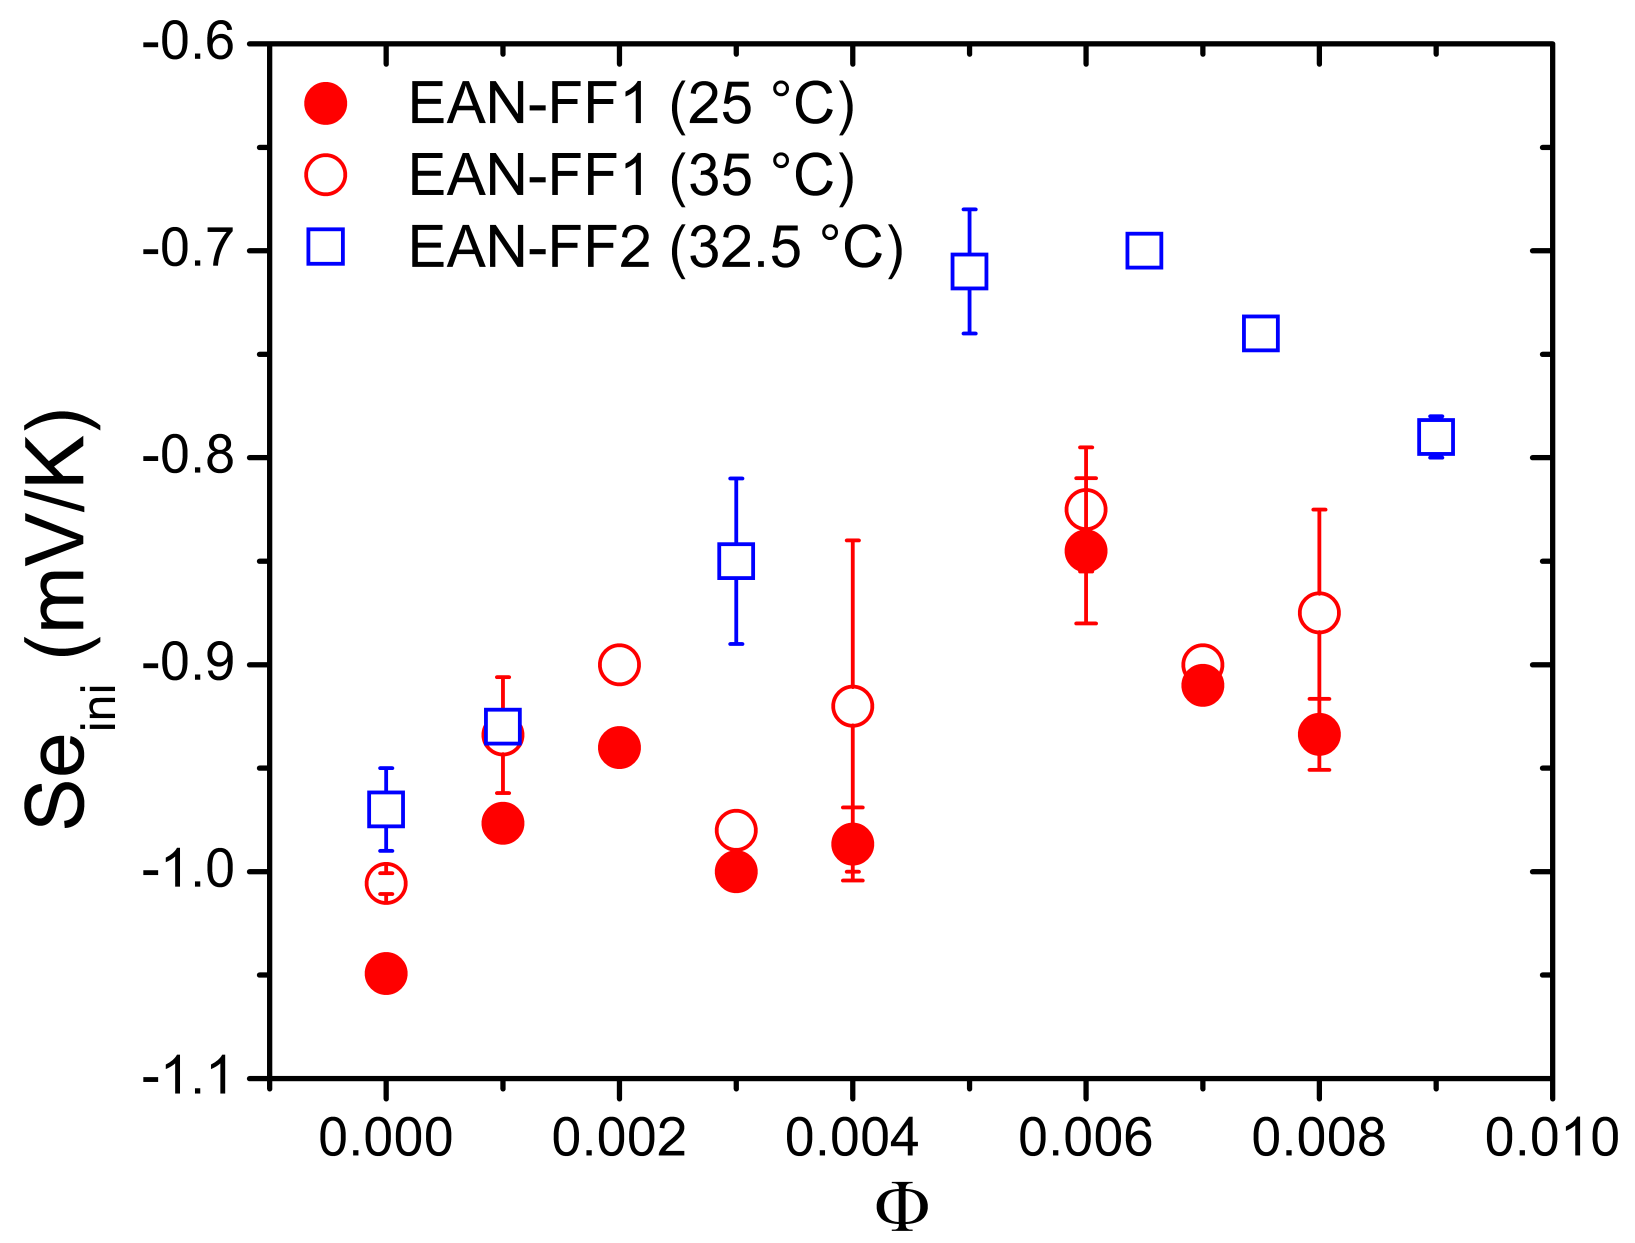
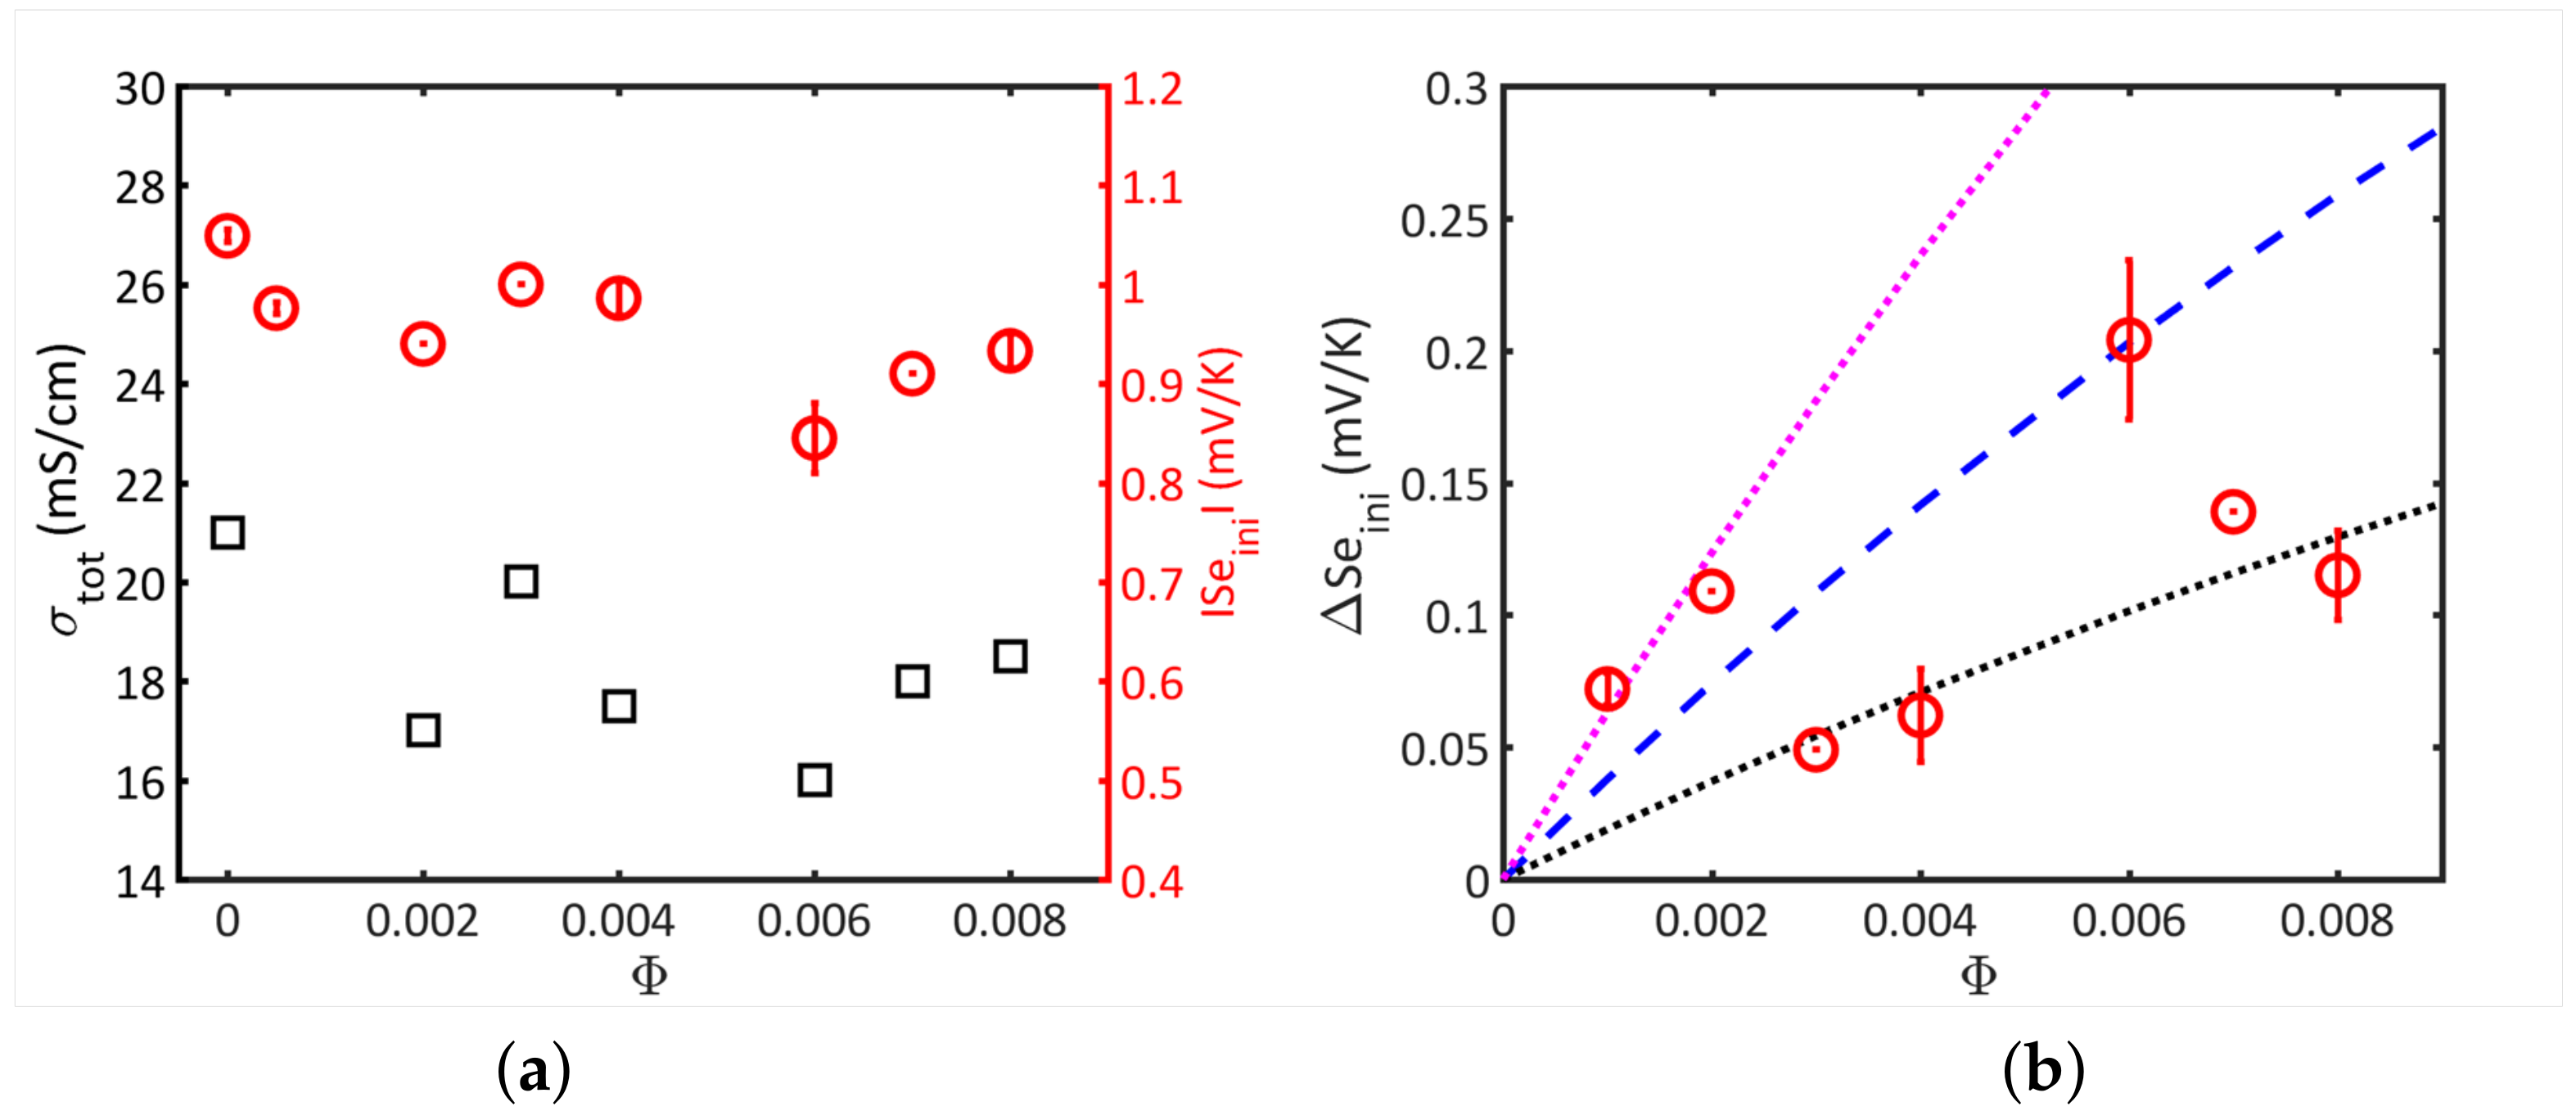
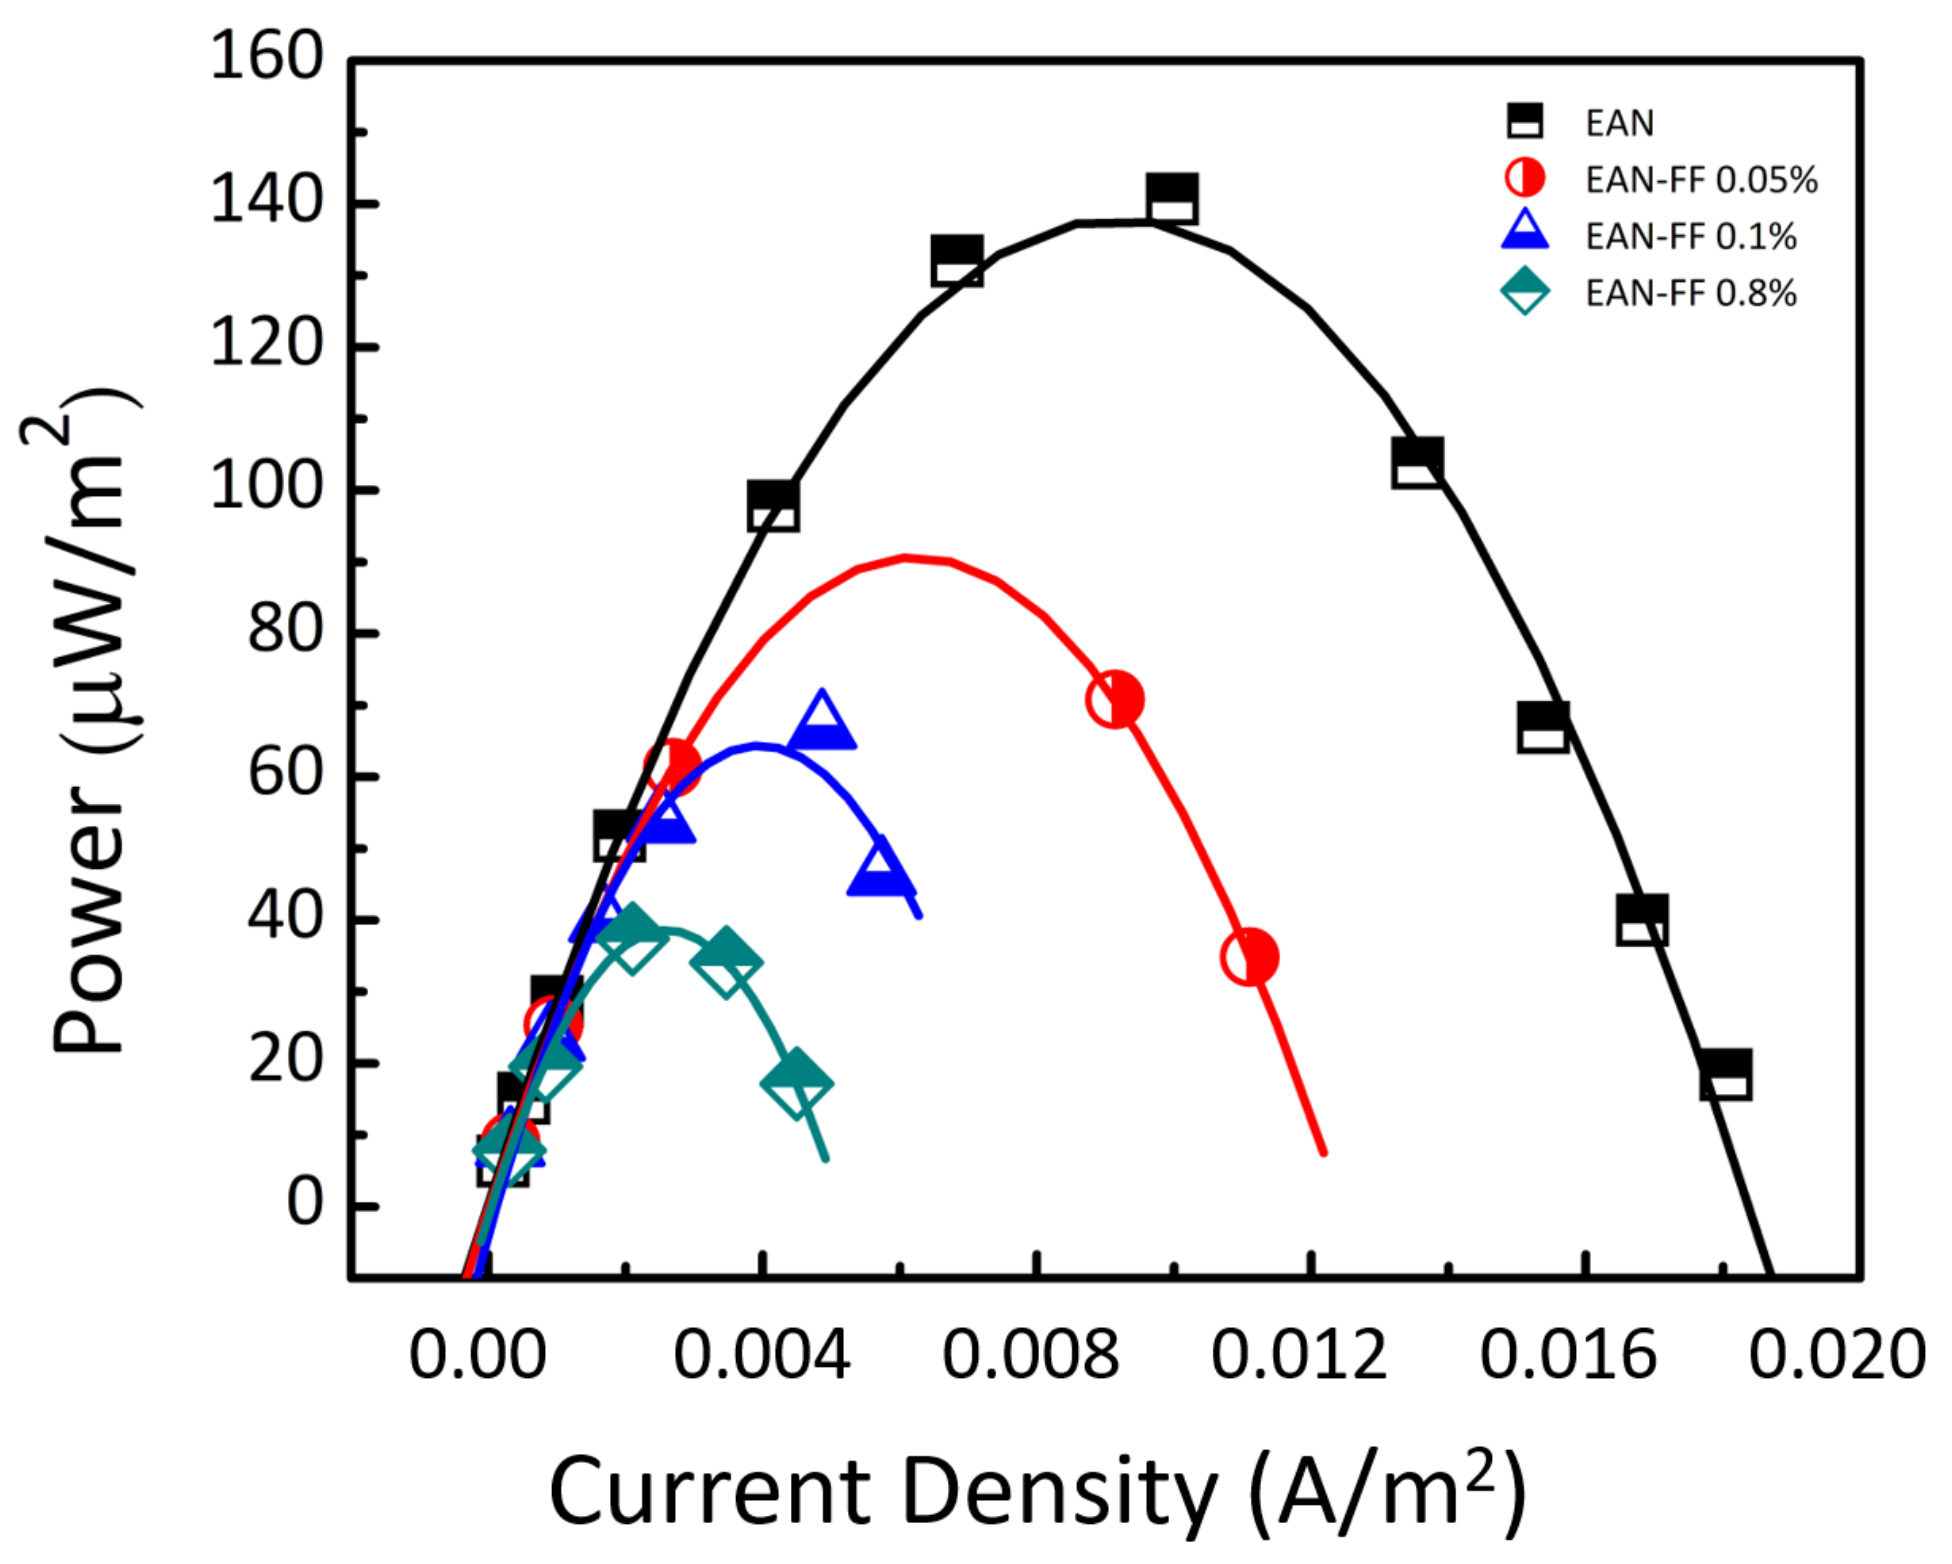
5.3. Results and Discussion
6. Conclusions
Author Contributions
Funding
Acknowledgments
Conflicts of Interest
Abbreviations
| Soret coefficient | |
| diffusion coefficient (of nanoparticles) | |
| Seebeck coefficient | |
| , | stationary, initial state Seebeck coefficient |
| , , | Eastman entropy of transfer of nanoparticles, ±ions |
| , | nanoparticle volume fraction and effective volume fraction |
| n, , | number concentration of nanoparticles and ±ions |
| Z, , | effective and structural charge number (of a nanoparticle) |
| , | dynamic charge and effective dynamic charge at infinite dilution (of nanoparticles) |
| redox half reaction entropy | |
| t, , | Hittorf number of nanoparticles and ion i |
| , , | conductivity of ith specie, dissociated ions and nanoparticles |
| osmotic compressibility | |
| osmotic pressure | |
| friction coefficient | |
| NP | nanoparticle |
| RTIL | room temperature ionic liquid |
| EAN | ethylammonium nitrate |
| IL-FF | ionic liquid based ferrofluid |
| ICP-MS | inductively coupled plasma mass spectroscopy |
| SAXS | small angle X-ray scattering |
| TE | thermoelectric |
| DLS | dynamic light scattering |
| AFM | atomic force microscopy |
| TEM | transmission electronc microscopy |
| FRS | forced Rayleigh scattering |
References
- Raj, K.; Moskowitz, R. A review of damping applications of ferrofluids. IEEE Trans. Magn. 1980, 16, 358–363. [Google Scholar] [CrossRef]
- Rosensweig, R. Ferrohydrodynamics; Cambridge Monographs on Mechanics and Applied Mathematics; Cambridge University Press: Cambridge, UK, 1985. [Google Scholar]
- Nkurikiyimfura, I.; Wang, Y.; Pan, Z. Heat transfer enhancement by magnetic nanofluids—A review. Renew. Sustain. Energy Rev. 2013, 21, 548–561. [Google Scholar] [CrossRef]
- Philip, J.; Kaskar, J.M. Optical Properties and Applications of Ferrofluids—A Review. J. Nanofluids 2012, 1, 3–20. [Google Scholar] [CrossRef]
- Gamero-Castano, M.; Hruby, V. Electrospray as a Source of Nanoparticles for Efficient Colloid Thrusters. J. Propuls. Power 2001, 17, 977–987. [Google Scholar] [CrossRef]
- Okabe, T.; Kondo, Y.; Yoshimoto, S.; Sasaki, S. Outgassing performance of an ionic liquid-based magnetic fluid. Vacuum 2019, 164, 30–40. [Google Scholar] [CrossRef]
- Bier, M.; Dietrich, S. Vapour pressure of ionic liquids. Mol. Phys. 2010, 108, 211–214. [Google Scholar] [CrossRef] [Green Version]
- Oliveira, F.C.C.; Rossi, L.M.; Jardim, R.F.; Rubim, J.C. Magnetic Fluids Based on γ-Fe2O3 and CoFe2O4 Nanoparticles Dispersed in Ionic Liquids. J. Phys. Chem. C 2009, 113, 8566–8572. [Google Scholar] [CrossRef]
- Rodriguez-Arco, L.; Lopez-Lopez, M.T.; Gonzalez-Caballero, F.; Duran, J.D.G. Steric Repulsion as a way to acheive the required stability for the preparatin of ionic liquid-based ferrofluids. J. Colloids Interfance Sci. 2011, 357, 252–254. [Google Scholar] [CrossRef]
- Mederios, A.; Parize, A.; Oliveira, V.; Neto, B.A.D.; Bakuzis, A.F.; Sousa, M.; Rossi, L.M.; Rubim, J.C. Magnetic Ionic Liquids Produced by the Dispersion of Magnetic Nanoparticles in 1-n-Butyl-3-methylimidazolium bis(trifluoromethanesulfonyl)imide (BMI.NTf2). Appl. Mater. Interfaces 2012, 4, 5458–5465. [Google Scholar] [CrossRef]
- Jain, N.; Zhang, X.; Hawkett, B.S.; Warr, G.G. Stable and Water-Tolerant Ionic Liquid Ferrofluids. Appl. Mater. Interfaces 2011, 3, 662–667. [Google Scholar] [CrossRef]
- Mamusa, M.; Sirieix-Plénet, J.; Cousin, F.; Perzynski, R.; Dubois, E.; Peyre, V. Concentrated assemblies of magnetic nanoparticles in Ionic Liquids. Faraday Discuss. 2015, 181, 193–209. [Google Scholar] [CrossRef] [PubMed] [Green Version]
- Mestrom, L. Stable ferrofluids of magnetite nanoparticles in hydrophobic ionic liquids. Nanotechnology 2015, 26, 285602. [Google Scholar] [CrossRef] [PubMed]
- Priyananda, P.; Sabouri, H.; Jain, N.; Hawkett, B.S. Steric Stabilization of γ-Fe2O3 Superparamagnetic Nanoparticles in a Hydrophobic Ionic Liquid and the Magnetorheological Behavior of the Ferrofluid. Langmuir 2018, 34, 3068–3075. [Google Scholar] [CrossRef] [PubMed]
- Shi, S.; Huang, W.; Wang, X. Ionic liquids–based magnetic nanofluids as lubricants. Lubr. Sci. 2018, 30, 73–82. [Google Scholar] [CrossRef]
- He, Z.; Alexandridis, P. Ionic liquid and nanoparticle hybrid systems: Emerging applications. Adv. Colloid Interface Sci. 2017, 244, 54–70. [Google Scholar] [CrossRef]
- Dupont, M.; MacFarlane, D.; Pringle, J. Thermo-electrochemical cells for waste heat harvesting— Progress and perspectives. Chem. Commun. 2017, 53, 6288–6302. [Google Scholar] [CrossRef]
- Salez, T.J.; Huang, B.T.; Rietjens, M.; Bonetti, M.; Wiertel-Gasquet, C.; Roger, M.; Filomeno, C.L.; Dubois, E.; Perzynski, R.; Nakamae, S. Can charged colloidal particles increase the thermoelectric energy conversion efficiency? Phys. Chem. Chem. Phys. 2017, 19, 9409–9416. [Google Scholar] [CrossRef] [Green Version]
- Huang, B.T.; Roger, M.; Bonetti, M.; Salez, T.J.; Wiertel-Gasquet, C.; Dubois, E.; Gomes, R.C.; Demouchy, G.; Mériguet, G.; Peyre, V.; et al. Thermo-electric diffusion of magnetic nanoparticles: Alternative path toward future thermocell applications. J. Chem. Phys. 2015, 143, 054902. [Google Scholar] [CrossRef]
- Alzahrani, H.; Buckingham, M.A.; Marken, M.; Aldous, L. Success and failure in the incorporation of gold nanoparticles inside ferri/ferrocyanide thermogalvanic cells. Electrochem. Commun. 2019, 102, 41–45. [Google Scholar] [CrossRef]
- deBethune, A.J.; Licht, T.S.; Swendeman, N. The Temperature Coefficients of Electrode Potentials—The Isothermal and Thermal Coefficients—The Standard Ionic Entropy of Electrochemical Transport of the Hydrogen Ion. J. Electrochem. Soc. 1959, 106, 616–625. [Google Scholar] [CrossRef]
- Quickenden, T.I.; Mua, Y. A Review of Power Generation in Aqueous Thermogalvanic Cells. J. Electrochem. Soc. 1995, 142, 3985–3994. [Google Scholar] [CrossRef]
- Würger, A. Thermal non-equilibrium transport in colloids. Rep. Prog. Phys. 2010, 73, 126601. [Google Scholar] [CrossRef]
- Burelbach, J.; Frenkel, D.; Pagonabarraga, I.; Eiser, E. A unified description of colloidal thermophoresis. Eur. Phys. J. E 2017, 41, 7. [Google Scholar] [CrossRef] [PubMed] [Green Version]
- Di Lecce, S.; Bresme, F. Thermal Polarization of Water Influences the Thermoelectric Response of Aqueous Solutions. J. Phys. Chem. B 2018, 122, 1662–1668. [Google Scholar] [CrossRef] [PubMed] [Green Version]
- Stout, R.F.; Khair, A.S. Diffuse charge dynamics in ionic thermoelectrochemical systems. Phys. Rev. E 2017, 96, 022604. [Google Scholar] [CrossRef] [Green Version]
- Salez, T.J.; Nakamae, S.; Perzynski, R.; Mériguet, G.; Cēbers, A.; Roger, M. Thermoelectricity and Thermodiffusion in Magnetic Nanofluids: Entropic Analysis. Entropy 2018, 20, 405. [Google Scholar] [CrossRef] [Green Version]
- Putnam, S.A.; Cahill, D.G. Transport of nanoscale latex spheres in a temperature gradient. Langmuir 2005, 21, 5317–5323. [Google Scholar] [CrossRef] [PubMed]
- Eslahian, K.A.; Maskos, M. Hofmeister effect in thermal field- flow fractionation of colloidal aqueous dispersions. Colloids Surf. A 2012, 413, 65–70. [Google Scholar] [CrossRef]
- Kouyaté, M.; Filomeno, C.; Demouchy, G.; Mériguet, G.; Nakamae, S.; Peyre, V.; Roger, M.; Cebers, A.; Depeyrot, J.; Dubois, E.; et al. Thermodiffusion of citrate-coated γ-Fe2O3 nanoparticles in aqueous dispersions with tuned counter-ions—Anisotropy of the Soret coefficient under magnetic field. Phys. Chem. Chem. Phys. 2019, 21, 1895–1903. [Google Scholar] [CrossRef]
- Braun, D.; Libchaber, A. Thermal force approach to molecular evolution. Phys. Biol. 2004, 1, 1–8. [Google Scholar] [CrossRef]
- Ueno, K.; Inaba, A.; Kondoh, M.; Watanabe, M. Colloidal Stability of Bare and Polymer-Grafted Silica Nanoparticles in Ionic Liquids. Langmuir 2008, 24, 5253–5259. [Google Scholar] [CrossRef]
- Mamusa, M.; Siriex-Plénet, J.; Cousin, F.; Dubois, E.; Peyre, V. Tuning the colloidal stability in ionic liquids by controlling the nanoparticles/liquid interface. Soft Matter 2013, 10, 1097–1101. [Google Scholar] [CrossRef] [Green Version]
- Benlhima, N.; Lemordant, D.; Letellier, P. Propriétés physicochimiques des mélanges eau-nitrate d’éthylammonium fondu, à 298 K. Échelles d’acidité—Solubilités. J. Chim. Phys. Phys. Chim. Biol. 1989, 86, 1919–1939. [Google Scholar] [CrossRef]
- Kanzaki, R.; Uchida, K.; Hara, S.; Umebayashi, Y.; Ishiguro, S.I.; Nomura, S. Acid–Base Property of Ethylammonium Nitrate Ionic Liquid Directly Obtained Using Ion-selective Field Effect Transistor Electrode. Chem. Lett. 2007, 36, 684–685. [Google Scholar] [CrossRef]
- Smith, J.A.; Webber, G.B.; Warr, G.G.; Atkin, R. Rheology of Protic Ionic Liquids and Their Mixtures. J. Phys. Chem. B 2013, 117, 13930–13935. [Google Scholar] [CrossRef] [PubMed]
- Fumino, K.; Wulf, A.; Ludwig, R. Hydrogen Bonding in Protic Ionic Liquids: Reminiscent of Water. Angew. Chem. Int. Ed. 2009, 48, 3184–3186. [Google Scholar] [CrossRef]
- Hayes, R.; Imberti, S.; Warr, G.G.; Atkin, R. Amphiphilicity determines nanostructure in protic ionic liquids. Phys. Chem. Chem. Phys. 2011, 13, 3237–3247. [Google Scholar] [CrossRef]
- Hayes, R.; Bernard, S.A.; Imberti, S.; Warr, G.G.; Atkin, R. Solvation of Inorganic Nitrate Salts in Protic Ionic Liquids. J. Phys. Chem. C 2014, 118, 21215–21225. [Google Scholar] [CrossRef]
- Méndez-Morales, T.; Carrete, J.; Cabeza, O.; Russina, O.; Triolo, A.; Gallego, L.J.; Varela, L.M. Solvation of Lithium Salts in Protic Ionic Liquids: A Molecular Dynamics Study. J. Phys. Chem. B 2014, 118, 761–770. [Google Scholar] [CrossRef]
- D’Angelo, P.; Zitolo, A.; Ceccacci, F.; Caminiti, R.; Aquilanti, G. Structural characterization of zinc(II) chloride in aqueous solution and in the protic ionic liquid ethyl ammonium nitrate by X-ray absorption spectroscopy. J. Chem. Phys. 2011, 135, 154509. [Google Scholar] [CrossRef]
- Serva, A.; Migliorati, V.; Spezia, R.; D’Angelo, P. How Does Ce III Nitrate Dissolve in a Protic Ionic Liquid? A Combined Molecular Dynamics and EXAFS Study. Chem. Eur. J. 2017, 23, 8424–8433. [Google Scholar] [CrossRef] [PubMed]
- Hayes, R.; Warr, G.G.; Atkin, R. At the interface: Solvation and designing ionic liquids. Phys. Chem. Chem. Phys. 2010, 12, 1709–1723. [Google Scholar] [CrossRef] [PubMed]
- Massart, R. Préparation de ferrofluides aqueux en l’absence de surfactant; comportement en fonction du pH et de la nature des ions présents en solution. C. R. Acad. Sci. Paris Série C 1980, 291, 1–3. [Google Scholar]
- Massart, R. Preparation of aqueous magnetic liquids in alkaline and acidic media. IEEE Trans. Mag. Magn. 1981, 17, 1247–1248. [Google Scholar] [CrossRef]
- Bacri, J.C.; Perzynski, R.; Salin, D.; Cabuil, V.; Massart, R. Ionic ferrofluids/ A crossing of chemistry and physics. J. Magn. Magn. Mater. 1990, 85, 27–32. [Google Scholar] [CrossRef]
- Dubois, E.; Cabuil, V.; Boué, F.; Perzynski, R. Structural analogy between aqueous and oily magnetic fluids. J. Chem. Phys. 1999, 111, 7147–7160. [Google Scholar] [CrossRef]
- Massart, R.; Dubois, E.; Cabuil, V.; Hasmonay, E. Preparation and properties of monodispersed magnetic fluids. J. Magn. Magn. Mat. 1995, 149, 1–5. [Google Scholar] [CrossRef]
- Dubois, E.; Perzynski, R.; Boué, F.; Cabuil, V. Liquid-Gas transitions in charged colloidal dispersions: Small Angle Neutron Scattering coupled with phase diagrams of magnetic fluids. Langmuir 2000, 16, 5617–5625. [Google Scholar] [CrossRef]
- Mériguet, G.; Cousin, F.; Dubois, E.; Boué, F.; Cēbers, A.; Farago, B.; Perzynski, R. What tunes the structural anisotropy of magnetic fluids under a magnetic field? J. Phys. Chem. B 2006, 110, 4378–4386. [Google Scholar] [CrossRef]
- Wandersman, E.; Cēbers, A.; Dubois, E.; Mériguet, G.; Robert, A.; Perzynski, R. The cage elasticity and under-field structure of concentrated magnetic colloids probed by small-angle X-ray scattering. Soft Matter 2013, 9, 11480–11489. [Google Scholar] [CrossRef] [Green Version]
- Cousin, F.; Dubois, E.; Cabuil, V. Tuning the interactions of a magnetic colloidal suspension. Phys. Rev. E 2003, 68, 021405. [Google Scholar] [CrossRef] [PubMed]
- Mamusa, M.; Sirieix-Plénet, J.; Cousin, F.; Perzynski, R.; Dubois, E.; Peyre, V. Microstructure of colloidal dispersions in the ionic liquid ethylammonium nitrate: Influence of the nature of the nanoparticles’ counterion. J. Phys. Condens. Matter 2014, 26, 284113. [Google Scholar] [CrossRef]
- Bacri, J.C.; Dumas, J.; Gorse, D.; Perzynski, R.; Salin, D. Ferrofluid viscometer. J. Phys. Lett. 1985, 46, L1199–L1205. [Google Scholar] [CrossRef] [Green Version]
- Wandersman, E.; Dupuis, V.; Dubois, E.; Perzynski, R. Rotational dynamics and aging in a magnetic colloidal glass. Phys. Rev. E 2009, 80, 041504. [Google Scholar] [CrossRef] [PubMed]
- Filomeno, C.L.; Kouyaté, M.; Peyre, V.; Demouchy, G.; Campos, A.F.C.; Perzynski, R.; Tourinho, F.A.; Dubois, E. Tuning the Solid/Liquid Interface in Ionic Colloidal Dispersions: Influence on Their Structure and Thermodiffusive Properties. J. Phys. Chem. C 2017, 121, 5539–5550. [Google Scholar] [CrossRef]
- Evans, D.; Yamauchi, A.; Roman, R.; Casassa, E. Micelle formation in ethylammonium nitrate, a low-melting fused salt. J. Colloid Interface Sci. 1982, 88, 89–96. [Google Scholar] [CrossRef]
- Mamusa, M. Colloidal Interactions in Ionic Liquids. Ph.D. Thesis, Universitée Pierre et Marie Curie, Paris, France, 2014. [Google Scholar]
- Cabreira-Gomes, R.; da Silva, A.F.; Kouyaté, M.; Demouchy, G.; Mériguet, G.; Aquino, R.; Dubois, E.; Nakamae, S.; Roger, M.; Depeyrot, J.; et al. Thermodiffusion of repulsive charged nanoparticles—The interplay between single-particle and thermoelectric contributions. Phys. Chem. Chem. Phys. 2018, 20, 16402–16413. [Google Scholar] [CrossRef]
- Filomeno, C.L.; Kouyaté, M.; Cousin, F.; Demouchy, G.; Dubois, E.; Michot, L.; Mériguet, G.; Perzynski, R.; Peyre, V.; Sirieix-Plénet, J.; et al. Ionic magnetic fluids in polar solvents with tuned counter-ions. J. Magn. Magn. Mat. 2017, 431, 2–7. [Google Scholar] [CrossRef] [Green Version]
- Carnahan, N.F.; Starling, K.E. Thermodynamic Properties of a Rigid-Sphere Fluid. J. Chem. Phys. 1970, 53, 600. [Google Scholar] [CrossRef]
- Barker, J.A.; Henderson, D. Perturbation Theory and Equation of State for Fluids. II. A Successful Theory of Liquids. J. Chem. Phys. 1967, 47, 4714–4721. [Google Scholar] [CrossRef]
- Mähler, J.; Persson, I. A Study of the Hydration of the Alkali Metal Ions in Aqueous Solution. Inorg. Chem. 2012, 51, 425–438. [Google Scholar] [CrossRef] [PubMed]
- McDonald, S.; Elbourne, A.; Warr, G.G.; Atkin, R. Metal ion adsorption at the ionic liquid–mica interface. Nanoscale 2016, 8, 906–914. [Google Scholar] [CrossRef] [PubMed]
- Ivaništšev, V.; O’Connor, S.; Fedorov, M. Poly(a)morphic portrait of the electrical double layer in ionic liquids. Electrochem. Commun. 2014, 48, 61–64. [Google Scholar] [CrossRef] [Green Version]
- Ivanistsev, V.; Fedorov, M.V. Interfaces between Charged Surfaces and Ionic Liquids: Insights from Molecular Simulations. Interface Mag. 2014, 23, 65–69. [Google Scholar] [CrossRef] [Green Version]
- Segura, J.J.; Elbourne, A.; Wanless, E.J.; Warr, G.G.; Voïtchovsky, K.; Atkin, R. Adsorbed and near surface structure of ionic liquids at a solid interface. Phys. Chem. Chem. Phys. 2013, 15, 3320. [Google Scholar] [CrossRef] [Green Version]
- Majee, A.; Würger, A. Collective thermoelectrophoresis of charged colloids. Phys. Rev. E 2011, 83, 061403. [Google Scholar] [CrossRef] [Green Version]
- Würger, A. Transport in Charged Colloids Driven by Thermoelectricity. Phys. Rev. Lett. 2008, 101, 108302. [Google Scholar] [CrossRef] [PubMed] [Green Version]
- Piazza, R.; Parola, A. Thermophoresis in colloidal suspensions. J. Phys. Condens. Matter 2008, 20, 153102. [Google Scholar] [CrossRef]
- Batchelor, G.K. Sedimentation in a dilute polydisperse system of interacting spheres. Part 1. General theory. J. Fluid Mech. 1982, 119, 379–408. [Google Scholar] [CrossRef] [Green Version]
- Demouchy, G.; Mezulis, A.; Bée, A.; Talbot, D.; Bacri, J.C.; Bourdon, A. Diffusion and thermodiffusion studies in ferrofluids with a new two-dimensional forced Rayleigh-scattering technique. J. Phys. D Appl. Phys. 2004, 37, 1417–1428. [Google Scholar] [CrossRef]
- Sarkar, M.; Riedl, J.; Demouchy, G.; Gélébart, F.; Mériguet, G.; Peyre, V.; Dubois, E.; Perzynski, R. Inversion of thermodiffusive properties of ionic colloidal dispersions in water-DMSO mixtures probed by forced Rayleigh scattering. Eur. Phys. J. E 2019, 42, 2979–2989. [Google Scholar] [CrossRef]
- Nagasaka, Y.; Hatakeyama, T.; Osuka, M.; Nagashima, A. Measurement of the thermal diffusivity of liquids by the forced Rayleigh scattering method: Theory and experiment. Rev. Sci. Instrum. 1988, 59, 1156. [Google Scholar] [CrossRef]
- Nernst, W. Die elektromotorische wirksamkeit der jonen. Z. Für Phys. Chem. 1889, 4, 129–181. [Google Scholar]
- Debye, P.; Hückel, E. Zur Theorie der Elektrolyte. I. Gefrierpunktserniedrigung und verwandte Erscheinungen. Phys. Z. 1923, 24, 185–206. [Google Scholar]
- Agar, J.N.; Turner, J.C.R. Thermal Diffusion in Solutions of Electrolytes. Proc. R. Soc. Lond. A Math. Phys. Eng. Sci. 1960, 255, 307–330. [Google Scholar]
- Laux, E.; Jeandupeux, L.; Uhl, S.; Keppner, H.; Pérez López, P.; Sanglard, P.; Vanoli, E.; Marti, R. Novel Ionic Liquids for Thermoelectric Generator Devices. Mater. Today Proc. 2019, 8, 672–679. [Google Scholar] [CrossRef]
- Agar, J.N.; Mou, C.Y.; Lin, J.L. Single-ion heat of transport in electrolyte solutions: A hydrodynamic theory. J. Phys. Chem. 1989, 93, 2079–2082. [Google Scholar] [CrossRef]
- Salez, T.J.; Kouyaté, M.; Filomeno, C.; Bonetti, M.; Roger, M.; Demouchy, G.; Dubois, E.; Perzynski, R.; Cebers, A.; Nakamae, S. Magnetically enhancing the Seebeck coefficient in ferrofluids. Nanoscale Adv. 2019, 1, 2979–2989. [Google Scholar] [CrossRef] [Green Version]
- Salez, T.J. Effets thermoélectriques dans des liquides complexes: Liquides ioniques et ferrofluides. Ph.D. Thesis, Université de recherche Paris Sciences et Lettres, École Normale Supérieure, Paris, France, 2017. [Google Scholar]


| RTIL | Nanoparticle | Year | Reference |
|---|---|---|---|
| BMI-BF | -FeO and CoFeO | 2009 | [8] |
| EMI-EtSO | FeO | 2011 | [9] |
| BMI-NTf | -FeO, FeO and CoFeO | 2012 | [10] |
| EMI-Ac, EMI-SCN, BMI-BF, EAN | -FeO | 2011 | [11] |
| EAN | -FeO | 2015 | [12] |
| CMI-NTf | FeO | 2015 | [13] |
| EMI-NTF | -FeO | 2018 | [14] |
| CMI-BF | FeO | 2018 | [15] |
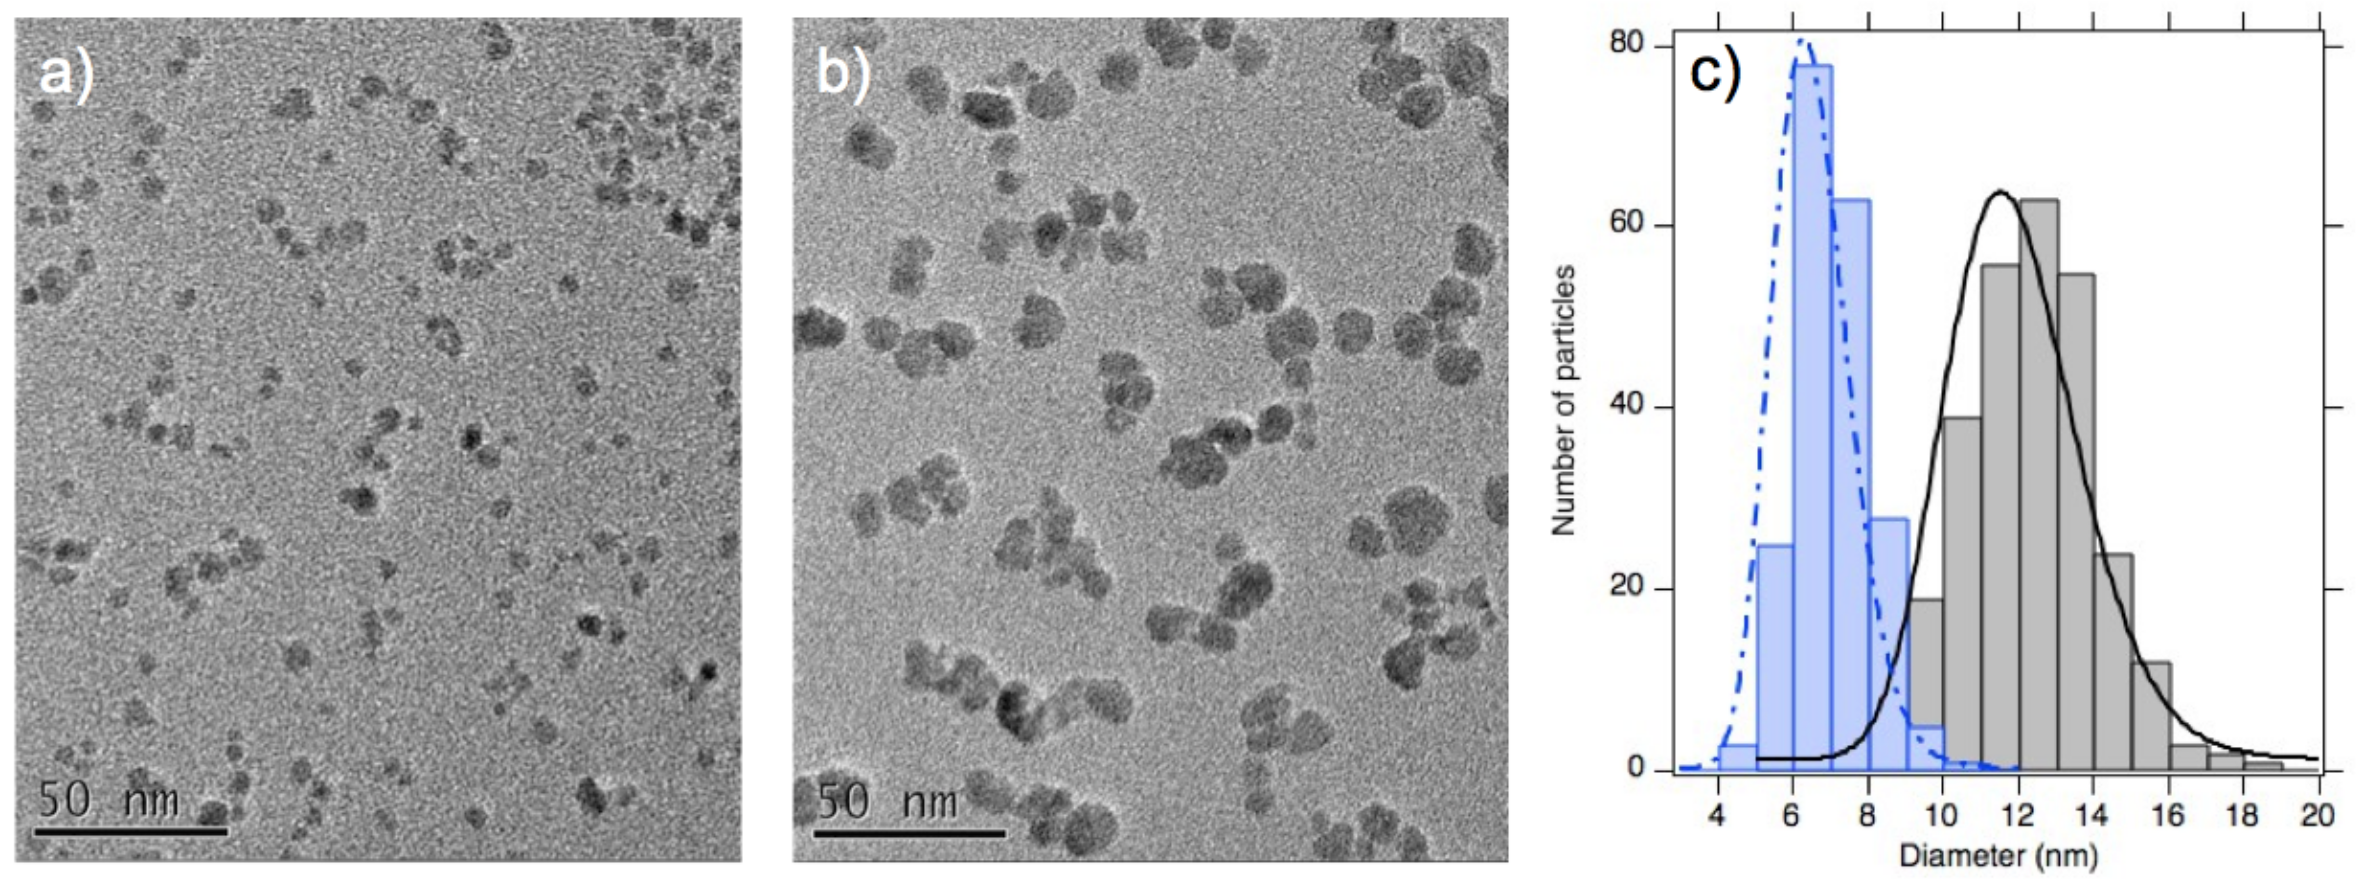
| Sample | d (nm) | d (nm) | ||
|---|---|---|---|---|
| A | 6.5 | 0.22 | 6.9 | 0.21 |
| B | 11.3 | 0.20 | 11.2 | 0.26 |
| A | D | [Na] in EAN | nb. of Na | Ionic Radius |
|---|---|---|---|---|
| (10 m s) | mol/L | per nm | (Å) | |
| 4.6 ± 0.5 | 1.2 | 0.11 | 0.6 | 1.0 |
| [] | ||
|---|---|---|
| (K) | mol/L | |
| ± 55 ± 15 | +6.0 ± 1.6 | 0.4 ± 0.1 |
© 2020 by the authors. Licensee MDPI, Basel, Switzerland. This article is an open access article distributed under the terms and conditions of the Creative Commons Attribution (CC BY) license (http://creativecommons.org/licenses/by/4.0/).
Share and Cite
Bhattacharya, K.; Sarkar, M.; Salez, T.J.; Nakamae, S.; Demouchy, G.; Cousin, F.; Dubois, E.; Michot, L.; Perzynski, R.; Peyre, V. Structural, Thermodiffusive and Thermoelectric Properties of Maghemite Nanoparticles Dispersed in Ethylammonium Nitrate. ChemEngineering 2020, 4, 5. https://0-doi-org.brum.beds.ac.uk/10.3390/chemengineering4010005
Bhattacharya K, Sarkar M, Salez TJ, Nakamae S, Demouchy G, Cousin F, Dubois E, Michot L, Perzynski R, Peyre V. Structural, Thermodiffusive and Thermoelectric Properties of Maghemite Nanoparticles Dispersed in Ethylammonium Nitrate. ChemEngineering. 2020; 4(1):5. https://0-doi-org.brum.beds.ac.uk/10.3390/chemengineering4010005
Chicago/Turabian StyleBhattacharya, Kakoli, Mitradeep Sarkar, Thomas J. Salez, Sawako Nakamae, Gilles Demouchy, Fabrice Cousin, Emmanuelle Dubois, Laurent Michot, Régine Perzynski, and Véronique Peyre. 2020. "Structural, Thermodiffusive and Thermoelectric Properties of Maghemite Nanoparticles Dispersed in Ethylammonium Nitrate" ChemEngineering 4, no. 1: 5. https://0-doi-org.brum.beds.ac.uk/10.3390/chemengineering4010005