Article

Numerical Analysis of Gas Hold-Up of Two-Phase Ebullated Bed Reactor

1
Department of Chemical Engineering, University of Technology-Iraq, Baghdad 10066, Iraq
2
Department of Chemical Engineering and Petroleum Industries, Al-Mustaqbal University College, Babylon 51001, Iraq
3
Department of Energy Engineering, Qom University of Technology, Qom 1519-37195, Iran
4
Mechanical Engineering and Energy Processes, Southern Illinois University, Carbondale, IL 62901, USA
5
Department of Mechanical Engineering, University of Technology-Iraq, Baghdad 10066, Iraq
*
Author to whom correspondence should be addressed.
Submission received: 28 August 2023 / Revised: 26 September 2023 / Accepted: 12 October 2023 / Published: 20 October 2023

Abstract

:
Due to the significant increase in heavy feedstocks being transported to refineries and the hydrocracking process, the significance of adopting an ebullated bed reactor has been reemphasized in recent years. The predictive modelling of gas hold-up in an ebullated two-phase reactor was performed using 10 machine learning methods based on support vector machine (SVM) and Gaussian process regression (GPR) in this study. In an ebullated bed reactor, the impacts of three features, namely liquid velocity, gas velocity, and recycling ratio, on the gas hold-up were examined. The liquid velocity has the most impact on the predicted gas hold-up, according to the feature significance analysis. The rotational-quadratic, squared-exponential, Matern 5/2, and exponential kernel functions integrated with the GPR models and the linear, quadratic, cubic, fine, medium, and coarse kernel functions integrated with the SVM model performed well during training and testing, with the exception of the fine SVM model, whose R2 is very low. According to the R2 > 0.9 and low RMSE and MAE values, the rotational-quadratic, squared-exponential, and Matern 5/2 GPR models performed the best.

1. Introduction

Industries have shown considerable interest in ebullated bed reactors (EBRs), a kind of multi-stage catalytic reactor often used in hydrocracking and hydro-desulfurization of petroleum waste [1]. Effective performance of the EBRs requires a three-phase system with the gas phase consisting of hydrogen and partially vaporized hydrocarbons, the liquid phase being the non-evaporated heavy parts of the hydrocarbon feed, and the solid phase being the catalyst, the physical properties of which cause liquefaction within the reactor [2]. Heavy oil upgrading frequently makes use of ebullated bed reactors for thermally cracking and catalytically hydrogenating atmosphere and vacuum tower waste [3]. Significant attention has been paid to the implications of the internal recycling geometry on column performance, since these units have historically encountered very high solids-free gas hold-ups exceeding 30%, dislodging the heavy feed and restricting product throughput [4]. In an earlier attempt to lessen gas hold, a recycling pan was installed at the head of the ebullated bed reactor’s internal recycle line [5]. This layout was introduced in the freeboard area of the reactor to improve gas disengagement above the catalyst bed [6]. Additional testing revealed that this first-generation recycling pan produced a stable, gas-rich effervescent foam zone at the top of the reactor that extended down into the recycle line, hence enhancing gas re-entrainment and gas hold-up [2,3]. Since then, the industrial design community has come up with next-generation separators that can cut overall gas hold-up by a few percent, which translates to massive gains in liquid feed output [7]. Heavy crude oil processing has significant challenges that can be mitigated with advances in this process and related technologies [8]. When new laws or shifts in the selectivity of the process cause challenges for H-Oil industrial licensees, a prompt response is essential. Chemical engineering studies and the accompanying scale-up/down techniques in facility design (including the cold mock-up and bench unit) are some of the key technological means of meeting these needs. These techniques and resources should be easy to use while still mimicking real-world factory settings as closely as possible. New approaches to solving these issues are needed quickly by engineers and academics due to the complexity of the process and petroleum inputs.
Several experimental studies have been conducted on the application of ebullated bed reactors for the hydrotreating of heavy crude oil. Mowla and Ioannidis [9], in their investigation, used a cold model experimental setup consisting of air, water, and solid particles to examine the hydrodynamics of EBRs. Individual hold-ups and dispersion coefficients in a lab-scale ebullated bed column were estimated by the authors using the pressure gradient method and the residence time distribution (RTD) approach. In addition, the system’s hydraulic efficiency was calculated. The findings revealed that individual hold-ups and dispersion coefficients were found to be most affected by the liquid internal recycle ratio that typified the EBRs. To accurately forecast phase hold-ups and dispersion coefficients, empirical correlations were developed. Hassan et al. [10] performed a hydrodynamic study of an EBR used for heavy oil cracking. Their findings demonstrated that the individual hold-ups and bubble size are mostly influenced by the liquid internal reflux ratio, which is characteristic of ebullated bed reactors. Lane et al. [3] reported a fully functioning three-dimensional computational fluid dynamic framework for simulating the gas separation area in EBR. This framework helps to capture fluid motion in both the tangential and rotational directions as well as the transient dynamics of gas separation.
Since hydrodynamics and operating conditions are crucial to the efficiency and performance of EBR used in industrial hydro-processing, it is expedient to investigate the inter-relationship between these operating parameters and the gas hold-up, which is the focus of this study [2]. Besides experimental studies, modelling approaches have been employed to investigate gas hold-up in an ebullated bed reactor based on different conditions. Mowla et al. [11] employed a two-fluid model to investigate the precision of models in predicting gas hold-up inside both the pilot scale system and the recycling line. In the context of homogenous flow, when the appropriate bubble size is considered, the models accurately estimated the gas hold-up in the column with an error rate of less than 5%. In contrast to the empirical results, the models did not anticipate the presence of any gas entrained in the recycling line. Mach et al. [12] performed a fluid dynamic modelling of a commercial ebullated bed hydroprocessor. The authors performed a sensitivity analysis to examine the influence of several factors on the flow rates of recycled gas and liquid, the distribution of bubble sizes, and the bed gas hold-up. The experimental results indicate that a slight shift in the bubble size distribution towards bigger sizes has a notable impact on the bed gas hold-up. This finding suggests that modifying or redesigning the distributor might potentially enhance the capacity of the hydroprocessor. Although computational fluid dynamics have been employed to model the effect of different conditions in an ebullated bed reactor, the non-linear relationship between the process conditions and the gas hold-up has not been investigated. This gap can be filled by employing machine learning algorithms such as support vector machine regression (SVM) and Gaussian process regression (GPR) to model the gas hold-up of a two-phase ebullated bed reactor.
Predictive modelling using machine learning algorithms such as SVM and GPR has been reported for several processes. Kojić and Omorjan [13] employed SVM for modelling the prediction of gas hold-up based on hydrodynamic parameters in an airlift reactor. The authors’ statistical analysis of the model indicated that the suggested generalized SVM model exhibited superior predictive accuracy compared to Artificial Neural Networks (ANN), as evidenced by a lower average absolute relative error for the gas hold-up. Gandhi and Joshi [14] employed a hybrid Genetic Algorithm-Support Vector Regression (GA-SVR) approach to construct a data-driven model for determining the total gas hold-up. The SVR-based model accurately estimates the values of gas hold-up, demonstrating a high level of agreement with the actual values. Unlike SVM, there is a dearth of studies on the application of GPR for modelling the prediction of gas hold-up. However, the GPR model has been employed to model different processes such as the prediction of hydrodynamic interactions [15], the prediction of dynamic viscosity in a nanofluid [16], and the prediction of powder hydrodynamics in a screw reactor [17]. An extensive literature search showed that SVM and GPR models have not been comparatively employed for modeling gas hold-up of two-phase ebullated bed reactor. Therefore, this study focuses on the application of SVM and GPR to model the gas hold-up of a two-phase ebullated bed reactor. The application of SVM and GPR in this study will help to develop a predictive model whereby the non-linear relationship between the input features and the target response can be employed to predict the output. Hence, the algorithm could subsequently be employed to improve the process performance.

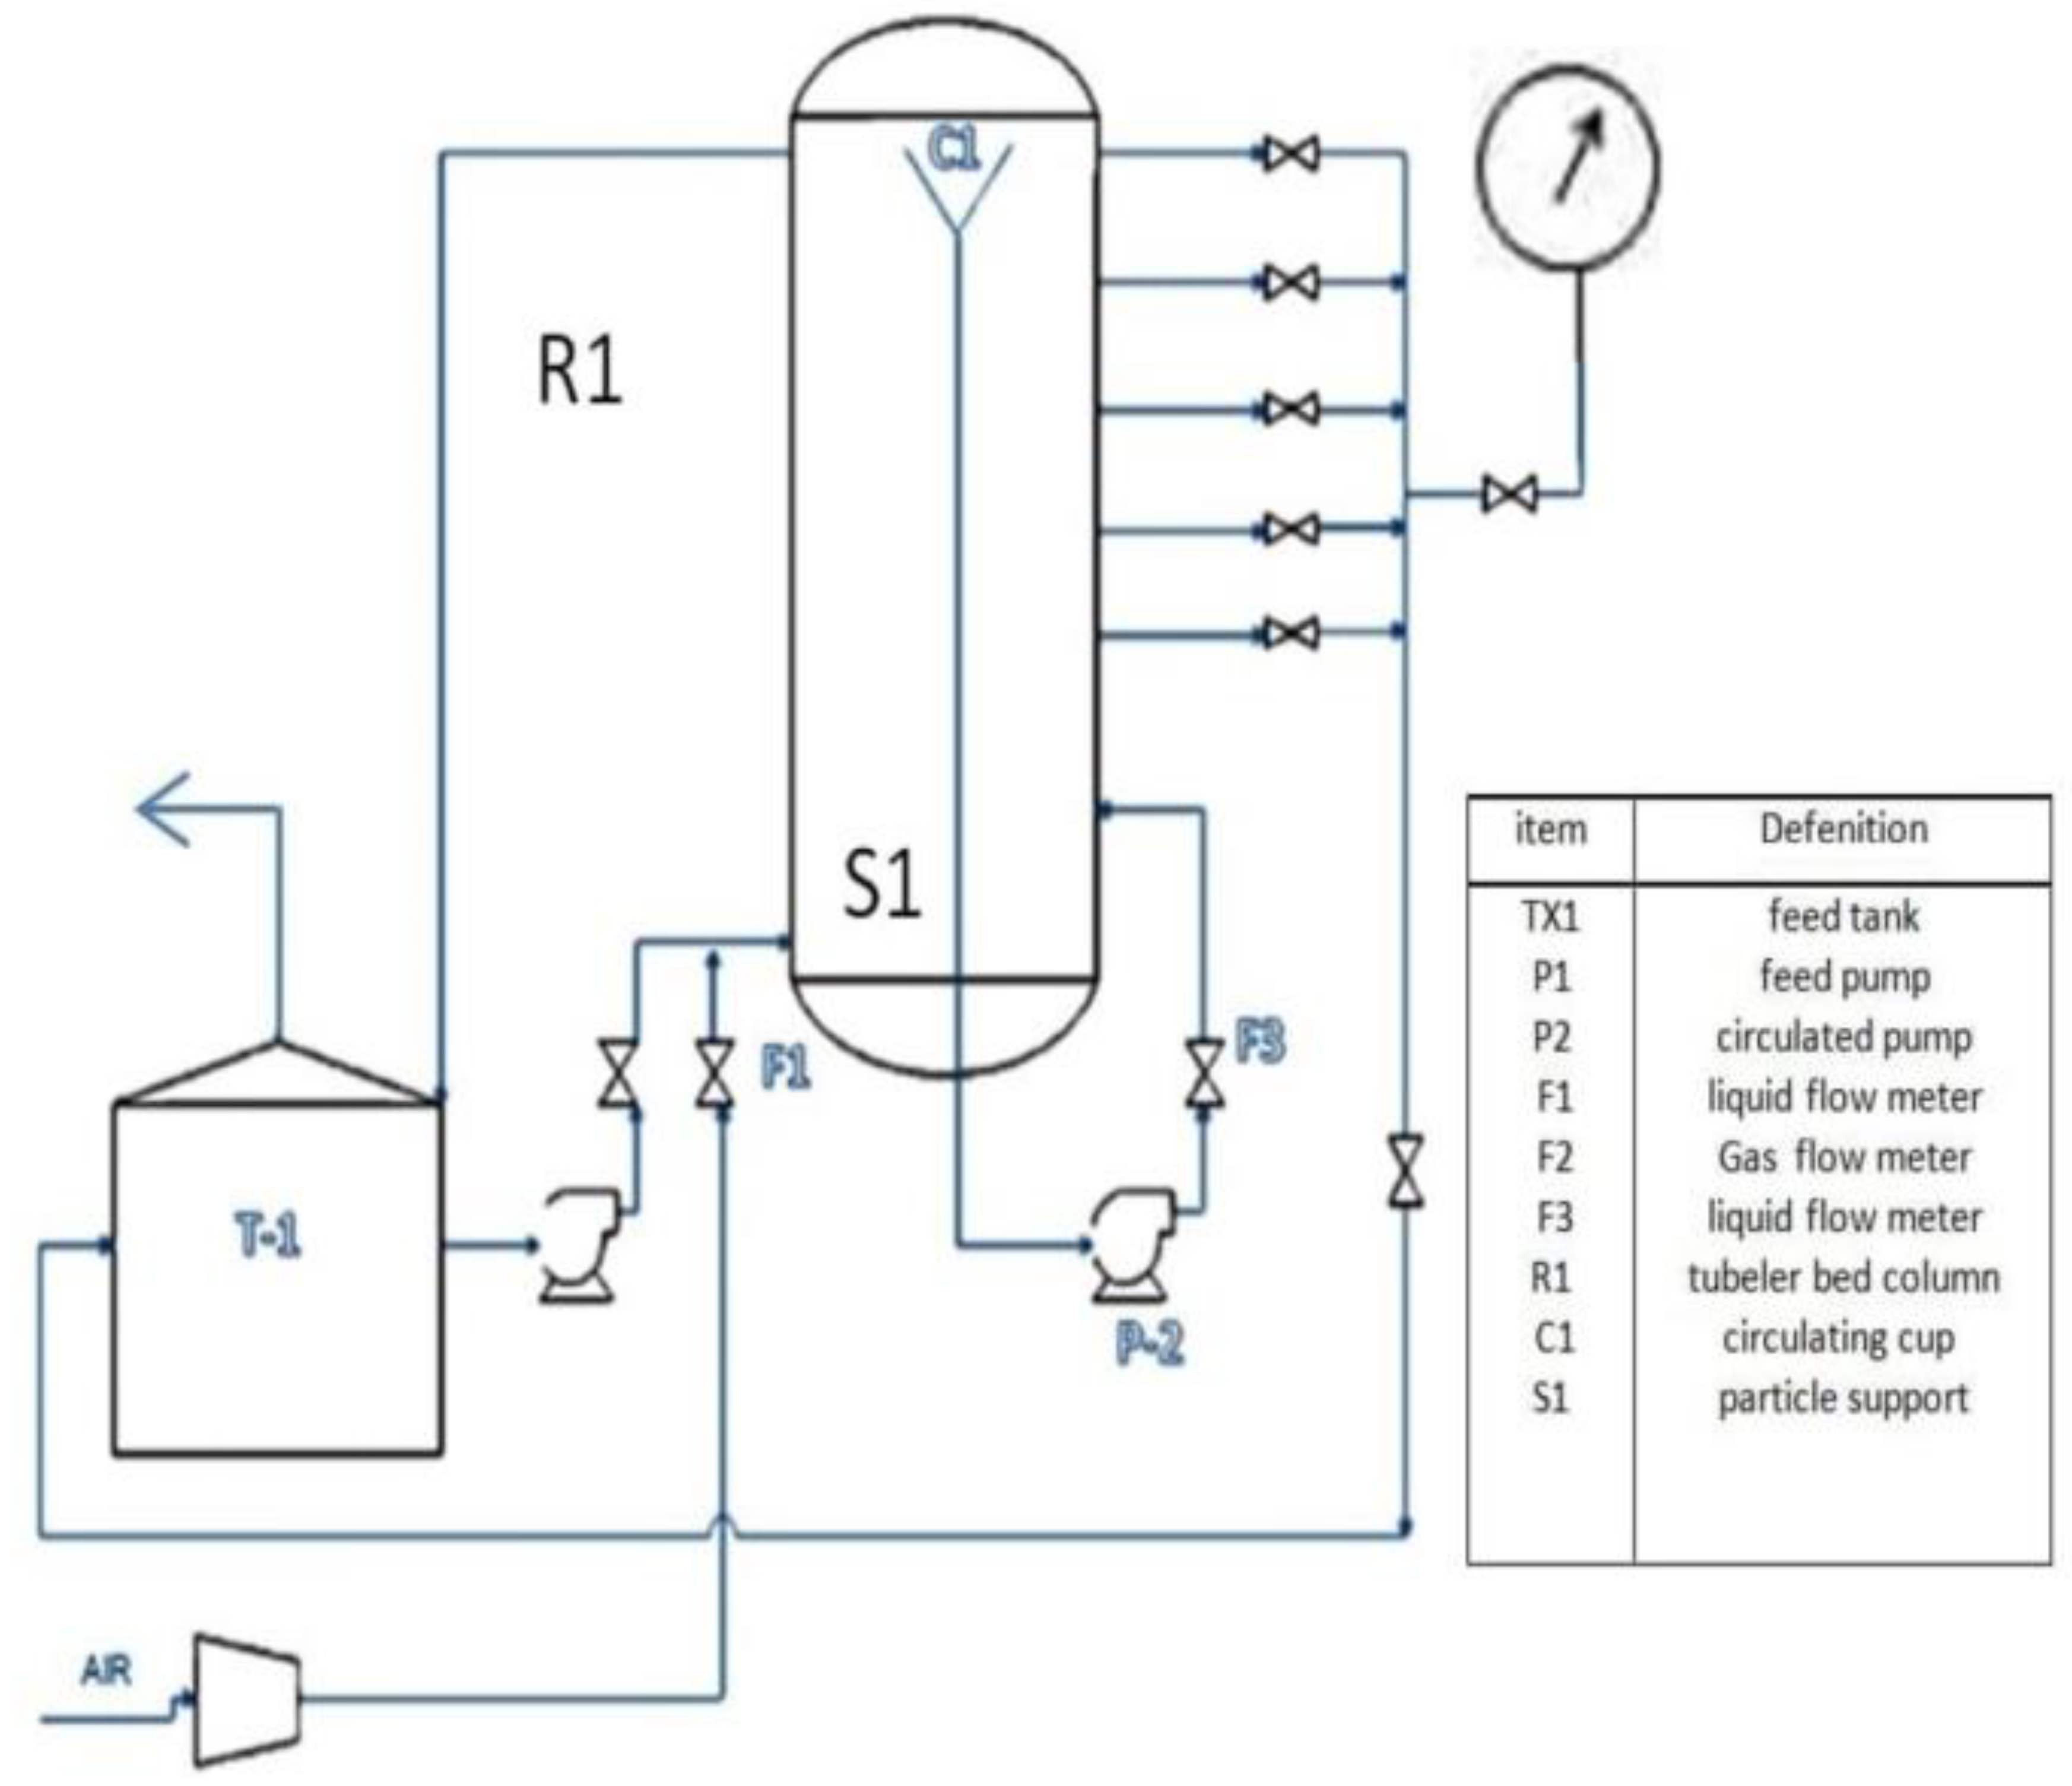
2. Materials and Methods

Figure 1 depicts the experimental setup that was employed in this study for the data acquisition. The experimental setup consisted of a 2.0 m tall exterior column constructed from frosted glass acrylic with a diameter of 82 mm and a thickness of 5 mm. Non-Newtonian liquid consisting of water and polymethyl cellulose (PMC) (0.2 wt%) was used to fill the 40 L feeding tank. The trials for this study included a range of liquid flow rates (0.5, 1, 1.5 cm/s) and varying petrol pumping rates (1.5, 3, 4.5 cm/s), with liquid and air entering the column from the bottom through the pre-mixing region underneath the distributor network. To improve the dispersion of liquid and gas, this section has ceramic and plastic rings. Water was primarily introduced as the first step, and the liquid feed pump (P1) was then turned on. For the recycled liquid to be recovered to the recycling beaker near the top of the reactor via an internal return line of the uniform diameter of 25 mm located inside the reactor vessel with the recirculation pump (F3), the recycling pump (P2) in the column was quickly turned on at different recycle ratios (1, 1.5, and 2). The use of different recycle ratios helps to understand the impact of recycling the liquid on the gas hold-up. The recycle ratio was selected using a step increase of 0.5 to determine an incremental effect on the gas hold-up. The air for the column was supplied through the flowmeter (F2) at the desired flow rate using a compressor. To monitor the local pressure inside the column, each pressure tap was individually connected to a pressure gauge (Bourdon gauge, Germany, with a gauge measure of 0–200 mbar). Fifteen minutes was enough time for the experiment to attain a steady state. The average data were used after each run had been performed two to three times.

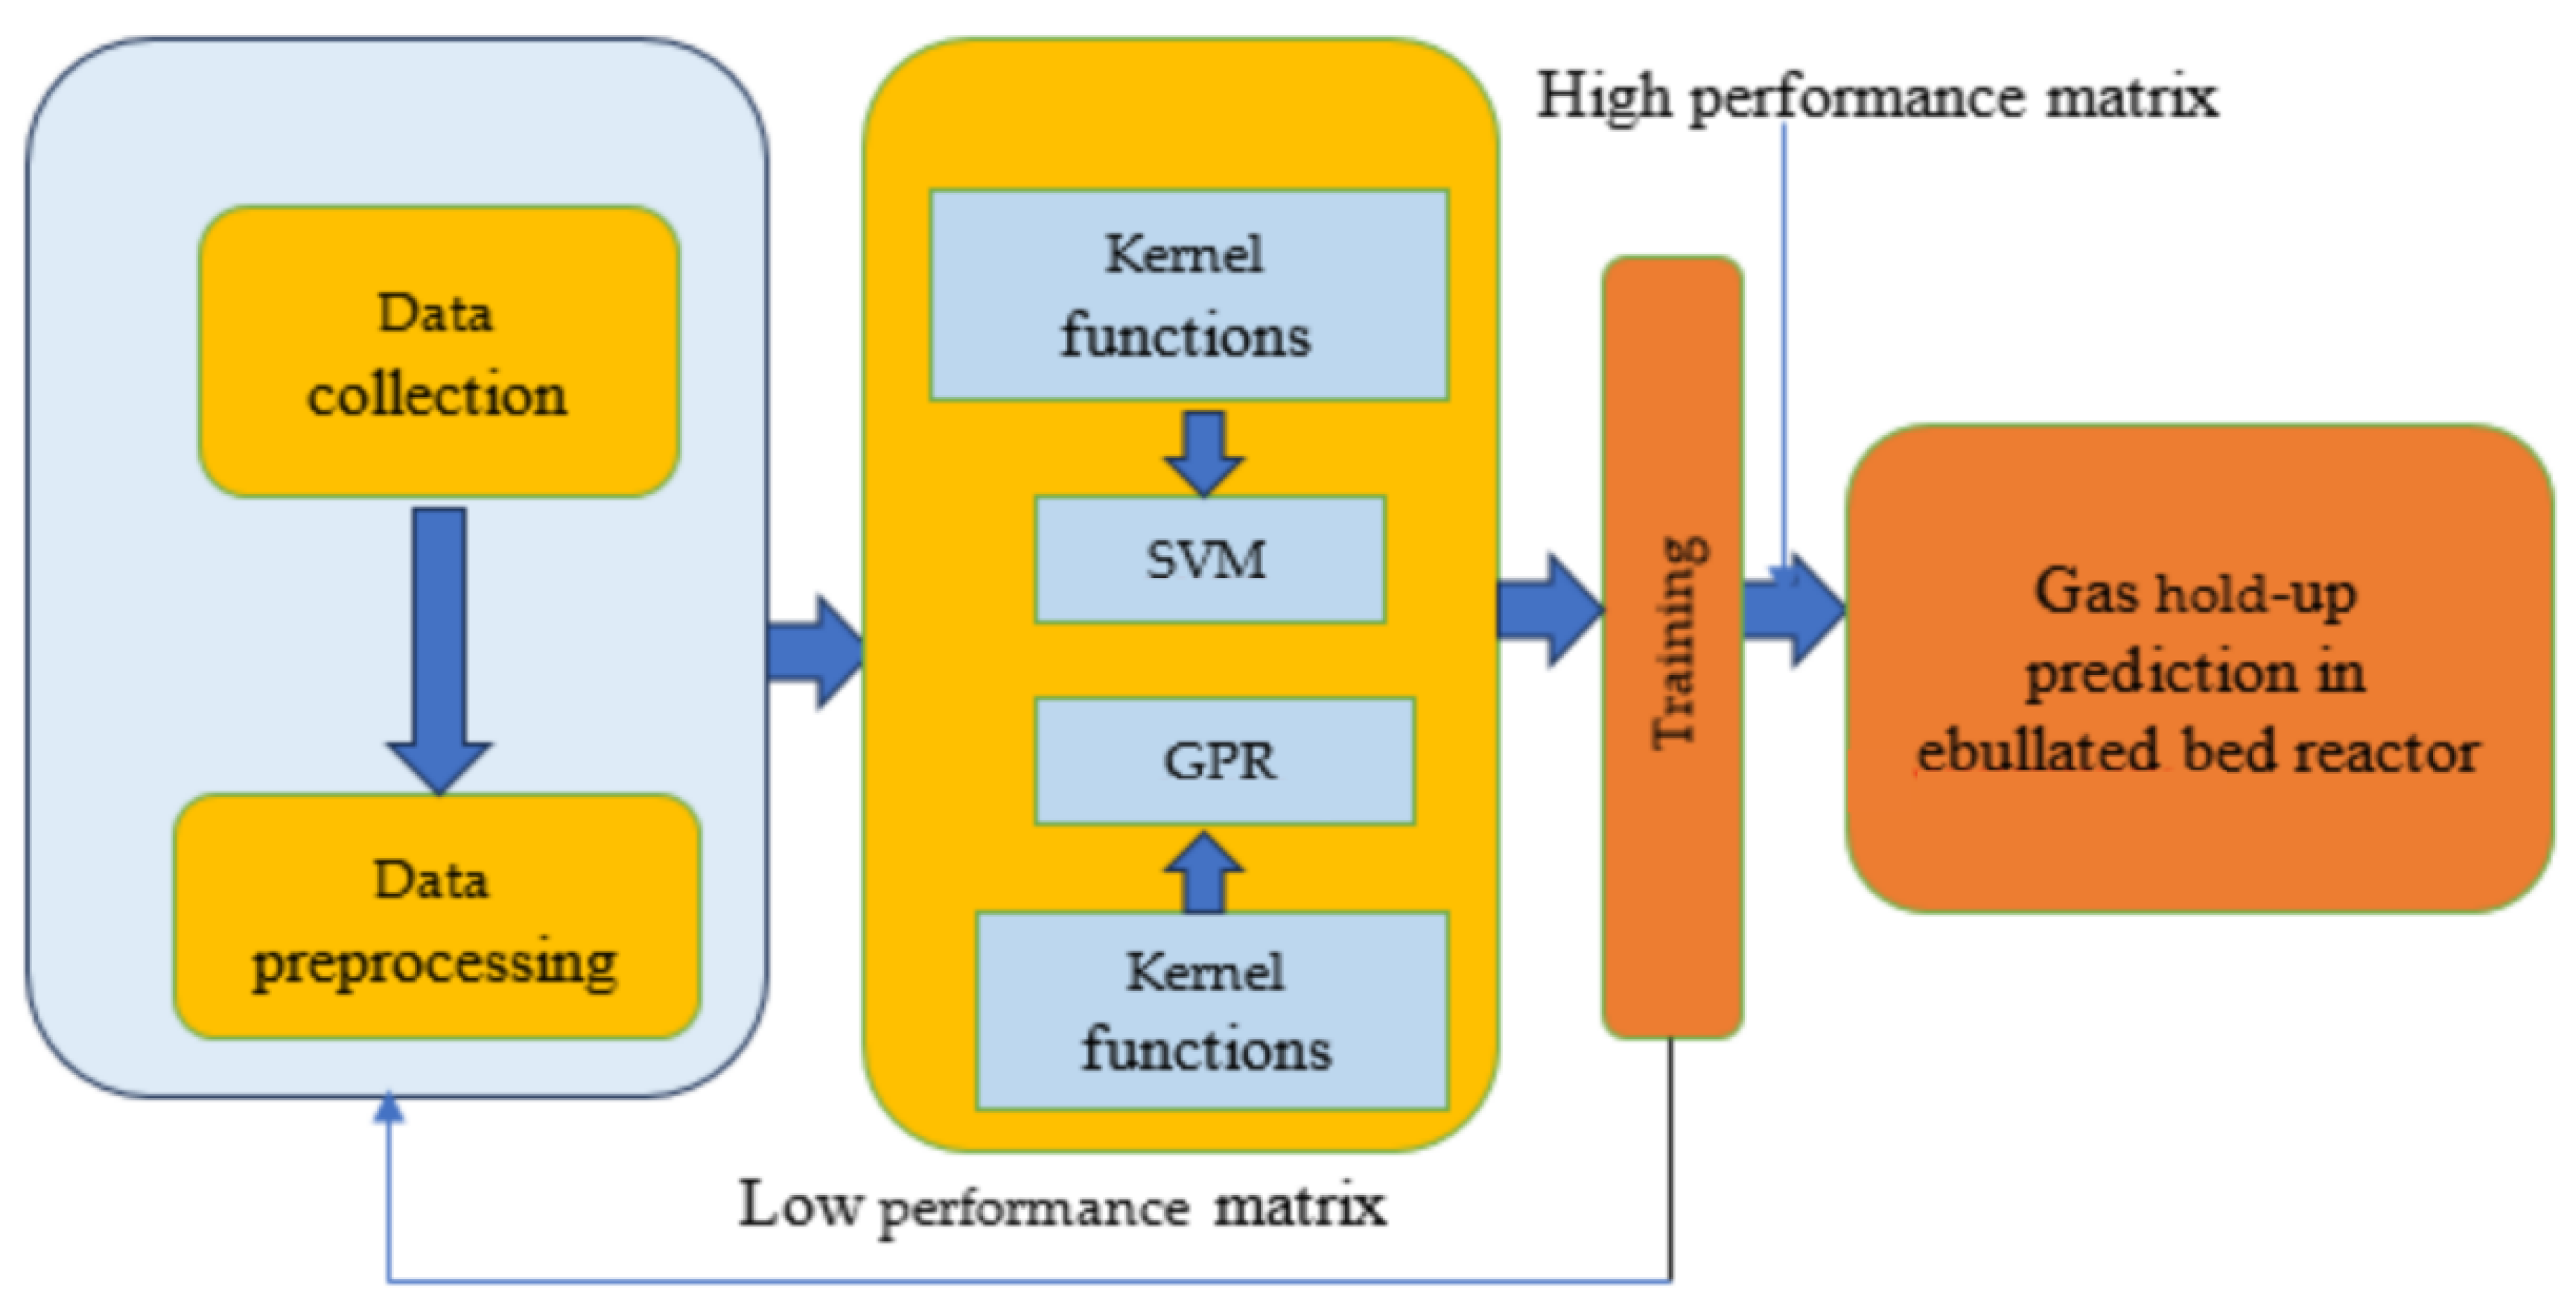
3. Model Description and Configurations

3.1. Support Vector Machine Regression

Support vector machine (SVM) analysis was created by Vapnik and his colleagues [18], and it has since grown to be a well-known machine learning method for classification and regression. SVM regression is a type of nonparametric approach since it makes use of kernel functions [19]. Because it can learn nonlinear decision surfaces, it is flexible and performs well with both a small number of instances and a large number of predictors [20]. In order to represent the observations (data) as points in space, the SVM technique maps the original observations of different classes (categories) such that they are separated by an evident gap that is as big as possible. Future observations are predicted by projecting them into the same region, where they are then divided into two groups based on whether or not they fall on the boundary [21]. The support vector regression (SVR) method is based on the SVM algorithm for binary response variables. The main principle of the method is to only utilize residuals that are less in absolute value than the constant in order to fit a tube with a width of the data.

3.2. Gaussian Process Regression

GPR is categorized as a kernel-based approach in machine learning since it may employ a number of kernels depending on the data being studied [22]. For the retrieval of biophysical parameters in remote sensing applications, several kernel-based strategies have been investigated in the literature, including support vector machine (SVM), relevance vector machine (RVM), and GPR. In particular, GPR has shown a notable improvement over earlier non-linear non-parametric methods [23]. In this study, we investigate the parallels and discrepancies between SVR and GPR. To address problems with regression and classification, non-parametric probabilistic techniques like Gaussian processes (GPs) are used [24]. A Gaussian process may be described by the mean and covariance (or kernel) function in the same manner as a Gaussian distribution. The kernel assesses the comparability of the traits that GPR uses to forecast the biophysical parameters [25]. A Bayesian framework is used to teach general practitioners.

3.3. Effect of Kernel Functions on Model Performance

The kernel function is a mathematical operation that transforms data from its original dimension to a higher dimension, producing a scalar output by the use of dot products between vectors [26]. The output of a kernel approach is scalar, facilitating the reduction in dimensionality and enabling the avoidance of computationally intensive tasks associated with classifying categories [27]. The phenomenon being seen can be attributed to the efficacy of the kernel trick. The use of kernels in the field of machine learning is employed as a means to effectively handle the presence of nonlinearity within the dataset. The inclusion of a user-defined kernel function, also known as a similarity function, introduces an additional dimension to the dataset, enabling regression analysis of the datasets. In this study, the effect of different kernel functions on the performance of the SVM and GPR models was investigated.

3.4. Model Configuration and Training

The stages involved in the modeling process are depicted in Figure 2. This consists of the data collection, data pre-processing, configuration of the model, training, and prediction. The SVM and GPR were configured to incorporate different kernel functions. The effect of using six different kernel functions such as linear, quadratic, cubic, fine, medium, and course on the SVM model was investigated. The effects of using four different kernel functions such as rotational-quadratic, squared-exponential, Matern 5/2, and exponential on the GPR model were also investigated. To obtain optimal results from machine learning models, hyperparameter adjustment is required. Tuning is the process of selecting the best possible value for a model’s parameters by ranking the available regressors. Different hypermeters were employed to tune the models for the best performance. Model performance is frequently impacted by underfitting and overfitting. This study employed a five-fold cross-validation validation process to demonstrate a satisfactory compromise between the model’s bias and variance. The goal of supervised learning’s training procedure is to decrease the error between the predicted and observed value. To train the model, the cross-validation algorithm was employed to make sure the model was appropriate for the prediction of the target. Both feature selection and hyperparameter adjustment are vital for successful training. The five-fold cross-validation method uses a five-fold data split during training. The model is taught using the four folds of data and tested using the left-over fold of data throughout the training phase. The model accuracy was evaluated using the coefficient of determination (R2), root mean square error (RMSE), and mean absolute error (MAE).

3.5. Feature Selection

The importance and relevance of the three features used in this study on the predicted output were examined using an F-test, and significance was ranked then using the p-values of the F-test statistics. Each F-test tests the hypothesis that the response values grouped by predictor variable values are drawn from populations with the same mean against the alternative hypothesis that the population means are not all the same. Scores correspond to –log(p).

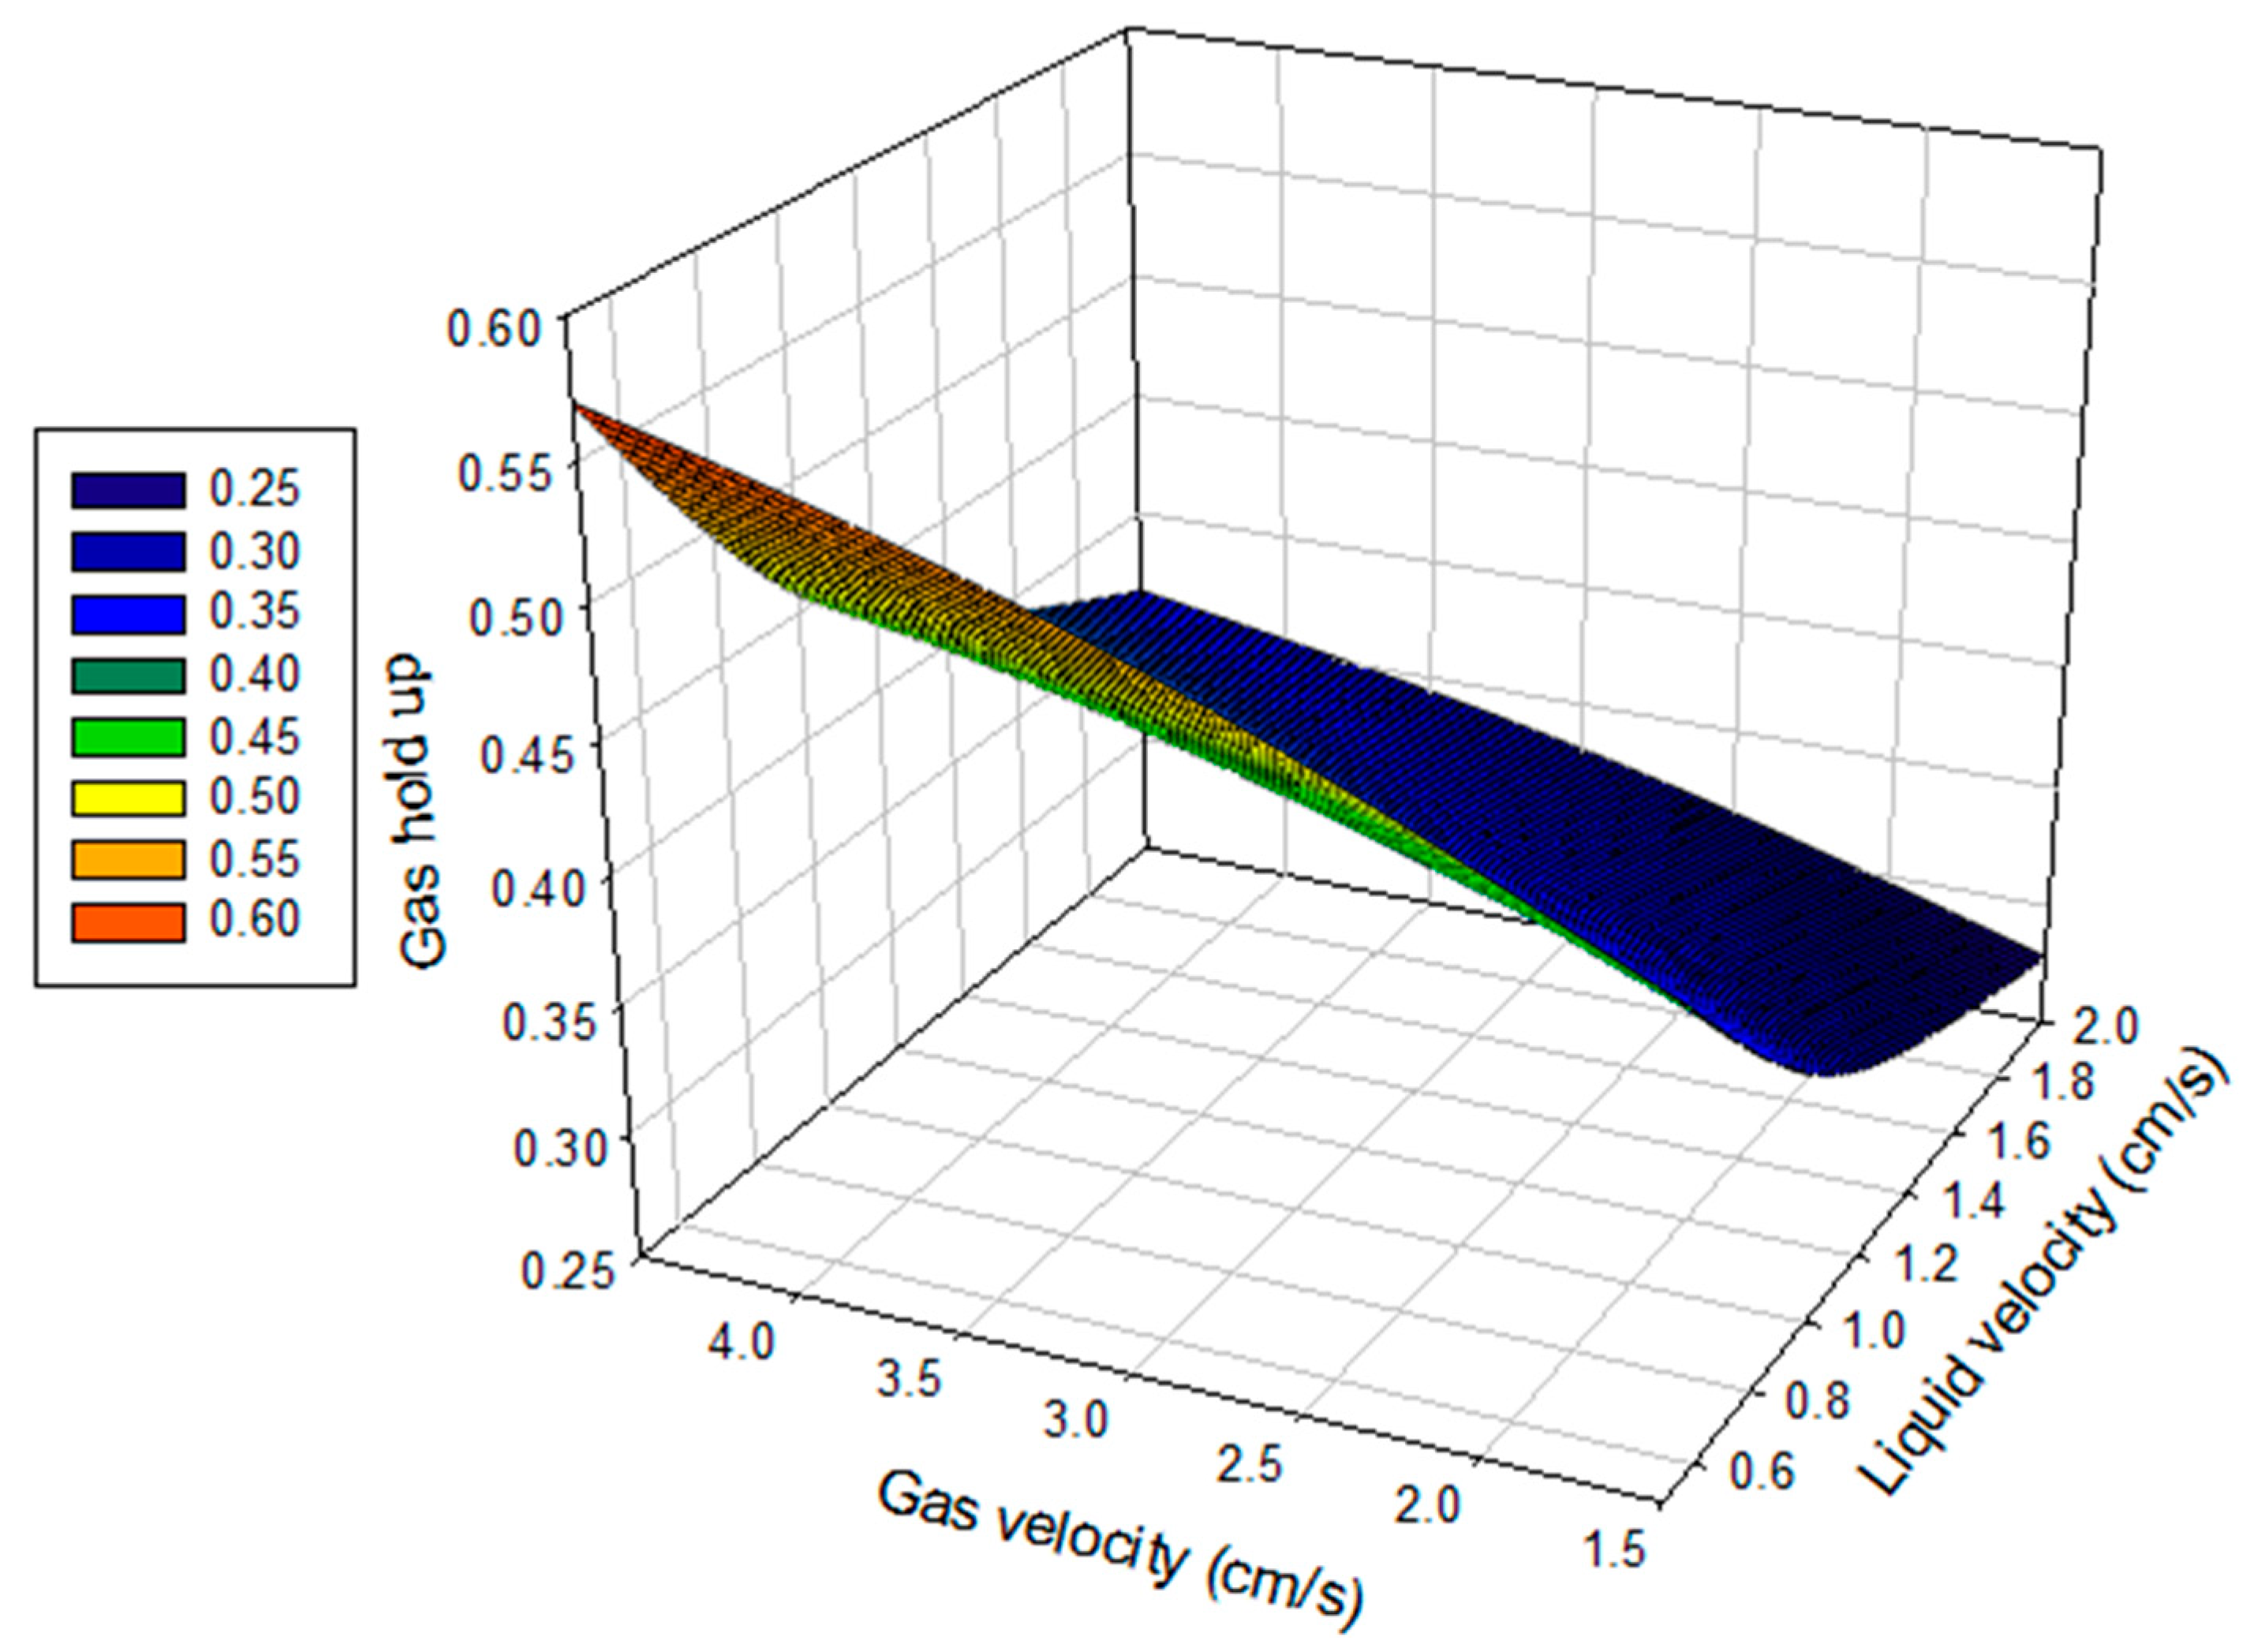
4. Results and Discussion

The features used in this study include liquid velocity, gas velocity, and recycle ratio, while the targeted output is the gas hold-up. Some studies have shown that gas hold-up has a positive correlation with gas velocity and liquid velocity when considering various gas hold-up conditions [27,28,29]. At low surface gas velocities, the liquid velocity is very modest, resulting in a negligible impact of velocity gradients on bubbles. Consequently, the bubbles tend to disperse uniformly in the radial direction. In this study, 37 datasets consist of input features such as the liquid velocity, the gas velocity, and the recycle ratio as well as the gas hold-up, which is the targeted output. The descriptive statistics for the input features and the targeted parameters are summarized in Table 1. The relationship between liquid velocity, gas velocity, and gas hold-up is displayed in Figure 3.

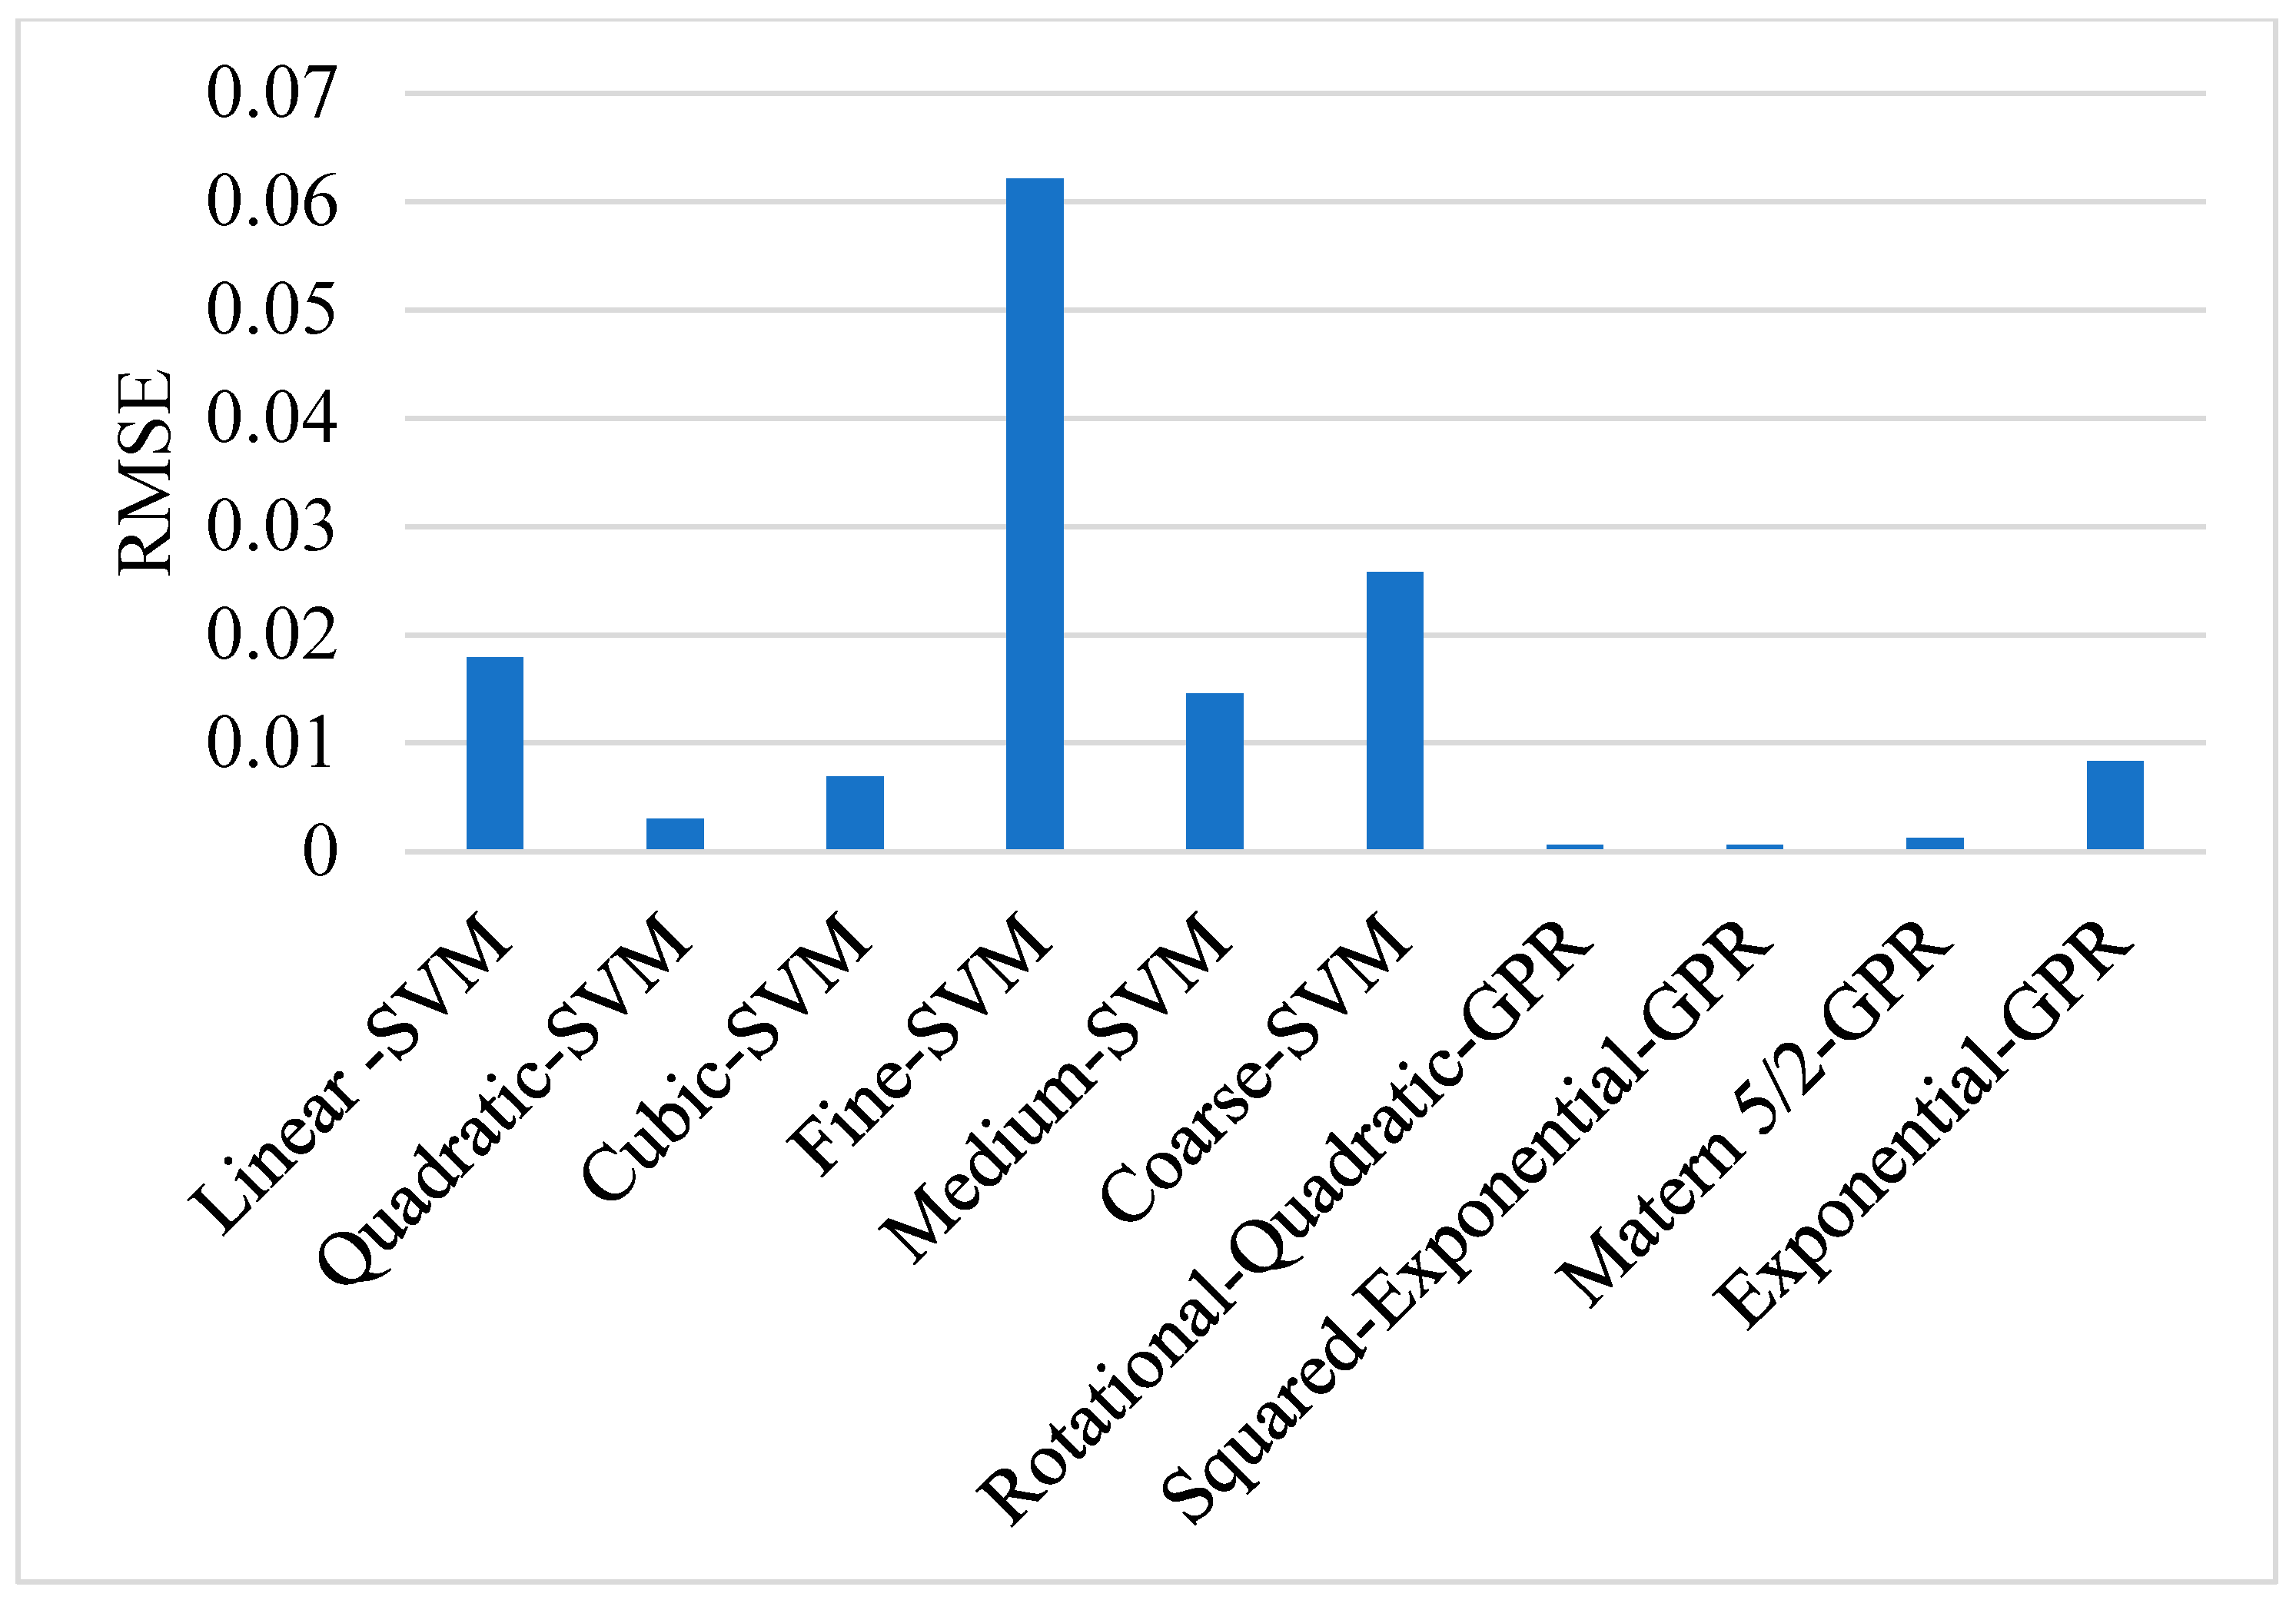
4.1. Hyperparameter Tuning

In order to obtain a better learning performance of SVM and GPR models, various hyperparameters were tuned. These hyperparameters include the kernel functions, kernel scales, Box constraint, epsilon, and standardized data. For the SVM model, four kernel functions, namely linear, quadratic, cubic, and Gaussian, were employed to enhance the training performance of the models. Kernel functions such as rotational-quadratic, squared-exponential, Matern 5/2 and exponential were employed to enhance the training performance of the GPR models. Most of the kernel scales were set to automatic, except for GPR incorporated with fine Gaussian, medium Gaussian, and coarse Gaussian kernel functions. The kernel scale allows the input parameters to be scaled as a function of the features before being applied in the kernel function. The box constraints help to prevent overfitting of the data and they are set to automatic for all the models. To prevent overfitting, the box constraints regulate the level of penalty applied to observations that have significant residuals. A bigger box restriction results in a model that exhibits greater flexibility. A lower numerical value corresponds to a more rigid model, exhibiting reduced susceptibility to overfitting. The dataset was standardized for each of the models for each processing and analysis, as shown in Table 2.

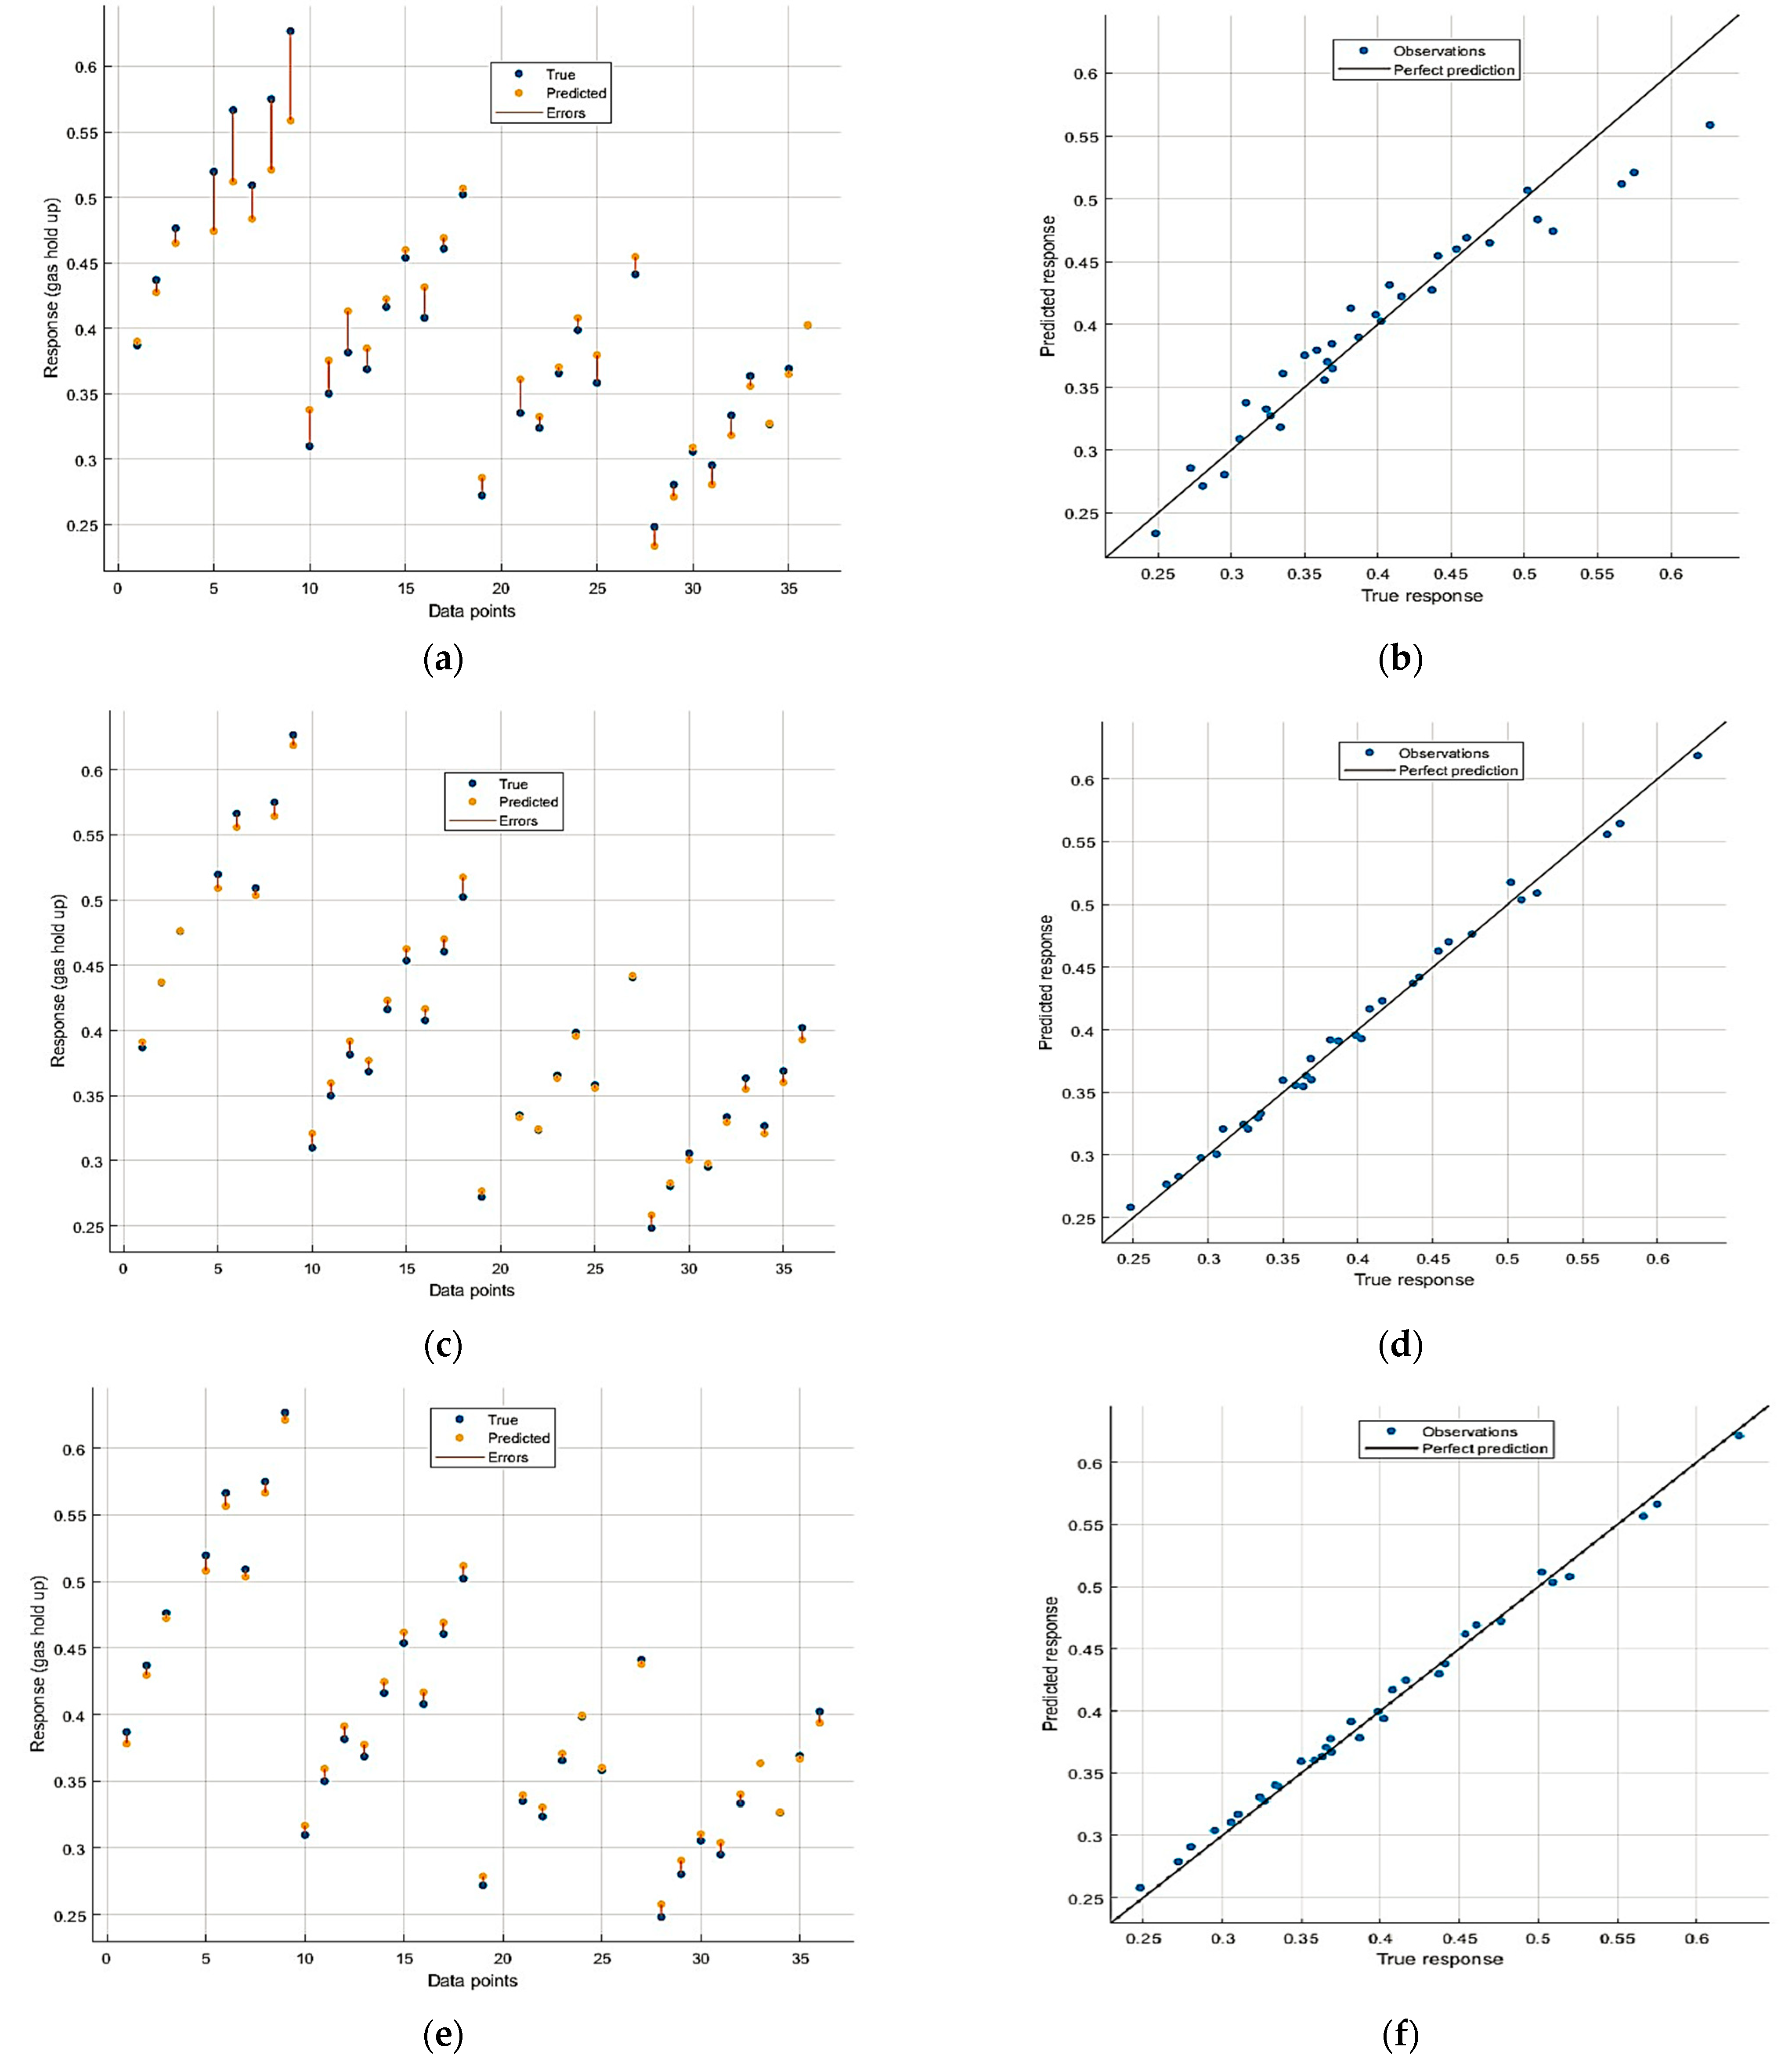
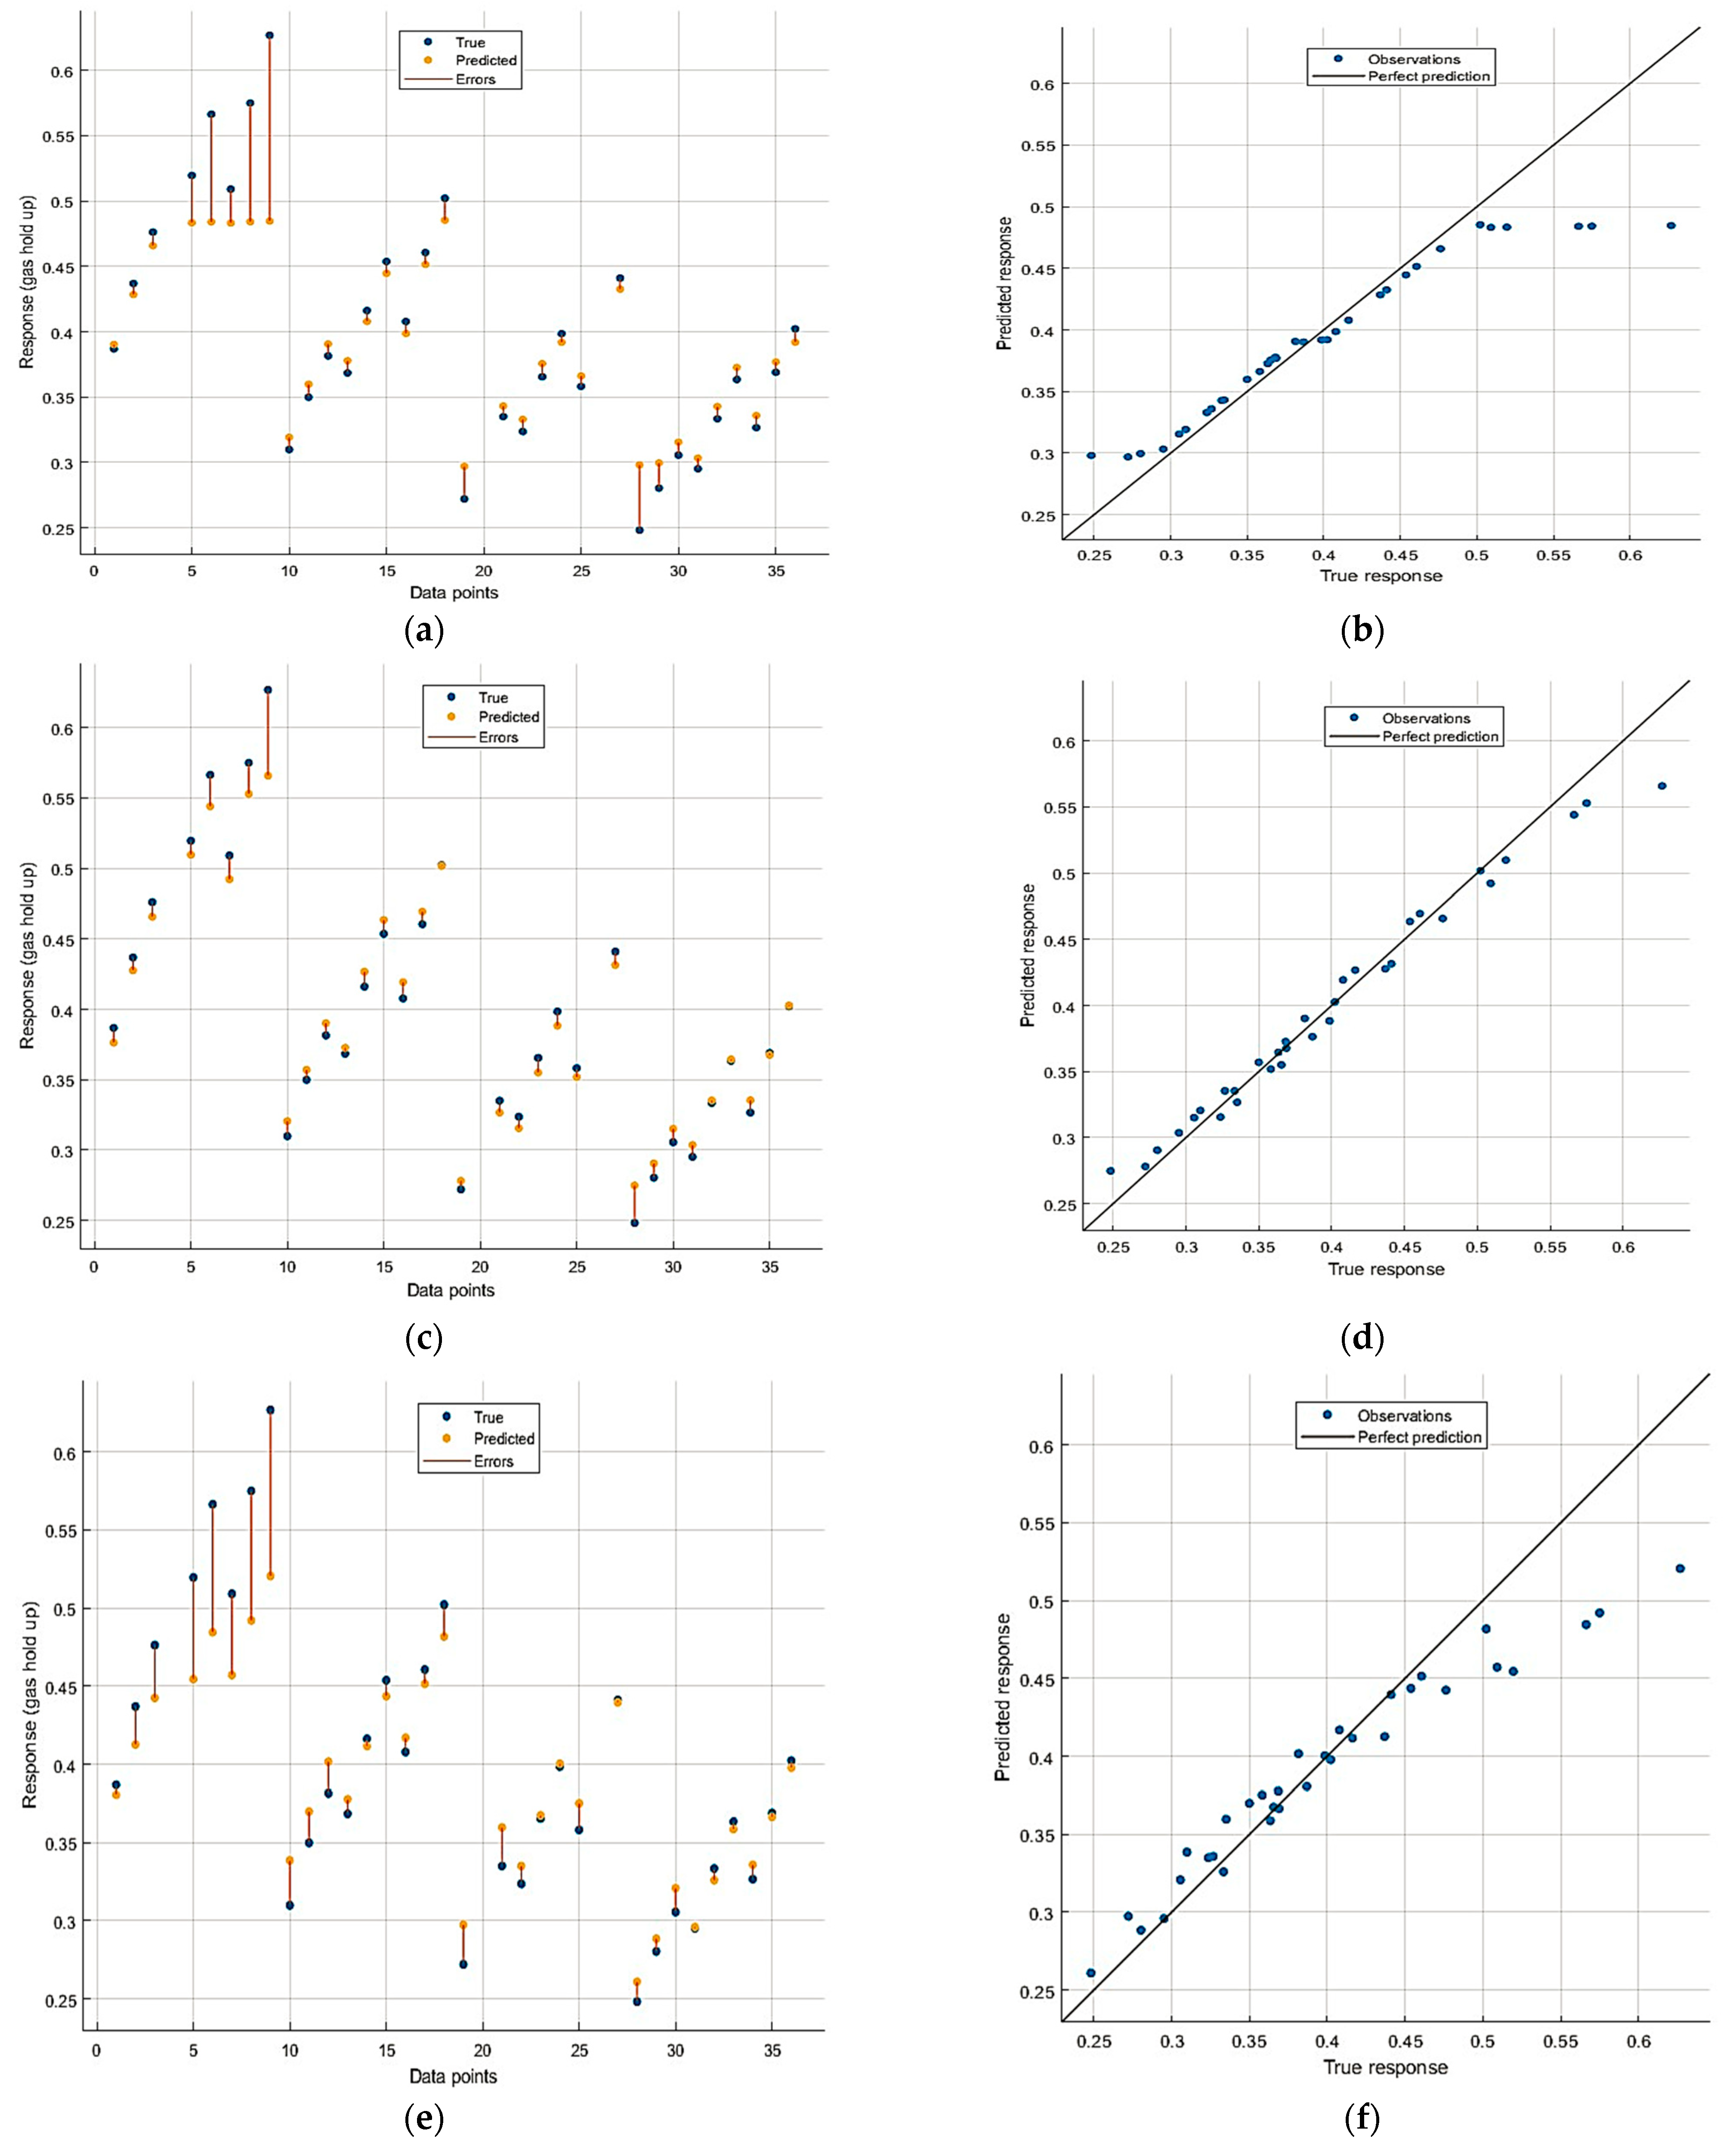
4.2. The Training and Testing Performance of the Models

Each of the SVM and GPR were trained and tested based on the kernel functions shown in Table 3. The training results revealed that the SVM incorporated with linear, quadratic, cubic, medium and coarse kernel functions have good performance as indicated by the R2 values > 0.9. The SVM incorporated with a fine kernel function displayed the worst performance, as indicated by the R2 of 0.843. The testing of the models on the dataset also indicated good performance for the SVM models incorporated with linear, quadratic, cubic, medium, and coarse kernel functions, with the exception of the SVM incorporated with the fine kernel function. Compared with the SVM models, the GPR models displayed good training and testing performance with all the kernel functions, as indicated by the R2 > 0.9. It can be inferred that the GPR models have better training and testing performance compared with the SVM models.

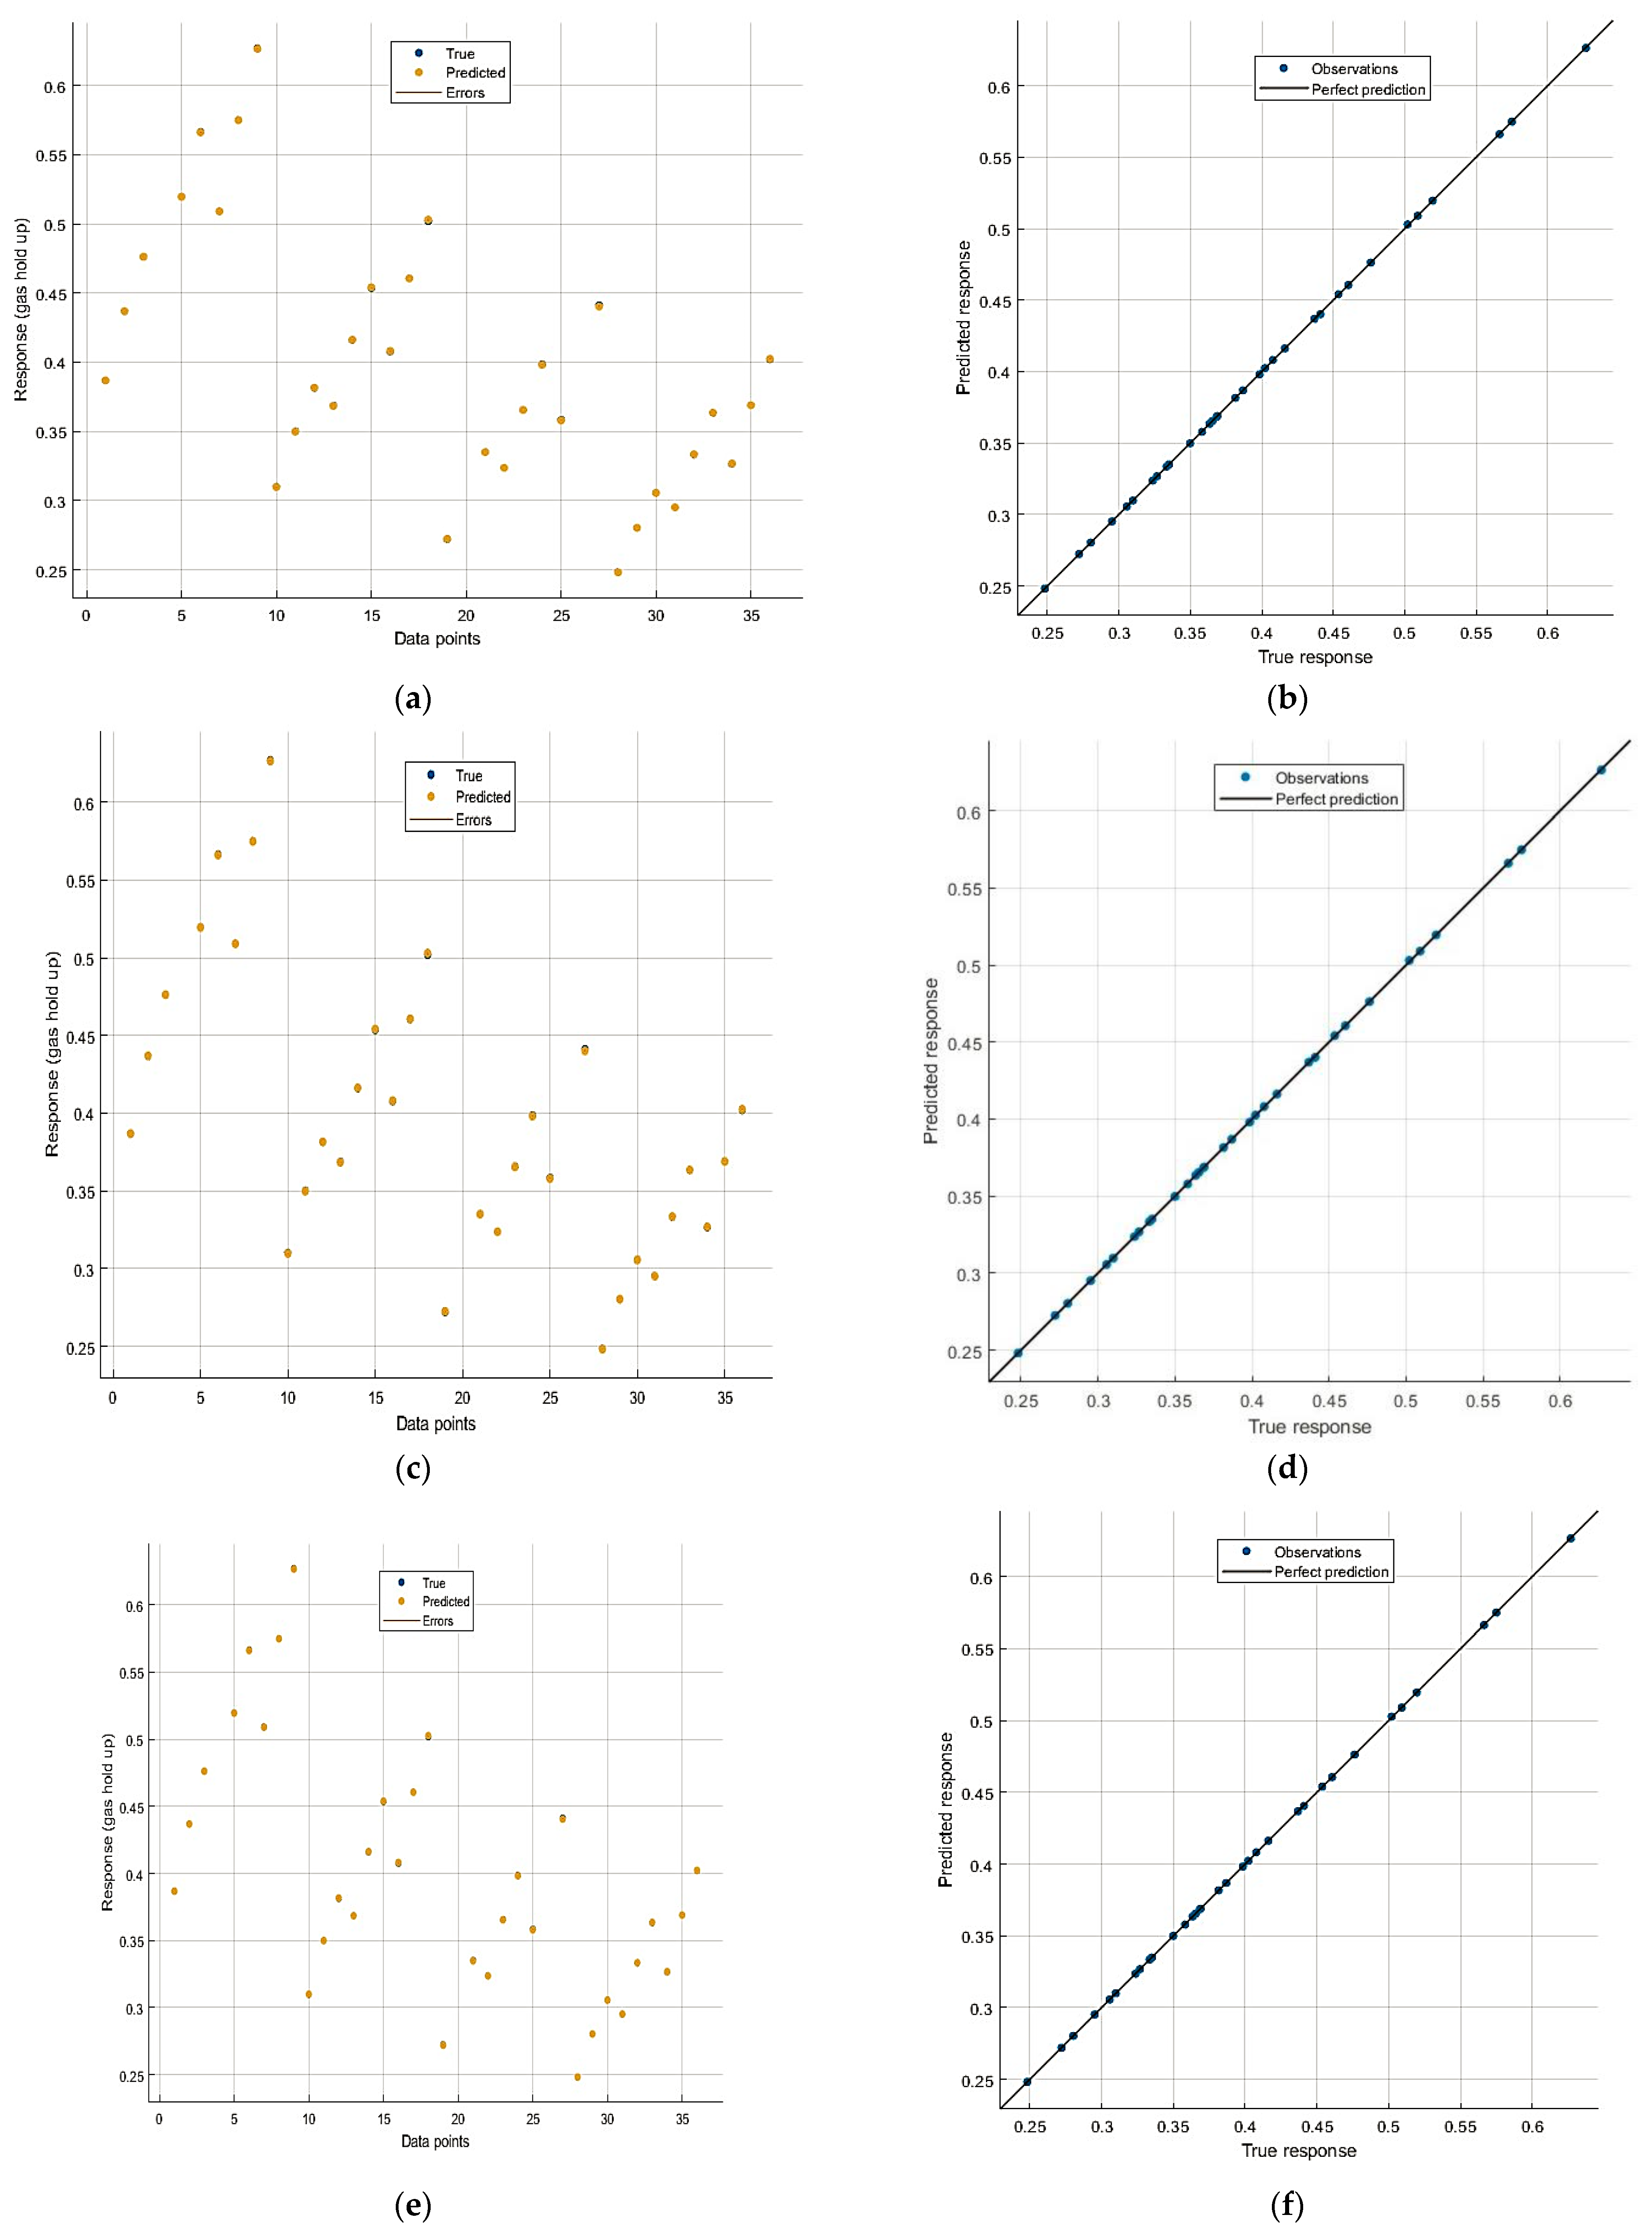
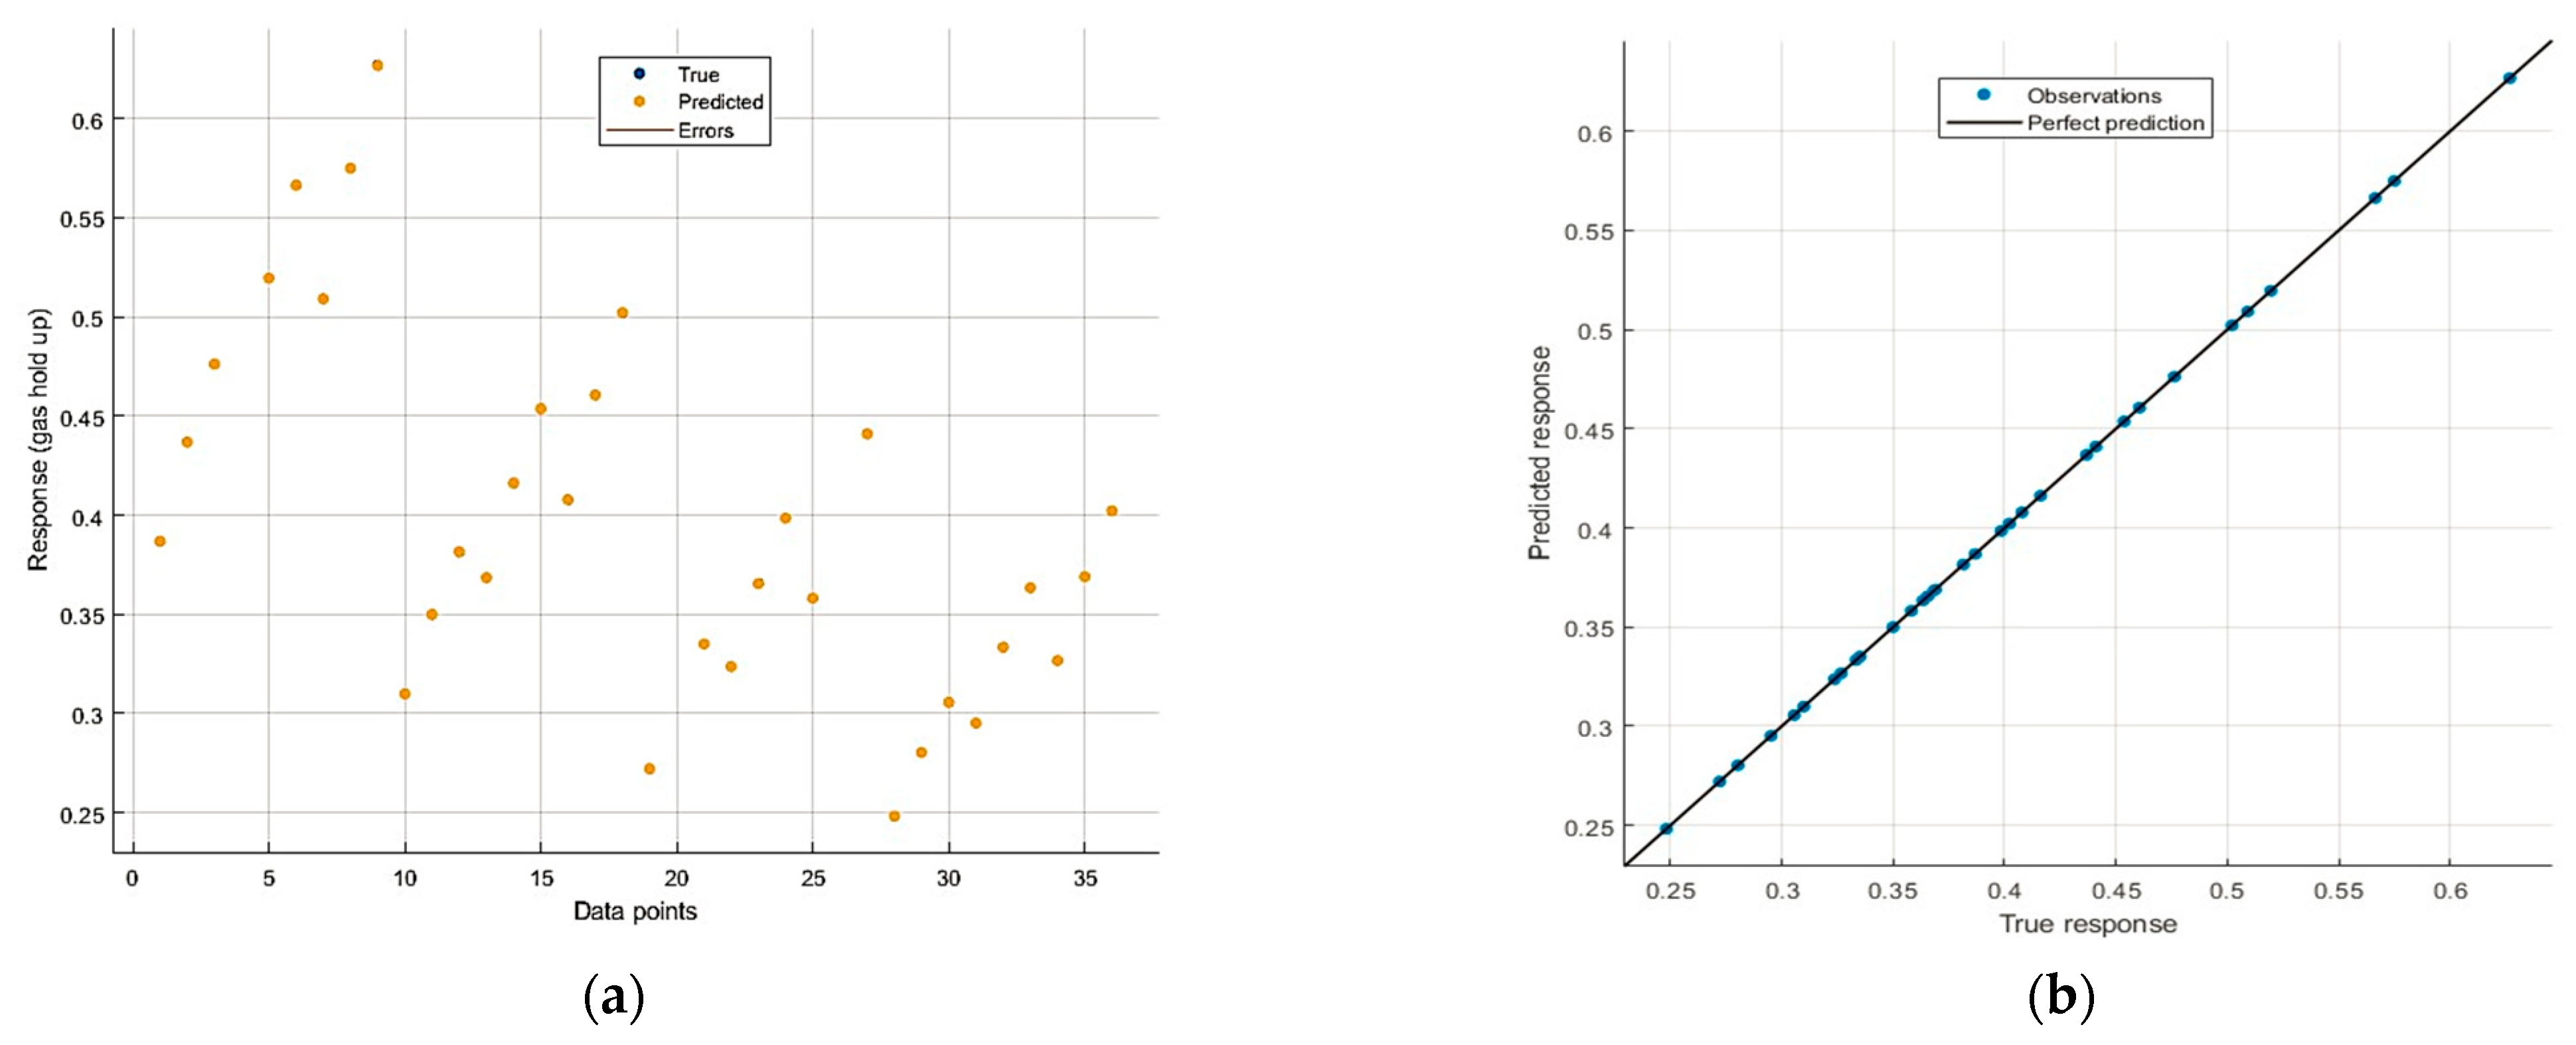
4.3. Predictive Performance of the Models

The performance of the SVM models in predicting gas hold-up in a two-phase ebullated bed reactor is depicted in Figure 4 and Figure 5. It can be seen that the different kernel functions significantly influence the performance of the SVN models as indicated by the R2 values. The incorporation of linear kernel functions resulted in an R2 of 0.919 and predicted errors measured via MAE and RMSE of 0.017 and 0.017, respectively. A better performance than the SVM incorporated with the linear kernel function is displayed by the SVM incorporated with the quadratic, cubic, and medium kernel functions as indicated by the R2 of 0.997, 0.988, and 0.946, respectively. However, the SVM model incorporated with fine and coarse kernel functions underperformed, as indicated by the R2 of 0.029 and 0.832, respectively. Overall, the SVM incorporated with the quadratic kernel function had the best performance amongst the SVM models, indicated by the highest values of R2 and lowest values of MAE and RMSE. The application of SVM with quadratic kernel functions for predicting lornoxicam solubility in the supercritical solvent has been reported by [28,29]. The study revealed that the SVM-quadratic model displayed an impressive R2 of 0.967, indicating a strong correlation between the predicted and actual solubility values. In a similar study, a quadratic support vector machine was found to be robust in modelling fault diagnosis methodology for nuclear power plants as reported by [30]. The use of the quadratic kernel function has proven to be efficacious when dealing with datasets that include a large number of dimensions but have a comparatively limited quantity of training samples [31]. The incorporation of the quadratic kernel function will enhance the model’s ability to capture non-linear correlations within the input data [32,33]. The computational efficiency of the method is particularly notable when using quadratic kernel functions. The study revealed that the anticipated methodology advances the efficiency of the fault diagnosis and can be incorporated into the fault diagnosis module to portray an operator support system to maintain safety and reliability.
The performance of the GPR models incorporated with four different kernel functions, namely rotational-quadratic, squared-exponential, Matern 5/2, and exponential, is depicted in Figure 6 and Figure 7. As shown in Table 4, all the kernel functions displayed good performance in modelling the predictions of gas hold-up in a two-phase ebullated bed reactor, as indicated by high R2 values displayed by all the models. With R2 values > 0.9, the predicted gas hold-up in the two-phase ebullated reactor is strongly correlated with the actual values. Overall, the rotational-quadratic, squared-exponential, and Matern 5/2 functions have robust capabilities to significantly enhance the performance of the GPR models in modelling the prediction of the gas hold-up in a two-phase ebullated bed reactor. As shown in Figure 8, the three models have good predictability with minimal errors based on the MAE and RMSE.

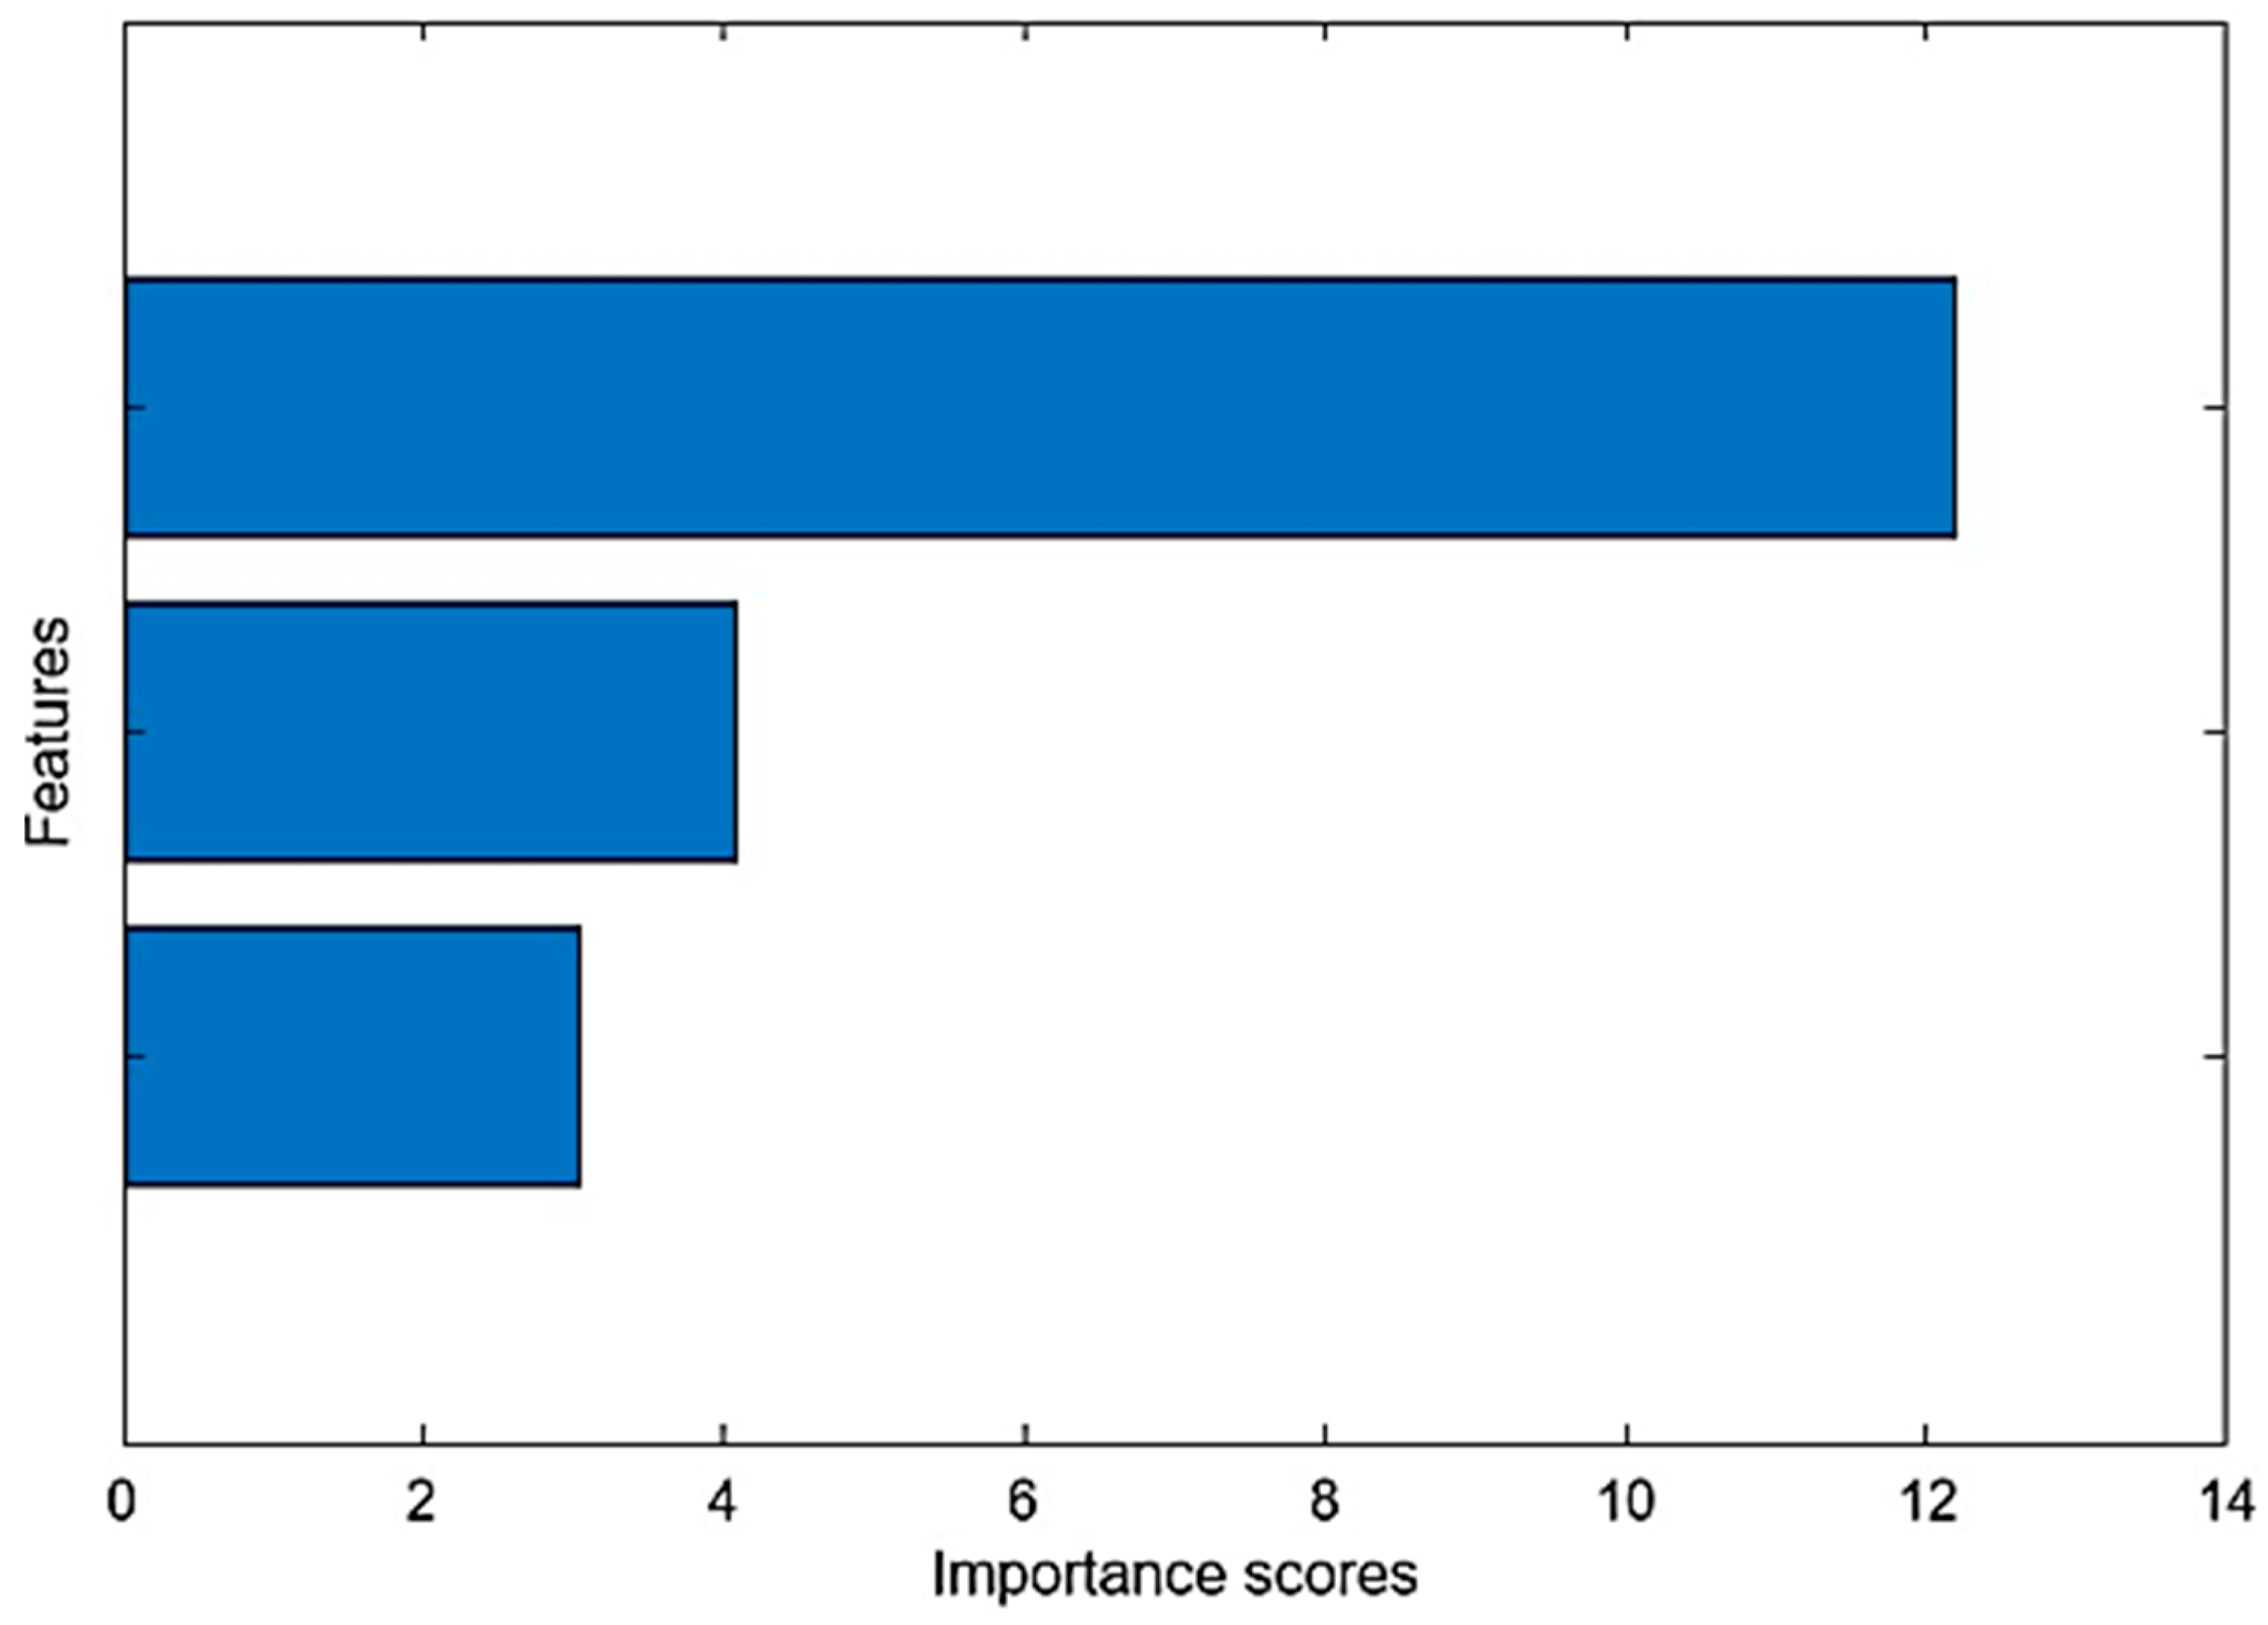
4.4. Feature Selection

The feature importance of the predicted gas hold-up was analyzed using the F-test as indicated by Figure 9. Based on the analysis, the liquid velocity, gas velocity, and recycle ratio have feature importance scores of 12.19, 4.08, and 3.05, respectively. This indicates that liquid velocity is the most important feature, with the highest influence on the predicted gas hold-up.

5. Conclusions

This study employed 10 machine learning algorithms based on SVM and GPR to model the prediction of gas hold-up in an ebullated two-phase reactor. The effects of three features, namely liquid velocity, gas velocity, and recycle ratio, on the gas hold-up in ebullated bed reactors were investigated. The feature importance analysis revealed that the liquid velocity has the most significant effect on the predicted gas hold-up, as indicated by the importance score of 12 compared to the gas velocity and recycle ratio, which have importance scores of 4 and 3.5, respectively. The training and testing of the linear, quadratic, cubic, fine, medium, and course kernel functions incorporated with the SVM model and the rotational-quadratic, squared-exponential, Matern 5/2, and exponential functions incorporated with the GPR models displayed good performance except for the fine SVM model, since the R2 is very low. The rotational-quadratic, squared-exponential, and Matern 5/2 GPR models displayed the best performance, as indicated by the R2 > 0.9 and low RMSE and MAE values.

Author Contributions

Conceptualization and writing—original draft preparation; A.A.A. (Asawer A. Alwasiti); software, M.M. and G.S.M.; validation, P.P.; methodology, Z.Y.S. and R.S.A.; investigation, A.A.A. (Adnan A. AbdulRazak), J.M.A., H.A.S.A. and A.A.Y.; resources, O.S.M.; rescourse, H.S.M. and S.S.A. All authors have read and agreed to the published version of the manuscript.

Funding

This research received no external funding.

Data Availability Statement

Not applicable.

Acknowledgments

The authors would like to thank the Chemical Engineering Department at the University of Technology for as well as Department of Chemical Engineering and Petroleum Industries at the Al-Mustaqbal University College their support.

Conflicts of Interest

The authors declare no conflict of interest.

References

  1. Wang, Y.; Chang, Y.; Li, J.; Wang, H.; Li, L.; Chen, C.; Zhao, Y.; Yuan, Y. Analysis of performance of novel hydrocyclones in ebullated bed reactor with different vortex finder structures. Chem. Eng. Res. Des. 2020, 158, 89–101. [Google Scholar] [CrossRef]
  2. Mowla, A.; Agnaou, M.; Treeratanaphitak, T.; Budman, H.M.; Abukhdeir, N.M.; Ioannidis, M.A. Gas segregation in a pilot-scale ebullated bed system: Experimental investigation and model validation. Chem. Eng. Res. Des. 2023, 194, 742–755. [Google Scholar] [CrossRef]
  3. Lane, C.D.; McKnight, C.A.; Wiens, J.; Reid, K.; Donaldson, A.A. Parametric analysis of internal gas separation within an ebullated bed reactor. Chem. Eng. Res. Des. 2016, 105, 44–54. [Google Scholar] [CrossRef]
  4. Parisien, V.; Pjontek, D.; McKnight, C.A.; Wiens, J.; Macchi, A. Impact of catalyst density distribution on the fluid dynamics of an ebullated bed operating at high gas holdup conditions. Chem. Eng. Sci. 2017, 170, 491–500. [Google Scholar] [CrossRef]
  5. Li, J.; Wang, Y.; Chang, Y.; Huang, Y.; Jiang, X.; Wang, H.; Li, L.; Chen, C.; Zhao, Y.; Yuan, Y. Cold model testing of in-situ catalyst activation by swirling self-rotation in ebullated bed reactor for biomass pyrolysis oils hydrogenation. Chem. Eng. J. 2021, 406, 126909. [Google Scholar] [CrossRef]
  6. Manek, E.; Haydary, J. Investigation of the liquid recycle in the reactor cascade of an industrial scale ebullated bed hydrocracking unit. Chin. J. Chem. Eng. 2019, 27, 298–304. [Google Scholar] [CrossRef]
  7. Tailleur, R.G. Effect of recycling the unconverted residue on a hydrocracking catalyst operating in an ebullated bed reactor. Fuel Process. Technol. 2007, 88, 779–785. [Google Scholar] [CrossRef]
  8. Mowla, A.; Ioannidis, M.A. Effect of particle wettability on the hydrodynamics of three-phase fluidized beds subject to foaming. Powder Technol. 2020, 374, 58–69. [Google Scholar] [CrossRef]
  9. Abid, M.F.; Ahmed, S.M.; AbuHamid, W.H.; Ali, S.M. Study on novel scheme for hydrodesulfurization of middle distillates using different types of catalyst. J. King Saud Univ. Eng. Sci. 2019, 31, 144–151. [Google Scholar] [CrossRef]
  10. Cheng, Z.-M.; Huang, Z.-B.; Yang, T.; Liu, J.-K.; Ge, H.-L.; Jiang, L.-J.; Fang, X.-C. Modeling on scale-up of an ebullated-bed reactor for the hydroprocessing of vacuum residuum. Catal. Today 2014, 220–222, 228–236. [Google Scholar] [CrossRef]
  11. Mach, J.; Donaldson, A.A.; Haelssig, J.; Wiens, J.; Adjaye, J.; MacChi, A. Fluid Dynamics Modeling of a Commercial Ebullated Bed Hydroprocessor. Ind. Eng. Chem. Res. 2020, 59, 19030–19044. [Google Scholar] [CrossRef]
  12. Kojić, P.; Omorjan, R. Predicting hydrodynamic parameters and volumetric gas–liquid mass transfer coefficient in an external-loop airlift reactor by support vector regression. Chem. Eng. Res. Des. 2017, 125, 398–407. [Google Scholar] [CrossRef]
  13. Gandhi, A.B.; Joshi, J.B. Unified correlation for overall gas hold-Up in bubble column reactors for various gas-liquid systems using hybrid genetic Algorithm-Support Vector Regression technique. Can. J. Chem. Eng. 2010, 88, 758–776. [Google Scholar] [CrossRef]
  14. Li, M.; Jia, G.; Mahmoud, H.; Yu, Y.H.; Tom, N. Physics-constrained Gaussian process model for prediction of hydrodynamic interactions between wave energy converters in an array. Appl. Math. Model. 2023, 119, 465–485. [Google Scholar] [CrossRef]
  15. Dai, X.; Andani, H.T.; Alizadeh, A.; Abed, A.M.; Smaisim, G.F.; Hadrawi, S.K.; Karimi, M.; Shamsborhan, M.; Toghraie, D. Using Gaussian Process Regression (GPR) models with the Matérn covariance function to predict the dynamic viscosity and torque of SiO2/Ethylene glycol nanofluid: A machine learning approach. Eng. Appl. Artif. Intell. 2023, 122, 106107. [Google Scholar] [CrossRef]
  16. Chatre, L.; Bataille, M.; Debacq, M.; Randriamanantena, T.; Nos, J.; Herbelet, F. Modelling of powder hydrodynamics in a screw reactor. Powder Technol. 2023, 420, 118367. [Google Scholar] [CrossRef]
  17. Vapnik, V. The Support Vector Method of Function Estimation. In Nonlinear Modeling: Advanced Black-Box Techniques; Suykens Johan, J.A.K., Vandewalle, Eds.; Springer: Boston, MA, USA, 1998; pp. 55–85. [Google Scholar] [CrossRef]
  18. Camastra, F.; Capone, V.; Ciaramella, A.; Riccio, A.; Staiano, A. Prediction of environmental missing data time series by Support Vector Machine Regression and Correlation Dimension estimation. Environ. Model. Softw. 2022, 150, 105343. [Google Scholar] [CrossRef]
  19. Goswami, K.; Samuel, G.L. Support vector machine regression for predicting dimensional features of die-sinking electrical discharge machined components. Procedia CIRP 2021, 99, 508–513. [Google Scholar] [CrossRef]
  20. Tong, H. Convergence rates of support vector machines regression for functional data. J. Complex. 2022, 69, 101604. [Google Scholar] [CrossRef]
  21. Chang, C.; Zeng, T. A hybrid data-driven-physics-constrained Gaussian process regression framework with deep kernel for uncertainty quantification. J. Comput. Phys. 2023, 486, 112129. [Google Scholar] [CrossRef]
  22. Xu, X.; Zhang, Y. A Gaussian process regression machine learning model for forecasting retail property prices with Bayesian optimizations and cross-validation. Decis. Anal. J. 2023, 8, 100267. [Google Scholar] [CrossRef]
  23. Shi, C.; Xue, K.; Wang, C. Predicting global ionospheric TEC maps using Gaussian process regression. Adv. Space Res. 2023, 72, 3251–3268. [Google Scholar] [CrossRef]
  24. Xu, X.; Zhang, Y. Price forecasts of ten steel products using Gaussian process regressions. Eng. Appl. Artif. Intell. 2023, 126, 106870. [Google Scholar] [CrossRef]
  25. Hossain, S.K.S.; Ayodele, B.V.; Almithn, A. Predictive Modeling of Bioenergy Production from Fountain Grass Using Gaussian Process Regression: Effect of Kernel Functions. Energies 2022, 15, 5570. [Google Scholar] [CrossRef]
  26. Zanaty, E.A.; Afifi, A. Generalized Hermite kernel function for support vector machine classifications. Int. J. Comput. Appl. 2020, 42, 765–773. [Google Scholar] [CrossRef]
  27. Rollbusch, P.; Becker, M.; Ludwig, M.; Bieberle, A.; Grünewald, M.; Hampel, U.; Franke, R. Experimental investigation of the influence of column scale, gas density and liquid properties on gas holdup in bubble columns. Int. J. Multiph. Flow 2015, 75, 88–106. [Google Scholar] [CrossRef]
  28. Besagni, G.; Di Pasquali, A.; Gallazzini, L.; Gottardi, E.; Colombo, L.P.M.; Inzoli, F. The effect of aspect ratio in counter-current gas-liquid bubble columns: Experimental results and gas holdup correlations. Int. J. Multiph. Flow 2017, 94, 53–78. [Google Scholar] [CrossRef]
  29. Rahimzadeh, A.; Ein-Mozaffari, F.; Lohi, A. Hydrodynamics and Gas Hold-Up of a Gas-Liquid Coaxial Mixing System at Different Scales Containing a Non-Newtonian Fluid. Eng. Proc. 2023, 37, 4. [Google Scholar] [CrossRef]
  30. Zhang, M.; Mahdi, W.A. Development of SVM-based machine learning model for estimating lornoxicam solubility in supercritical solvent. Case Stud. Therm. Eng. 2023, 49, 103268. [Google Scholar] [CrossRef]
  31. Wang, Y.; Sun, P. A fault diagnosis methodology for nuclear power plants based on Kernel principle component analysis and quadratic support vector machine. Ann. Nucl. Energy 2023, 181, 109560. [Google Scholar] [CrossRef]
  32. Dagher, I. Quadratic kernel-free non-linear support vector machine. J. Glob. Optim. 2008, 41, 15–30. [Google Scholar] [CrossRef]
  33. Liu, W.; Zhu, Y.; Park, J. Some companions of perturbed Ostrowski-type inequalities based on the quadratic kernel function with three sections and applications. J. Inequal. Appl. 2013, 2013, 226. [Google Scholar] [CrossRef]
Figure 1. The schematic diagram of experimental rig.
Chemengineering 07 00101 g001
Figure 2. Model configurations and training.
Chemengineering 07 00101 g002
Figure 3. The schematic representation of the relationship between gas velocity, liquid velocity, and gas hold-up.
Chemengineering 07 00101 g003
Figure 4. (a) The dispersion plot and (b) parity plot for the linear SVN model. (c) The dispersion plot and (d) parity plot for the quadratic SVN model. (e) The dispersion plot and (f) parity plot for the cubic SVN model.
Chemengineering 07 00101 g004
Figure 5. (a) The dispersion plot and (b) parity plot for the fine SVN model. (c) The dispersion plot and (d) parity plot for the medium SVN model. (e) The dispersion plot and (f) parity plot for the coarse SVN model.
Chemengineering 07 00101 g005
Figure 6. (a) The dispersion plot and (b) parity plot for the rotational-quadratic GPR model. (c) The dispersion plot and (d) parity plot for the squared-exponential GPR model. (e) The dispersion plot and (f) parity plot for the Matern 5/2 GPR model.
Chemengineering 07 00101 g006
Figure 7. (a) The dispersion plot and (b) parity plot for the exponential GPR model.
Chemengineering 07 00101 g007
Figure 8. Comparison of the RMSE of the models.
Chemengineering 07 00101 g008
Figure 9. Feature importance scores sorted using F-tests.
Chemengineering 07 00101 g009
Table 1. Descriptive statistics of the input and targeted parameter.
ParametersRangeMinimumMaximumMeanStd. DeviationVariance
Liquid velocity (cm/s)1.500.502.001.250.570.32
Gas velocity (cm/s)3.001.504.503.001.241.54
Recycle ratio1.001.002.001.500.410.17
Gas hold-up0.380.250.630.390.090.01
Table 2. Hyperparameter tuning of the SVM GPR models.
ModelKernel FunctionKernel ScaleBox ConstraintStandardize Data
Linear SVMLinearAutomaticAutomaticYes
Quadratic SVMQuadraticAutomaticAutomaticYes
Cubic SVMCubicAutomaticAutomaticYes
Fine Gaussian SVMGaussian0.43AutomaticYes
Medium Gaussian SVMGaussian1.7AutomaticYes
Coarse Gaussian SVMGaussian6.9AutomaticYes
Rotational Quadratic GPRRotational quadraticAutomaticAutomaticYes
Squared-Exponential GPRSquared-ExponentialAutomaticAutomaticYes
Matern 5/2 GPRMatern 5/2AutomaticAutomaticYes
Exponential GPRExponentialAutomaticAutomaticYes
Table 3. Training and testing performance of models using the dataset.
Model TypeKernel FunctionTrainingTesting
RMSER2MAERMSER2MAE
SVMLinear0.0240.9290.0180.0180.9200.017
SVMQuadratic0.0080.9930.0060.0030.9980.003
SVMCubic0.0070.9930.0070.0070.9880.006
SVMFine0.0360.8430.0210.0620.0300.054
SVMMedium0.0150.9720.0110.0150.9460.014
SVMCoarse0.0340.8600.0220.0260.8320.021
GPRRotational-Quadratic0.0000.9990.0000.0010.9990.001
GPRSquared-Exponential0.0000.9990.0000.0010.9990.001
GPRMatern 5/20.0000.9990.0000.0010.9990.001
GPRExponential0.0000.9990.0000.0080.9830.006
Table 4. Predictive performance of the models.
ModelKernel FunctionsMAERMSER2
SVMLinear0.0170.0170.919
SVMQuadratic0.0020.0030.997
SVMCubic0.0050.0060.988
SVMFine0.0540.0620.029
SVMMedium0.0130.0140.946
SVMCoarse0.0210.0250.832
GPRRotational-Quadratic0.0010.0010.999
GPRSquared-Exponential0.0010.0010.999
GPRMatern 5/20.0010.0010.999
GPRExponential0.0060.0080.982
Disclaimer/Publisher’s Note: The statements, opinions and data contained in all publications are solely those of the individual author(s) and contributor(s) and not of MDPI and/or the editor(s). MDPI and/or the editor(s) disclaim responsibility for any injury to people or property resulting from any ideas, methods, instructions or products referred to in the content.

