1. Introduction
Water is one of the most important resources on Earth and water used for irrigation accounts for a significant portion of the global water demand [
1]. For stable food production, water supply methods are being diversified, and water usage is gradually increasing. Recently, the rate at which groundwater is consumed for irrigation has been increasing rapidly. Moreover, the continuous consumption of water resources has worsened the drought condition worldwide [
2]. In many countries, excessive use of groundwater from shallow aquifers is perceived as the main cause of reduced available surface water supply [
3]. Consequently, groundwater changes attributed to aquifer depletion have been investigated, and various predictions have been made in sites with large extraction wells [
4,
5,
6]. Groundwater withdrawal from deep aquifers leads to permanent depletion except in cases where the groundwater is recharged by high-intensity rainfall, which occurs occasionally [
7]. In contrast, groundwater in shallow aquifers has different characteristics, because it can be renewed by nearby rivers or rainfall. Moreover, continuous large-scale depletion varies near the river environment owing to groundwater–surface-water interaction. Thus, shallow aquifers undergo spatiotemporal changes owing to various factors; seasonality is an indispensable element in understanding the underground water resources of shallow aquifers. In monsoon or semi-arid climates, rainfall is concentrated during one period in a year. During these periods, aquifers are recharged. Furthermore, anthropogenic activities, which are the main causes of water depletion, also exhibit seasonality. In many areas, the abstraction of groundwater may increase during the dry season [
8,
9,
10]. Two opposite activities (groundwater recharge and abstraction from shallow aquifers) occur in accordance with the seasonal cycle. This is observed in large agricultural areas in monsoon climates. For example, the groundwater level of the Ganges–Brahmaputra–Meghna (GBM) delta in Bangladesh is decreasing at an annual rate of 0.1–0.5 m/year owing to intensive irrigation. In the Dhaka area, where the degree of groundwater usage is high, the groundwater is decreasing at a maximum speed of 1 m/year [
9]. The recharge of shallow aquifers is indispensable for the sustainable groundwater use. However, Perrin [
10] found that the locally heterogeneous pattern of groundwater depletion intensifies owing to seasonal characteristics, and that the imbalance worsens during low-rainfall years. Even in monsoon areas where precipitation is relatively abundant, the annual pattern of groundwater use varies considerably depending on the degree of yearly precipitation. For example, Pavelic et al. [
8] investigated the upper Bhima River basin in India and reported that less than 10% of pumping wells became dry during the off-monsoon season dry if there was large precipitation the previous year, whereas 40% of pumping wells became dry if the prior year had low rainfall. The seasonal precipitation pattern causes short-term reliability issues rather than long-term groundwater depletion, as they influence food production. It has been found that extreme water shortage caused by extreme droughts in conjunction with climate changes also causes problems in shallow aquifers [
11]. Thus, even rechargeable groundwater areas are influenced by factors that cause or interfere with recharging (i.e., adjacent geographic characteristics, climate, relationship with rivers, and use of public water). Therefore, a highly precise analysis that considers multiple hydrological and geologic parameters, as well as site-specific conditions, is required to determine whether the groundwater in the study area is a sustainably available resource.
Groundwater resources located along rivers are influenced considerably by hydrometeorological effects, such as changes in precipitation and natural recharge amounts, use of surrounding lands, various river environments, maintenance status of riverside facilities, and agricultural water intake methods. To identify the water circulation state of riverside groundwater under the complex effects of natural and artificial environments and to prepare for water resource depletion and pollution of the water environment, the behavior of each hydrological component should be identified. In addition, an unbiased quantitative evaluation of each hydrological component of the corresponding groundwater system must be obtained using raw data collected from the site of interest.
Ruud et al. [
12] named the semi-arid basin where intensive groundwater development is performed as an “active basin” and pointed out analytical errors caused by unmeasurable or inaccurate data when analyzing the water budget of an active basin. In particular, it may be difficult to acquire data, because usage data for agricultural groundwater or private pumping wells do not exist or cannot be obtained due to privacy issues [
2]. Given that the measurement of groundwater usage in a large basin-scale area increases the economic burden of research, groundwater usage is an unknown factor in many studies [
12].
The seasonality of groundwater use and the problem of groundwater usage measurements are similar in South Korea to other monsoon and semi-arid climates. In 2015, the agricultural water usage of South Korea was 2.08 billion m
3. This accounted for 51% of the total groundwater usage [
13]. Since 2009, domestic and industrial water usage has not changed significantly; thus, the use of agricultural water has become a major reason for the increase in total groundwater usage [
14]. Greenhouse cultivation methods for farming using groundwater are becoming increasingly popular in South Korea. The demand for fresh vegetables and fruits that are difficult to store for long periods is increasing, as the demand is high throughout the year and the income level of people is rising. Although the demand and supply of off-season agricultural products throughout the year is increasing, these products are only being produced by greenhouse cultivations in most areas, because growth conditions, such as the climate, soil, and moisture, are not suitable during the winter months (November to February) in South Korea. Moreover, the greenhouse cultivation method has attracted considerable attention as a profitable method for farmers, because stable cultivation can be achieved by avoiding weather disasters and pests. Farmers can grow fresh vegetables and fruit in a short period and sell them at much higher prices. However, greenhouse cultivation requires much higher artificial energy consumption than field cultivation, because special heating or insulation are required to artificially create a suitable environment for the growth of agricultural products.
Recently, tremendous growth has been documented in the area of plastic film-covered greenhouse cultivations in most agricultural lands near rivers in South Korea. In particular, the winter facility cultivation method, which uses groundwater to maintain the warmth of the greenhouse in winter, has been adopted by many agricultural lands in South Korea. This greenhouse warming method is called water curtain cultivation (WCC). Since the first introduction of WCCs in South Korea in 1984, WCCs have been used extensively. Indicatively, in 2006, WCC facilities spanned 10,746 ha [
15]. WCC is a cultivation method whereby groundwater, which maintains a constant temperature of 15 °C even in winter, is extracted and sprayed on the roof of the greenhouse to form a water curtain. The heat emitted from the water maintains the warmth of the greenhouse. WCC technology is advantageous in that it dramatically reduces the fuel cost, because no fuel is required to heat the facility. The nationwide area under WCC cultivation is growing constantly, owing to its advantages. It is not affected by oil prices, and a stable indoor temperature can be maintained. For WCC, considerable volumes of groundwater are pumped during the winter and discharged into rivers through agricultural waterways after use [
16]. Most of the WCC facilities in South Korea are installed in alluvial areas near a river in anticipation of a sufficient supply of groundwater from the river. However, because WCC facilities are concentrated in a large-scale complex near rivers, excessive use of water curtain water within a limited area causes groundwater depletion, thus making it difficult to continually supply water for water curtains. Using a large amount of groundwater for 4–5 months during the winter and discharging it to nearby rivers has resulted in riverside groundwater depletion. In large WCC complexes that use large amounts of groundwater, disruptions in the water curtain water supply often occur in January every year.
This study aimed to examine the surface–groundwater interaction near a small stream called Musimcheon within the Mihocheon basin, and to quantitatively diagnose the groundwater shortage phenomenon in aquifers. Several studies have been conducted on this watershed. Chung et al. [
17] analyzed the spatiotemporal distribution of groundwater recharge in a watershed based on the application of the combined surface-water–groundwater model SWAT–MODFLOW [
18] for an area that spanned approximately 1868 km
2. Chung et al. [
19] proposed a sustainable intake amount along the stream within the Mihocheon basin based on an analysis of the effect of groundwater pumping. The SWAT–MODFLOW model used in these studies was an integrated hydrological analysis model and was capable of calculating the heterogeneous recharge characteristics, simulating the hydrogeological characteristics and groundwater pumping, and evaluating the interaction between the river and groundwater. Chung et al. [
17] and Chung et al. [
19] used a relatively large grid size of 300 × 300 m to study the entire watershed area. The present study conducted precise groundwater level and water budget analyses on a small demonstration area of ~4 km
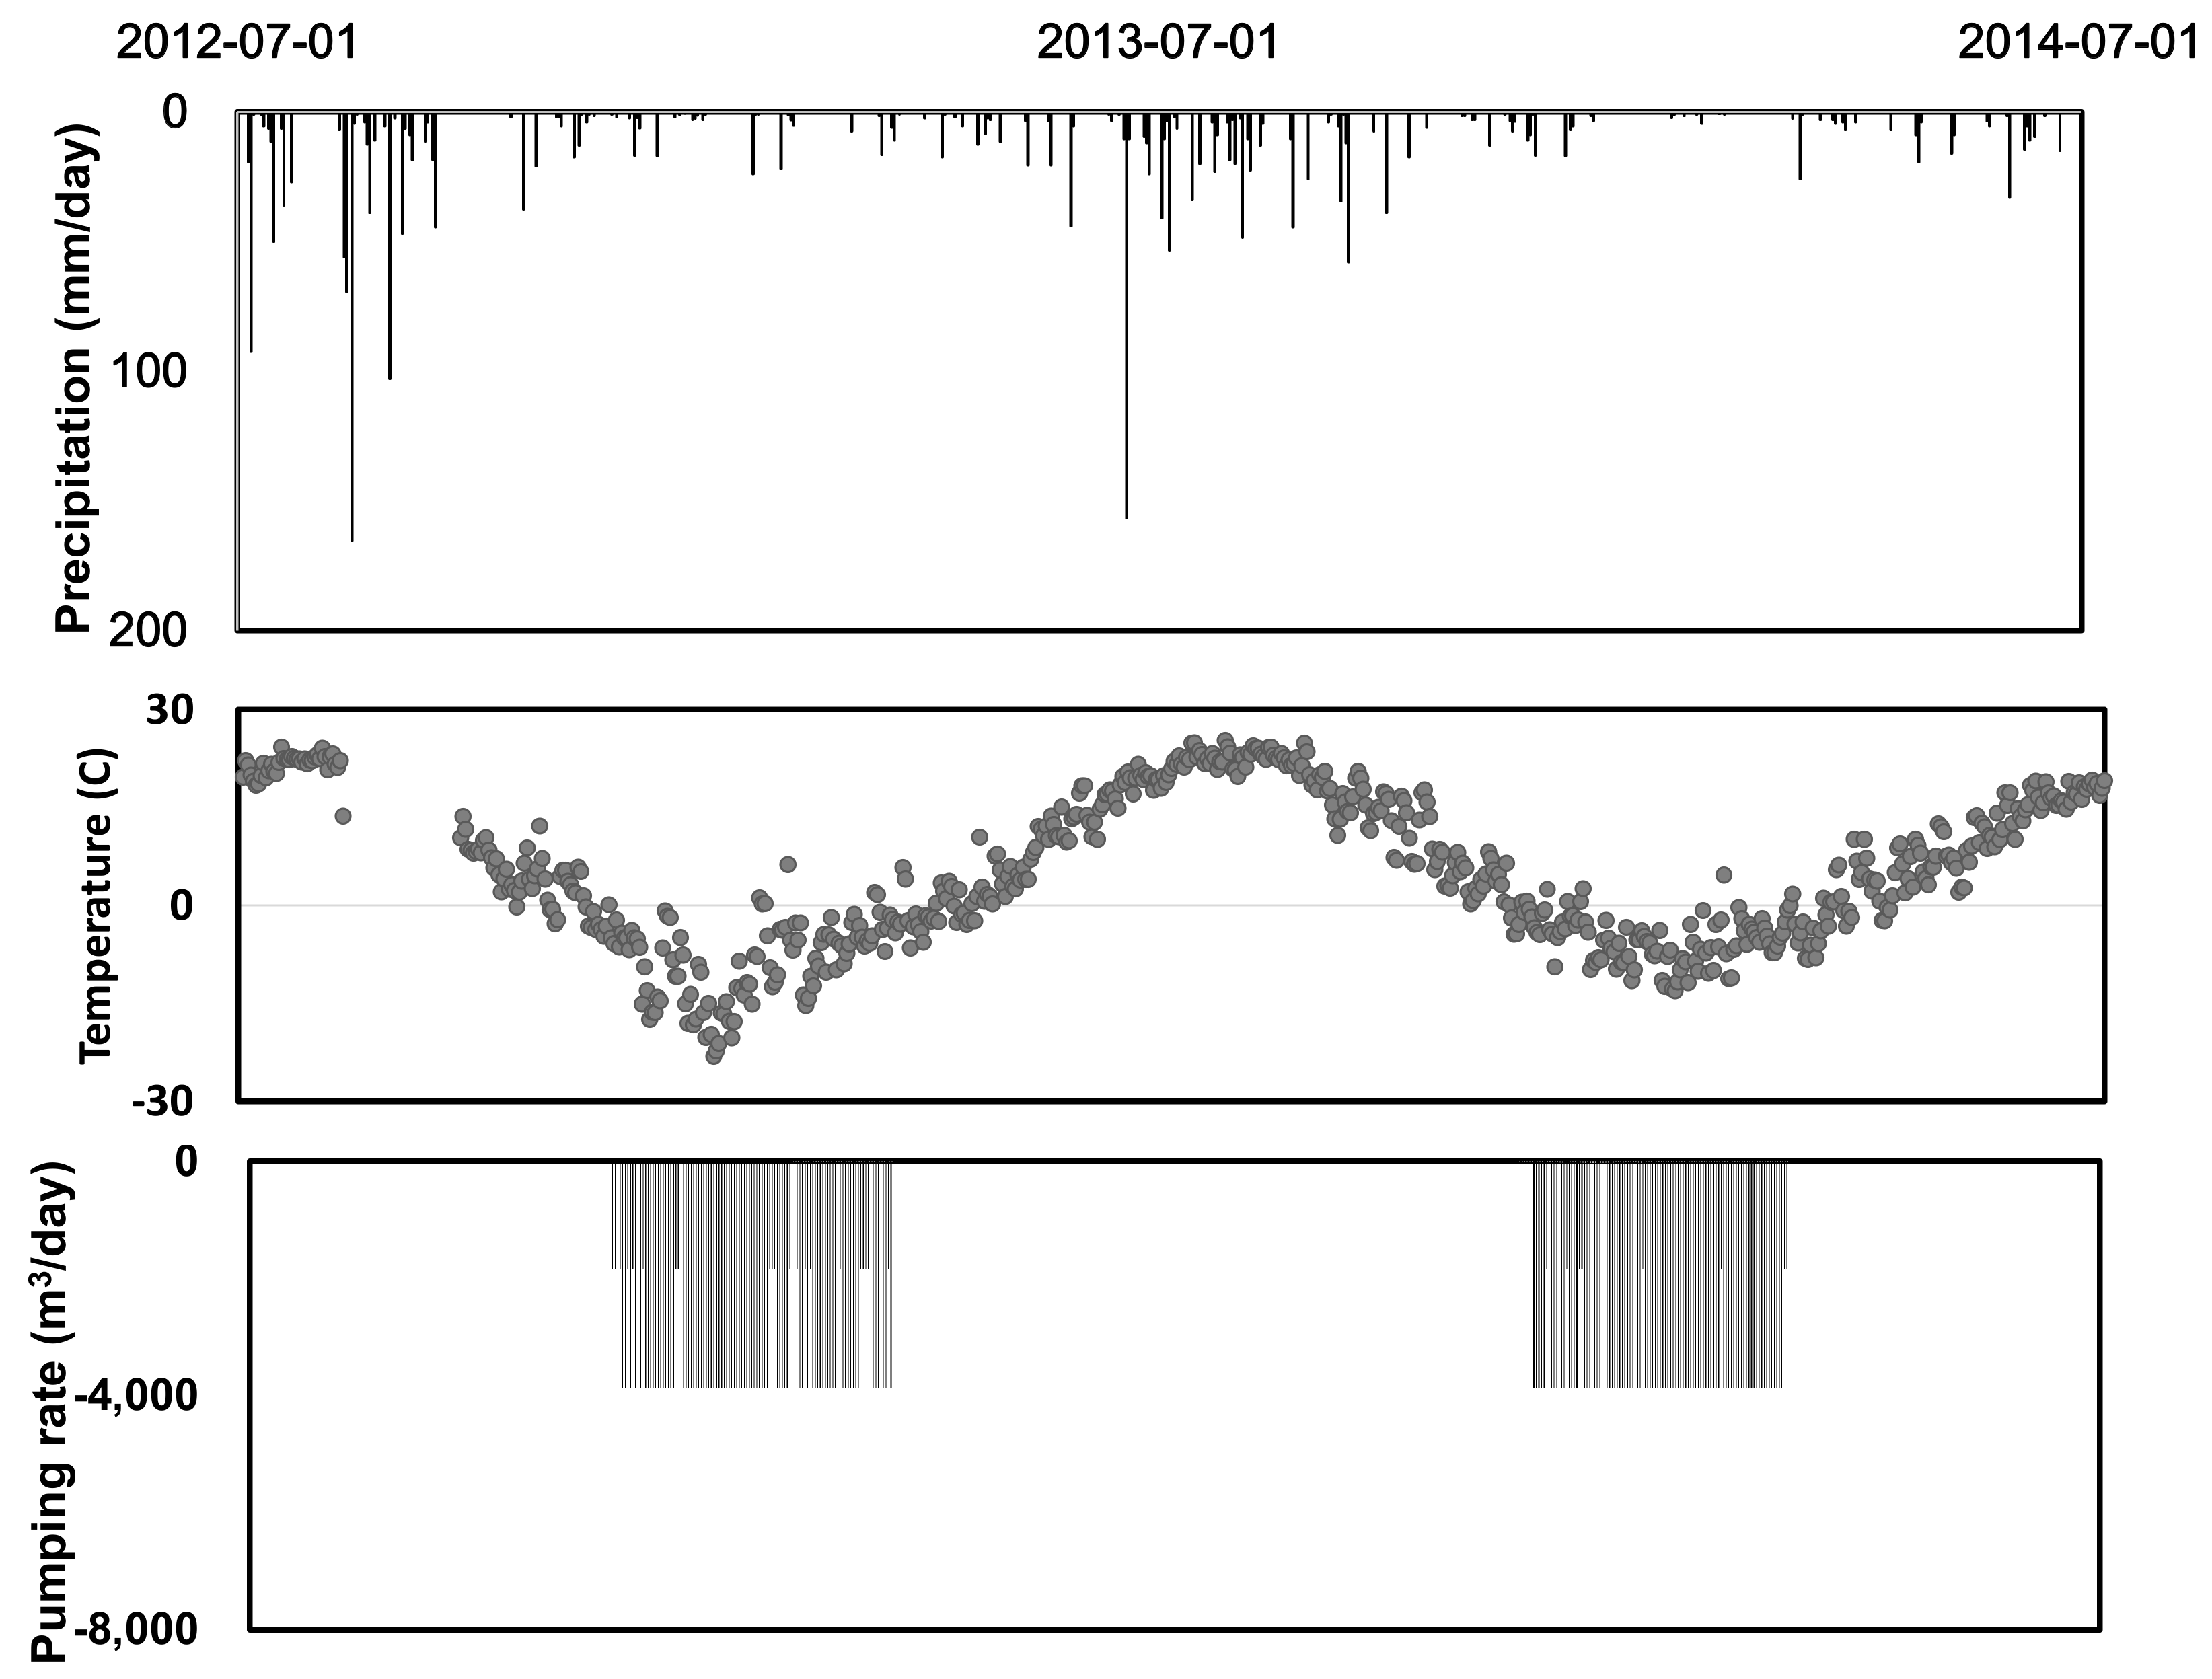
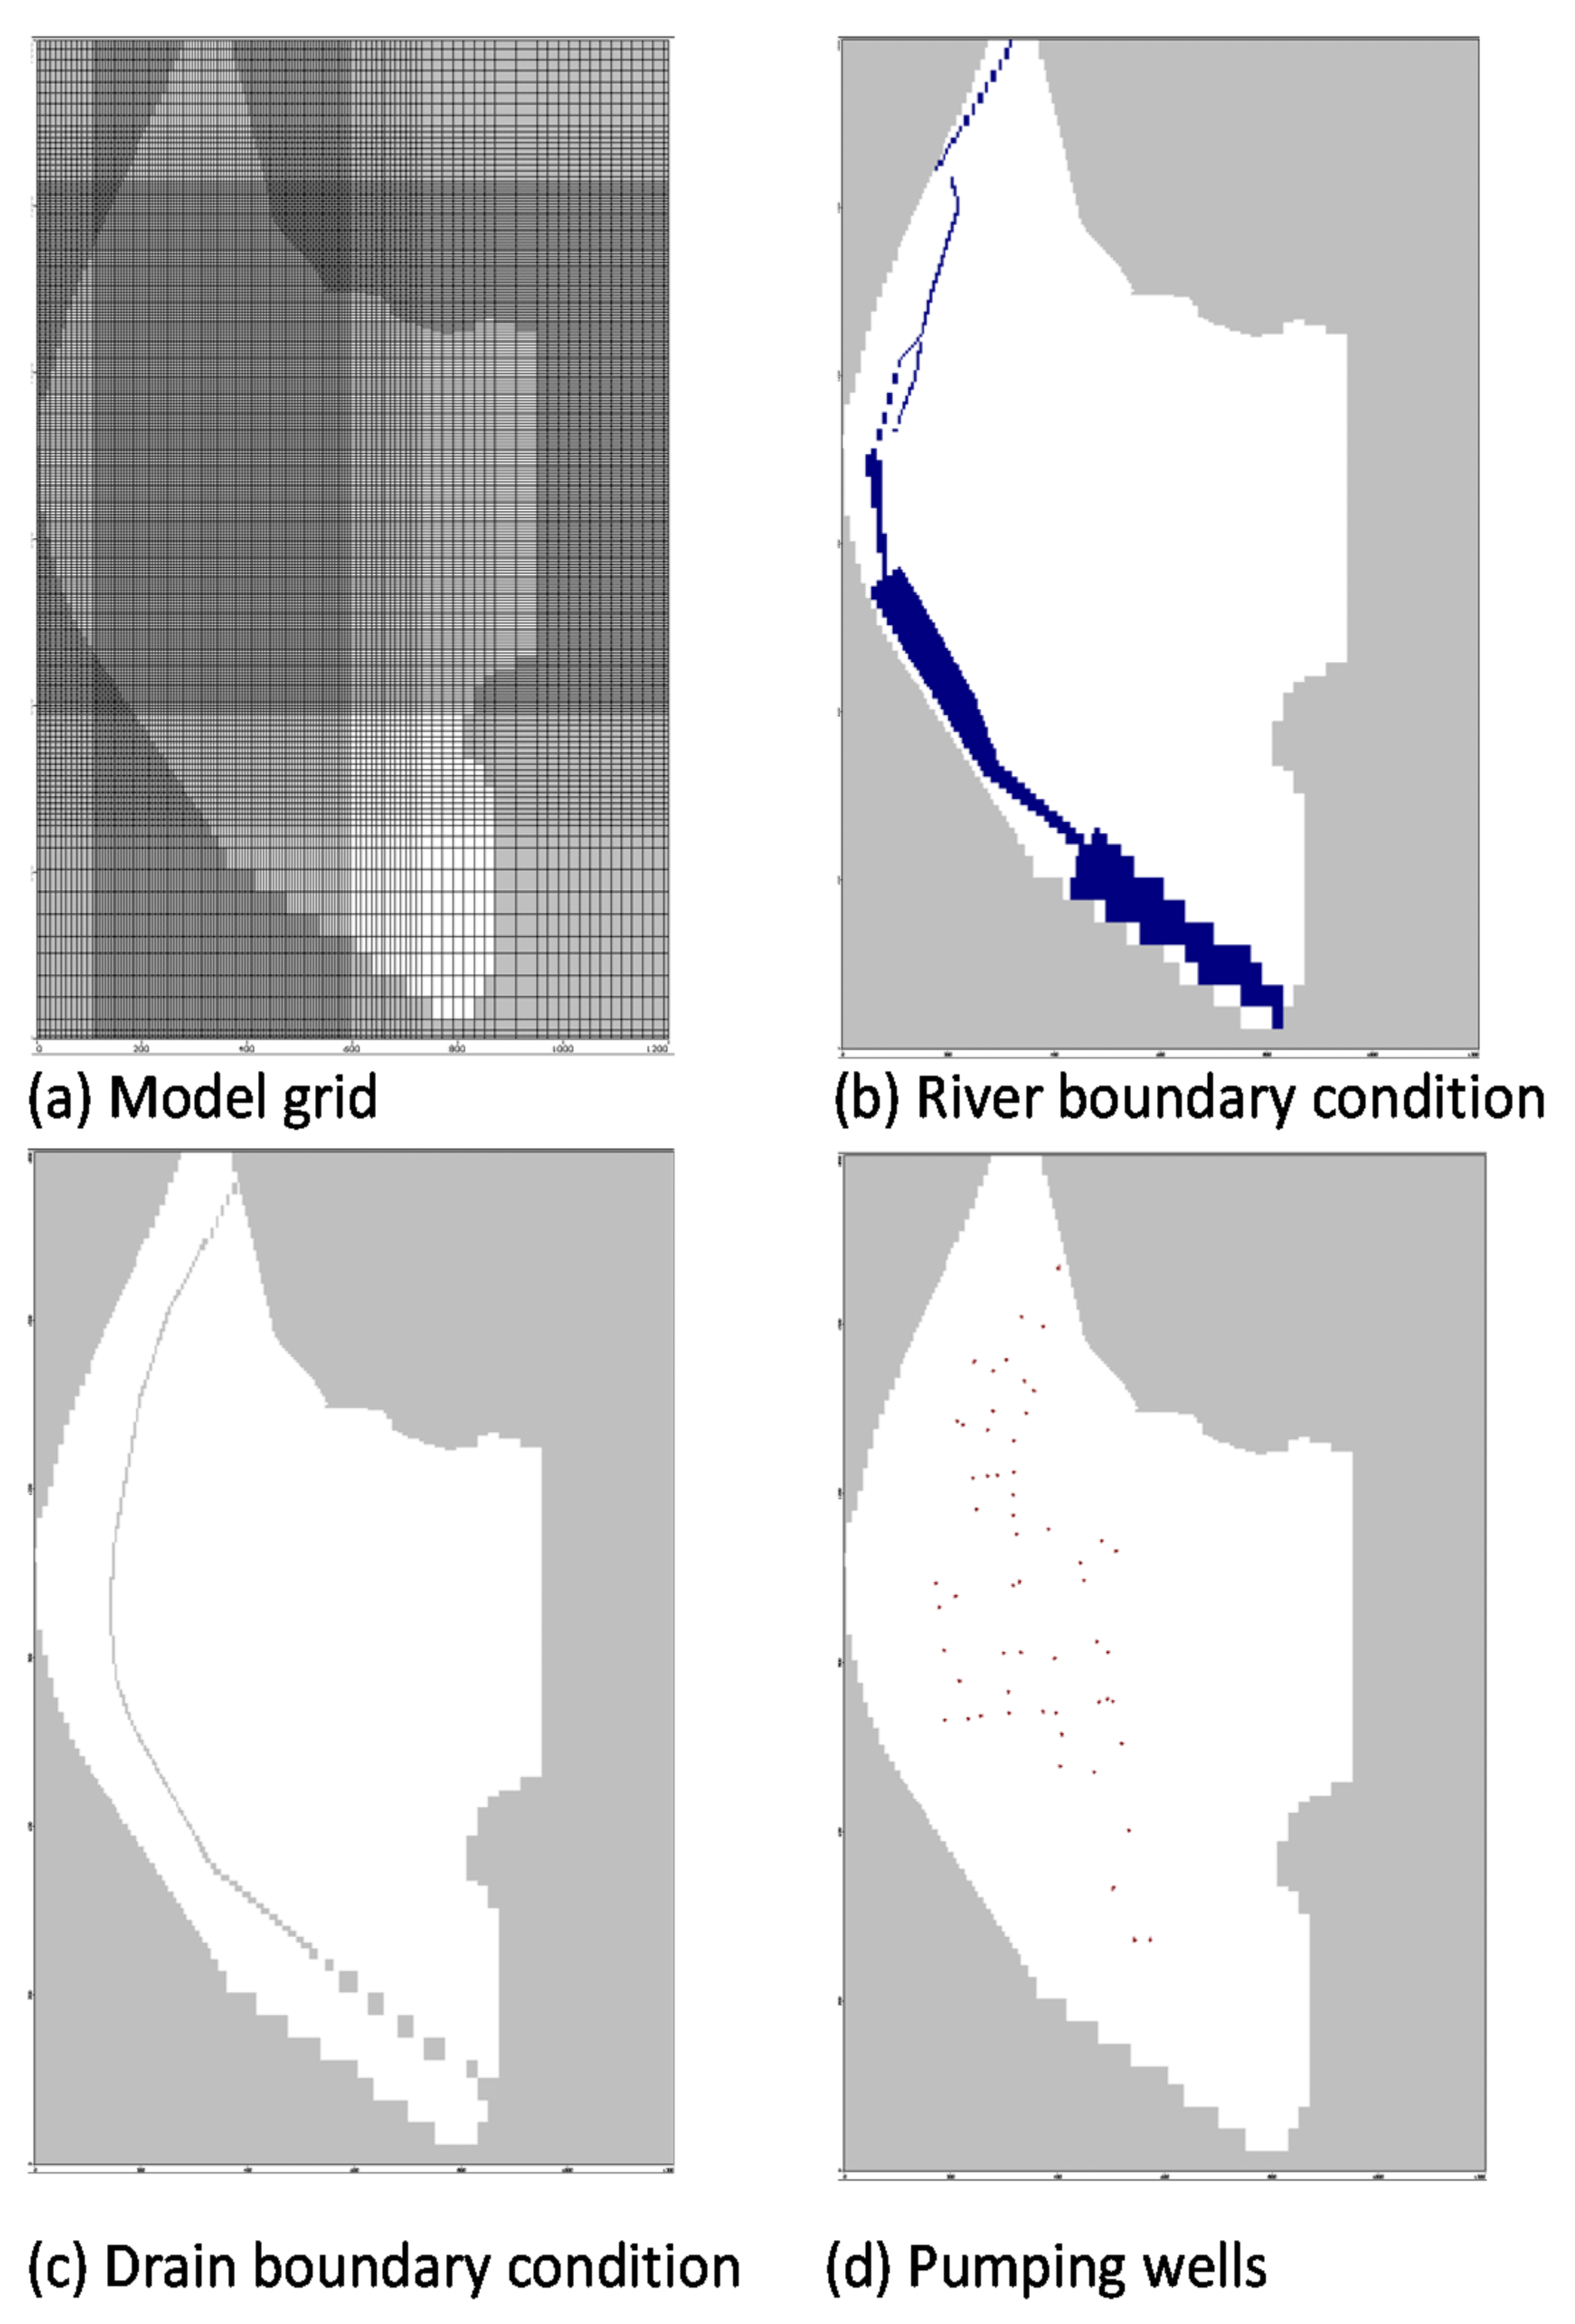
2 in the southeastern part of the Mihocheon basin in fine grids using MODFLOW. The hydrologically analyzed spatiotemporal groundwater recharge amount was used as the input component of the MODFLOW. In South Korea, the status of groundwater development and use of nearby rivers are still not adequately understood; groundwater development is not officially measured and reported in many WCC facilities that are operated by small farmers. Hence, the groundwater pumping pattern in the WCC area was identified using the correlation between the daily minimum temperature and groundwater usage of the WCC area. Precise groundwater modeling was performed in the demonstration area using the three-dimensional (3D) groundwater flow model MODFLOW [
20] and the watershed hydrology model soil and water assessment tool (SWAT) [
21]. To our knowledge, this is the first attempt to study the response of the surface water, as well as the shallow aquifer, to the impact of seasonal WCC activity. For this purpose, integrated hydrological analyses using the MODFLOW and SWAT models were performed to determine the long-term water budget depletion at the demonstration site based on an expansion of the range of the water budget analysis.
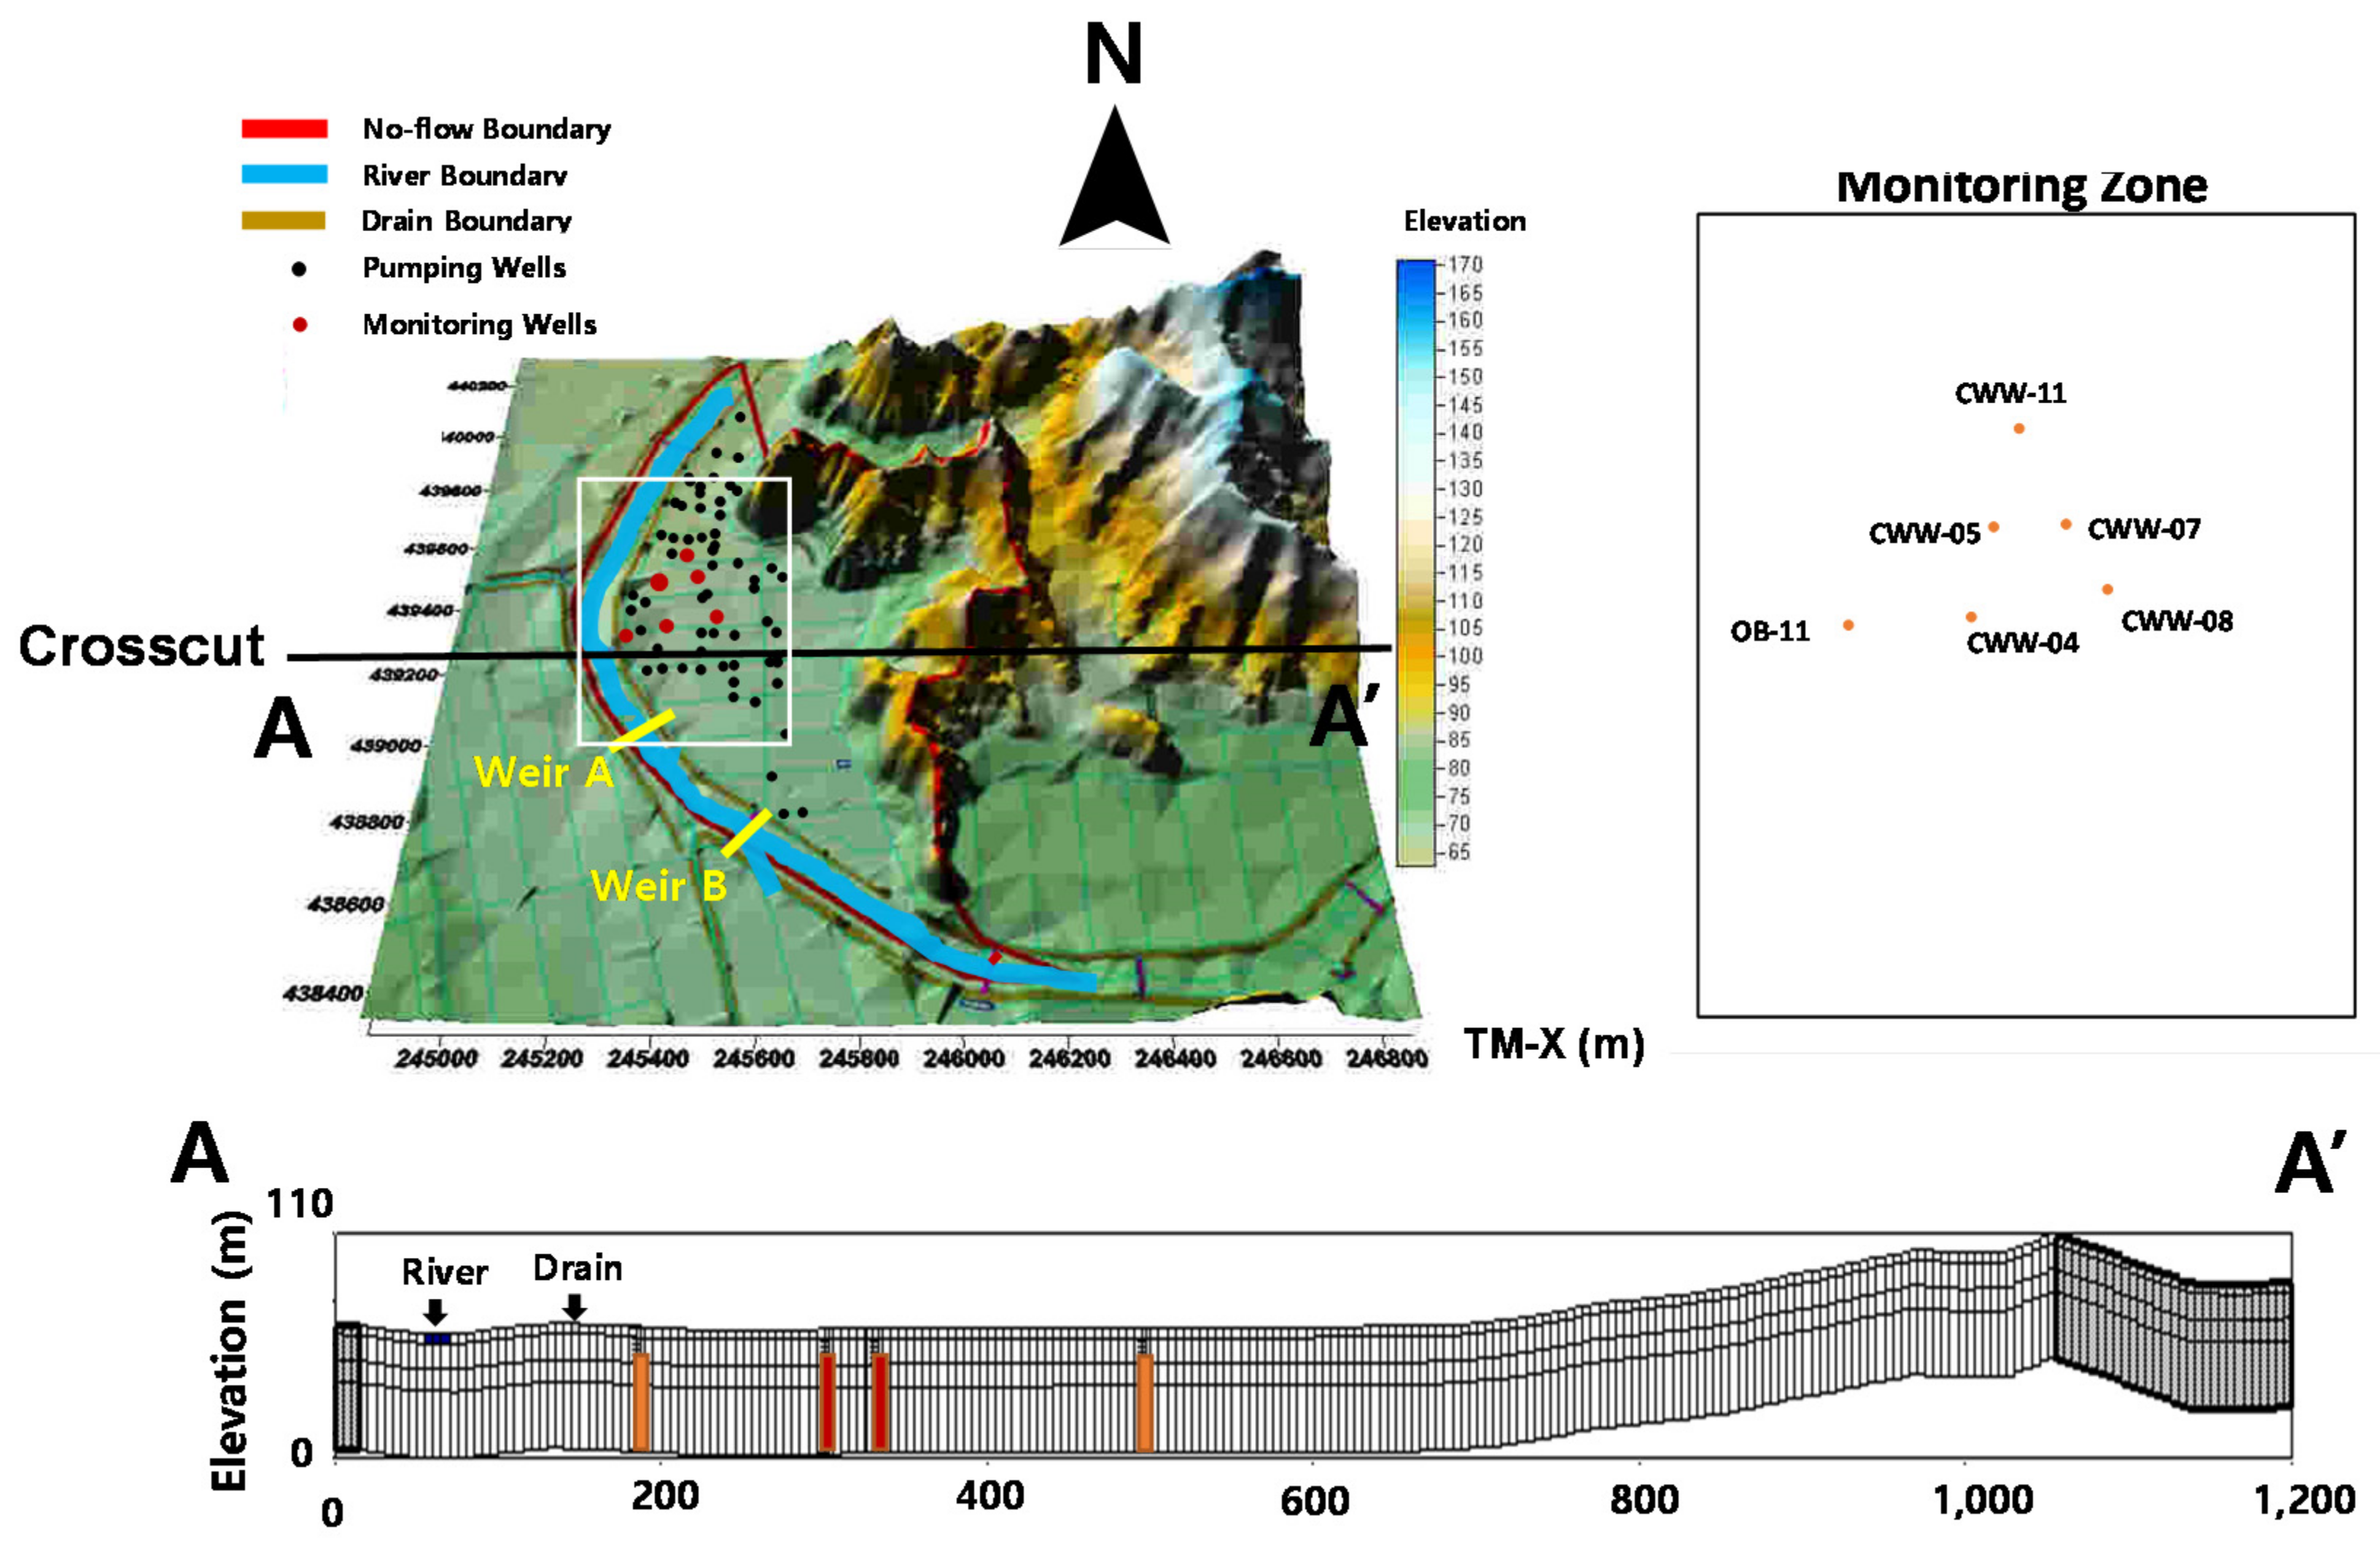
2. Site Description
Figure 1 shows the boundaries of the study area, the cross-section, locations of rivers, artificial structures in the rivers, and pumping wells and observation wells installed for groundwater development. Sangdae-ri, Gadeok-myeon, Cheongwon-gun, and Chungcheongbuk-do, which are demonstration study areas, belong to the Mihocheon basin in the Geum River area. Most of this watershed comprises farmlands used for agricultural activities; greenhouse areas mixed with rice fields and other crop cultivations. The target areas for this study are located in the middle to the upstream part of the Musimcheon, which is a farming area in which paddy fields and greenhouse cultivation areas (represented by recent vinyl houses) are mixed. Pumping wells for WCC and other agricultural activities are scattered throughout the cultivation area; strawberries are mainly cultivated in the vinyl houses. During the summer, the water irrigated from the river flows through the agricultural waterway in the demonstration area; almost all the water that flows through the agricultural waterway during the winter is discharged to the waterway after being used for WCC. The greenhouse cultivation sites in this area suffer temporary reductions in groundwater intake volume owing to continuous groundwater level decreases during the winter.
The geology of Cheongwon-gun is composed of igneous rocks, metasedimentary rocks, and alluvial layers. When the geological age, rock formation, pore shape, and hydraulic characteristics of groundwater are considered, the hydrogeological unit of this study site corresponds to intrusive igneous rock [
14]. Although geological heterogeneity exists, on average, the strata are generally composed of (from the top down) a sedimentary layer, weathered soil layer, weathered rock, and soft rock layer. The soft rock layer is usually 35 m below the surface [
15]. From a geological perspective, there is an alluvial layer deposited by the flooding of the river above the Cheongju granite, which is connected to the east.
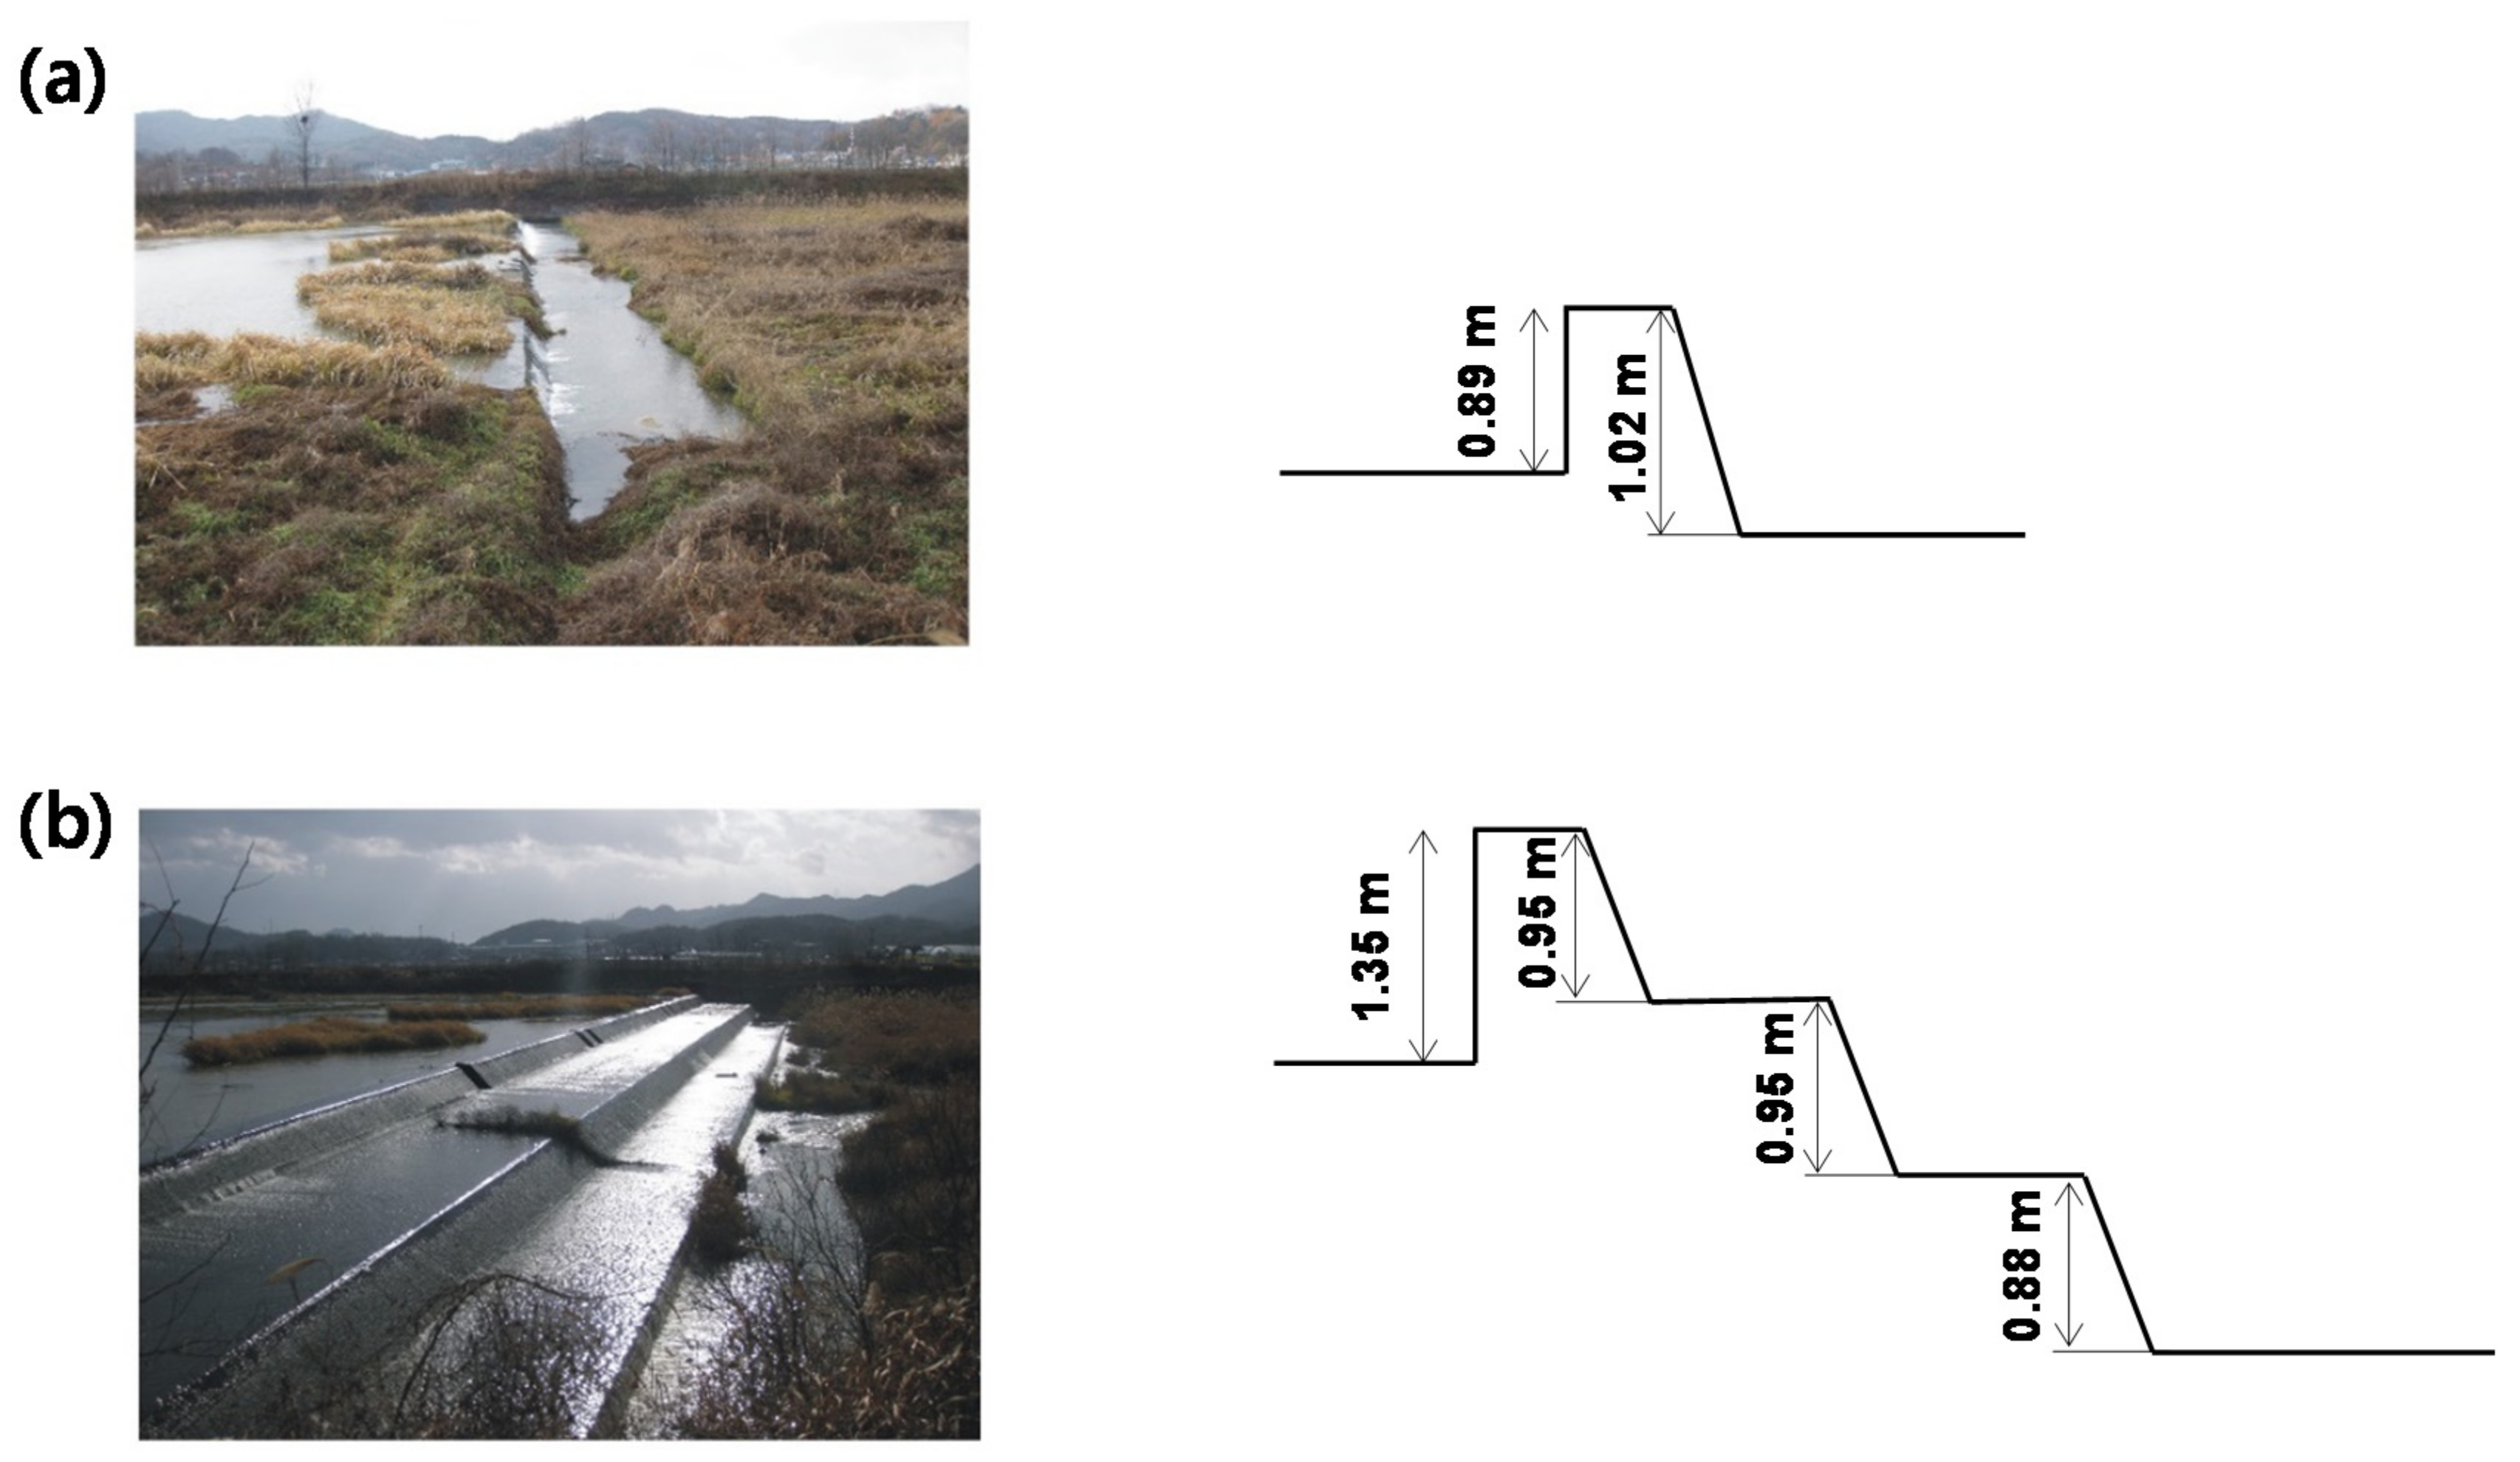
The WCC demonstration area located in the most upstream part of the Musimcheon watershed is located on riverside land to the east of the stream flow created by the meandering stream of the Musimcheon from the northeast. The land near Musimcheon is relatively flat; the northern area of the study area is a low-mountainous terrain with an altitude of 100 m. There is a small reservoir at the most upstream part of the river. Sudden water discharge was not observed from the reservoir. Most rivers in South Korea are not pristine rivers, and artificial structures are installed in most of them. Small weirs are also installed at intervals spanning several kilometers along the Musimcheon. Thus, the river water level is relatively constant during most of the year, with the exception of rainy seasons. Reductions in the water flow of the Musimcheon were not observed during the study period, even during intensive groundwater pumping in the winter.
4. Results and Discussion
4.1. Analysis of Groundwater Level
The groundwater flow decreased from the south toward the north. Groundwater flows from the south to the north, and rapid changes in the groundwater level were observed around the weir in the Musimcheon. The flow analysis results exhibited characteristics of a loss river upstream of the Musimcheon until early November during the full-scale WCC period, whereas the downstream of the Musimcheon in the north exhibited characteristics of a gain river. However, unlike the discharge of groundwater downstream of the Musimcheon before WCC, the entire section of the Musimcheon acted as a loss river owing to the large-scale water intake during the winter period. Because of the difference in elevation (of up to 2 m) in the upstream and downstream parts of the weir, the distribution of groundwater levels was dense. This suggests that the groundwater level variations near a weir were caused by the surrounding groundwater and river water levels. The pattern of the groundwater level decline during the WCC period set as the operation time of the water intake well does not affect the Musimcheon watershed during the first ten days, and variations in the groundwater level only occur near the water intake site, but the radius of the influence region gradually widened. However, the demonstration basin in this study was a narrow basin blocked by rivers and mountains, and a relatively fast overall groundwater level decline could be observed.
For model calibration, the validity of the characteristic hydraulic values was examined based on the field measurement results for water budget simulation, such as the water level contour map, groundwater level time series, and recharge and discharge amounts. In addition, input variables, such as the hydraulic conductivity of the model and retention coefficient were adjusted so that the groundwater level time series values measured in the field would be matched within a reasonable range. Chang and Chung [
24] previously showed a graph that compared the data collected from the observation wells on August 3 before the onset of the WCC and the simulation results of MODFLOW. A good correlation with a coefficient of determination (R
2) of 0.97 was obtained.
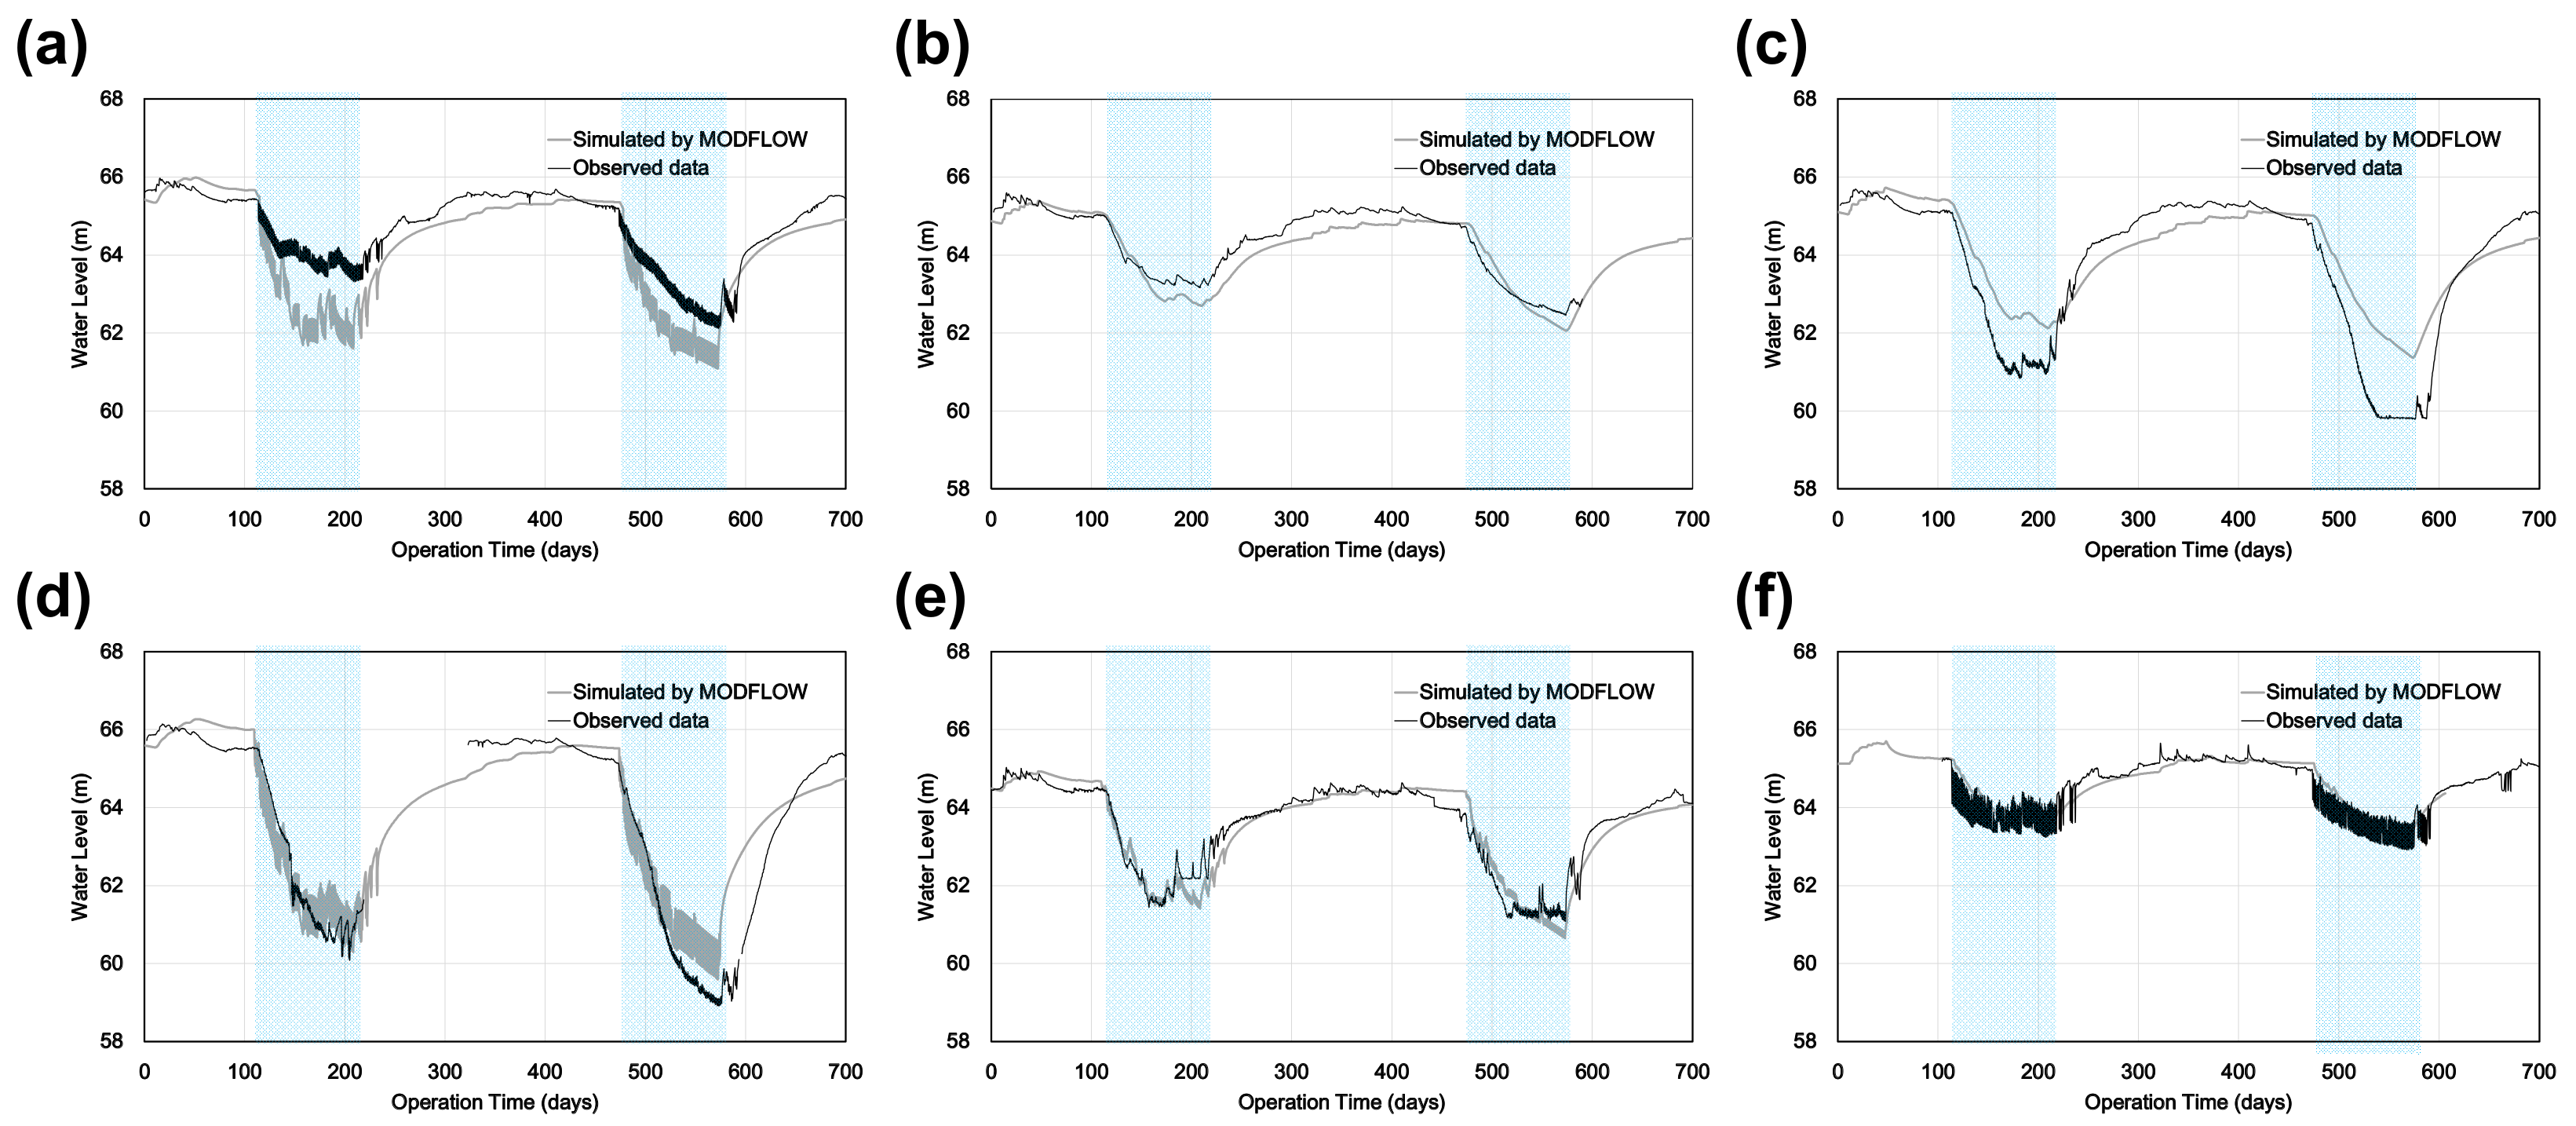
Figure 5 shows six different groundwater level decline–recovery curves, which compare the simulation results obtained from the six observation wells. The gray line in this figure indicates the groundwater level based on actual well measurements, and the black line indicates the precise modeling results using MODFLOW. The blue box represents the WCC pumping periods. The six graphs were based on the values of the six observation wells of CWW-04, CWW-05, CWW-07, CWW-08, CWW-11, and OB-11 in the bank, used in the model calibration. When the WCC began, the pattern of the groundwater level decline exhibited an abrupt change (increased slope) at the early stage. As the slope decreased, the rate of change of the downward trend gradually decreased. When WCC ended, the water level recovered for 3–4 months. Examining the graphs in detail, the periods could be divided into the following parts: (a) changes in aquifer groundwater levels owing to rainfall in the summer, (b) groundwater decline owing to WCC for four months between 2012 and 2013, (c) aquifer water level recovery, groundwater level fluctuations owing to precipitation during the summer in 2013, (d) the re-decline of groundwater level owing to WCC, which started in November 2013, and (e) the re-recovery of groundwater level owing to precipitation during the summer in 2014. The examination of each observation well showed that the groundwater level, which ranged from 63 to 68 m in steady state, declined after the operation of the water pumping well. As the well was farther in the northeast region, which is inland of the river’s downstream, the clustering of the pumping wells was denser. Additionally, as the distance from the river increased, the degree of groundwater declines increased. By contrast, the simulation results showed that in the upstream of the river, a high-water level was maintained because of the river, and an induced recharge in the river resulted in a small water level decline. For example, CWW 8, which is located at a distance farthest from the river, exhibited a large groundwater level decline; however, CWW 11, which was located at a short distance from the river, exhibited a relatively small groundwater decline.
Herein, the simulation results are also discussed, including the variations of the aquifer groundwater level owing to precipitation during the summer period, in addition to the groundwater decline during the WCC period in the simulation period (total of 700 days). In the graph, the groundwater levels during the two cycles of groundwater depletion–recovery were observed. In this period, one year in which the following events occurred was recognized as the WCC cycle: (1) aquifer recharge owing to rainfall in the summer, (2) groundwater depletion owing to WCC, and (3) induced recharge by the river after the termination of the WCC. The analysis onset time and the graph of this study also followed this cycle. As shown in the
Figure 5, the modeling results indicated that most of the demonstrations were influenced by sporadically scattered groundwater pumping. When the two cycles of groundwater level decline and the respective recoveries were compared with the observations, the simulated results were reproduced and were found to be close the observed values. Notably, even though the winter temperatures were not significantly different between the first and second water curtain periods, the groundwater declined more in the second water curtain period.
4.2. Water Budget Analysis
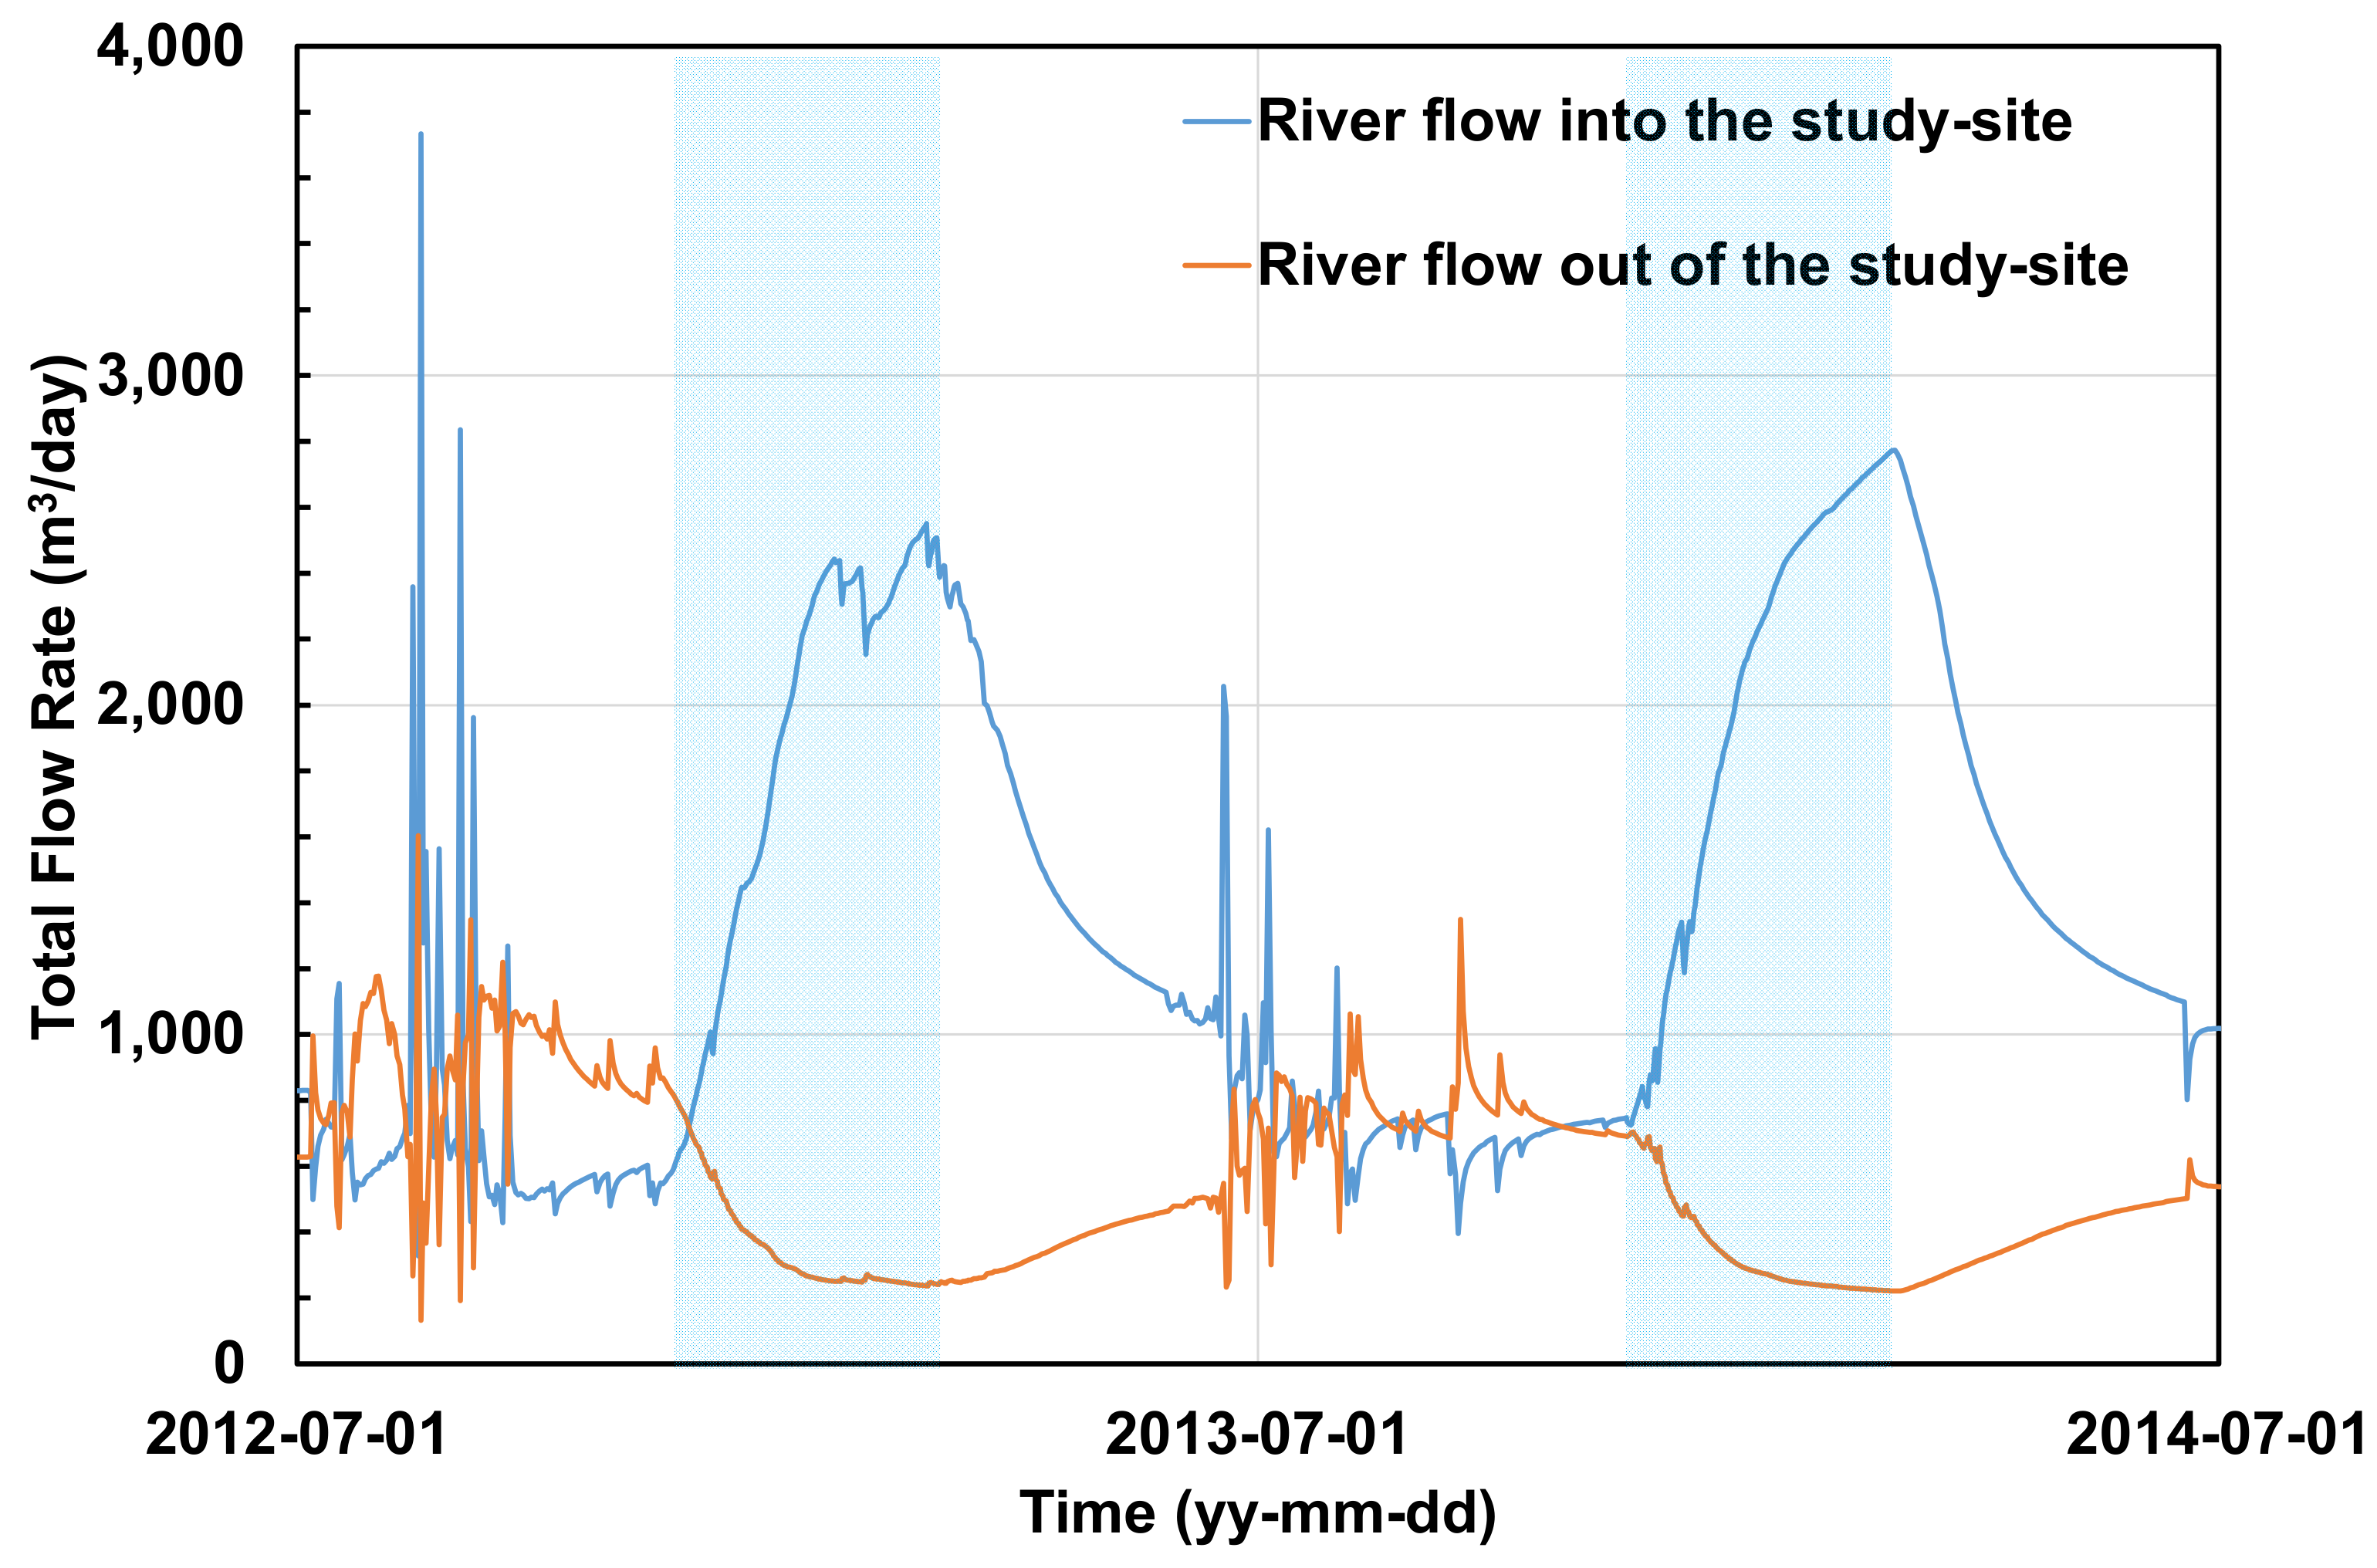
Figure 6 shows a graph of the groundwater disturbance caused by the WCC. The inflow and outflow rates (m
3/day) of aquifer, drain, and river boundary were analyzed throughout the simulation period. Examining the graphs in detail, in the summer, outflows from the aquifer to the river owing to increased precipitation were observed intermittently. During the WCC period, the groundwater depletion in the aquifer increased, whereas the aquifer recharge owing to the induced recharge of the river also increased significantly. The phenomenon of groundwater loss of the aquifer during the WCC period can be expressed as the storage out rate in the graph. The yellow line in this graph shows the recharge induced by the river that increased continually during WCC and that decreased during the replenishment of groundwater in the aquifer during the spring period. Hence, the abrupt change pattern of the aquifer and river can be referred to as an aquifer disturbance by the WCC or surface–groundwater (SW–GW) interaction, showing the direct river-response to the pumping pattern during the WCC in winter.
In addition, the water budget at the center of the aquifer was analyzed. The quantitative values for water budget analysis are expressed as the cumulative volume of groundwater inflow/outflow in the aquifer during a specific period. The changes in the water budget inflow/outflow that an aquifer undergoes are influenced by the pumping pattern during the WCC period. The water budget analysis for this study shows that the aquifer groundwater depleted by pumping was recharged naturally by the recharge induced by rivers and rainfall. When analyzing the groundwater storage of the aquifer, which corresponds to the difference between the cumulative outflow and inflow of the aquifer, the recharge of the aquifer attributed to the rainfall or induced recharge by the river was expressed as a positive value, whereas the depletion of aquifer was expressed as a negative value. These values were used in an effort to show the depletion and recovery patterns of the aquifer.
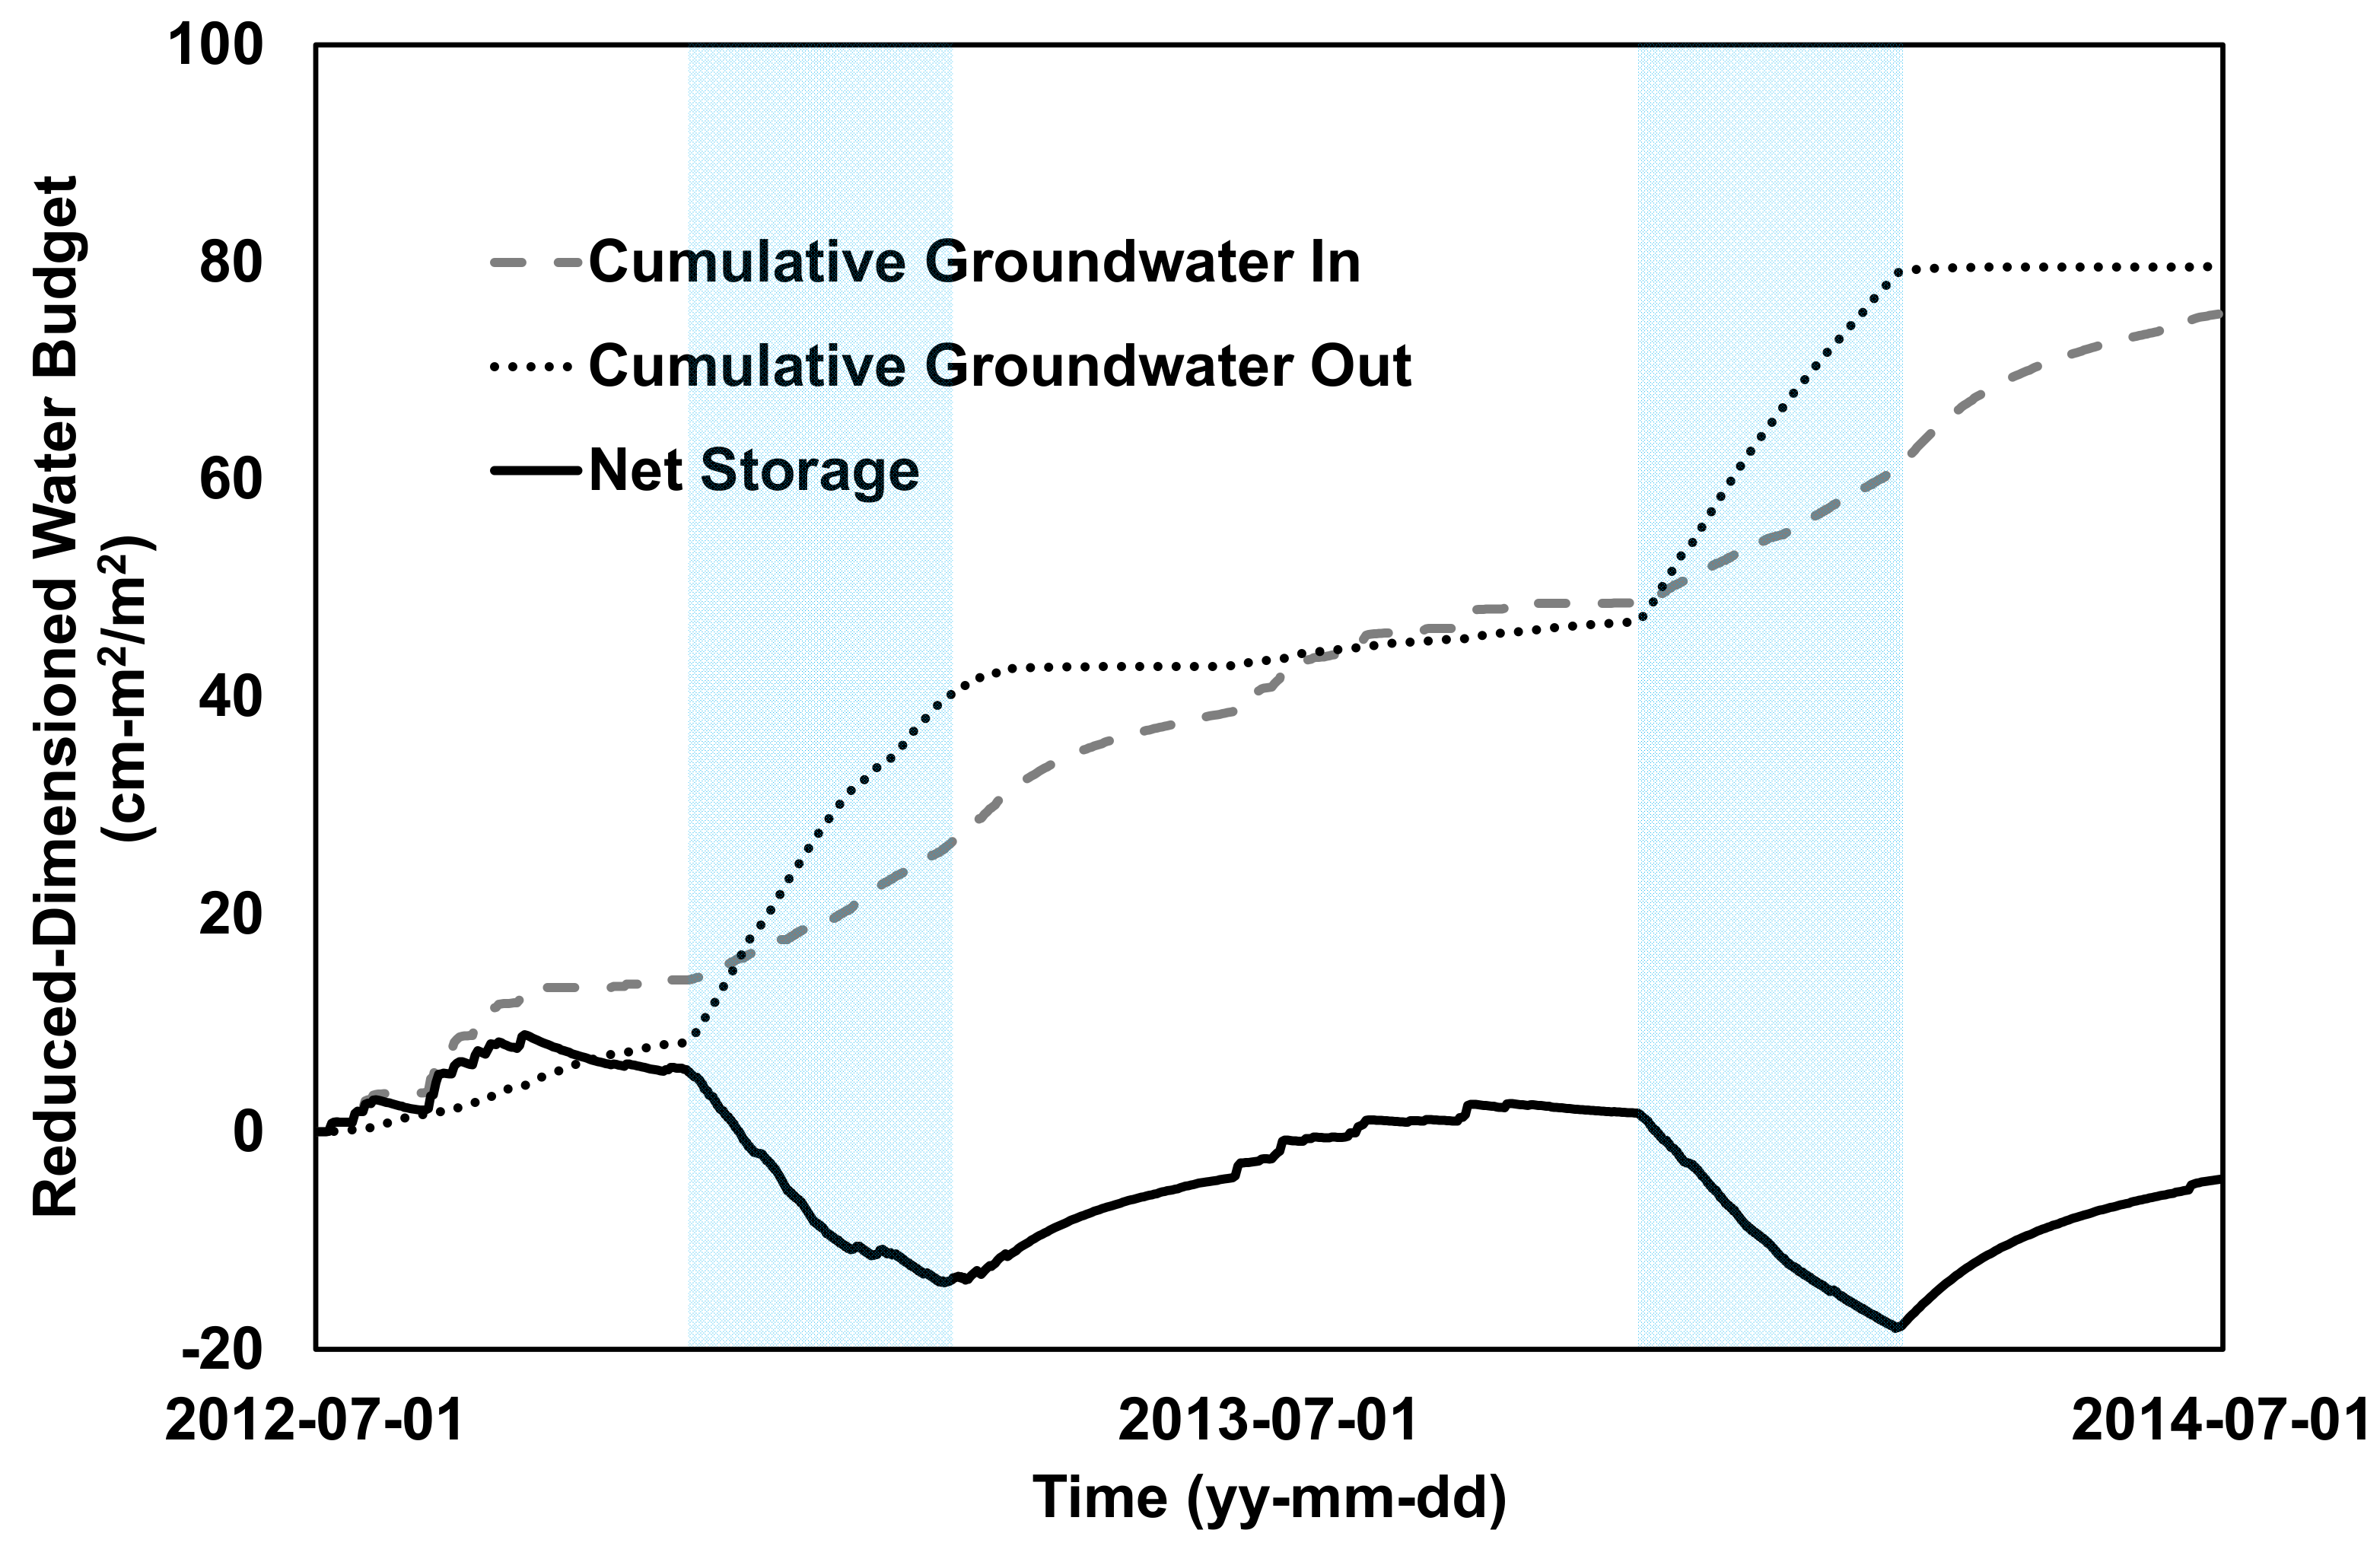
Figure 7 shows a graph that expresses the aquifer net storage, which is determined by dividing the volume [L
3] with a water budget analysis value based on the aquifer owing to the area of the demonstration site in the vertical direction [L
3/L
2]. The volume-based water budget analysis value for a large cultivation area is larger than that for a small area, even if the actual degrees of depletion may be different. Correspondingly, direct comparisons often become difficult. In this case, one-dimensional water budget analysis can be used to compare target sites with different areas. The water budget analysis method expressed in one dimension in this way has the advantage in that it reduces the number of factors to be considered by removing the basin area from the result analysis. It is thus easy to intuitively understand groundwater depletion compared with volume analyses.
Note that the shape of net storage in
Figure 7 is similar to the groundwater level decline–recovery curve. The lowest point of storage owing to the first cycle of WCC in 2012–2013 was −13.7 cm-m
2/m
2. The amount of groundwater recharged by rainfall and by the induced recharge from the river until 1 July 2013 (when the one-year analysis cycle was completed), did not recover to the level of the previous year (−2.5 cm-m
2/m
2). Consequently, the groundwater depletion owing to the WCC in the previous year was not recovered by the aquifer recharge over a year, and the storage value at the end of the WCC period for 2013 and 2014 decreased to −18.1 cm-m
2/m
2, which was lower than the lowest point during the previous year. A comparison of the two lowest points verified quantitatively that it is difficult to completely recover the aquifer depletion owing to recharge from a river or precipitation, and the degree of depletion can therefore worsen every year. We estimate that if this pattern continues, the depletion of the demonstration site could continue for a long time in an irreversible direction.
When the results of July 2012, July 2013, and July 2014 were compared, the groundwater shortage across the aquifer worsened by 2.5 cm per year. This value can be used as an indicator that conceptually represents groundwater depletion, rather than a factor that indicates the actual depth of groundwater decline. This is because the actual groundwater depletion occurs within several tens of centimeters around the pumping well, and almost no groundwater decline occurs in a place where the pumping well is far and where the river is nearby.
4.3. Application of Artificial Recharge Scenario
To predict the groundwater level recovery and water budget change caused by artificial recharge, an artificial recharge scenario was established. This scenario was applied to the model. In this scenario, artificial recharge was performed for the period of 2013–2014, which corresponds to the second WCC period in the study period. The artificial recharge started in December 2013 when groundwater pumping was most active and the temperature was low. Each pumping well performed pumping every day for 16 h and 30 min (which corresponds to 0.68 days on average). Groundwater re-injection was simulated for 7 h and 30 min (which corresponds to 0.32 days), which is the remaining time in each day if the pumping time is excluded. In addition, artificial recharge was performed for 24 h when pumping was not performed owing to high temperatures.
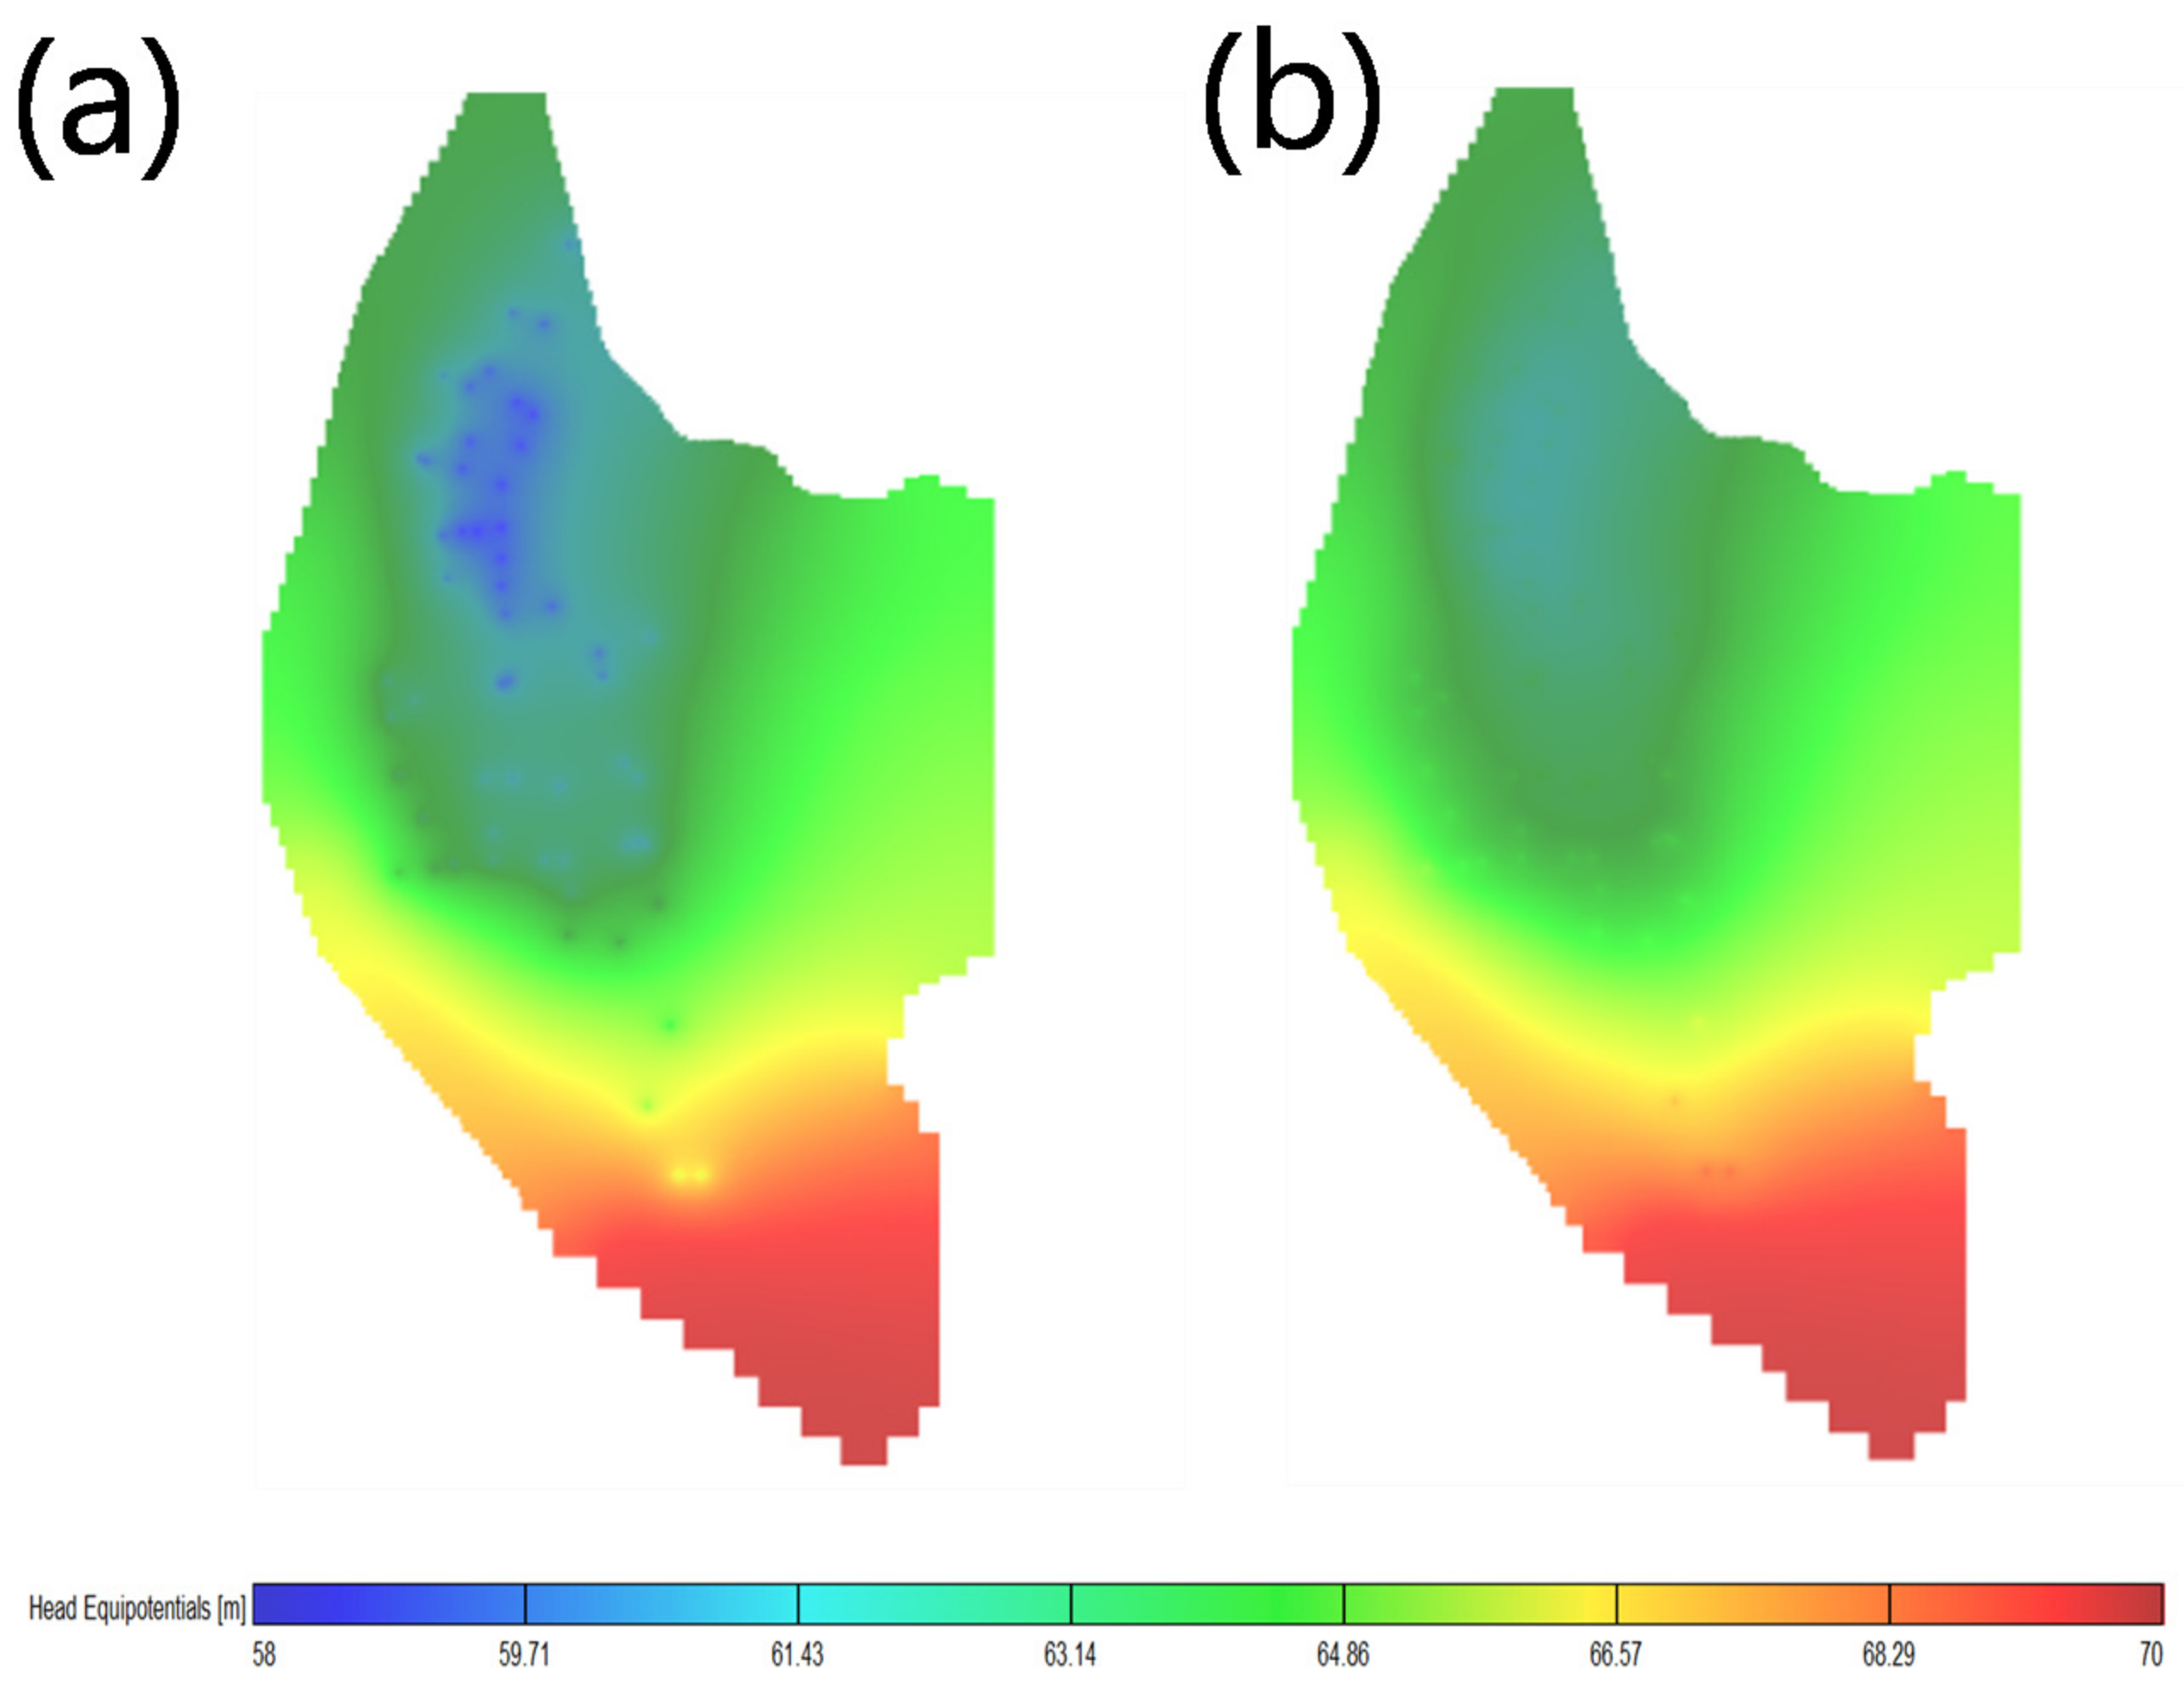
Figure 8 shows the results in the form of a groundwater level distribution map for February 2014, 100 days after the onset of the WCC in November 2013.
Figure 5a shows the groundwater level distribution map representing the spatial distribution of groundwater when WCC was performed using the existing model, while
Figure 5b shows the result of artificial recharge. These results are represented on the plane of the model based on the same data. A distinct recovery of groundwater level can be observed in the north of the cultivation area that corresponds to the downstream section of the river. Specifically, in the cultivation area to the northeast, the water level decreased farther from the river and closer to the mountainous area. Given that a large water level recovery occurred in this area compared with the existing (precise) model outcome, the application of a scenario for WCC water reinjection of 10% can be expected to achieve a maximum water level recovery of 0.8 m. The water level not only recovered at the groundwater injection point, but the largest degree of water level recovery was achieved in the background when the groundwater level decreased considerably owing to the WCC.
The effect of groundwater recharge by the recovery of water level yields different values depending on the observation location. Hence, in order to determine the overall effect of the aquifer changing over time, we performed a water budget analysis.
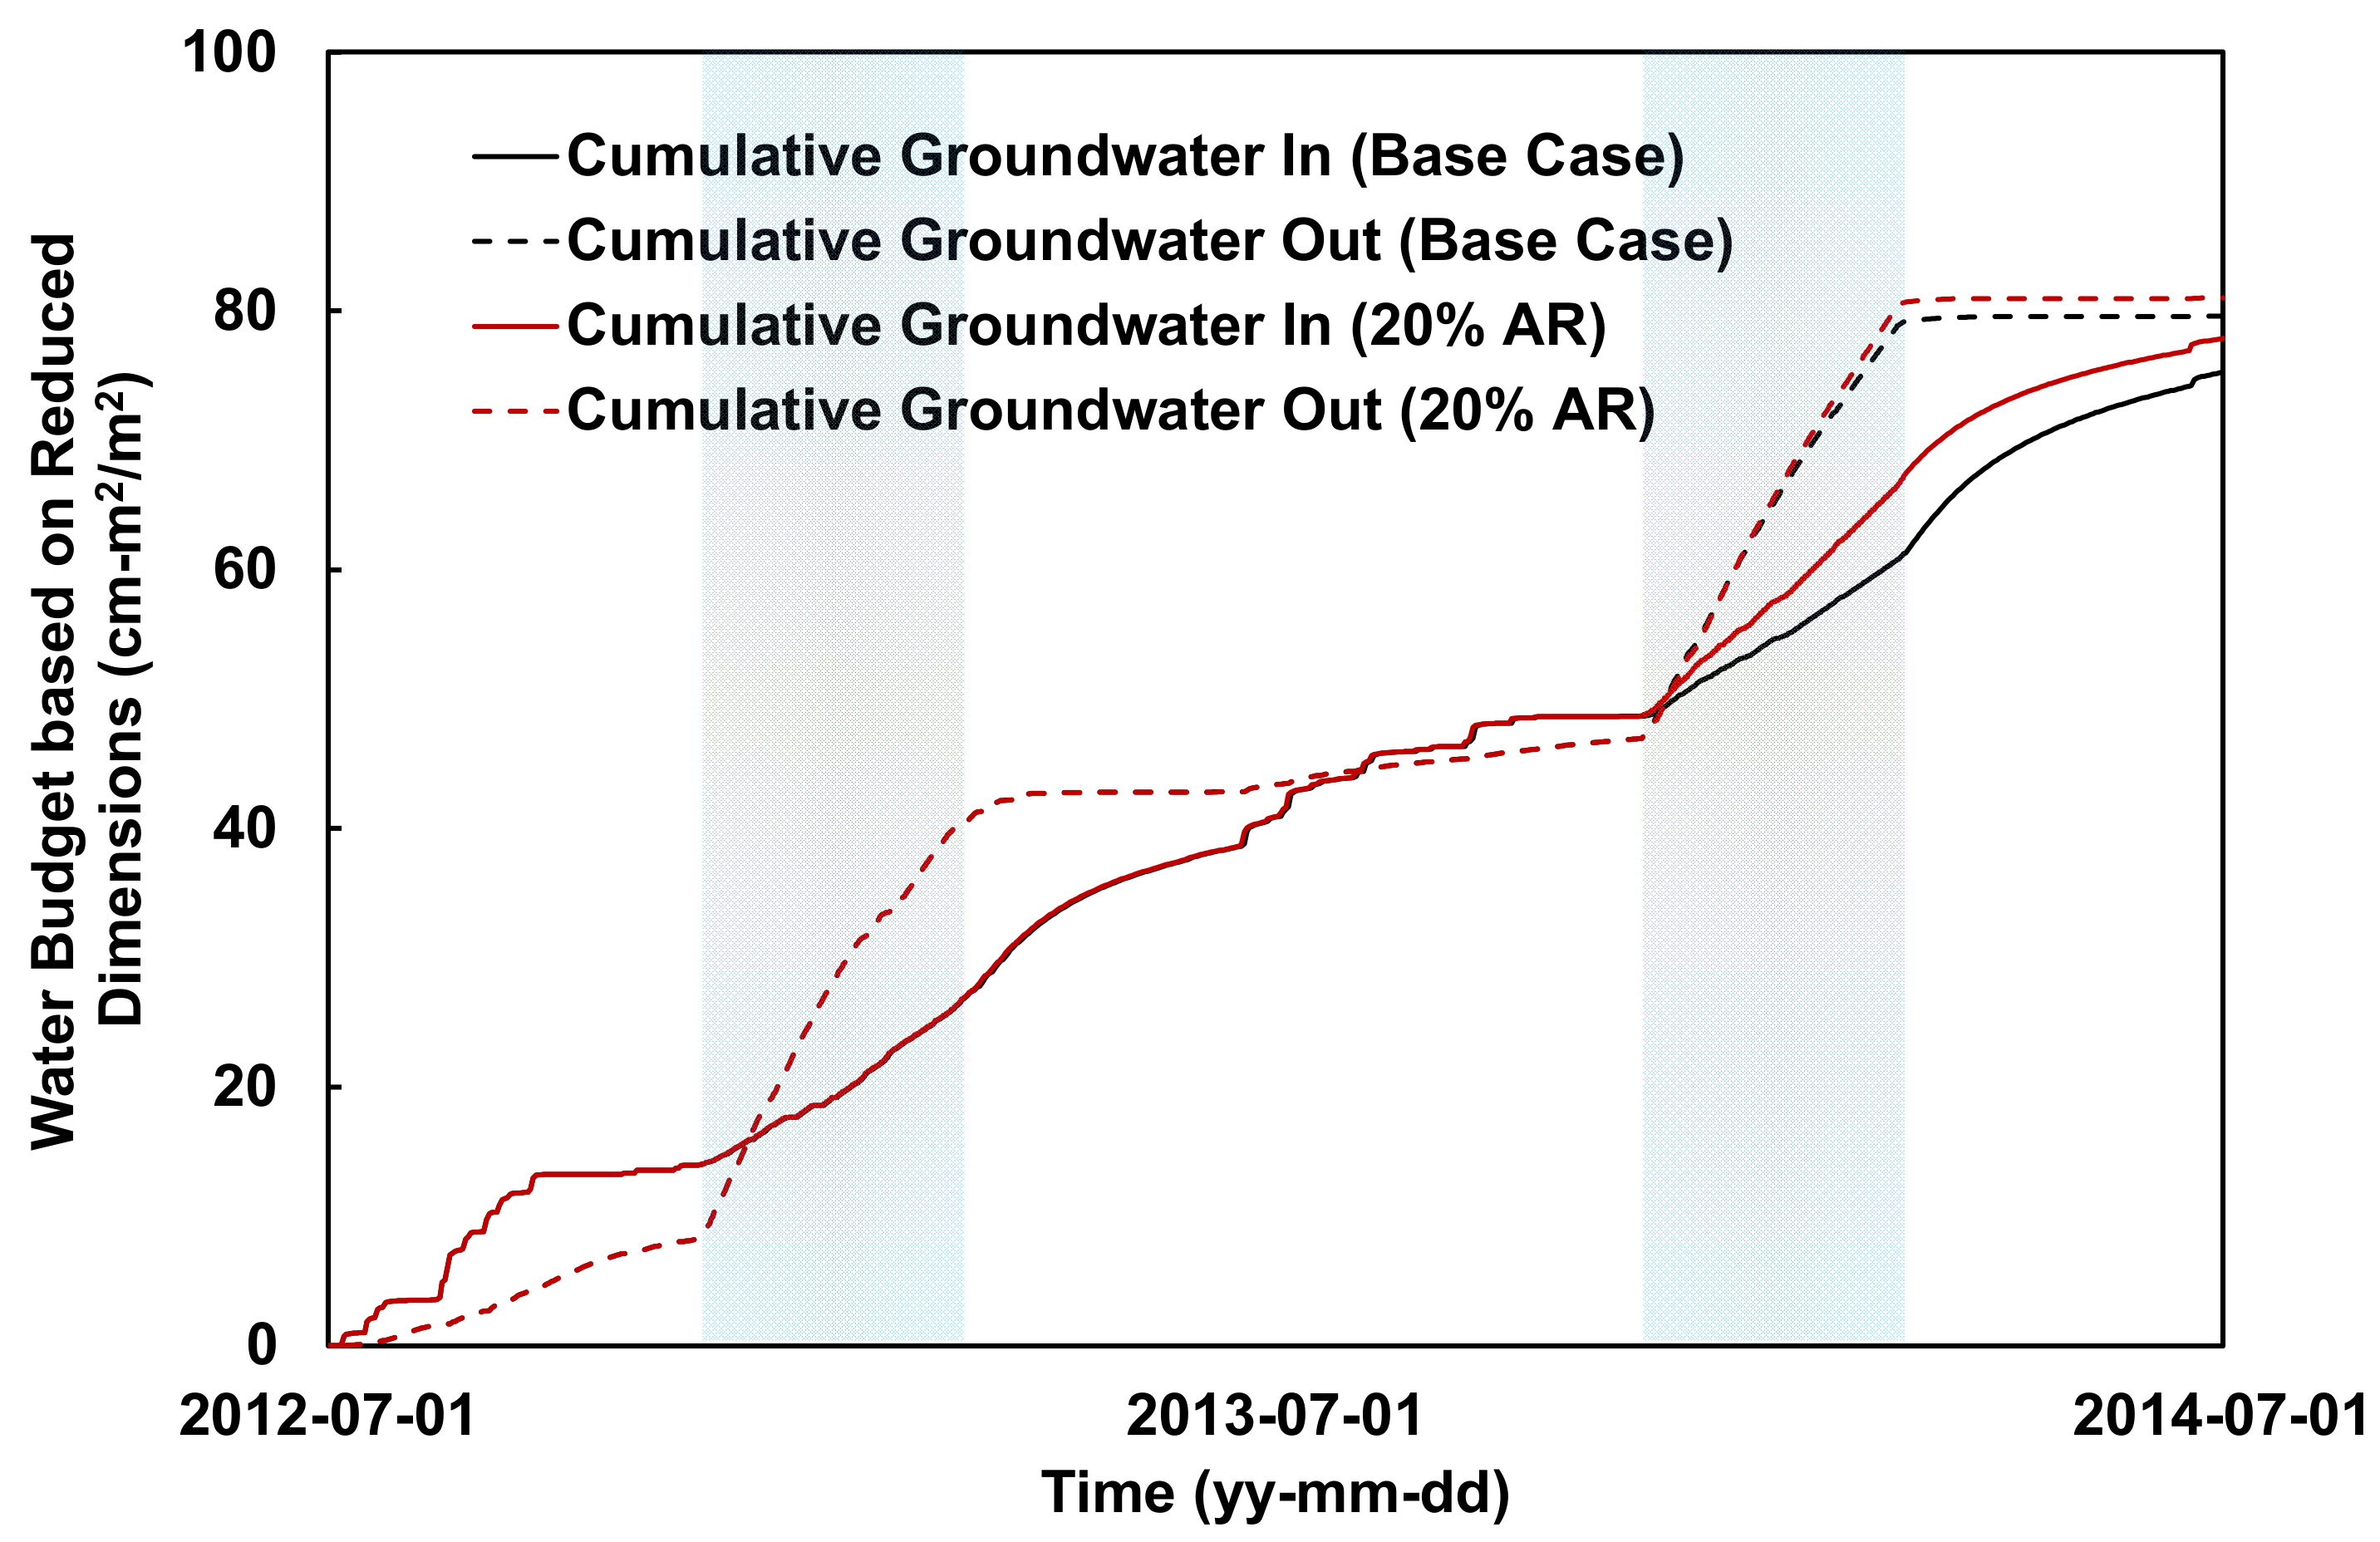
Figure 9 shows a graph plotted using the results of the model that introduced the 20% of artificial recharge scenario for the water budget analysis of groundwater aquifers. A 20% artificial recharge scenario means that freshwater was injected into the aquifer by all wells with an amount equivalent to 20% of the total groundwater withdrawn during WCC. The graph that shows the slope change between the scenarios when the artificial recharge started in December 2013 previously described that groundwater pumping was most active and the temperature was low. The black solid line indicates the cumulative groundwater inflow and the dots indicate the cumulative groundwater outflow from the aquifer as a result of the WCC in the existing model (
Figure 7). The solid red line and dots indicate the cumulative water budget inflow and outflow amounts that changed when 20% of the freshwater was injected for artificial recharge. When the artificial recharge technique was applied, the amount of cumulative inflow became larger than the existing WCC result, as shown in the red solid line compared to the black solid line in the figure. The change in the slope of the solid line indicates the rapid recovery of groundwater storage in the aquifer, while the dotted line indicates relatively little change in outflow from the aquifer. This means that the groundwater lost from the aquifer during this period was reduced owing to artificial recharge.
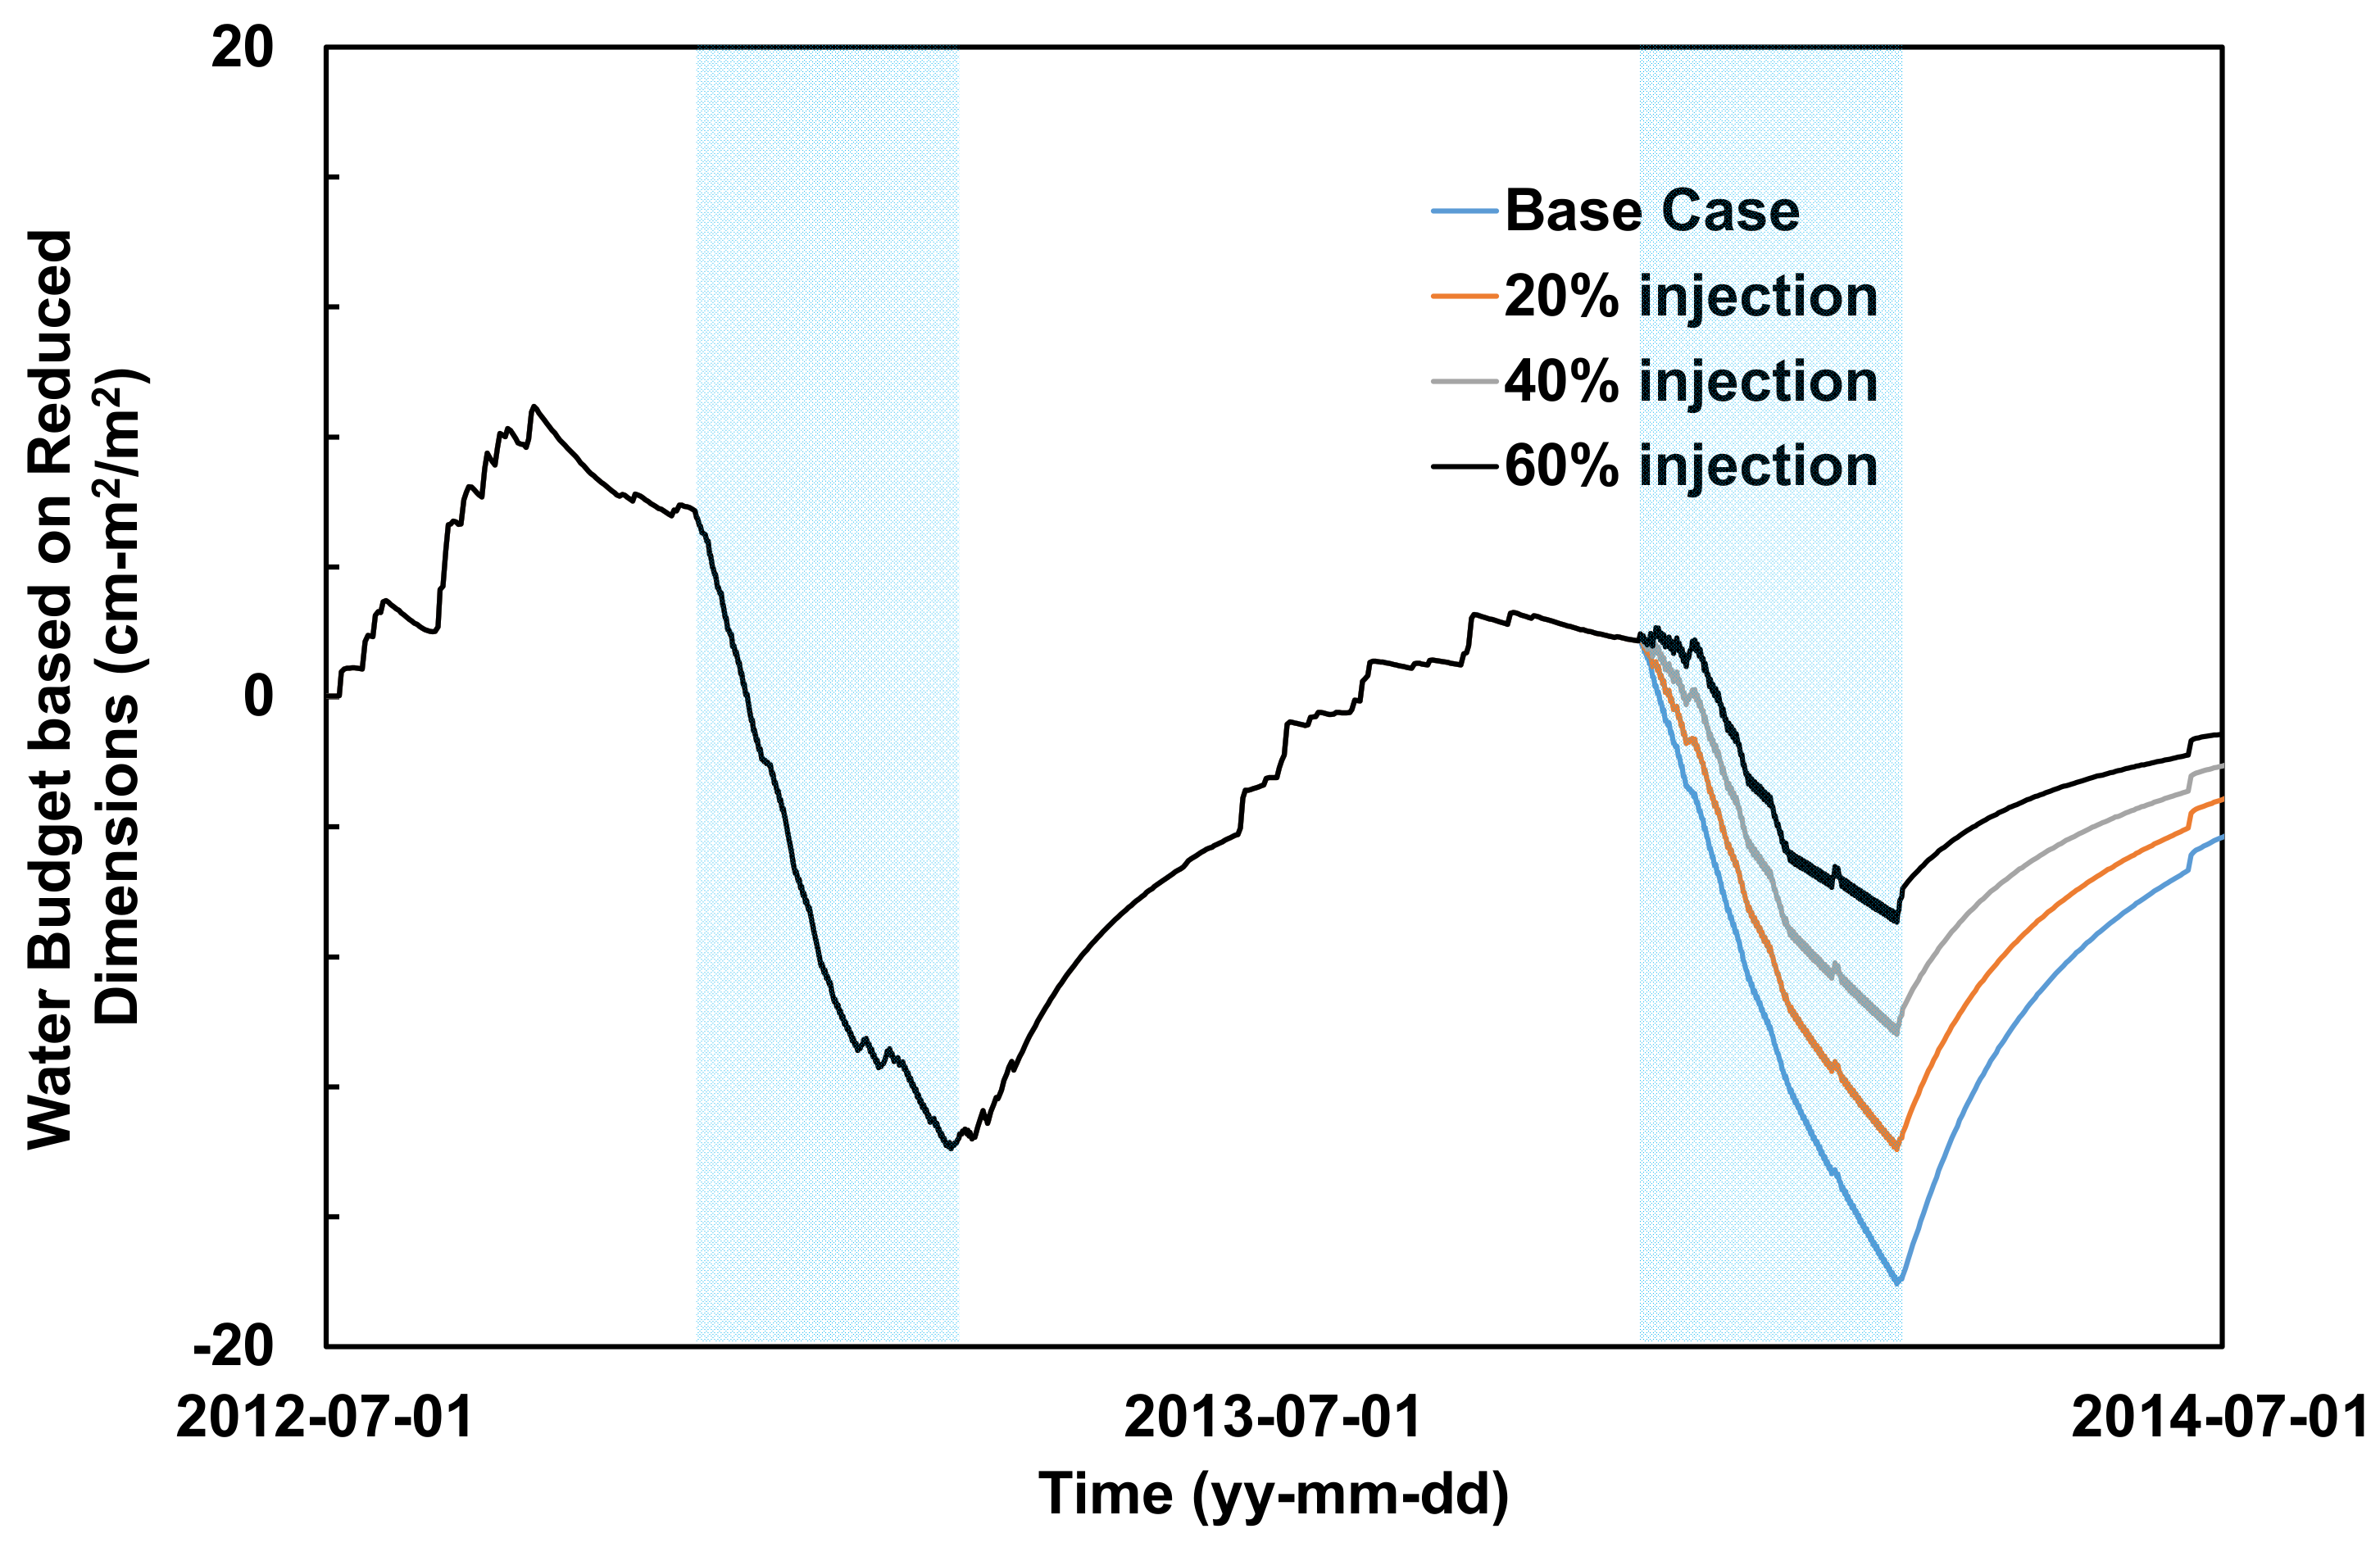
In previous study, Chang and Chung [
24] explained the aquifer changed according to various AR scenarios using the volumetric water balance [L
3], and this study modified the values into the reduced dimensions using cm-cm
2/m
2 shown in the
Figure 10.
Scenarios that accounted for increasing artificial recharges owing to groundwater reinjection (20%, 40%, and 60%) were applied to the model. The goal of the AR scenarios was to maintain the sustainable development of WCC. The 2012–2013 were simulated without AR scenario to be compared the AR application for 2014. As the result, it was found that a 20% artificial recharge of the aquifer is a condition that allows the same level of the lowest decline of previous year, 2013. Meantime, the 40% injection AR scenario showed the similar level of water budget at the end of simulation time that July 2014 shows. Therefore, sustainability solutions can be different depending on whether the groundwater level indicator or the water balance indicator is selected.
5. Summary and Conclusions
According to the United Nations Food and Agriculture Organization, water, energy, and food security are closely correlated. WCC can be a slightly different concept from the water–energy–food nexus, given that water is used directly as an energy source. However, WCC is closely related to water, energy, and food security in South Korea. It uses groundwater as a seemingly infinite energy resource depending on the induced river recharge. However, we found that it causes groundwater depletion of aquifers in a very subtle way. Thus, WCC has a negative aspect (groundwater depletion), and guidelines for appropriate groundwater usage are needed, instead of allowing unrestricted groundwater development. This is because there are many cultivation areas that face difficulties owing to the lack of groundwater.
This study introduced a quantitative analytical method and attempted to present water management directions by establishing a precise water budget analysis method for the WCC demonstration area in Cheongwon-gun, wherein long-term groundwater depletion was expected owing to seasonal groundwater use.
The aquifer disturbance and recovery attributed to the WCC facilities were analyzed precisely for different periods based on the introduction of a method for daily inflow/outflow and cumulative water budget analysis. In addition, a precise investigation was conducted to examine the role of rivers in the aquifer and the model boundary conditions. Furthermore, this study suggested a quantitative method to determine the possibility of sustainable development of an aquifer at the demonstration site from a long-term perspective, and verified the precise water budget analysis method using actual measurements and simulation research for the WCC period of two years. In addition, the appropriate injection range that can prevent long-term aquifer depletion by artificial recharge was explored based on a scenario that re-injected 10% of WCC water with the use of the precise water budget analysis method. The results proved that the degree of aquifer disturbance decreased as the injection amount owing to the artificial recharge increased. However, a 20% injection could maintain the aquifer environment of the previous year’s level in the current situation of the demonstration site. Bredehoeft [
25] considered that when the system enters a new steady state, sustainable development is maintained. At this study site, a groundwater level declines of 2.5 cm in the total area occurred every year. In fact, intense local groundwater depletion occurred at the center of the study site. If the regulation of some areas was enforced with an appropriate optimization method, instead of 20% artificial recharge of the total usage, sustainable development of the total area could be possible if the development amount was reduced to values less than 20% of the usage. Based on these arguments, a follow-up study is required. Furthermore, given that groundwater recharge by river water is a major recharge method for groundwater, a follow-up study that simulates the effect of the river water temperature on aquifers during the winter season should be conducted.


