Current Trends in Fully Automated On-Line Analytical Techniques for Beverage Analysis


Institute of Chemistry of São Carlos, University of São Paulo, São Carlos, SP 13566-590, Brazil
*
Author to whom correspondence should be addressed.
Beverages 2019, 5(1), 13; https://0-doi-org.brum.beds.ac.uk/10.3390/beverages5010013
Submission received: 20 November 2018
/
Revised: 14 January 2019
/
Accepted: 15 January 2019
/
Published: 1 February 2019
(This article belongs to the Special Issue Current Trends in Analytical Techniques for Beverage Analysis)
Abstract
:The determination of target analytes in complex matrices such as beverages requires a series of analytical steps to obtain a reliable analysis. This critical review presents the current trends in sample preparation techniques based on solid phase extraction miniaturization, automation and on-line coupling. Techniques discussed include solid-phase extraction (SPE), solid-phase microextraction (SPME), in-tube solid-phase microextraction (in-tube SPME) and turbulent-flow chromatography (TFC). Advantages and limitations, as well as several of their main applications in beverage samples are discussed. Finally, fully automated on-line systems that involve extraction, chromatographic separation, and tandem mass spectrometry in one-step are introduced and critically reviewed.
1. Introduction
Gas chromatography (GC) and liquid chromatography (LC) are by far the two most used analytical techniques in food analysis. These techniques are widely employed for the separation and identification of both volatile and non-volatile compounds present in beverages [1]. In most cases before the chromatographic analysis a sample preparation step is required, determining the analysis time once this stage is considered is equivalent to ca. 80% of the total analysis time [2].
Because of the high complexity of some beverage matrices or the presence of contaminant compounds in very low quantities, choosing the proper sample preparation technique is of utmost importance to make an adequate sample clean-up that allows increasing the sensitivity of the detection stage. Sample preparation allows isolating the target analytes from the interfering components in the main matrix and enriches them, in order to identify and quantify them with precision. Although being a relatively simple process, it is critical because all errors that occur in this stage cannot be corrected, even with the best of separation or detection method available [2].
Classical sample preparation techniques such as liquid-liquid extraction (LLE) and solid-phase extraction (SPE) [3] are the most commonly employed techniques; more recently, miniaturized solid phase techniques have also been playing a relevant role [2]. These techniques such as solid-phase microextraction (SPME) [4], in-tube SPME [5], and turbulent-flow chromatography (TFC) [6] have gained particular interest since they offer several advantages that include reduced analysis time, less solvent consume, less use of toxic solvents, automation of the extraction process, and on-line coupling to GC and LC systems.
In a typical analysis, after the sample preparation step, the target analytes are transferred to the chromatographic system to be separated and detected, which can occur in two different ways: Off-line or on-line. In the off-line mode, the sample preparation step and chromatographic analysis are carried out separately, which means that the sample needs to be manually transferred from one system to the other. The on-line mode implies a physical connection between the sample preparation device and a chromatographic system. This mode usually employs either a valve or an interface to connect the two systems thus allowing the full automation of the analytical process [7]. Many different on-line couplings have been made to improve analysis performance, reduce the time required and increase productivity. Besides, this set up minimizes sample handling reducing analytes losses. These couplings depend on both the sample matrix and target analytes, as well as on the analytical performance required, the instruments available and the size and quantity of samples [8,9,10].
Over the past years, sample preparation and analysis are moving towards the development of fully automated analytical techniques that permit extraction, separation, detection, and quantification in a single and continuous stage, usually employing tandem mass spectrometry (MS/MS) as the detector, which are becoming widely used methods in the analysis of beverages. The use of MS/MS allows the unequivocal identification and quantification of the target compounds at very low levels, improving selectivity and sensitivity especially when complex samples are analyzed. The sequential combination of sample preparation, chromatographic separation, and MS/MS systems benefits from their complementary advantages, resulting in a powerful tool able to cover the majority of challenges in beverages analysis, and simplifying routine methods [11].
This review focuses mainly on extraction techniques and their on-line coupling with analytical instruments, mainly GC and LC. Principles, automation and on-line fully automated systems are described evidencing the main reported applications over the last decade, as well as the potential applications of this approach to the analysis of beverages in the coming decades.
2. On-Line Solid-Phase Extraction (On-Line SPE)
The most common and widespread sample preparation technique is liquid-liquid extraction (LLE), which is based in its simplest form on the division of the analyte between water and an immiscible organic solvent. However, due to the necessity to analyze complex matrices requiring more selectivity than that offered by LLE, solid-phase extraction (SPE) emerged as an alternative extraction technique. Modern SPE allows a broad field of applications and is often been the subject of detailed studies and reviews [12,13]. In this technique, during the extraction process, an aqueous sample passes through a sorbent material (solid-phase) and the analytes are extracted with a suitable organic solvent. However, limited efficiencies can be observed caused by poor retention, principally in the care of very polar analytes, which means low recoveries during the extraction process. To overcome this drawback, other types of materials have been developed and utilized [12].
In SPE, the analytes to be extracted are divided between a solid phase (sorbent) and a liquid phase (sample). The analytes must have a higher affinity for the solid phase than for the sample matrix. Generally, a typical SPE experiment consists of four steps: Conditioning of the sorbent phase; sample loading by passing the sample through the sorbent; washing of the column to eliminate interferences with proper solvents; and finally the elution of the analytes retained in the sorbent.
The Nernst distribution law describes the basis of the extraction procedure. A compound is distributed between two immiscible solvents according to a constant ratio of their concentrations between the two solvents. The system constant is described as the Nernst distribution coefficient, Kd, and is presented according to the relationship:
where Cs and Cm are the concentrations of compounds in the solid (s) and liquid (m) phases, respectively [14].
2.1. SPE Formats
SPE has been employed in different formats (that may vary in size) the most popular ones are: (1) Cartridges (usually in 1 mL syringes to 6 mL syringes), (2) disks (47 mm in diameter), (3) SPE pipette tips, and (4) 96-well SPE microliter plates (using 1 mL disks) [15]. The cartridge is the most commonly used design; it consists of a syringe barrel containing a sorbent phase fitted between two 20-μm frits. These frits are porous and usually made of polyethylene (PE), polytetrafluoroethylene (PTFE) or stainless steel.
Another format is the extraction disk; it contains particles usually between 8–12 μm placed in an inert matrix. The main advantage of the disks is that the samples are passed through it at higher flow rates, which is very important in the analysis of traces of organic compounds in water, allowing shorter extraction times. Even so, standard SPE cartridges continue maintaining their advantage concerning the other formats. In SPE, the search continues for new formats that use less materials, presents higher performance capabilities and are easier to be employed for the development of future process extraction [15].
One of the main SPE drawbacks is the ease of blockage of the sorbent pores by small particulate matter present in the different (activation, washing, and elution) solvents or by endogenous matrix compounds. Besides, the large number of stages needed to carry out this technique may facilitate contamination of the original sample during the process. This explains why SPE continued to be improved towards a more environment and analyst friendly technique, originating the nowadays-termed miniaturized techniques. This group of techniques has been highlighted against conventional ones by their possibility of minimizing both the consumption of toxic organic solvents and the volume of sample used. In addition, the extraction phases can be reused (in opposition to the dischargeable conventional SPE cartridges), a better pre-concentration of the analytes is obtained and it is possible to directly couple them with chromatographic systems, such as in the case of solid-phase microextraction (SPME) [4], solid-phase dispersive extraction (dSPE) [16], stir-bar sorbent extraction (SBSE) [17] and microextraction in packed sorbent (MEPS) [18]. These techniques allow extracting and concentrating the solute in the same stage, which reduces the potential loss of solutes and analysis time. In addition, when directly coupled to chromatographic techniques, the smaller number of steps to be employed reduces human experimental errors. As a result of these characteristics, these micro techniques make it possible to determine compounds in various complex matrices such as food and beverages, environmental samples and biological fluids at trace levels. Although, in this review not all techniques are going to be addressed, it is important to bear in mind that they have been essential in the advancement of sample preparation techniques.
2.2. SPE Sorbent Phases
SPE is a selective method that offers innumerable sorbent material options from traditional materials as reverse phase sorbents (C18, C8), normal phase sorbents (silica, alumina), ion exchange sorbents, and polymers (styrene-divinylbenzene, SDVB) or mixtures of them, to new materials such as bonded silica, carbon-based and selective materials such as molecularly imprinted polymers (MIP) [19], immobilized receptors or antibodies (IMS) and restricted access materials (RAM) [20,21,22].
Silica-based materials are the most commonly used and commercially available but they present a great disadvantage, which is the presence of residual silanol groups that interact with the water present in the sample covering the active sites available for the extraction [23]. Thus, as the particles employed in high-performance liquid chromatography (HPLC), the tendency is to minimize the number of residual silanol groups through end capping these groups with a short alkyl chain bonded silica to obtain a better extraction efficiency.
In recent years polymer-based sorbents are also available for SPE, which have advantages such as not requiring acid / basic elution modifiers, nor presenting pH limitation (are stable from pH 1 to 14). Also, has a high sample capacity, great flexibility during method development, and the absence of silanols groups. Altogether polymer-based phases drives to the predominance of a retention mechanism in opposition to bonded silica that might allow different retention mechanisms in the same sorbent.
The most commonly used polymeric sorbents are (poly) styrene-divinylbenzene copolymers (STY-DVB) [24].
One of the current but rarely described approaches with great potential is the use of nanofibers as materials for solid phase extraction. Thanks to the small size of the fiber, with diameters below 1000 nm, the nanofibers have a large surface offering a great extraction capacity. Several approaches to nanofibers have already been described, the most common form being electrospinning, during which nanofibers are formed from a solution or melt of a polymer with the help of a strong electrostatic field [25]. There are only a few articles that focus on the application of nanofibers as SPE sorbents [26,27,28], and these studies carried out extraction employing an off-line mode using either disc tips or pipettes SPE devices, which is tedious and time-consuming. Therefore, the number of articles published in the last decade using nanofibers for on-line extraction directly coupled to a chromatographic system is still limited [26]. Another work reported the production of polyamides nanofibers using magnetic and electric fields, obtaining nanofibers that were utilized for SPE extraction on-line with HPLC [29].
In addition to the large number of sorbents reported in the literature, a considerable amount of manufacturers and distributors offer a large number of SPE sorbent phases, formats, and sizes, making this technique easily affordable to analysts almost everywhere.
2.3. Automated SPE
Sample preparation techniques coupled with automated analytical techniques have become popular and have been widely used in recent years, obtaining less contamination and more reliable analytical results. The SPE purpose is mainly to retain the analytes of interest in the sorbent material. Once the solid support retains the analytes, these are further eluted with an appropriate solvent to be detected later; alternatively, they can also be measured directly on the support, which provides better detection limits by avoiding the dilution phenomena involved in the elution process utilizing an optosensor [30]. Automated SPE devices are usually classified as either homemade [30] or commercial [31]. Most on-line SPE procedures consist of SPE columns coupled to liquid chromatography (LC) systems with mass spectrometry (MS) or spectrophotometric detection. In the case of coupling SPE with gas chromatography (SPE-GC), a derivatization process and application of small injection volumes are usually required. Several systems have been developed for on-line SPE-GC utilizing six-port rotary valves as an interface, usually called the column switching approach [32]. Several sample preparation units are commercially available for fully automated for SPE-GC and SPE-LC.
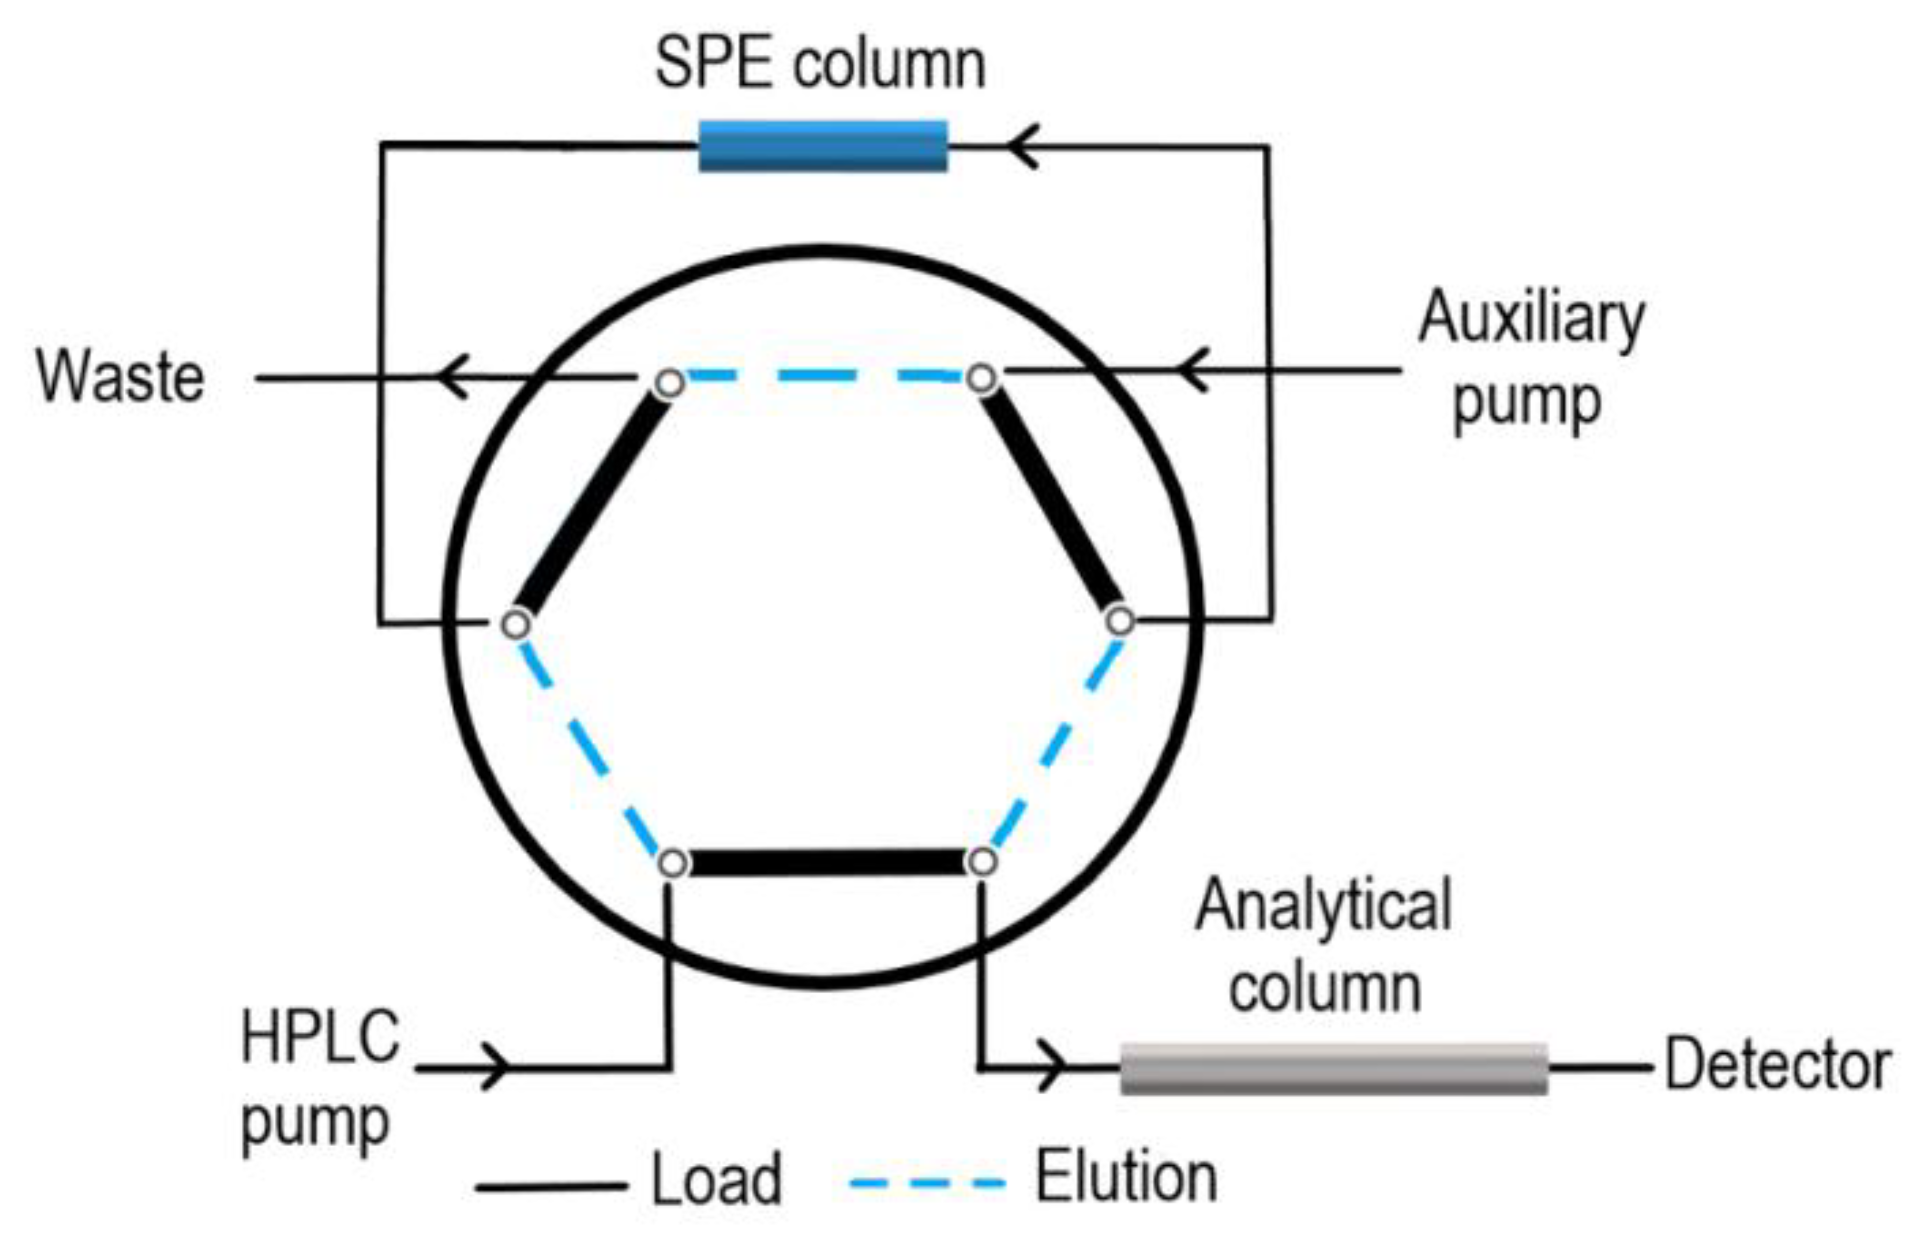
When SPE is coupled to LC, the system configuration consists of extraction and analytical columns, switching valves, and auxiliary pumps (Figure 1). When the valve is in the load position, the sample is introduced into the SPE column, which has been preconditioned with appropriate solvents; then, the valve is changed to the elution position and the analytes are transferred to the analytical column, through the mobile phase, to be separated and detected. The analytes can be eluted in two modes: Straight-flush or back-flush. In the first mode, the analytes are eluted in the same direction in which they were loaded, and in the second mode, the analytes are eluted in the opposite direction to avoid band-broadening [33].
Therefore, on-line SPE when compared to off-line SPE offers a number of advantages such as: (1) Reducing sample preparation time as conditioning, washing and elution processes are automatically performed; (2) reduces the risk of sample contamination and analyte degradation; (3) reduces analyte loss by evaporation; (4) cartridges can generally be reusable; (5) improves the accuracy, increases the detector sensitivity and makes it possible to work with much less than 1 mL of sample; (6) decrease solvent consumption and waste disposal costs, reducing operator risk of exposure to infectious or toxic solvents [34,35,36,37].
However, on-line SPE methods still present some challenges such as optimizing the pre-concentration and elution procedures to achieve satisfactory precision in a single step for different classes of compounds. Additionally, SPE on-line coupled with ultra-performance liquid chromatography (UPLC) presents disadvantages because of the elevated back pressure generated by the high flow rates used in small particle size columns (<2 μm) [34]. On-line SPE has other drawbacks including a demand for expensive equipment; exhibits low portability; coeluting of matrix interferences; absence of extracts to repeat the analysis; sorbents contamination; among others [35].
2.4. SPE Applications
In addition to the beverages field—the primary purpose of the present report—SPE has been applied to the analysis of environmental, clinical, food, and botanical samples. Table 1 summarizes the most commonly studied compounds and the most frequently analyzed types of beverages.
Wang et al. [38] developed a method for determining Pb(II) in water (tap and mineral water) and beverage samples (apple juice, orange juice, sea-buckthorn juice and liqueur). In this method, a hybrid monolithic column based on layered double hydroxides (LDHs) nanosheets-alginate hydrogel was used as an SPE device. Traces of Pb(II) could be preconcentrated quantitatively in pH 6.0 with high recoveries (>97%). The preconcentration factor and the precision expressed as the percent relative standard deviation (% RSD) were found in 0.39 μg/L, 53.7 and 2.65%, respectively. This SPE method demonstrated a high absorption capacity and preference for the extraction of Pb2+ over other heavy metals studied as Cu2+, Zn2+, Cd2+, and Mn2+. The column was free of matrix interferences and can be potentially applied to the separation, preconcentration and determination of trace amounts of Pb2+ in beverages.
In another reported work, Háková et al. [20], used three different approaches to obtain nano/microfibers, examining their diversity and extraction properties. For that purpose, the authors investigated five types of nano/microfiber fiber polymers as sorbents: (1) Polyamide 6 nanofibers, (2) polyvinyl difluoride nanofibers, (3) polyethylene microfibers and (4–5) two new polycaprolactone nanofiber/microfiber and polycaprolactone microfibers/polyvinylidene difluoride nanofiber composite polymers. Extraction conditions were optimized for each polymer. The nano/micro compound consisting of polycaprolactone microfibers/polyvinylidene difluoride nanofibers was chosen as the most suitable sorbent for the on-line extraction of ochratoxin A (OTA) in beer, detecting a concentration between 2.5 and 5.0 mg/L and having high recovery percentages between 99.1 and 103.9%.
Finally, we have to highlight the research of Xie et al. [41], which determined protocatechuic acid (PCA) in fruit juices from a local market in Changsha, China, being necessary to perform a selective sample pretreatment to avoid matrix effects, before analysis by HPLC. PCA was extracted with a magnetic molecular imprinted polymer (MMIP), which facilitated its extraction and detection in grape juice, at a concentration of 0.45 μg/mL (PCA was not found in apple, pineapple, orange or peach juices), with satisfactory recoveries (92–107%). The results indicated that the synthesized MMIP could be used for the efficient and selective extraction of PCA in complex matrices.
3. Solid-Phase Microextraction (SPME)
Of all matrices, food - a group of diverse matrices that includes both liquid (beverages) and solid formats - present one the most diverse and complex compositions. This constitutional diversity creates challenges and difficulties that cause food analysts to search for the best sample preparation technique to carry out their analysis. Analysts face the challenge of developing faster and more precise methods that can guarantee the safety, quality, authenticity and traceability of food products. Nowadays, extensive efforts towards the modernization of analytical instrumentation have been greatly simplified and, at times, have even eliminated the need for complex and laborious sample preparation procedures before analysis [44].
There are still situations in which the sample preparation represents the bottleneck in the search for ideal analytical methodologies. As such, simpler sample preparation methods are sought, not only to reduce the time required to process them, but also to reduce the errors associated with each step of the procedure, since, statistically, the amount of uncertainty in a method is directly related to the number of steps it contains. One of them was introduced at the beginning of the 1990s, so-called solid-phase microextraction (SPME). This technique addresses several advantages over the traditional sample preparation technique since it successfully integrates several analytical steps, such as sampling, extraction, pre-concentration and, in the case of applications coupled to GC, the direct introduction of the extract into the analytical instrument [44].
SPME is a portable, simple, sensitive, time-efficient, cost-effective, reliable, easy-to-automate sample preparation technique that minimizes solvent consumption. Unlike conventional exhaustive extraction methods, such as SPE, SPME is a non-exhaustive technique based on the partition equilibrium of the analytes between the sample matrix and the extraction phase. In SPME, the extraction phase can be exposed directly to the sample medium (direct immersion, DI) or its head-space (HS). When the SPME coating is placed directly in contact with the sample, the amount of analyte extracted in equilibrium () can be described as [45]:
where is proportional to the distribution coefficient of the analyte between the coating and the sample matrix (), the volume of the extraction phase (), the volume of the sample () and the concentration of the analyte in the sample matrix (). This implies that the amount of analyte extracted on the coating () is linearly proportional to the concentration of the analyte in the sample (), which is the basis for quantitative analysis using SPME. Considering that the volume of the extraction phase Vs is large enough ( >> ), Equation (2) can be simplified in the following way:
According to this equation, the amount extracted by the coating is directly proportional to the concentration of the sample and completely independent of the volume of the sample. This conclusion is of great importance since it demonstrates the ability of the SPME to achieve reliable quantitative results [45].
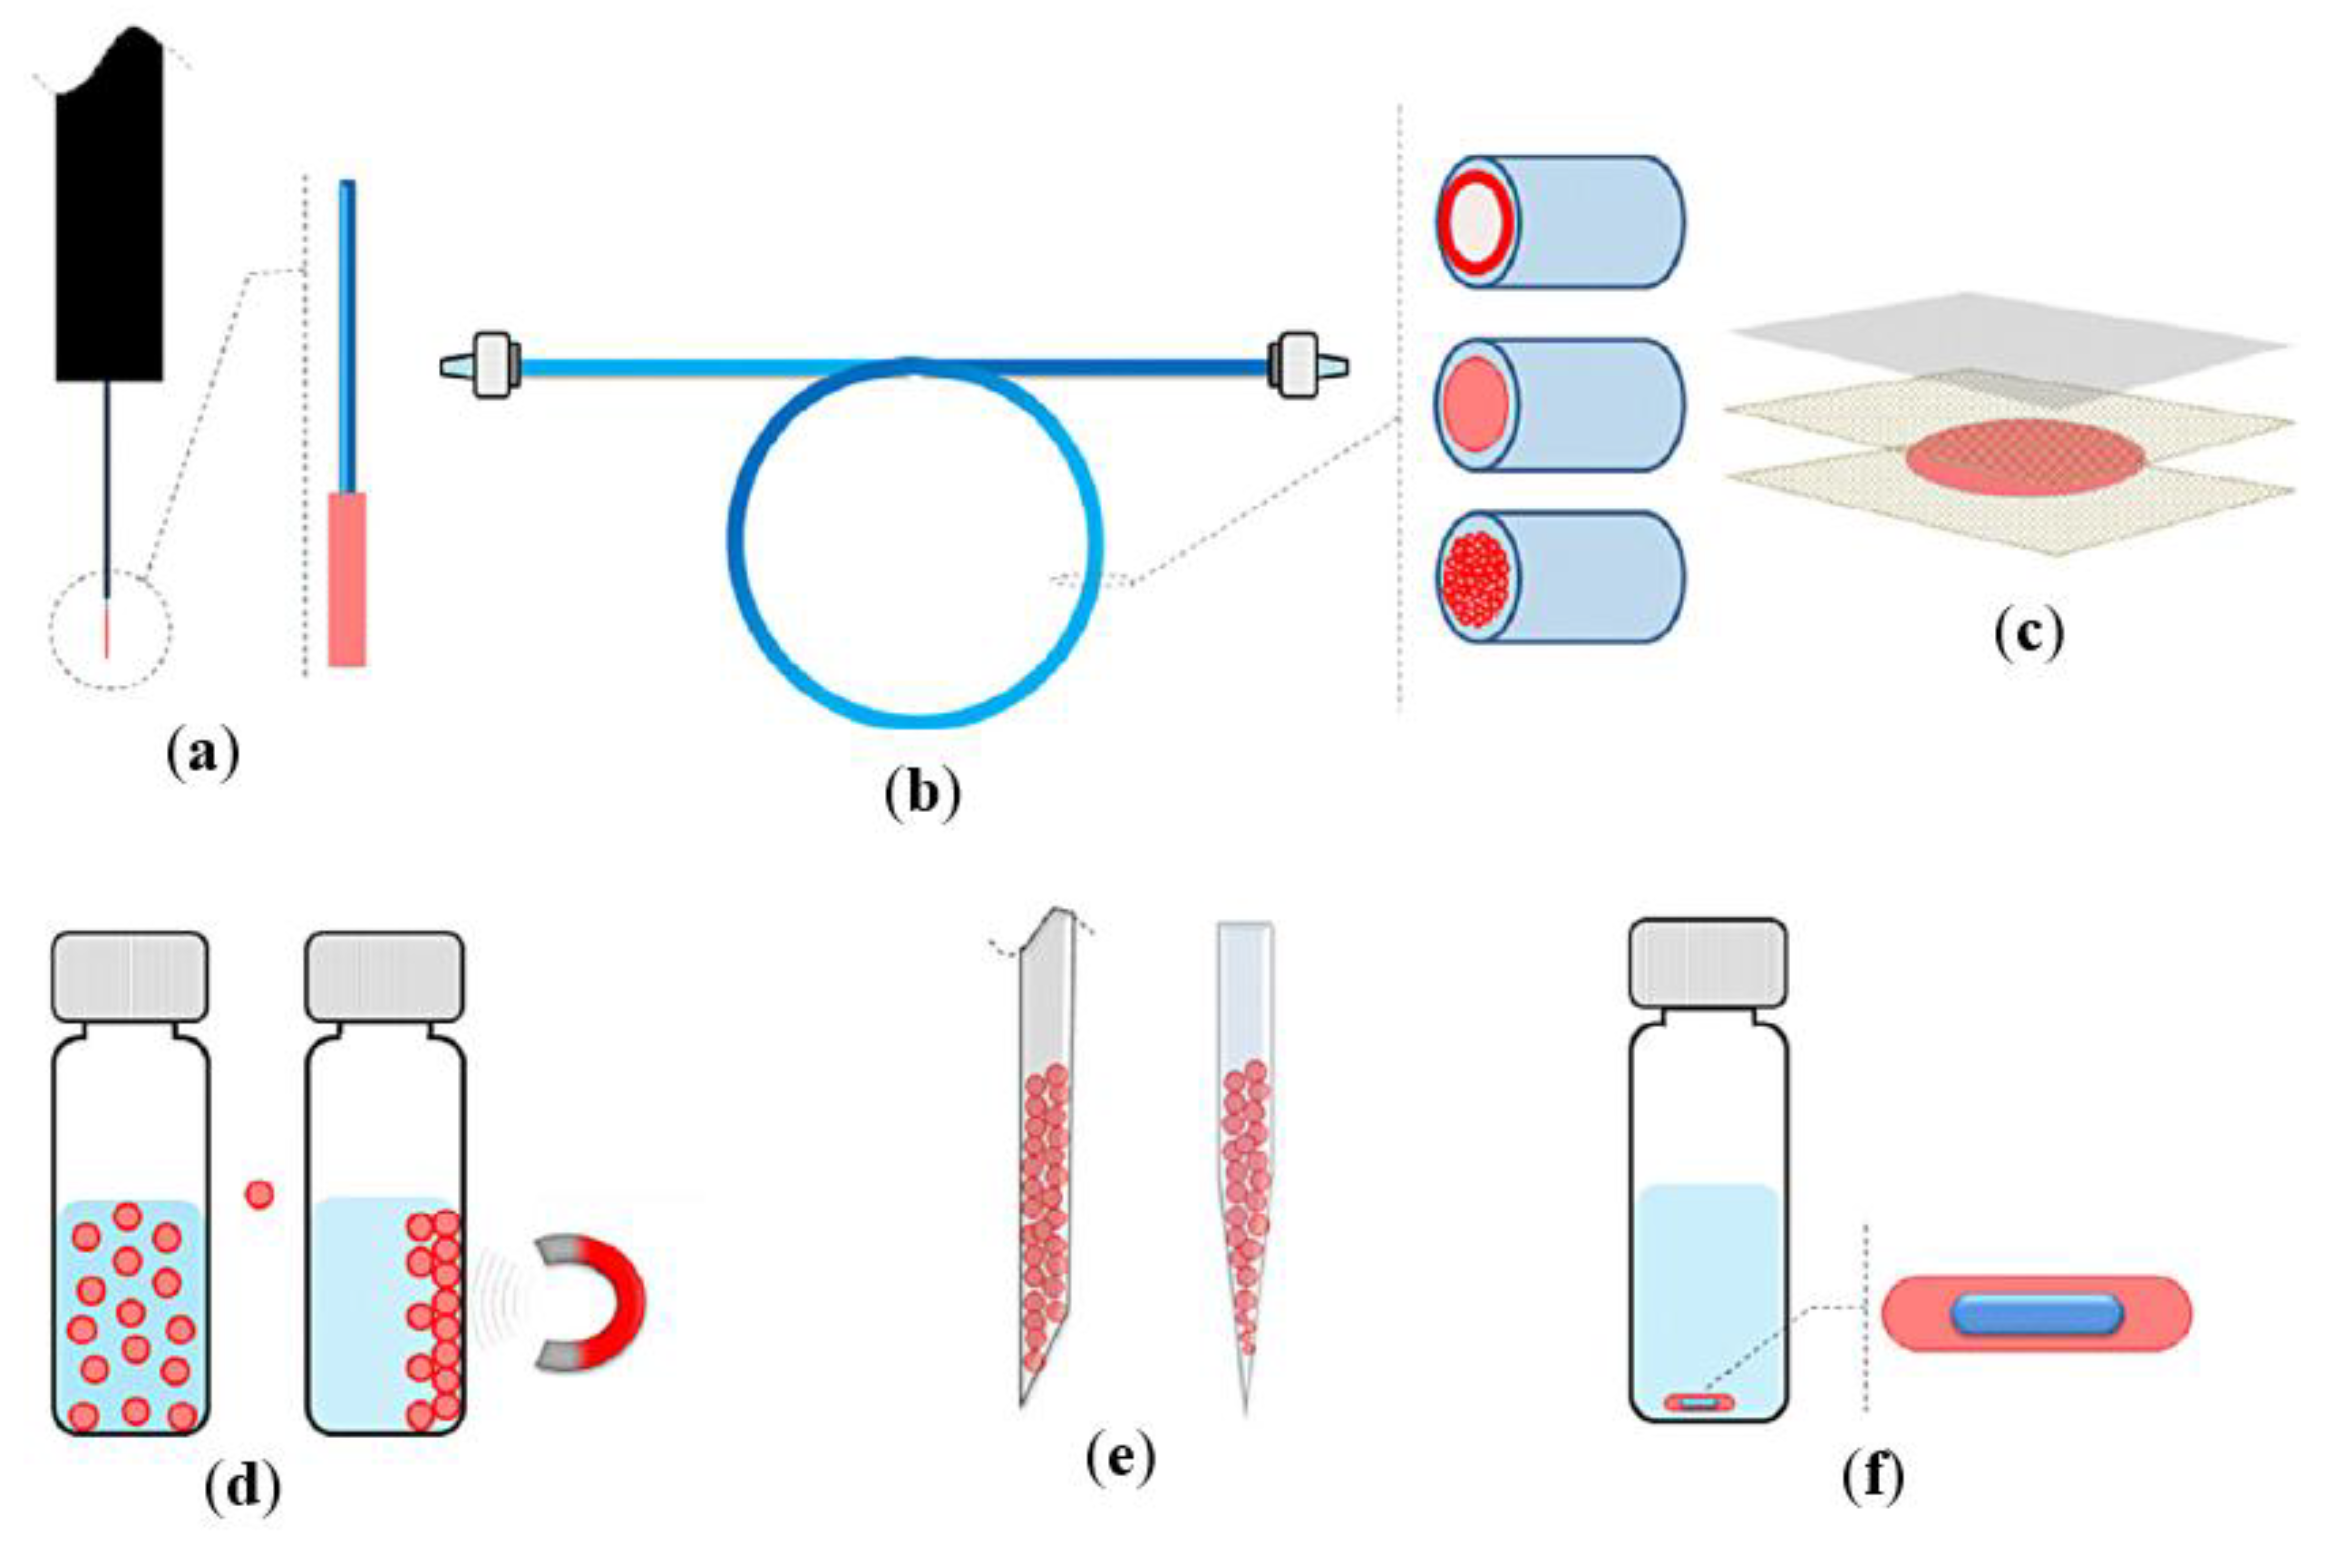
SPME is available in different configurations, represented in Figure 2. The best-known configuration is that consisting of a covered extraction phase on a fused silica bar. In applications where the SPME fiber is coupled to GC, complete automation is achieved due to the commercialization of automatic injectors dedicated to SPME and its similarity to the injection syringe used in GC [45]. Simple SPME configurations allow applications to increase in number, which in turn, motivated procuring improved and novel sorbent materials, to increase SPME applications in various sample matrices and analytes.
3.1. SPME Extraction Materials
The sorbent materials used in the SPME devices are the key to have a highly efficient extraction. Bojko et al. [46] presented a variety of extraction phases that can make SPME appropriate for different applications. Therefore, to obtain a better performance employing SPME, the extraction phases should be selective, low cost, chemically and thermally stable and mechanically robust. These sorbents are usually divided into liquid polymers and solid sorbents; the former absorbs and the latter adsorbs the target compounds. The most common coating materials utilized in SPME are polydimethylsiloxane (PDMS), divinylbenzene (DVB) and carboxen (CAR). They present different thicknesses and combinations of absorbent materials are being marketed [47]. However, commercial SPME devices are not easily accessible, some are very expensive and not as selective when the matrix effects are significant. As a consequence, home-made devices have gained wide acceptance by presenting a wide range of relatively economic and more specific sorbents for each application [47], from carbon materials to versatile polymers. These materials can be immobilized onto fused-silica fibers, stainless steel wires or other supports, employing electrochemical processes [48], physical deposition [28], sol-gel technology [49], or even simply with thermally stable adhesives [50].
Of the new materials that are being worked on, stand outs are the ionic liquids functionalized with polymeric ionic liquids (IL/PIL), carbonaceous materials as graphene and carbon nanotubes (CNT), molecularly imprinted polymers (MIP), metallic and organic frames (MOF) [47].
3.2. Automated SPME
SPME can easily be coupled with gas chromatography. The thermal desorption of the analytes from the SPME fiber is carried out easily in the chromatograph injector, working at a suitable temperature. Therefore, optimization of desorption time is one of the first steps when developing a new SPME method. Desorption of the analytes can take from a few seconds to several minutes, depending on the class of compounds being analyzed. The thermal desorption in the GC injector demands that the compounds present certain thermal stability when using the SPME technique. In the case of thermally labile analytes, a derivatization stage can be done in situ, in the medium, in which extraction is carried out so that they can also be determined by SPME-GC [51].
3.3. SPME Applications
Several reports in the literature have successfully shown the use of SPME to generate efficient and satisfactory results to determine different classes of compounds in dietary matrices, highlighting food beverages. Since its development, applications with this technique have been increasing. Overview of applications of the SPME technique in both food and alcoholic beverages are presented in Table 2. Results have shown high sensitivity (low LODs), good selectivity, linearity, and chromatographic precision.
Li et al. [52] developed a procedure based on the combination of multi-walled carbon nanotubes (MWCNT)/silica reinforced hollow fiber solid-phase microextraction (HF-SPME) coupled to GC-MS to analyze phthalate acid esters (PAEs) in beverage samples. The method showed satisfactory recoveries (68–115%), results that were compared with those obtained using the solvent extraction, the official analysis method as per China’s national standard. Dibutyl phthalate (DBP) and bis (2-ethylhexyl) phthalate (DEHP) were not found in all samples analyzed, whereas diethyl phthalate (DEP) was detected but could not be quantified in a red wine samples, obtaining detection limits between 0.006–0.03 ng/mL and quantification limits between 0.02–0.1 ng/mL. The well-defined peaks corresponding to the target analytes demonstrated that MWCNTs/SiO2 HF-SPME was a proper extraction and cleaning procedure for the analysis of PAEs in real food samples.
Another highlighted work was reported by Liu and co-workers [55], who developed a method for the determination of four food dyes in beverage samples. In this work, it is reported for the first time the utilization of silica nanoparticles functionalized with diamino residues (dASNPs) as adsorbent in dispersive solid-phase microextraction (dSPME) were used as pseudo-stationary phase (PSPs) in capillary electrophoresis (CE) separation. The authors optimized all factors that influenced the process, obtaining a detection limit for the four dyes between 0.030 and 0.36 mg/L, which is low concerning those reported in similar works, and with recoveries between 82.7% and 114.6%.
Finally, da Silva et al. [53] evaluated two analytical methods, headspace solid-phase microextraction combined with GC-MS (HS-SPME-GC-MS) and HS extraction in combination with GC-electron capture detection (HS-GC-ECD) for the analysis of off-flavors in Pilsner beer. The ester compounds showed a better response by HS-SPME-GC-MS, unlike the vicinal ketones, which presented higher sensitivity when analyzed by HS-GC-ECD. Both methods showed precision and accuracy for the determination of esters and vicinal diketones, and exhibited enough sensitivity to be employed for quality control purposes.
4. In-Tube Solid-Phase Microextraction (In-Tube SPME)
In-tube SPME is a SPME technique introduced in 1997 by Eisert and Pawliszyn, to overcome the coupling troubles observed when standard SPME fibers were used together with HPLC. These included low fiber capacity, high fragility, instability to solvents and poor sensitivity. In its original format, in-tube SPME consisted in the employment of a piece of a capillary GC column (e.g., an open capillary column containing an inner stationary phase), or a packed LC microcolumn, used as an extraction device coupled on-line to an HPLC system [60]. In in-tube SPME, in contrast to SPME fibers, the analytes equilibrium process occurs at the inner wall of the extraction device while their desorption is done by a solvent [61]. Thus, when the sample flows through the capillary device, the analytes interact with the extraction phase and then are eluted by the mobile phase and transferred to the HPLC system. So extraction, concentration, separation, and detection are carried out in a single step [62]. This technique is frequently used in the analysis of thermolabile or non-volatile compounds in aqueous samples.
4.1. Extraction Modes and Operational Devices
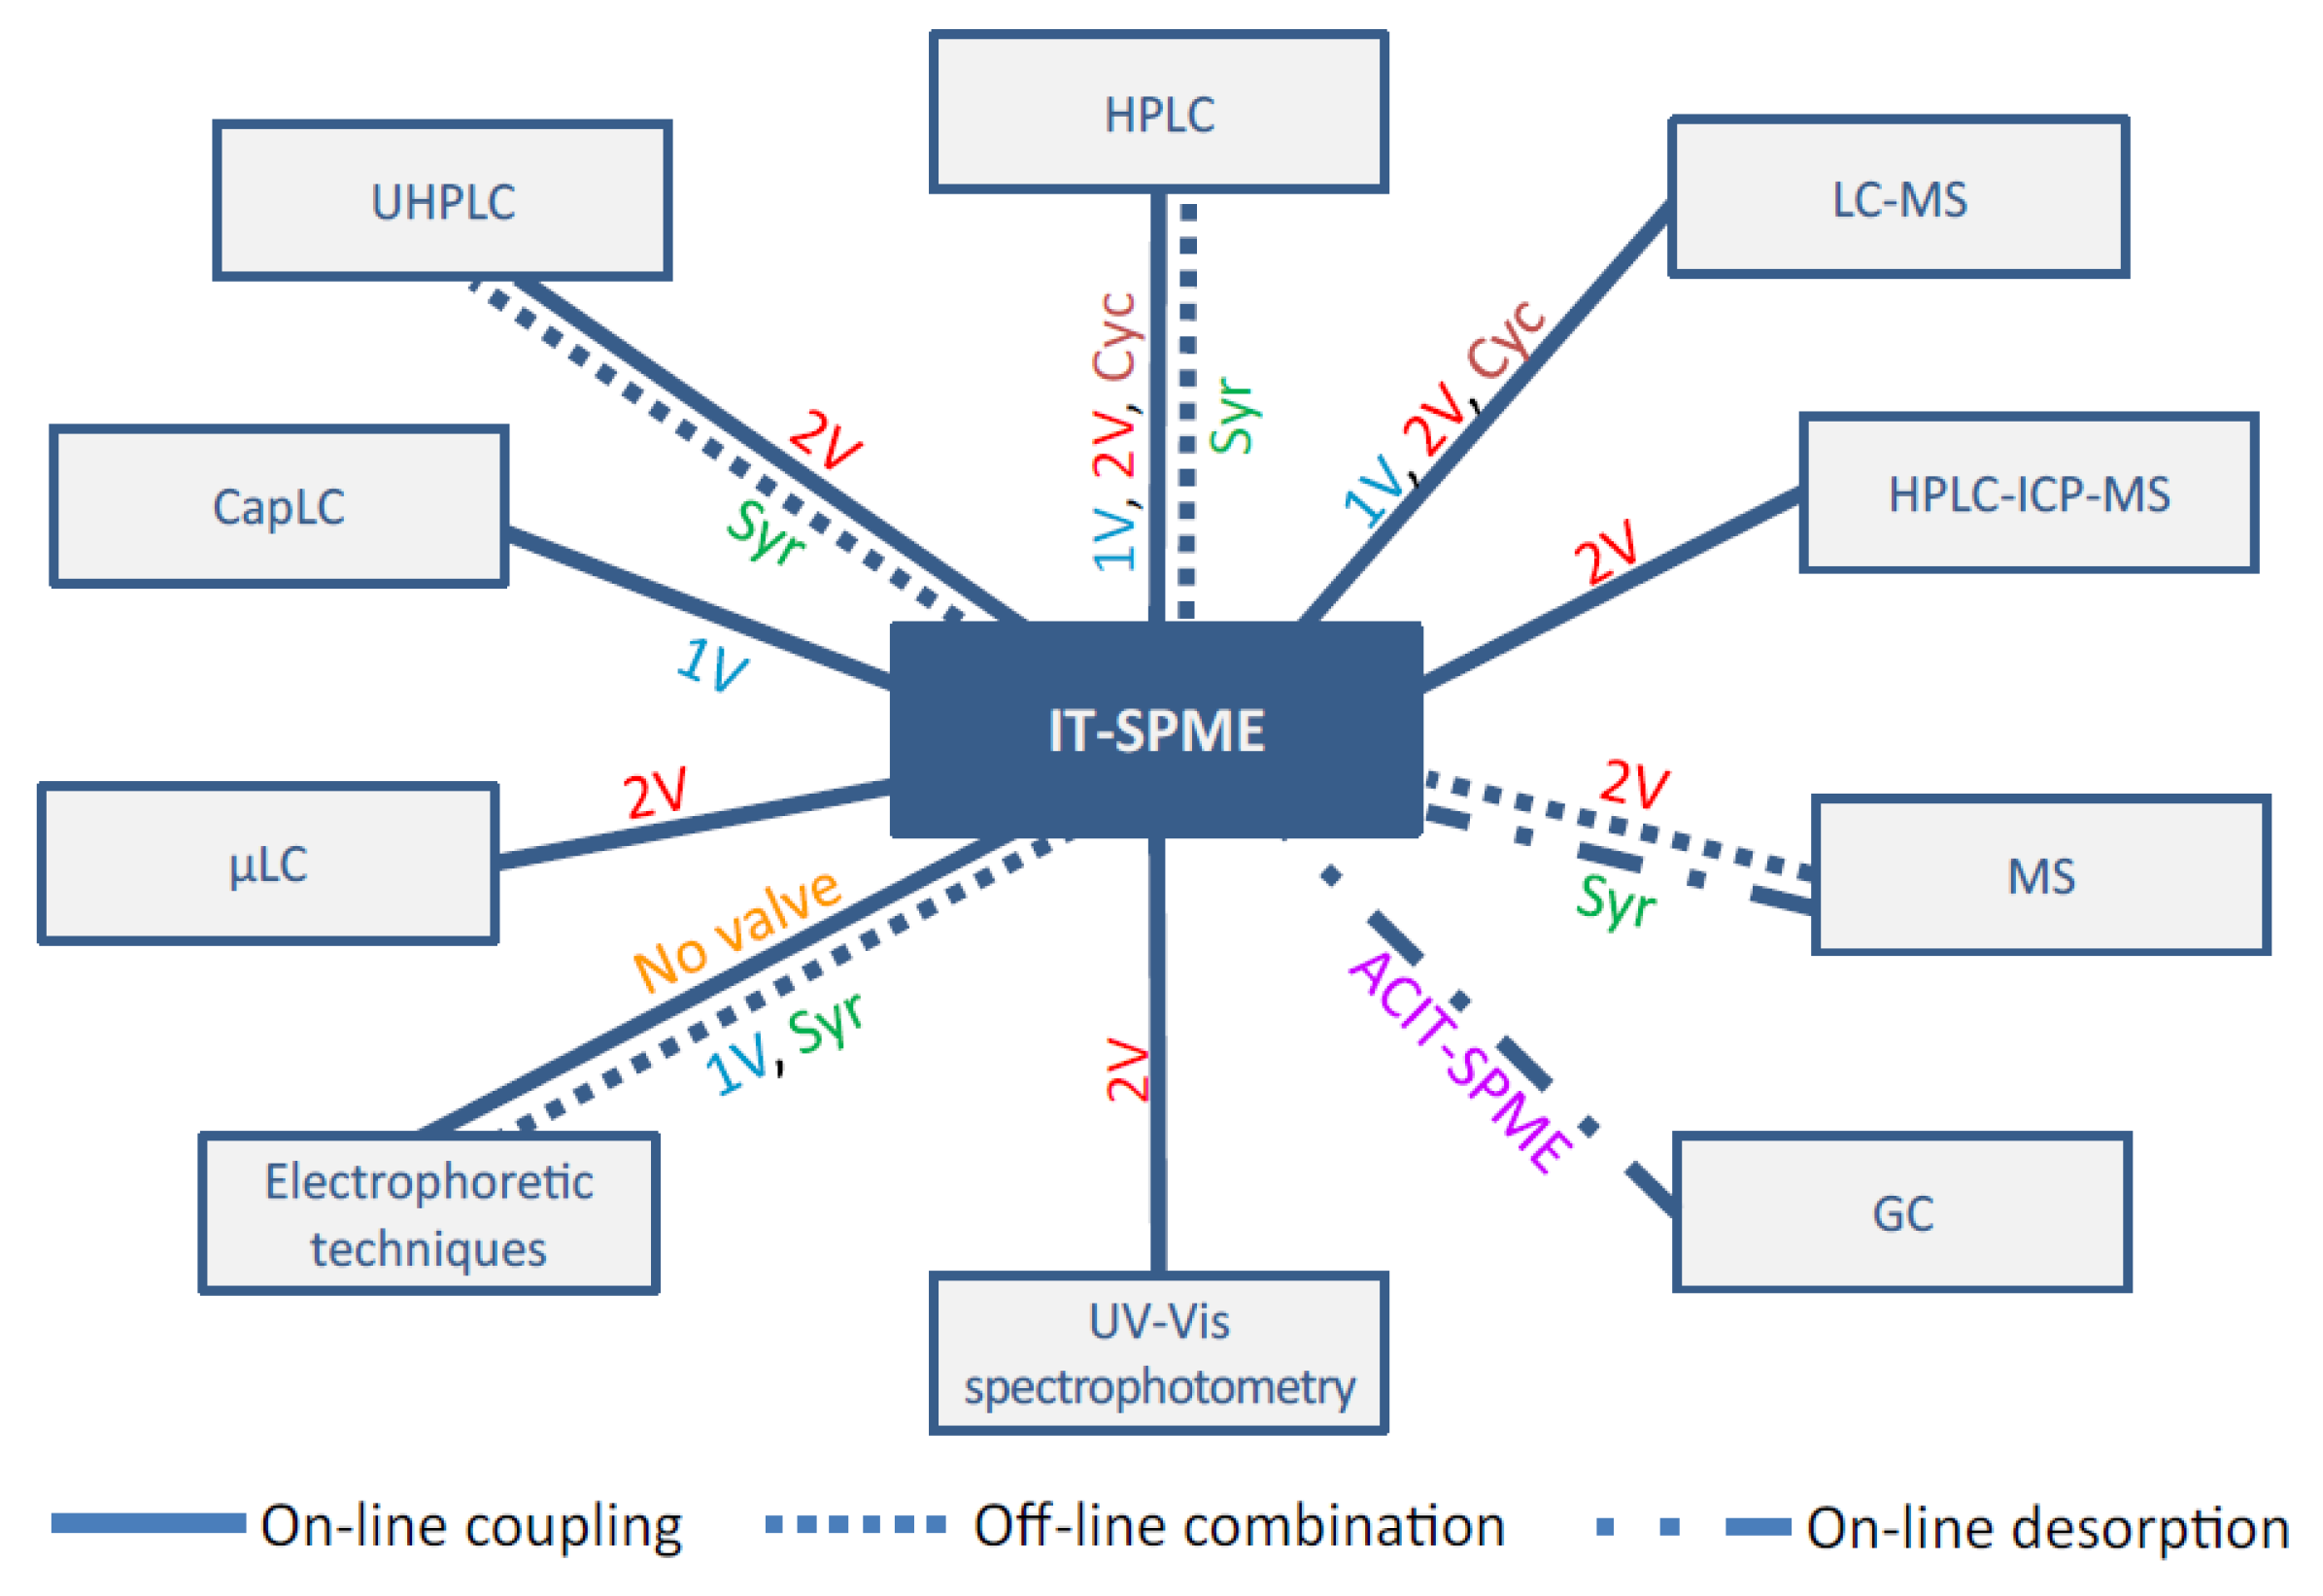
One of the most important advantages of in-tube SPME devices is the on-line coupling with LC systems, which leads to reduced analysis time, operating costs and sample manipulation, thus improving sensitivity, reproducibility, and precision of the analytical method [62]. Even though in-tube SPME was originally conceived for LC applications, it can also be on-line coupled directly to UV-vis [63], and direct analysis in real time (DART-MS) [64], or off-line with MALDI-TOF [65,66] detectors. Fernández-Amado et al. [67] recently provided a comprehensive overview of the strengths and weaknesses of in-tube SPME, showing the possible different couplings and configurations, and new developments made within this technique (Figure 3).
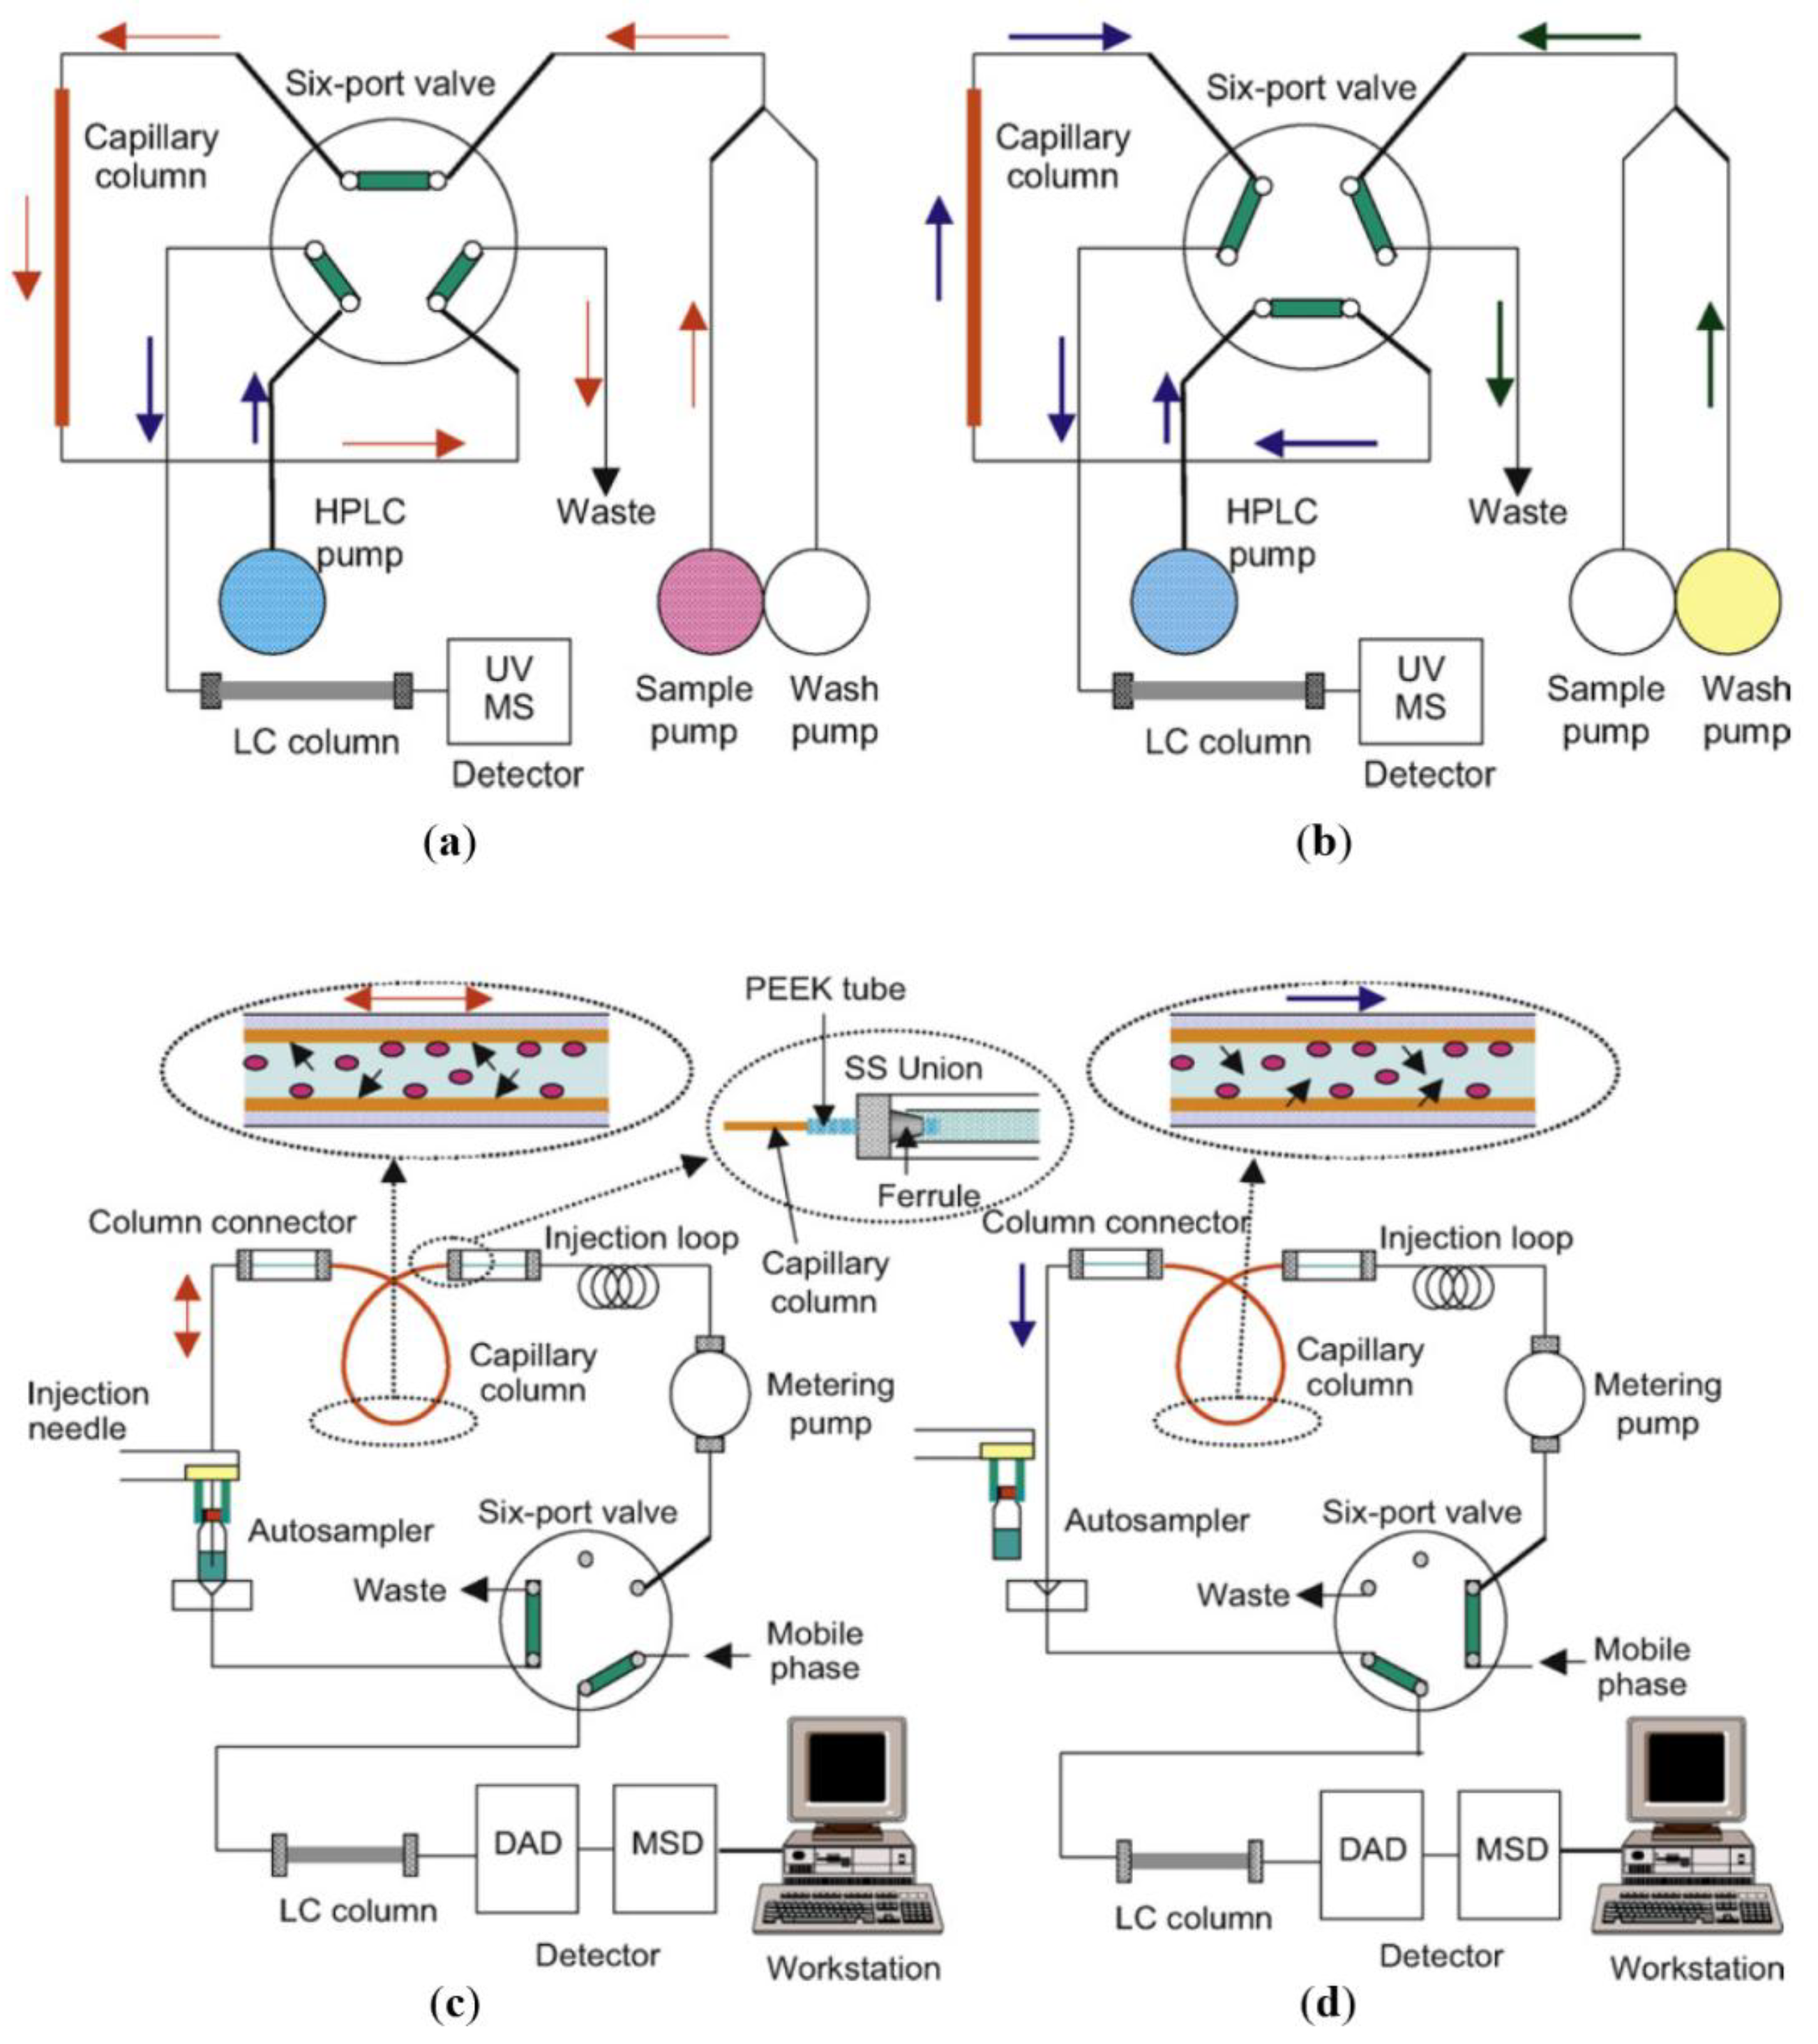
In-tube SPME can easily be automated and carried out in two extraction modes: Flow-through or draw/eject cycles (Figure 4). The flow-through approach, also known as in-valve mode, uses a capillary column as a loop of an injector valve. The system consists of an auxiliary pump, a capillary extraction column installed in a six-port valve and an HPLC system. The sample introduction could be manual or automated using another auxiliary pump. In the load position (Figure 4a), the aqueous sample passes continuously through the capillary in one direction, occurring the extraction process. Then, the six-port valve is switched to the inject position (Figure 4b) for the desorption process to transfer the analytes from the extraction column to the analytical column to be separated and detected by HPLC [5].
In the draw/eject configuration, the capillary column is placed between the injection loop and the autosampler syringe. The sample contained in a vial is aspirated and dispensed several times into the SPME device by automated cycles (Figure 4c), where the analytes suffer a partition equilibrium between the matrix and the stationary phase. Afterwards, by changing the six-port valve position, the analytes retained in the capillary are desorbed (Figure 4d). The desorption process can be static or dynamic; the former uses a solvent that passes through the capillary and desorbs the analytes and sent it to the injection loop valve. Dynamic desorption uses the same LC mobile phase to elute the analytes from the capillary to the analytical column [5].
4.2. Capillary Devices
Open tubular (OT) columns are an important type of column widely employed in GC for many years. These columns have a thin layer of stationary phase on the inner wall of the capillary and parts of them can be used as extractive devices for in-tube SPME. OT columns are classified into two types: Wall-coated open-tubular (WCOT) and porous-layer open-tubular (PLOT). In the first case, a non-porous film is coated into the inner wall of fused silica tubing, while in the second case a porous material is utilized as the coating phase. In the analysis of beverages, WCOT-type coatings like 100% polydimethylsiloxane, 5% phenyl polydimethylsiloxane, 14% cyanopropyl phenyl methyl silicone and polyethyleneglycol are usually employed, while PLOT-type coatings like divinyl-benzene, Carboxen molecular sieves, and CP-PoraPLOT amine have also been used [68,69,70]. Some of these capillary columns showed efficiency in the extraction of PHAs and patulin, which depends strongly on the stationary phase coating, analyte chemical structure, and matrix complexity [68,69,70].
In order to improve the extraction selectivity and efficiency, novel OT coating materials have been developed. Polypyrrol (PPY) is an electrochemically generated coating that offers ionic, π-π and hydrogen bonding interactions, and its selectivity can be modified by manipulation of the film thickness, which makes it a wide range useful material. PPY has been successfully used in the analysis of catechins and caffeine in tea, wine, and grape juice samples [44]. Another OT microcolumn coating group involves graphene-based materials. Tan et al. [71] covalently bonded a coating containing graphene oxide (GO) monolayers to a fused silica capillary, exhibiting great absorption capacity, stability and high recovery rates between 80–120% for the extraction of triazines in water samples.
Another alternative to preparing in-tube SPME columns involves the use of filled microcolumns containing a sorbent material in either a particle bed or a monolithic format. Microcolumn drivers may be capillary tubes of fused silica, stainless steel, poly (ether ether ketone) (PEEK) [72] and other hybrid materials like silica-steel tube [63]. The main characteristic of each material varies in its flexibility, mechanical strength, and high pressure and solvent resistance [72]. The sorbent material comprises solid particles with regular or irregular shape, commonly used as SPE or HPLC columns, offering a wide range of commercially available stationary phases and dimensions [72]. Andrade et al. [73] packed C18 spherical particles (dp = 10 µm; 100 Å pore size) in a PEEK tube (50 mm length; 0.508 i.d) showing adequate results for the analysis of ochratoxin A in wine samples.
Regarding the monolithic columns, organic polymeric or silica polymeric-based are the most common. These columns can be obtained in situ by a free-radical polymerization method by either thermal or photo-initiation approaches, allowing getting several porous structures and morphologies by modifying the energy supplied and the polymerization time. Several monolithic capillaries based on methacrylates, such as poly (methacrylic acid-ethylene glycol dimethacrylate) (MAA-co-EGDMA) and poly (octadecyl methacrylate-co- ethylendimethylacrylate) (OMA-co-EDMA) have been studied [74,75]. Furthermore, other modifications in the monolith use carbon nanotubes [64], metallic compounds [65], inorganic oxides [66] and ionic liquids [76].
4.3. In-Tube SPME Applications
In-tube SPME has been successfully applied to the determination of various analytes in food and beverage samples. Regarding beverages analysis, the liquid samples are usually filtered, and in some cases when necessary diluted before passing through the in-tube device resulting in a simplified sample preparation procedure. Table 3 summarizes some representative applications of in-tube SPME in beverages, which includes juices, coffee, sodas, teas, milk, and bottled water. The main goal in these applications has been the determination of residual contaminants as pesticides and other pollutants or compounds related to food security as food additives and mycotoxins.
In a pioneer work Wang et al. [64] employed on-line in-tube SPME-DART-MS to the analysis of triazines in orange juice. Briefly, they employed as extraction device a syringe barrel with a pinhead coupled to a capillary extraction column filled with a carbon nanotube incorporated monolith. The sample preparation step, which involves activation, sampling, washing, and on-line desorption, was made using a syringe infusion pump, being the analytes desorbed from the column directly ionized by DART and analyzed by mass spectrometry. This method allowed the rapid analysis of these herbicides without using a chromatographic separation. Thus, when compared to an LC-MS method, it showed a reduction of the total time analysis from 16 to 3 min by employing the on-line in-tube SPME DART-MS set up. Additionally, the in-tube SPME-DART-MS method was evaluated using both off-line and on-line modes obtaining enrichment factors between 21–49 and 411–832 respectively, indicating a significant sensitivity gain when the on-line mode is used.
Although the analysis of trans-fatty acids (TFAs) is usually made by GC, recently, Wu et al. [75] employed in-tube SPME using a hydrophobic monolithic microcolumn coupled to HPLC-UV for the determination of TFAs as their fatty acid methyl esters (FAMEs), in instant coffee samples. This method allowed the selective separation between cis- and trans-isomers in a short period (18 min), under a simple operation and reaching very low LODs (3.0–7.0 µg/kg), below the official method of analysis by GC- flame ionization detection (FID). Therefore, this high sensitivity method is a new and potential alternative for the analysis of TFAs in complex samples.
5. Turbulent-Flow Chromatography (TFC)
Turbulent-flow chromatography (TFC) is a technique commonly used for the separation of a wide variety of molecules in biological matrices. TFC uses the properties of dynamic fluids in a turbulent flow to separate the molecules based on their weight, like proteins from low molecules, without prior sample preparation. Conventional liquid chromatography usually employs flow rates lower than 1.5 mL/min exhibiting a laminar flow behavior (parabolic velocity profile). As the flow rate increases (>1.5 mL/min), the profile flow becomes turbulent (plug-like profile) and more dependent on velocity [6]. Due to the necessary use of high flow rates (up to 1.5–5 mL/min) the separation column has to be packed with large particles (around 50–100 µm of diameter) to avoid high back pressures and at the same time get turbulent conditions [77,78].
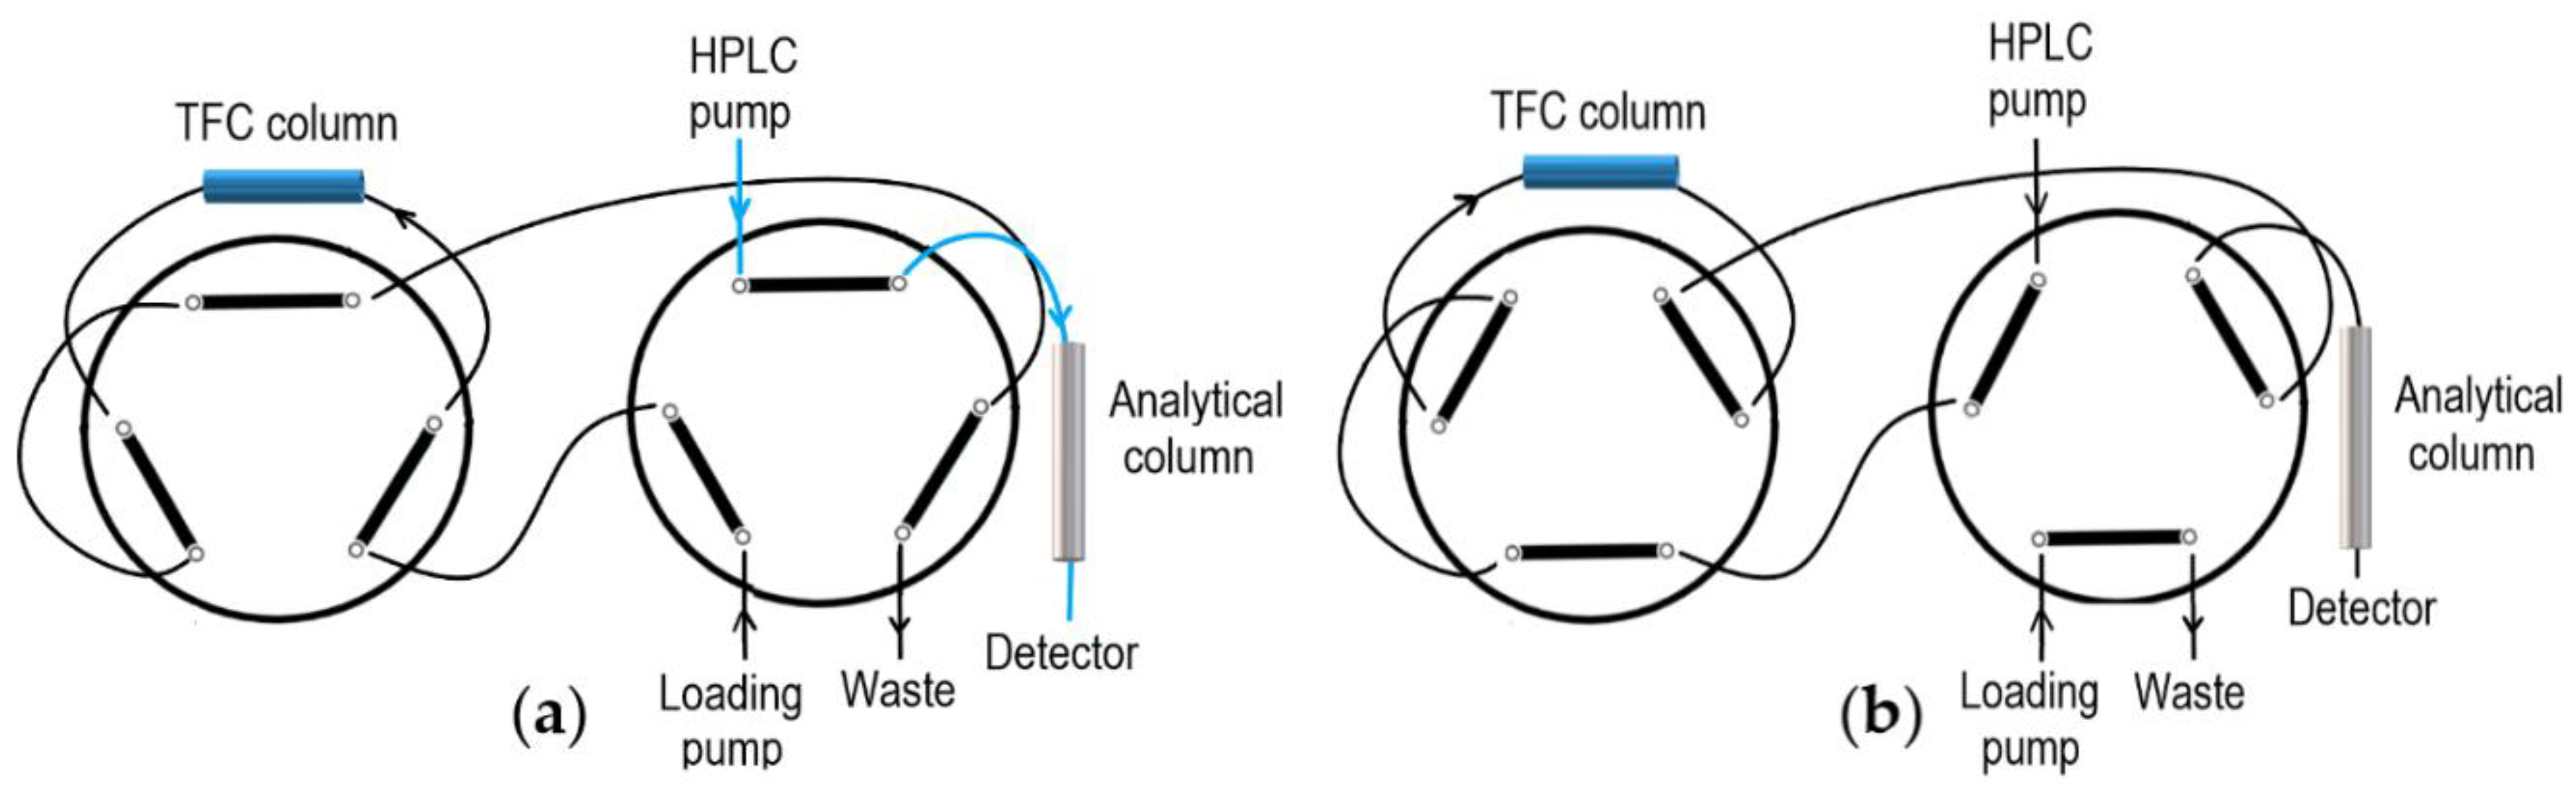
This technique uses different configurations, but due to high sample complexity, the most common one uses a column switching system on-line with a LC system coupled to either MS or tandem MS [79]. The standard configuration requires two six-port valves, a loop, an auxiliary pump and an LC-MS system (Figure 5). Extraction and analysis are carried out in three steps: Loading, elution, and conditioning. Briefly, in the valve extraction position, the sample is loaded from the injector to a TFC column under turbulent conditions. Under these conditions the small molecules (<2000 Da) diffuse more quickly between the porous particles, allowing chemical interaction with the stationary phase and separated by size exclusion from large molecules (e.g., proteins), which are discarded to the waste while the small molecules are retained in the extraction column. Then, the valve switches to elution position and the molecules retained are transferred from TFC column to an analytical column by the mobile phase, to be subsequently separated and detected. Once transferred, the valve switches and the TFC column is washed and conditioned for the next run [79].
TFC Applications
TFC has been successfully applied to the determination of a wide range of food and beverage samples. Food samples are usually very complex matrices composed of lipids, proteins, carbohydrates, pigments, and other compounds. These compounds are present in a significant quantity and can interfere in the analysis of target analytes [80]. For these samples, clean-up and concentration steps are indispensable; thus, TFC is a suitable on-line sample preparation technique to separate analytes with low weight from high weigh interferences, without any prior handling steps.
The analysis of beverages by TFC is advantageous once the liquid sample preparation can be kept to a minimum [81]. Presta et al. [80] analyzed flavonoids and resveratrol from white, rosé and red wine samples; the samples were diluted and then injected in a C18 TFC column (50 × 1 mm, 50 µm/60 Å particles) at a 4 mL/min flow rate, coupled with an LC-APCI-MS. The method showed good linearity, and LOD values between 0.005–0.025 mg/L. This method proved to be fast, simple and robust, taking just 2.5 min for the extraction step.
So far, milk is one of the matrices most frequently analyzed by TFC, although this technique has also been employed for the determination of multiclass veterinary drugs (VDs) [82,83,84] mycotoxins [85] and UV-filters [86] Milk is a complex sample rich in lipids and proteins, therefore the extraction and sample clean up remain a challenge when other sample preparation techniques are employed. TFC offers a perceived advantage of enabling the direct injection of milk samples into a TFC column after a simple protein precipitation step. This eliminates the time-consuming sample preparation procedure, as well as the potential analytes loses, resulting in a high throughput method suitable for multi-residue analysis.
Regarding the analysis of VDs in milk by TFC, it is observed there was a fast development and application of this technique since the first publication by Stolker et al. [82] in 2010, reporting the determination of eight multi-class antibiotics. Then, in 2012, Bosouva et al. [84] reported the identification and quantification of 36 VDs in 19 min and, more recently, in 2016, Zhu et al. [83] reported the simultaneous analysis of 88 VDs in 36 min. Although the VDs analyzed come from different classes, solubility, and polarity, the use of TFC coupled to MS/MS detector has demonstrated its high efficiency, practicality, and convenience in the determination of multi residual compounds in milk, and the possibility to be used for regulatory purposes.
6. On-Line Fully Automated Extraction-Chromatography-Mass Spectrometry
Sample preparation is a determinant stage for the analysis success. This is mainly due to the fact that target analytes are usually present at low concentrations in complex matrices, which turns unable to analyze them directly in the analytical instrument, making necessary, and in many cases mandatory, a sample preparation step. Current trends in sample preparation and analysis are towards the development of a fully automated and more universal system involving extraction, chromatographic separation, detection and quantification (Figure 6), which allows the analysis to be done in a single stage [87]. This useful coupling while reducing the sample handling and analysis time will improve the detection and selectivity and allows the analyses of a large number of samples.
From the analytical point of view, this system involves two steps. In the former, the sample preparation step, the analytes are extracted and cleaned-up from the matrix [87]. In this step are employed extraction techniques like SPE, turbulent flow, and miniaturized sample preparation approaches. Techniques as SPME and in-tube SPME are utilized, among others, which may be automated to allow on-line coupling with the second approach by a switching valve or interface, as we described in the previous numerals. In the second step, the analytes are transferred to the chromatographic system (LC or GC) to be separated and detected [87]. In the last decade, the coupling with tandem MS (MS/MS) has increased, offering an opportunity for an ideal detection and quantification system once this detector has the ability to confirm and discern the target analyte from related analytes based on the molecular mass and specific ion fragmentation.
Briefly, tandem MS involve two sequential mass spectrometry analyzers. The first detects a target ion mass and separate it from the others ions produced in the ion source. Then, the isolated ion is fragmented in a collision cell and the second MS analyzer detects the ion fragments. Thus, the unique relationship between the precursor ion and its fragmented ions, attribute an unequivocal identification of the analyte [88].
This merger between a separation system and tandem MS analyzers is quite advantageous to both systems. Between the several advantages of this coupling are: (1) Specific relation between retention time and mass spectra as a confirmation parameter; (2) identification of co-eluting compounds due to the selectivity of the MS; (3) improvement on sensitivity and detectability, due to the analytes enter to the detector in a form of a single band reducing the interferences; (4) allows the analysis of complex matrices or samples in low quantity without requiring a laborious sample preparation, avoiding sample loss and saves time [88].
Nowadays, on-line fully automated extraction-chromatography-tandem mass spectrometry is booming and has been widely applied in the analysis of different compounds in environmental, biological and food matrices. In beverages, this approach has also been applied for the trace analysis principally of contaminants and residues, among which stand out the multi-residue methodologies. Table 4 summarizes some applications of this approach in beverages analysis and shows the different configurations used between the extraction stage and the analysis technique.
Li et al. [93] analyzed 128 multiclass pesticide residues (organophosphorus, organochlorines, carbamates, pyrethroids, triazines, amides, dinitroanilines, nitrogen heterocycles among others) present in tea samples using an HS-SPME coupled on-line to GC-Tandem mass. A PDMS/DVB fiber exhibited the best recoveries and broad extraction of the pesticides selected. The method showed good linearity and recoveries between 70 and 120% and got quantification limits below the maximum residue limits (MRLs) prescribed by EU. This methodology demonstrated to be easily operated without solvent use, reliable and efficient in the multi-residue analysis of pesticides.
Barnaba et al. [96] analyzed 56 phenolic natural compounds presented in wine, spirits and vinegar samples using an on-line SPE-HPLC-Q-Orbitrap system. The coupling of SPE as sample preparation step and the high resolution of Orbitrap-MS analyzer allowed the detection and quantification of phenolic compounds in all matrices with a good LOQs, accuracy and precision. Two approaches were compared to evaluate the matrix effect; with SPE clean-up and direct injection, almost all compounds showed an improved response when the SPE cartridge were used because it reduces the interferents that reach the detector.
In a truboflow™-ESI-LC-MS/MS system, Zhu et al. [83] determined 88 veterinary drug residues in milk samples. This methodology demonstrated to be fast (39 min in total) and required a prior sample preparation step to precipitate the proteins by addition of a solvent followed by centrifugation. Then the supernatant was directly injected in the analytical equipment. In comparison to traditional procedures, it was demonstrated to be simple, quick and very sensitive for the analysis VDs, allowing the analysis of routine of milk samples.
Another interesting approach is the use of emerged materials in the extraction devices, showing some superior characteristics when compared to conventional materials. Silva et al. [91] used an on-line system composed of an SPE-LC-ESI-TOF-MS system, two switching valves and an auxiliary pump to load the sample. In this work, designed for analyzing sulfonamide antibiotics in bovine milk, the authors employed an ionic liquid supported on silica synthesized via a sol-gel approach. This material showed a high permeability as its main advantage, which made it adequate for on-line coupling at low backpressures. This fully automated method showed low detection limits (1.5–2.25 ng/mL) and reproducibility.
De Toffoli et al. [89] employed a packed column with graphene oxide supported on silica, for the analysis of triazines in bottled, mineral and groundwater using an in-tube SPME-UHPLC-MS/MS on-line system. This material exhibited high extraction capacity, good mechanical and thermal strength, and high-pressure resistance. The method was adequate, getting good sensitivity, linearity and with very low detection limits (1.1–2.9 ng/L). In spite of the samples analyzed not being contaminated with triazines, the method showed it could adequately work with these matrices.
7. Conclusions
Many different contaminants may be present in beverages because of the stages involved in the production chain, agricultural process, or due to environmental conditions. For the analysis of these contaminants in beverages matrices, a sample preparation technique is usually a mandatory step prior to instrumental analysis, which permits analysts to isolate the target analytes from the matrix and concentrate them in order to get better results. The choice of an adequate sample preparation method principally depends on the analytes type, the quantity in which they are present, the matrix complexity and the analytical instruments available. Miniaturized sample preparation techniques usually offer several advantages over the classical techniques including less time and solvent consumption, decreasing handling errors, and are easier to be automated and on-line coupled.
Sample preparation techniques coupled on-line with analytical techniques provide faster analysis and the possibility to analyze limited or small size samples. In addition, permits analysts to obtain lower detection and quantification limits, reduces the number of sample stages and is more environmentally friendly. In recent years, the number of new on-line approaches has notably increased, showing a better performance when compared to conventional analysis methods. Furthermore, on-line fully automated extraction-chromatography-tandem mass spectrometry is becoming a trend for high-throughput when it comes to multi-residue analysis and new emerging contaminants, that make it ideal for the analysis of complex samples in a single run. This approach has been demonstrated to be efficient, safe, quick, allowing the making of serial analyses from extraction to identification, reducing notably the analysis time, avoiding sample contamination and getting more reliable results. In addition, in the coming years we expect that fully automated extraction-chromatography-tandem MS systems will be extensively used in a wide range of applications. Newly developed methods validated using this approach, will be implemented and applied for regulatory purposes in the beverages arena. However, there are still some challenges as the development of new sorbent materials that improve the selectivity and the extraction capacity, is still under intense research. Additionally, the use of fully automated on-line systems is not yet widespread due to the lack of commercially available proper extraction devices, and the still elevated cost of MS detectors. Besides, more knowledge and a broader acceptance of these on-line methods is still forthcoming.
Funding
This study was financed in part by the Coordenação de Aperfeiçoamento de Pessoal de Nível Superior—Brasil (CAPES)—Finance Code 001. The authors are grateful to FAPESP (Grants 2017/02147-0, 2015/15462-5, and 2014/07347-9) and to CNPq (307293/2014-9) for the financial support provided for this research and to our laboratory.
Conflicts of Interest
The authors declare no conflict of interest.
References
- Sádecká, J.; Polonský, J. Electrophoretic methods in the analysis of beverages. J. Chromatogr. A 2000, 880, 243–279. [Google Scholar] [CrossRef]
- Płotka-Wasylka, J.; Szczepańska, N.; de la Guardia, M.; Namieśnik, J. Miniaturized solid-phase extraction techniques. TrAC Trends Anal. Chem. 2015, 73, 19–38. [Google Scholar] [CrossRef]
- Płotka-Wasylka, J.; Szczepańska, N.; de la Guardia, M.; Namieśnik, J. Modern trends in solid phase extraction: New sorbent media. TrAC Trends Anal. Chem. 2016, 77, 23–43. [Google Scholar] [CrossRef]
- Souza-Silva, É.A.; Gionfriddo, E.; Pawliszyn, J. A critical review of the state of the art of solid-phase microextraction of complex matrices II. Food analysis. TrAC Trends Anal. Chem. 2015, 71, 236–248. [Google Scholar] [CrossRef]
- Kataoka, H.; Ishizaki, A.; Nonaka, Y.; Saito, K. Developments and applications of capillary microextraction techniques: A review. Anal. Chim. Acta 2009, 655, 8–29. [Google Scholar] [CrossRef] [PubMed]
- Edge, T. Turbulent flow chromatography in bioanalysis. In Handbook of Analytical Separations; Wilson, I.D., Ed.; Elsevier Science: Buckinghamshire, UK, 2003; Volume 4, pp. 91–128. ISBN 9780444506580. [Google Scholar]
- Puig, P.; Borrull, F.; Calull, M.; Aguilar, C. Recent advances in coupling solid-phase extraction and capillary electrophoresis (SPE-CE). TrAC Trends Anal. Chem. 2007, 26, 664–678. [Google Scholar] [CrossRef]
- Hyötyläinen, T. Principles, developments and applications of on-line coupling of extraction with chromatography. J. Chromatogr. A 2007, 1153, 14–28. [Google Scholar] [CrossRef]
- Fumes, B.H.; Andrade, M.A.; Franco, M.S.; Lanças, F.M. On-line approaches for the determination of residues and contaminants in complex samples. J. Sep. Sci. 2017, 40, 183–202. [Google Scholar] [CrossRef]
- Franco, M.S.; Padovan, R.N.; Fumes, B.H.; Lanças, F.M. An overview of multidimensional liquid phase separations in food analysis. Electrophoresis 2016, 37, 1768–1783. [Google Scholar] [CrossRef]
- Farré, M.; Barceló, D. Analysis of emerging contaminants in food. TrAC Trends Anal. Chem. 2013, 43, 240–253. [Google Scholar] [CrossRef]
- Andrade-Eiroa, A.; Canle, M.; Leroy-Cancellieri, V.; Cerdà, V. Solid-phase extraction of organic compounds: A critical review (Part I). TrAC Trends Anal. Chem. 2016, 80, 641–654. [Google Scholar] [CrossRef]
- Andrade-Eiroa, A.; Canle, M.; Leroy-Cancellieri, V.; Cerdà, V. Solid-phase extraction of organic compounds: A critical review. part ii. TrAC Trends Anal. Chem. 2016, 80, 655–667. [Google Scholar] [CrossRef]
- Buszewski, B.; Szultka, M. Past, Present, and Future of Solid Phase Extraction: A Review. Crit. Rev. Anal. Chem. 2012, 42, 198–213. [Google Scholar] [CrossRef]
- Biziuk, M. Solid phase extraction technique—Trends, opportunities and applications. Pol. J. Environ. Stud. 2015, 15, 677–690. [Google Scholar]
- Islas, G.; Ibarra, I.S.; Hernandez, P.; Miranda, J.M.; Cepeda, A. Dispersive Solid Phase Extraction for the Analysis of Veterinary Drugs Applied to Food Samples: A Review. Int. J. Anal. Chem. 2017, 2017. [Google Scholar] [CrossRef]
- Ochiai, N.; Sasamoto, K.; David, F.; Sandra, P. Recent Developments of Stir Bar Sorptive Extraction for Food Applications: Extension to Polar Solutes. J. Agric. Food Chem. 2018, 66, 7249–7255. [Google Scholar] [CrossRef]
- Moein, M.M.; Said, R.; Abdel-Rehim, M. Microextraction by packed sorbent. Bioanalysis 2015, 7, 2155–2161. [Google Scholar] [CrossRef]
- Ariffin, M.M.; Miller, E.I.; Cormack, P.A.G.; Anderson, R.A. Molecularly Imprinted Solid-Phase Extraction of Diazepam and Its Metabolites from Hair Samples. Anal. Chem. 2007, 79, 256–262. [Google Scholar] [CrossRef]
- Háková, M.; Havlíková, L.C.; Chvojka, J.; Erben, J.; Solich, P.; Švec, F.; Šatínský, D. A comparison study of nanofiber, microfiber, and new composite nano/microfiber polymers used as sorbents for on-line solid phase extraction in chromatography system. Anal. Chim. Acta 2018, 1023, 44–52. [Google Scholar] [CrossRef]
- Háková, M.; Havlíková, L.C.; Chvojka, J.; Švec, F.; Solich, P.; Šatínský, D. Nanofiber polymers as novel sorbents for on-line solid phase extraction in chromatographic system: A comparison with monolithic reversed phase C18 sorbent. Anal. Chim. Acta 2018, 1018, 26–34. [Google Scholar] [CrossRef]
- Herrero-Latorre, C.; Barciela-García, J.; García-Martín, S.; Peña-Crecente, R.M.; Otárola-Jiménez, J. Magnetic solid-phase extraction using carbon nanotubes as sorbents: A review. Anal. Chim. Acta 2015, 892, 10–26. [Google Scholar] [CrossRef] [PubMed]
- Gritti, F.; Kazakevich, Y.V.; Guiochon, G. Effect of the surface coverage of endcapped C18-silica on the excess adsorption isotherms of commonly used organic solvents from water in reversed phase liquid chromatography. J. Chromatogr. A 2007, 1169, 111–124. [Google Scholar] [CrossRef] [PubMed]
- Azzouz, A.; Ballesteros, E. Combined microwave-assisted extraction and continuous solid-phase extraction prior to gas chromatography–mass spectrometry determination of pharmaceuticals, personal care products and hormones in soils, sediments and sludge. Sci. Total Environ. 2012, 419, 208–215. [Google Scholar] [CrossRef] [PubMed]
- Sasithorn, N.; Martinová, L. Fabrication of Silk Nanofibres with Needle and Roller Electrospinning Methods. J. Nanomater. 2014, 2014. [Google Scholar] [CrossRef]
- Reyes-Gallardo, E.M.; Lucena, R.; Cárdenas, S. Electrospun nanofibers as sorptive phases in microextraction. TrAC Trends Anal. Chem. 2016, 84, 3–11. [Google Scholar] [CrossRef]
- Ifegwu, O.C.; Anyakora, C.; Chigome, S.; Torto, N. Application of nanofiber-packed SPE for determination of urinary 1-hydroxypyrene level using HPLC. Anal. Chem. Insights 2014, 9, 17–25. [Google Scholar] [CrossRef] [PubMed]
- Bagheri, H.; Ayazi, Z. Polypyrrole nanowires network for convenient and highly efficient microextraction in packed syringe. Anal. Methods 2011, 3, 2630–2636. [Google Scholar] [CrossRef]
- Bagheri, H.; Piri-Moghadam, H.; Rastegar, S. Magnetic and electric field assisted electrospun polyamide nanofibers for on-line μ-solid phase extraction and HPLC. RSC Adv. 2014, 4, 52590–52597. [Google Scholar] [CrossRef]
- Cerdà, V.; Ferrer, L.; Avivar, J.; Cerdà, A. Flow Analysis: A Practical Guide; Elsevier Science: Boston, MA, USA, 2014; ISBN 0444626069. [Google Scholar]
- Streel, B.; Hubert, P.; Ceccato, A. Determination of fenofibric acid in human plasma using automated solid-phase extraction coupled to liquid chromatography. J. Chromatogr. B Biomed. Sci. Appl. 2000, 742, 391–400. [Google Scholar] [CrossRef]
- Batchu, S.; Quinete, N.; Panditi, V.R.; Gardinali, P.R. Online solid phase extraction liquid chromatography tandem mass spectrometry (SPE-LC-MS/MS) method for the determination of sucralose in reclaimed and drinking waters and its photo degradation in natural waters from South Florida. Chem. Cent. J. 2013, 7, 141. [Google Scholar] [CrossRef] [Green Version]
- Pan, J.; Zhang, C.; Zhang, Z.; Li, G. Review of online coupling of sample preparation techniques with liquid chromatography. Anal. Chim. Acta 2014, 815, 1–15. [Google Scholar] [CrossRef] [PubMed]
- Mazzoni, M.; Rusconi, M.; Valsecchi, S.; Martins, C.P.B.; Polesello, S. An On-Line Solid Phase Extraction-Liquid Chromatography-Tandem Mass Spectrometry Method for the Determination of Perfluoroalkyl Acids in Drinking and Surface Waters. J. Anal. Methods Chem. 2015, 2015, 1–13. [Google Scholar] [CrossRef] [PubMed]
- Rodriguez-Mozaz, S.; Lopez de Alda, M.J.; Barceló, D. Advantages and limitations of on-line solid phase extraction coupled to liquid chromatography–mass spectrometry technologies versus biosensors for monitoring of emerging contaminants in water. J. Chromatogr. A 2007, 1152, 97–115. [Google Scholar] [CrossRef] [PubMed]
- Ding, J.; Ren, N.; Chen, L.; Ding, L. On-line coupling of solid-phase extraction to liquid chromatography-tandem mass spectrometry for the determination of macrolide antibiotics in environmental water. Anal. Chim. Acta 2009, 634, 215–221. [Google Scholar] [CrossRef] [PubMed]
- Togola, A.; Baran, N.; Coureau, C. Advantages of online SPE coupled with UPLC/MS/MS for determining the fate of pesticides and pharmaceutical compounds. Anal. Bioanal. Chem. 2014, 406, 1181–1191. [Google Scholar] [CrossRef] [PubMed]
- Wang, J.; Yang, Q.; Zhang, L.; Liu, M.; Hu, N.; Zhang, W.; Zhu, W.; Wang, R.; Suo, Y.; Wang, J. A hybrid monolithic column based on layered double hydroxide-alginate hydrogel for selective solid phase extraction of lead ions in food and water samples. Food Chem. 2018, 257, 155–162. [Google Scholar] [CrossRef]
- Salazar-Beltrán, D.; Hinojosa-Reyes, L.; Ruiz-Ruiz, E.; Hernández-Ramírez, A.; Luis Guzmán-Mar, J. Determination of phthalates in bottled water by automated on-line solid phase extraction coupled to liquid chromatography with uv detection. Talanta 2017, 168, 291–297. [Google Scholar] [CrossRef]
- Shi, Y.; Wu, H.; Wang, C.; Guo, X.; Du, J.; Du, L. Determination of polycyclic aromatic hydrocarbons in coffee and tea samples by magnetic solid-phase extraction coupled with HPLC–FLD. Food Chem. 2016, 199, 75–80. [Google Scholar] [CrossRef]
- Xie, L.; Guo, J.; Zhang, Y.; Shi, S. Efficient Determination of Protocatechuic Acid in Fruit Juices by Selective and Rapid Magnetic Molecular Imprinted Solid Phase Extraction Coupled with HPLC. J. Agric. Food Chem. 2014, 62, 8221–8228. [Google Scholar] [CrossRef]
- Chai, W.; Wang, H.; Zhang, Y.; Ding, G. Preparation of polydopamine-coated magnetic nanoparticles for dispersive solid-phase extraction of water-soluble synthetic colorants in beverage samples with HPLC analysis. Talanta 2016, 149, 13–20. [Google Scholar] [CrossRef]
- Chong, M.H.; Sanagi, M.M.; Endud, S.; Ibrahim, W.A.W.; Lau, S.C.; Alharbi, O.M.L.; Ali, I. Determination of N-nitrosamines in water by nano iron-porphyrinated poly(amidoamine) dendrimer MCM-41 generation-3 through solid phase membrane tip extraction and HPLC. Environ. Technol. Innov. 2018, 10, 102–110. [Google Scholar] [CrossRef]
- Wu, J.; Xie, W.; Pawliszyn, J. Automated in-tube solid phase microextraction coupled with HPLC-ES-MS for the determination of catechins and caffeine in tea. Analyst 2000, 125, 2216–2222. [Google Scholar] [CrossRef]
- Souza-Silva, É.A.; Jiang, R.; Rodríguez-Lafuente, A.; Gionfriddo, E.; Pawliszyn, J. A critical review of the state of the art of solid-phase microextraction of complex matrices I. Environmental analysis. TrAC Trends Anal. Chem. 2015, 71, 224–235. [Google Scholar] [CrossRef]
- Bojko, B.; Cudjoe, E.; Pawliszyn, J.; Wasowicz, M. Solid-phase microextraction. How far are we from clinical practice? TrAC Trends Anal. Chem. 2011, 30, 1505–1512. [Google Scholar] [CrossRef]
- Xu, J.; Zheng, J.; Tian, J.; Zhu, F.; Zeng, F.; Su, C.; Ouyang, G. New materials in solid-phase microextraction. TrAC Trends Anal. Chem. 2013, 47, 68–83. [Google Scholar] [CrossRef]
- Aziz-Zanjani, M.O.; Mehdinia, A. A review on procedures for the preparation of coatings for solid phase microextraction. Microchim. Acta 2014, 181, 1169–1190. [Google Scholar] [CrossRef]
- Saraji, M.; Rezaei, B.; Boroujeni, M.K.; Bidgoli, A.A.H. Polypyrrole/sol–gel composite as a solid-phase microextraction fiber coating for the determination of organophosphorus pesticides in water and vegetable samples. J. Chromatogr. A 2013, 1279, 20–26. [Google Scholar] [CrossRef] [PubMed]
- Gilart, N.; Marcé, R.M.; Borrull, F.; Fontanals, N. New coatings for stir-bar sorptive extraction of polar emerging organic contaminants. TrAC Trends Anal. Chem. 2014, 54, 11–23. [Google Scholar] [CrossRef]
- Tankiewicz, M.; Morrison, C.; Biziuk, M. Application and optimization of headspace solid-phase microextraction (HS-SPME) coupled with gas chromatography–flame-ionization detector (GC–FID) to determine products of the petroleum industry in aqueous samples. Microchem. J. 2013, 108, 117–123. [Google Scholar] [CrossRef]
- Li, J.; Su, Q.; Li, K.-Y.; Sun, C.-F.; Zhang, W.-B. Rapid analysis of phthalates in beverage and alcoholic samples by multi-walled carbon nanotubes/silica reinforced hollow fibre-solid phase microextraction. Food Chem. 2013, 141, 3714–3720. [Google Scholar] [CrossRef] [PubMed]
- Da Silva, G.C.; da Silva, A.A.S.; da Silva, L.S.N.; Godoy, R.L.D.O.; Nogueira, L.C.; Quitério, S.L.; Raices, R.S.L. Method development by GC–ECD and HS-SPME–GC–MS for beer volatile analysis. Food Chem. 2015, 167, 71–77. [Google Scholar] [CrossRef] [PubMed]
- Wu, J.-F.; Xu, Y. Comparison of pyrazine compounds in seven Chinese liquors using headspace solid-phase micro-extraction and GC-nitrogen phosphourus detection. Food Sci. Biotechnol. 2013, 22, 1–6. [Google Scholar] [CrossRef]
- Liu, F.-J.; Liu, C.-T.; Li, W.; Tang, A.-N. Dispersive solid-phase microextraction and capillary electrophoresis separation of food colorants in beverages using diamino moiety functionalized silica nanoparticles as both extractant and pseudostationary phase. Talanta 2015, 132, 366–372. [Google Scholar] [CrossRef] [PubMed]
- Moreira, N.; Araújo, A.M.; Rogerson, F.; Vasconcelos, I.; De Freitas, V.; de Pinho, P.G. Development and optimization of a HS-SPME-GC-MS methodology to quantify volatile carbonyl compounds in Port wines. Food Chem. 2019, 270, 518–526. [Google Scholar] [CrossRef] [PubMed]
- Wu, M.; Zhang, H.; Zhao, F.; Zeng, B. A novel poly(3,4-ethylenedioxythiophene)-ionic liquid composite coating for the headspace solid-phase microextraction and gas chromatography determination of several alcohols in soft drinks. Anal. Chim. Acta 2014, 850, 41–48. [Google Scholar] [CrossRef] [PubMed]
- Yang, M.; Wu, X.; Xi, X.; Zhang, P.; Yang, X.; Lu, R.; Zhou, W.; Zhang, S.; Gao, H.; Li, J. Using β-cyclodextrin/attapulgite-immobilized ionic liquid as sorbent in dispersive solid-phase microextraction to detect the benzoylurea insecticide contents of honey and tea beverages. Food Chem. 2016, 197, 1064–1072. [Google Scholar] [CrossRef] [PubMed]
- Ma, C.; Qu, Y.; Zhang, Y.; Qiu, B.; Wang, Y.; Chen, X. Determination of nerolidol in teas using headspace solid phase microextraction–gas chromatography. Food Chem. 2014, 152, 285–290. [Google Scholar] [CrossRef] [PubMed]
- Eisert, R.; Pawliszyn, J. Automated In-Tube Solid-Phase Microextraction Coupled to High-Performance Liquid Chromatography. Anal. Chem. 1997, 69, 3140–3147. [Google Scholar] [CrossRef]
- Kataoka, H. Automated sample preparation using in-tube solid-phase microextraction and its application—A review. Anal. Bioanal. Chem. 2002, 373, 31–45. [Google Scholar] [CrossRef]
- Moliner-Martinez, Y.; Herráez-Hernández, R.; Verdú-Andrés, J.; Molins-Legua, C.; Campíns-Falcó, P. Recent advances of in-tube solid-phase microextraction. TrAC Trends Anal. Chem. 2015, 71, 205–213. [Google Scholar] [CrossRef]
- Poorahong, S.; Thammakhet, C.; Thavarungkul, P.; Kanatharana, P. Online in-tube microextractor coupled with UV-Vis spectrophotometer for bisphenol a detection. J. Environ. Sci. Health Part A 2013, 48, 242–250. [Google Scholar] [CrossRef] [PubMed]
- Wang, X.; Li, X.; Li, Z.; Zhang, Y.; Bai, Y.; Liu, H. Online Coupling of In-Tube Solid-Phase Microextraction with Direct Analysis in Real Time Mass Spectrometry for Rapid Determination of Triazine Herbicides in Water Using Carbon-Nanotubes-Incorporated Polymer Monolith. Anal. Chem. 2014, 86, 4739–4747. [Google Scholar] [CrossRef] [PubMed]
- Wu, J.H.; Zhao, Y.; Li, T.; Xu, C.; Xiao, K.; Feng, Y.Q.; Guo, L. The use of liquid phase deposition prepared phosphonate grafted silica nanoparticledeposited capillaries in the enrichment of phosphopeptides. J. Sep. Sci. 2010, 33, 1806–1815. [Google Scholar] [CrossRef] [PubMed]
- Wang, S.T.; Wang, M.Y.; Su, X.; Yuan, B.F.; Feng, Y.Q. Facile preparation of SiO2/TiO2 composite monolithic capillary column and its application in enrichment of phosphopeptides. Anal. Chem. 2012, 84, 7763–7770. [Google Scholar] [CrossRef]
- Fernández-Amado, M.; Prieto-Blanco, M.C.; López-Mahía, P.; Muniategui-Lorenzo, S.; Prada-Rodríguez, D. Strengths and weaknesses of in-tube solid-phase microextraction: A scoping review. Anal. Chim. Acta 2016, 906, 41–57. [Google Scholar] [CrossRef]
- Ishizaki, A.; Saito, K.; Hanioka, N.; Narimatsu, S.; Kataoka, H. Determination of polycyclic aromatic hydrocarbons in food samples by automated on-line in-tube solid-phase microextraction coupled with high-performance liquid chromatography-fluorescence detection. J. Chromatogr. A 2010, 1217, 5555–5563. [Google Scholar] [CrossRef]
- Ishizaki, A.; Sito, K.; Kataoka, H. Analysis of contaminant polycyclic aromatic hydrocarbons in tea products and crude drugs. Anal. Methods 2011, 3, 299–305. [Google Scholar] [CrossRef]
- Kataoka, H.; Itano, M.; Ishizaki, A.; Saito, K. Determination of patulin in fruit juice and dried fruit samples by in-tube solid-phase microextraction coupled with liquid chromatography-mass spectrometry. J. Chromatogr. A 2009, 1216, 3746–3750. [Google Scholar] [CrossRef]
- Tan, F.; Zhao, C.; Li, L.; Liu, M.; He, X.; Gao, J. Graphene oxide based in-tube solid-phase microextraction combined with liquid chromatography tandem mass spectrometry for the determination of triazine herbicides in water. J. Sep. Sci. 2015, 38, 2312–2319. [Google Scholar] [CrossRef]
- Maciel, E.V.S.; de Toffoli, A.L.; Lanças, F.M. Current status and future trends on automated multidimensional separation techniques employing sorbent-based extraction columns. J. Sep. Sci. 2018, 42, 258–272. [Google Scholar] [CrossRef]
- Andrade, M.A.; Lanc, F.M. Determination of Ochratoxin A in wine by packed in-tube solid phase microextraction followed by high performance liquid chromatography coupled to tandem mass spectrometry. 2017, 1493, 41–48. [Google Scholar] [CrossRef] [PubMed]
- Hu, Y.; Fan, Y.; Li, G. Preparation and evaluation of a porous monolithic capillary column for microextraction of estrogens from urine and milk samples online coupled to high-performance liquid chromatography. J. Chromatogr. A 2012, 1228, 205–212. [Google Scholar] [CrossRef] [PubMed]
- Wu, F.; Wang, J.; Zhao, Q.; Jiang, N.; Lin, X.; Xie, Z.; Li, J.; Zhang, Q. Detection of trans-fatty acids by high performance liquid chromatography coupled with in-tube solid-phase microextraction using hydrophobic polymeric monolith. J. Chromatogr. B Anal. Technol. Biomed. Life Sci. 2017, 1040, 214–221. [Google Scholar] [CrossRef] [PubMed]
- Wang, T.T.; Chen, Y.H.; Ma, J.F.; Hu, M.J.; Li, Y.; Fang, J.H.; Gao, H.Q. A novel ionic liquid-modified organic-polymer monolith as the sorbent for in-tube solid-phase microextraction of acidic food additives. Anal. Bioanal. Chem. 2014, 406, 4955–4963. [Google Scholar] [CrossRef] [PubMed]
- Ayrton, J.; Dear, G.J.; Leavens, W.J.; Mallett, D.N.; Plumb, R.S. The use of turbulent flow chromatography/mass spectrometry for the rapid, direct analysis of a novel pharmaceutical compound in plasma. Rapid Commun. Mass Spectrom. 1997, 11, 1953–1958. [Google Scholar] [CrossRef]
- Song, Q.; Zhao, Y.; Chen, X.; Li, J.; Li, P.; Jiang, Y.; Wang, Y.; Song, Y.; Tu, P. New instrumentation for large-scale quantitative analysis of components spanning a wide polarity range by column-switching hydrophilic interaction chromatography-turbulent flow chromatography-reversed phase liquid chromatography-tandem mass spectrometry. RSC Adv. 2017, 7, 31838–31849. [Google Scholar] [CrossRef]
- Giulivo, M.; Capri, E.; Eljarrat, E.; Barceló, D. Analysis of organophosphorus flame retardants in environmental and biotic matrices using on-line turbulent flow chromatography-liquid chromatography-tandem mass spectrometry. J. Chromatogr. A 2016, 1474, 71–78. [Google Scholar] [CrossRef] [PubMed]
- Presta, M.A.; Bruyneel, B.; Zanella, R.; Kool, J.; Krabbe, J.G.; Lingeman, H. Determination of Flavonoids and Resveratrol in Wine by Turbulent-Flow Chromatography-LC-MS. Chromatographia 2009, 69, 167–173. [Google Scholar] [CrossRef] [Green Version]
- Kinsella, B.; O’Mahony, J.; Malone, E.; Moloney, M.; Cantwell, H.; Furey, A.; Danaher, M. Current trends in sample preparation for growth promoter and veterinary drug residue analysis. J. Chromatogr. A 2009, 1216, 7977–8015. [Google Scholar] [CrossRef] [Green Version]
- Stolker, A.A.M.; Peters, R.J.B.; Zuiderent, R.; DiBussolo, J.M.; Martins, C.P.B. Fully automated screening of veterinary drugs in milk by turbulent flow chromatography and tandem mass spectrometry. Anal. Bioanal. Chem. 2010, 397, 2841–2849. [Google Scholar] [CrossRef] [Green Version]
- Zhu, W.X.; Yang, J.Z.; Wang, Z.X.; Wang, C.J.; Liu, Y.F.; Zhang, L. Rapid determination of 88 veterinary drug residues in milk using automated TurborFlow online clean-up mode coupled to liquid chromatography-tandem mass spectrometry. Talanta 2016, 148, 401–411. [Google Scholar] [CrossRef] [PubMed]
- Bousova, K.; Senyuva, H.; Mittendorf, K. Multiresidue automated turbulent flow online LC-MS/MS method for the determination of antibiotics in milk. Food Addit. Contam. Part A 2012, 29, 1901–1912. [Google Scholar] [CrossRef] [PubMed]
- Fan, S.; Li, Q.; Sun, L.; Du, Y.; Xia, J.; Zhang, Y. Simultaneous determination of aflatoxin B1 and M1 in milk, fresh milk and milk powder by LC-MS/MS utilising online turbulent flow chromatography. Food Addit. Contam. Part A 2015, 32, 1175–1184. [Google Scholar] [CrossRef] [PubMed]
- Molins-Delgado, D.; del Mar Olmo-Campos, M.; Valeta-Juan, G.; Pleguezuelos-Hernández, V.; Barceló, D.; Díaz-Cruz, M.S. Determination of UV filters in human breast milk using turbulent flow chromatography and babies’ daily intake estimation. Environ. Res. 2018, 161, 532–539. [Google Scholar] [CrossRef] [PubMed]
- Barreiro, J.C.; Luiz, A.L.; Maciel, S.C.F.; Maciel, E.V.S.; Lanças, F.M. Recent approaches for on-line analysis of residues and contaminants in food matrices: A review. J. Sep. Sci. 2015, 38, 1721–1732. [Google Scholar] [CrossRef] [PubMed]
- Dass, C. Fundamentals of Contemporary Mass Spectrometry; John Wiley & Sons: Hoboken, NJ, USA, 2007; ISBN 9780471682295. [Google Scholar]
- De Toffoli, A.L.; Fumes, B.H.; Lanças, F.M. Packed in-tube solid phase microextraction with graphene oxide supported on aminopropyl silica: Determination of target triazines in water samples. J. Environ. Sci. Health Part B 2018, 53, 434–440. [Google Scholar] [CrossRef] [PubMed]
- Roach, J.A.G.; Dibussolo, J.M.; Krynitsky, A.; Noonan, G.O. Evaluation and single laboratory validation of an on-line turbulent flow extraction tandem mass spectrometry method for melamine in infant formula. J. Chromatogr. A 2011, 1218, 4284–4290. [Google Scholar] [CrossRef]
- Da Silva, M.R.; Lanças, F.M. Evaluation of ionic liquids supported on silica as a sorbent for fully automated online solid-phase extraction with LC-MS determination of sulfonamides in bovine milk samples. J. Sep. Sci. 2018, 41, 2237–2244. [Google Scholar] [CrossRef]
- Campone, L.; Piccinelli, A.L.; Celano, R.; Pagano, I.; Russo, M.; Rastrelli, L. Rapid and automated analysis of aflatoxin M1 in milk and dairy products by online solid phase extraction coupled to ultra-high-pressure-liquid-chromatography tandem mass spectrometry. J. Chromatogr. A 2016, 1428, 212–219. [Google Scholar] [CrossRef]
- Li, J.; Zhang, Z.; Sun, M.; Zhang, B.; Fan, C. Use of a Headspace Solid-Phase Microextraction-Based Methodology Followed by Gas Chromatography–Tandem Mass Spectrometry for Pesticide Multiresidue Determination in Teas. Chromatographia 2018, 81, 809–821. [Google Scholar] [CrossRef]
- Zheng, M.-M.; Ruan, G.-D.; Feng, Y.-Q. Evaluating polymer monolith in-tube solid-phase microextraction coupled to liquid chromatography/quadrupole time-of-flight mass spectrometry for reliable quantification and confirmation of quinolone antibacterials in edible animal food. J. Chromatogr. A 2009, 1216, 7510–7519. [Google Scholar] [CrossRef] [PubMed]
- Campone, L.; Piccinelli, A.L.; Celano, R.; Pagano, I.; Russo, M.; Rastrelli, L. Rapid and automated on-line solid phase extraction HPLC–MS/MS with peak focusing for the determination of ochratoxin A in wine samples. Food Chem. 2018, 244, 128–135. [Google Scholar] [CrossRef] [PubMed]
- Barnaba, C.; Dellacassa, E.; Nicolini, G.; Nardin, T.; Malacarne, M.; Larcher, R. Identification and quantification of 56 targeted phenols in wines, spirits, and vinegars by online solid-phase extraction—Ultrahigh-performance liquid chromatography—Quadrupole-orbitrap mass spectrometry. J. Chromatogr. A 2015, 1423, 124–135. [Google Scholar] [CrossRef] [PubMed]
Figure 1.
Schematic set up for on-line solid-phase extraction in a back-flush mode.

Figure 2.
Main solid-phase microextraction configurations: (a) fiber; (b) in-tube; (c) thin film; (d) magnetic; (e) pointer; and (f) stir bar. Adapted from Reference [45]. Reproduced by permission from Elsevier.
Figure 2.
Main solid-phase microextraction configurations: (a) fiber; (b) in-tube; (c) thin film; (d) magnetic; (e) pointer; and (f) stir bar. Adapted from Reference [45]. Reproduced by permission from Elsevier.

Figure 3.
Schematic diagram of possible coupling and configurations of in-tube SPME with analytical instruments. Flow through mode 1V = one valve; 2V = two valves. Cyc = Draw/eject cycles mode. ACIT = array capillary in-tube. Syr = Syringe configuration. Adapted from Reference [67]. Reproduced by permission from Elsevier.

Figure 4.
Schematic diagram illustrating the automated on-line in-tube SPME/HPLC technique. Flow-through extraction system (a) load position (extraction) and (b) inject position (desorption); and draw/eject extraction system (c) load position (extraction) and (d) inject position (desorption). Adapted from Reference [5]. Reprinted by permission from Elsevier.

Figure 5.
Schematic set up for automated turbulent-flow chromatography (a) loading position and (b) elution position.
Figure 5.
Schematic set up for automated turbulent-flow chromatography (a) loading position and (b) elution position.

Figure 6.
Schematic diagram representing a typical workflow employed in fully automated Extraction-Chromatography-Mass Spectrometry system.
Figure 6.
Schematic diagram representing a typical workflow employed in fully automated Extraction-Chromatography-Mass Spectrometry system.


Table 1.
Applications of SPE as a sample preparation technique in the analysis of beverages.
| Matrix | Analyte | Stationary Phase | Separation/Detection | LOD 1 (µg/L) | Ref. |
|---|---|---|---|---|---|
| Apple, orange and sea-buckthorn juices, tap and mineral water | Pb(II) | Alginate hydrogel based hybrid monolithic | Flame atomic absorption spectrometer | 0.39 | [38] |
| Beer | Ochratoxin A (OTA) | Polycaprolactone microfiber/polyvinylidene difluoride nanofibers | UPLC-FLD | 0.5 | [20] |
| Bottled water | Phthalates | C18-bonded silica | HPLC-UV | 0.7–2.4 | [39] |
| Coffee and tea | PAHs | Fe3O4@3-(Trimethoxysilyl)propyl methacrylate@ionic liquid nanoparticles | HPLC–FLD | 0.0001–0.01 | [40] |
| Grape juice, apple juice, pineapple juice, orange juice, and peach juice | Protocatechuic Acid | PCA-MIPs | HPLC-UV | 500 | [41] |
| Powdered beverages and juices | Synthetic colorants | Polydopamine coated Fe3O4 nanoparticles | HPLC-DAD | 0.20–0.25 | [42] |
| Water | N-nitrosamines | Nano iron-porphyrinated poly(amidoamine) dendrimer MCM-41 Generation-3 | HPLC-UV | 0.6–0.75 | [43] |
1 LOD: Limit of Detection.
Table 2.
Application of SPME as a sample preparation technique in the analysis of beverages.
| Matrix | Analyte | Fiber Coating | Separation/Detection | LOD 1 (µg/L) | Ref. |
|---|---|---|---|---|---|
| Beer, carbonated drink, fresh milk, juice, red wine, and white wine. | Phthalate acid esters | Carbon nanotubes (MWCNTs)/silica | GC-MS | 0.006–0.03 | [52] |
| Brazilian Pilsner beers | Off-flavors | DVB/CAR/PDMS | GC–ECD | 39.48– 0.61 | [53] |
| Chinese liquors | Pyrazines | CAR/DVB/PDMS | GC-NPD | 0.035–0.142 | [54] |
| Fruit juice | Food colorants | Diamino moiety functionalized silica nanoparticles | CE | 30–360 | [55] |
| Port wines | Carbonyl compounds | PDMS/DVB | GC-MS | 0.006–0.089 | [56] |
| Soft drinks | Alcohols | Poly(3,4-ethylenedioxythiophene)-ionic liquid | GC-FID | 0.0342–0.0813 | [57] |
| Teas | Benzoylurea insecticide | β-cyclodextrin/attapulgite-immobilized ionic liquid | HPLC | 0.12–0.21 | [58] |
| Teas | Nerolidol | PDMS/DVB | GC-FID | 0.3 (µg/kg) | [59] |
1 LOD: Limit of Detection.
Table 3.
Beverages applications summary of in-tube SPME in the last decade.
| Matrix | Analyte | In-Tube Device | Mode | On-Line | Separation/Detection | LOD 1 (µg/L) | Ref. |
|---|---|---|---|---|---|---|---|
| Coca-cola and Sprite | Acidic additives | Ionic liquid-organic polymer monolith | Draw/eject | no | HPLC-UV | 1.2–13.5 | [76] |
| Fruit juice | Patulin | Carboxen 1006 PLOT | Draw/eject cycles | yes | LC-MS | 0.0235 | [70] |
| Instant coffee | Trans-fatty acids and esters | Poly OMA-co-EDMA monolith | Flow through | yes | HPLC-UV | 3.0–7.1 (µg/kg) | [75] |
| Milk | Estrogens | Monolithic Poly(MAA-co-EGDMA) | Flow through | yes | HPLC-UV | 0.04–0.35 | [74] |
| Nonfat milk | Phospho-peptides | Phosphonate grafted silica nanoparticle (NP-IMAC-Zr4+) | Draw/eject cycles in a syringe | no | MALDI-TOF | 50 (fmol) | [65] |
| Nonfat milk | Phospho-peptides | Monolith SiO2/TiO2 | Draw/eject | no | MALDI-TOF-MS | 10–50 (fmol) | [66] |
| Orange juice | Triazines | Carbon nanotubes in polymer monolith | Draw/eject | yes | DART-MS | 0.02–0.14 | [64] |
| Teas | PAHs | CP-Sil 19CB | Draw/eject cycles | yes | HPLC-FLD | 0.00032–0.0046 | [69] |
| Water | Triazines | GO in a silica tube | Flow through | no | HPLC-MS/MS | 0.0005–0.005 | [71] |
| Water in baby bottles | Bisphenol A | CPANI in silica-steel tube | Flow through | yes | UV-vis | 20 (nM) | [63] |
1 LOD: Limit of Detection.
Table 4.
Representative applications of on-line extraction—chromatography—tandem mass spectrometry to the analysis of beverages.
Table 4.
Representative applications of on-line extraction—chromatography—tandem mass spectrometry to the analysis of beverages.
| Matrix | Analyte | Extraction Method/Device | Separation/Detection | LOD 1 (µg/L) | Ref. |
|---|---|---|---|---|---|
| Bottled Water | Triazines | In-tube SPME, packed GO-amino silica particles | UHPLC-ESI-MS/MS | 0.0011–0.0029 | [89] |
| Breast milk | UV-Filters residues | TFC, Transcend™ TLX-1, Cyclone P column | TFC-HPLC-ESI-MS/MS | 0.1–1.5 (µg/kg) | [86] |
| Infant formula | Melamine | TFC, Transcend TLX-2, Cyclone MCX-2 cation exchanger turboflow™ column | TFC-APCI-LC-MS/MS | 27 (µg/kg) | [90] |
| Milk | Sulfonamide antibiotics | SPE, silica-based ionic liquid (IL) | SPE-LC-ESI-TOF-MS | 1.5–2.25 | [91] |
| Milk | Veterinary drugs | TFC, Transcend™ TLX-1, Turboflow™ cyclone column (50 × 1.0 mm, 60 µm particle size, 60 Å pore size) | TFC-ESI-LC-MS/MS | 0.2–2.0 (µg/kg) | [83] |
| Milk and dairy products | Aflatoxin M1 | SPE, C18 cartridge | UHPLC-ESI- MS/MS | 0.0005–0.0007 (µg/kg) | [92] |
| Skimmed Milk | Antibiotics | TFC, Transcend™ TLX-1, Cyclone P column (50 × 0.5 mm, 60 µm particle size, 60 Å pore size) | TFC-LC-ESI-MS/MS | 0.3–25 (µg/kg) | [84] |
| Tea | Pesticides | HS-SPME, PDMS/DVB fiber | GC-MS/MS | 1–5 (µg/kg) 2 | [93] |
| Whole milk | Quinolone antibacterial | In-tube SPME, monolithic microcolumn Poly(MAA-co-EGDMA) | LC-ESI-QTOF-MS | 0.2–3.0 | [94] |
| Wine | Ochratoxin A | In-tube SPME, packed C18 particles in a peek tube | UHPLC-ESI-MS/MS | 0.02 | [73] |
| Wine | Ochratoxin A | SPE, Oasis MAX cartridge | HPLC-ESI- MS/MS | 0.012 | [95] |
| Wine, spirits, vinegars | Phenols | SPE, HyperSep™ Retain PEP cartridge | UHPLC-ESI-Q-Orbitrap | 0.1–5 2 | [96] |
1 LOD: Limit of Detection; 2 LOQ: Limit of Quantification.
© 2019 by the authors. Licensee MDPI, Basel, Switzerland. This article is an open access article distributed under the terms and conditions of the Creative Commons Attribution (CC BY) license (http://creativecommons.org/licenses/by/4.0/).
Share and Cite
MDPI and ACS Style
Mejía-Carmona, K.; Jordan-Sinisterra, M.; Lanças, F.M. Current Trends in Fully Automated On-Line Analytical Techniques for Beverage Analysis. Beverages 2019, 5, 13. https://0-doi-org.brum.beds.ac.uk/10.3390/beverages5010013
AMA Style
Mejía-Carmona K, Jordan-Sinisterra M, Lanças FM. Current Trends in Fully Automated On-Line Analytical Techniques for Beverage Analysis. Beverages. 2019; 5(1):13. https://0-doi-org.brum.beds.ac.uk/10.3390/beverages5010013
Chicago/Turabian StyleMejía-Carmona, Karen, Marcela Jordan-Sinisterra, and Fernando M. Lanças. 2019. "Current Trends in Fully Automated On-Line Analytical Techniques for Beverage Analysis" Beverages 5, no. 1: 13. https://0-doi-org.brum.beds.ac.uk/10.3390/beverages5010013
Note that from the first issue of 2016, this journal uses article numbers instead of page numbers. See further details here.