
Optimization and Application of the Wine Neophobia Scale


1
Department of Biological Sciences, Brock University, St. Catharines, ON L2S 3A1, Canada
2
Department of Psychology, Brock University, St. Catharines, ON L2S 3A1, Canada
3
Environmental Sustainability Research Centre, Brock University, St. Catharines, ON L2S 3A1, Canada
4
Cool Climate Oenology and Viticulture Institute, Brock University, St. Catharines, ON L2S 3A1, Canada
5
Sustainability Research Centre, University of the Sunshine Coast, Sippy Downs, QLD 4556, Australia
6
National Wine and Grape Research Center, Charles Sturt University, Wagga Wagga, NSW 2678, Australia
*
Author to whom correspondence should be addressed.
Beverages 2021, 7(2), 41; https://0-doi-org.brum.beds.ac.uk/10.3390/beverages7020041
Submission received: 1 May 2021
/
Revised: 20 May 2021
/
Accepted: 9 June 2021
/
Published: 17 June 2021
Abstract
:Wine consumers’ willingness (wine neophilia) or reluctance (wine neophobia) to try new wines represent, respectively, an opportunity or barrier for product innovation and market development in the wine industry. Here, we first sought to validate and optimize the Wine Neophobia Scale (WNS) in a large sample of 1269 Canadian wine consumers. Both exploratory and confirmatory factor analyses showed that a seven-item scale was optimal. This modified WNS (mWNS) was then used to investigate demographic and behavioral correlates of wine neophobia. Using lower and upper quartile values, 316 neophiles and 326 neophobes were identified. Wine neophiles and neophobes did not differ with respect to gender or age; however, neophobes had lower household income, education, and wine involvement, and reported consuming fewer wine styles than neophiles. Interestingly, while neophiles drank wine considerably more frequently than neophobes—a finding that is mediated by wine involvement—total annual wine intake did not differ between the groups. Importantly, the price typically paid per bottle of wine also varied with wine neophobia. We recommend adoption of the modified mWNS as a useful tool for more fully understanding the drivers of wine behavior and providing guidance to wine marketers.
1. Introduction
From birth, infants have already begun to develop distinct taste preferences [1]. For example, infants exposed to sweet or umami tastes will show facial expressions associated with liking (e.g., turning up the corners of the mouth), whereas those exposed to bitter or sour tastes may exhibit expressions of disgust (e.g., grimacing; [1]). These early taste preferences, combined with genetic and environmental influences, help shape food preferences over the lifespan [2]. As children develop, however, they begin to experience food neophobia, which is the fear or rejection of novel foods [3]. Neophobia tends to develop in the latter half of the first year of life and is highly variable, with some infants showing little-to-no neophobic tendencies, and others showing extreme neophobia [3,4]. As we become exposed to more unfamiliar foods (particularly if the experience is a positive one), this neophobia begins to wane [5]. However, most individuals will experience some degree of food neophobia throughout their lifespan.
1.1. Measuring Neophobia
Although food neophobia is generally thought to serve as an adaptive mechanism that evolved to protect humans from inadvertently consuming dangerous or deadly foods [3], it can have significant deleterious effects. For example, it may lead to poor dietary choices that in turn can result in malnutrition, obesity, cardiovascular complications, and even the development of certain cancers [6]. From an industry perspective, neophobia can prevent consumers from embracing novel, innovative products, thereby leading to high market failure rates which can reach 70–80% [7,8]. As such, there is significant interest in understanding the unique characteristics of food and beverage neophobes.
While neophobia can be overcome to some degree with various manipulations, Pliner and Hobden [3] recognized that there are also significant, somewhat intractable, dispositional differences in the degree of neophobia. In order to better explore these trait-like differences, they developed the Food Neophobia Scale (FNS) to help classify the degree of neophobia in adults. The scale consists of 10 statements (e.g., “I am afraid to eat things that I have never had before”; “If I don’t know what a food is, I won’t try it”) that are designed to assess an individual’s comfort with experiencing novel foods [3]. High scores on the FNS indicate significant neophobic tendencies, whereas low scores indicate neophilic tendencies. Because the scale is brief and easy to administer, there has been significant uptake by researchers and clinicians alike, thereby leading to a surge in research on individual variations in neophobia. For example, researchers have now been able to identify a number of characteristics, both dispositional and environmental, that are associated with varying levels of neophobia, including age [9,10,11,12], sex [9,12], income [10,12,13], level of education [12,13], personality [14,15], sensation seeking [16,17,18,19], and disgust [20]. This increased understanding of correlates of neophobia can in turn be used to help develop targeted interventions to reduce the negative effects of neophobia and increase acceptance of novel foods.
1.2. Wine Neophobia
Neophobia is not only problematic for the food industry, but for the wine industry as well. Within an increasingly challenging and over-supplied global wine [21], product innovation is a key component to remaining competitive, and recent years have witnessed significant growth in both novel styles (e.g., ‘natural wines’) and products from new wine regions [22]. However, reluctance to try novel wines represents a significant potential barrier to adoption of these innovations, and a better understanding of wine neophobia is needed to provide guidance to the industry and allow for the development of optimal marketing strategies.
While simple one-item measures of both alcoholic beverage [23,24] and wine [25] adventurousness have previously been used in wine research, no validated measure of the antonym (wine neophobia) existed until the work of Ristic et al. [26] when the authors adapted the FNS [3] to more specifically address the case of wine. To develop the Wine Neophobia Scale (WNS), Ristic et al. [26] first replaced the word “food” with “wine” for each scale item of the FNS (with the exception of “ethnic food looks too weird to eat”, which was removed from the scale). For example, the FNS item “I am afraid to eat things that I have never had before” was changed to “I am afraid to drink wines that I have never had before” for the WNS. The scale was then validated across several studies, resulting in the final eight-item WNS. The authors then applied this tool to a sample of 471 Australian wine consumers and reported that wine neophobia increased with age but decreased with higher educational attainment and income. Other than one study on how a range of factors, including wine neophobia, associated with wine consumption and attitudes of Italian millennials [27], and a second study that examined how neophobia in Australian, Chinese, and Vietnamese consumers was associated with attitudes towards a novel wine product [28], we are not aware of the application of the WNS in other studies.
1.3. Current Study
Despite the significant role that food neophobia plays in consumer’s food choices, there is very little literature informing how personality factors relate to wine behavior and even less on the role of wine neophobia. The study of Ristic et al. [26] provides both a tool for assessing wine neophobia—a phenomenon that appears to vary widely across individuals—and how variations in wine neophobia are associated with differences in age, income, and education. To our knowledge, the role that wine neophobia plays in wine consumer behavior has yet to be examined in North America, despite this market’s value being estimated at between USD 110 and 145 billion [29]. Additionally, the WNS has not been validated outside of the original Ristic et al. [26] study, and wine neophobes and neophiles have yet to be fully characterized beyond the simple demographic features described above. These considerations informed the current study goals.
Our first goal was to examine whether changes in the Likert-scale length used in the WNS have an impact on its reliability. Likert scales, developed in 1932, are now one of the most ubiquitous psychometric scales used in questionnaire research [30]. They allow us to translate feelings, behaviors, and attitudes into a discrete, numerical format, are simple to construct and administer, and lend themselves to a host of different statistical analysis techniques [30]. However, there are important considerations that must be made when designing a Likert scale to address specific research questions, such as the wording of the scale and the number of response alternatives that are provided. For example, many Likert scales have five options (e.g., 1 = not at all; 5 = very much), but depending on the research question and the construct under investigation, researchers will often either reduce or increase the number of response options. Although there are significant benefits to using a more comprehensive Likert scale, such as the ability to detect finer-grained discriminations between individuals, there are also significant drawbacks, including a rise in questionnaire completion time, and participant confusion and choice paralysis when presented with too many [31,32]. As such, we administered three different versions of the WNS (a five-, seven-, and nine-point Likert scale version) in order to examine the effect of number of response options on wine neophobia scores.
Our second goal was to validate the WNS using a large sample of Canadian wine consumers. Our third goal was to further characterize wine neophobes by examining how their wine behavior (amount and diversity consumed, frequency of intake, price paid per bottle) and level of wine involvement and knowledge compares to that of neophiles. Our findings should provide actionable information for industry practitioners interested in increasing uptake of novel wine products, as well as epidemiologists and other health professionals seeking to more fully understand how personality factors affect alcoholic beverage consumption.
2. Materials and Methods
2.1. Participants
A total of 1269 wine consumers from Ontario, Canada (634 females; 629 males; 6 undisclosed), ranging in age from 20 to 89 (M = 52.48, SD = 15.34), participated in this study. To be eligible to participate, all individuals had to be at least 19 years of age (the legal drinking age in Ontario), fluent in English, and needed to self-identify as a wine drinker. Participants provided written consent prior to completing the study. This study was approved by the Human Research Ethics Board at Brock University (File #19-130 PICKERING) and conducted in accordance with Tri-Council ethical guidelines.
2.2. Stimuli and Design
Eligible participants were instructed to complete an online questionnaire, presented via Qualtrics. The questionnaire contained: (1) demographic questions, (2) a set of questions regarding annual wine intake and purchasing behaviors, (3) a series of questions designed to assess wine involvement/knowledge, and (4) the Wine Neophobia Scale (WNS). The details for each scale are presented below. The questions were presented in the same order for each participant, and the entire questionnaire took approximately 10–15 min to complete.
2.2.1. Demographics
Participants were asked to provide their gender, age, household income, highest completed level of education, and their postal code. Table 1 contains a breakdown of the demographics for this sample.
2.2.2. Wine Consumption and Purchasing Behaviors
To assess wine consumption, participants were asked to indicate the average number of times per month that they consumed wine. They were also instructed to estimate the average number of standard 5 oz drinks that they consumed on the days in which they drank wine. An annual intake frequency score was calculated by multiplying the number of days per month in which they consumed wine by 12. In addition, an annual wine intake score was derived by multiplying the annual intake frequency score by the average number of standard drinks consumed. These intake measures follow the approach used by Pickering et al. [23].
To examine purchasing behaviors, participants were asked to indicate how much they would typically pay for a 750 mL bottle (or equivalent) of wine when purchasing at the store by selecting one of the following price categories: < CAD 10, CAD 10–14.99, CAD 15–19.99, CAD 20–24.99, CAD 25–29.99, CAD 30–39.99, or CAD 40 or more.
To assess consumption diversity, participants were presented with eight categories of wine (white, red, rosé, sparkling, fortified, mixer, low-alcohol, and other) and were asked to indicate how often they consumed each type of wine using a 5-point scale (1 = “never”; 2 = “rarely”; 3 = “some of the time”; 4 = “most of the time”; 5 = “all of the time”). A wine diversity score was then calculated by summing the total number of wine categories that participants indicated they consumed at least “some of the time”, for a maximum possible score of 8.
2.2.3. Wine Involvement and Knowledge
Wine involvement was assessed using a 10-item shortened version of the 24-item scale described in Bruwer and Huang [33] and retains elements from each of the five wine involvement dimensions of the original scale (interest, behavior, ritual, pleasure, and risk). Using a 5-point Likert scale (1 = “strongly disagree”; 2 = “disagree”; 3 = “neither agree nor disagree”; 4 = “agree”; 5 = “strongly agree”), participants were asked to rate their level of agreement with each of the 10 statements: “I have a strong interest in wine”, “I often read wine magazines and publications”, “I drink wine mainly on special occasions”, “I often match my food and wine”, “I own proper wine glasses (e.g., Riedel, Spiegelau, etc.)”, “I seldom decant red wines (pour into another container to separate any sediment)”, “Drinking wine gives me pleasure”, “I enjoy and often attend wine tasting events”, “Deciding which wine to buy is an important decision for me”, and “I am not confident in my ability to select a wine”. Scores were summed across the 10 questions for a total score out of 50 (correcting for reverse-keyed items), with higher scores indicating greater wine involvement.
Wine knowledge was assessed using an adapted/shortened version of the tool used by Vecchio et al. [34]. Participants used a 5-point Likert scale (1 = “strongly disagree”; 2 = “disagree”; 3 = “neither agree nor disagree”; 4 = “agree”; 5 = “strongly agree”) to rate their level of agreement with each of the four statements: “I feel quite knowledgeable about wine”, “Compared to most other people, I know less about wine”, “When it comes to wine, I really do not know a lot”, and “Among my friends, I am one of the ‘experts’ on wine”. Scores were summed across the four questions for a total score out of 20 (correcting for reverse-keyed items), with higher scores indicating greater wine knowledge.
2.2.4. Wine Neophobia Scale (WNS)
The WNS was adapted from Ristic et al. [26]. Participants rated their level of agreement with eight statements: Item (1) “I like going to places serving wines from different countries”, Item (2) “I will drink almost any wine”, Item (3) “I am afraid to drink wines that I have never had before”, Item (4) “At social gatherings, I will try a new wine”, Item (5) “I like wines from different countries”, Item (6) “If I do not know what wine it is, I won’t try it”, Item (7) “I do not trust new wines”, and Item (8) “I am constantly trying new and different wines”. Items 1, 2, 4, 5, and 8 were reverse keyed. Participants were randomly assigned to one of three conditions: a 5-point Likert scale condition (N = 426; 1 = “strongly disagree”; 2 = “disagree”; 3 = “neither agree nor disagree”; 4 = “agree”; 5 = “strongly agree”), a 7-point Likert scale condition (N = 419; 1 = “strongly disagree”; 2 = “disagree”; 3 = “somewhat disagree”; 4 = “neither agree nor disagree”; 5 = “somewhat agree”; 6 = “agree”; 7 = “strongly agree”), or a 9-point Likert scale condition (N = 422; 1 = “strongly disagree”; 2 = “moderately disagree”; 3= “disagree”; 4 = “somewhat disagree”; 5 = “neither agree nor disagree”; 6 = “somewhat agree”; 7 = “agree”; 8 = “moderately agree”; 9 = “strongly agree”). Scores were summed across the 8 questions (correcting for reverse-keyed items) for a total score out of 40 (5-point condition), 56 (7-point condition), or 72 (9-point condition). In all cases, higher scores were indicative of greater wine neophobia.
3. Results
3.1. Effect of Scale Version on WNS Scores
WNS scores ranged from 8 to 32 for the five-point scale (M = 18.10, SD = 4.63), 8 to 49 for the seven-point scale (M = 23.39, SD = 7.22), and 8 to 62 for the nine-point scale (M = 29.60, SD = 9.10). To determine whether the number of scale points had an effect on the overall reliability of the WNS, we calculated Cronbach’s alpha estimates separately for each of the three scale versions. Cronbach’s alpha was 0.72 for the five-point scale, 0.75 for the seven-point scale, and 0.77 for the nine-point scale. Next, we converted the WNS scores for each scale into z-scores, and conducted a one-way ANOVA analysis with scale version as the criterion to determine whether scores differed across the three scales. However, there was virtually no effect of scale version, F(2, 1264) = 0.001, p = 0.99, η2 < 0.001.
Given the similarity of performance across the three scales, and the fact that the original Ristic et al. [26] measure used a nine-point scale, we ultimately decided to transform the data from the five- and seven-point scales to a nine-point scale and use those data going forward. To transform the five-point scale data to a nine-point scale we used the following formula: 2 * x − 1, where “x” is the score on the five-point scale. Similarly, to convert the seven-point scale data to a nine-point scale we used the following formula: 1.5 ∗ x − 0.5, where “x” is the score on the seven-point scale. Overall WNS scores now ranged from 8 to 62.67 (M = 28.78, SD = 9.33), with a skewness of 0.067 and kurtosis of −0.045, indicating a normal distribution.
3.2. Reliability and Structure of the WNS
Cronbach’s alpha for the transformed scale was 0.75, increasing to 0.77 when Item 2 (“I will drink almost any wine”) was removed, indicating that the scale is reliable. These findings closely replicate those reported by both Ristic et al. [26] and Nguyen et al. [28], who reported an alpha of 0.76 and 0.71, respectively, for the WNS.
In line with Ristic et al. [26], we next conducted an exploratory factor analysis (PCA) with varimax rotation and Kaiser normalization to determine whether the eight scale items shared a common underlying construct. A two-factor solution emerged that explained 61.49% of the variance, with scale items 1, 2, 4, 5, and 8 loading on factor 1, and items 3, 6, and 7 loading on factor 2. As with Ristic et al. [26], the loadings appeared to be based on whether the scale items were positively or negatively worded. Item 2 had a particularly weak loading; thus, we repeated the analysis with this scale item removed. The resulting two-factor solution explained 68.72% of the variance, with scale items 1, 4, 5, and 8 loading on factor 1, and items 3, 6, and 7 loading on factor 2.
Finally, we conducted a series of confirmatory factor analyses to determine whether a single factor model would provide a better fit for the data as compared to a two-factor solution. A unidimensional model with scale Item 2 removed, and with correlated residuals for the positively-worded items, was the best fit for the data (see Table 2; Figure A1).
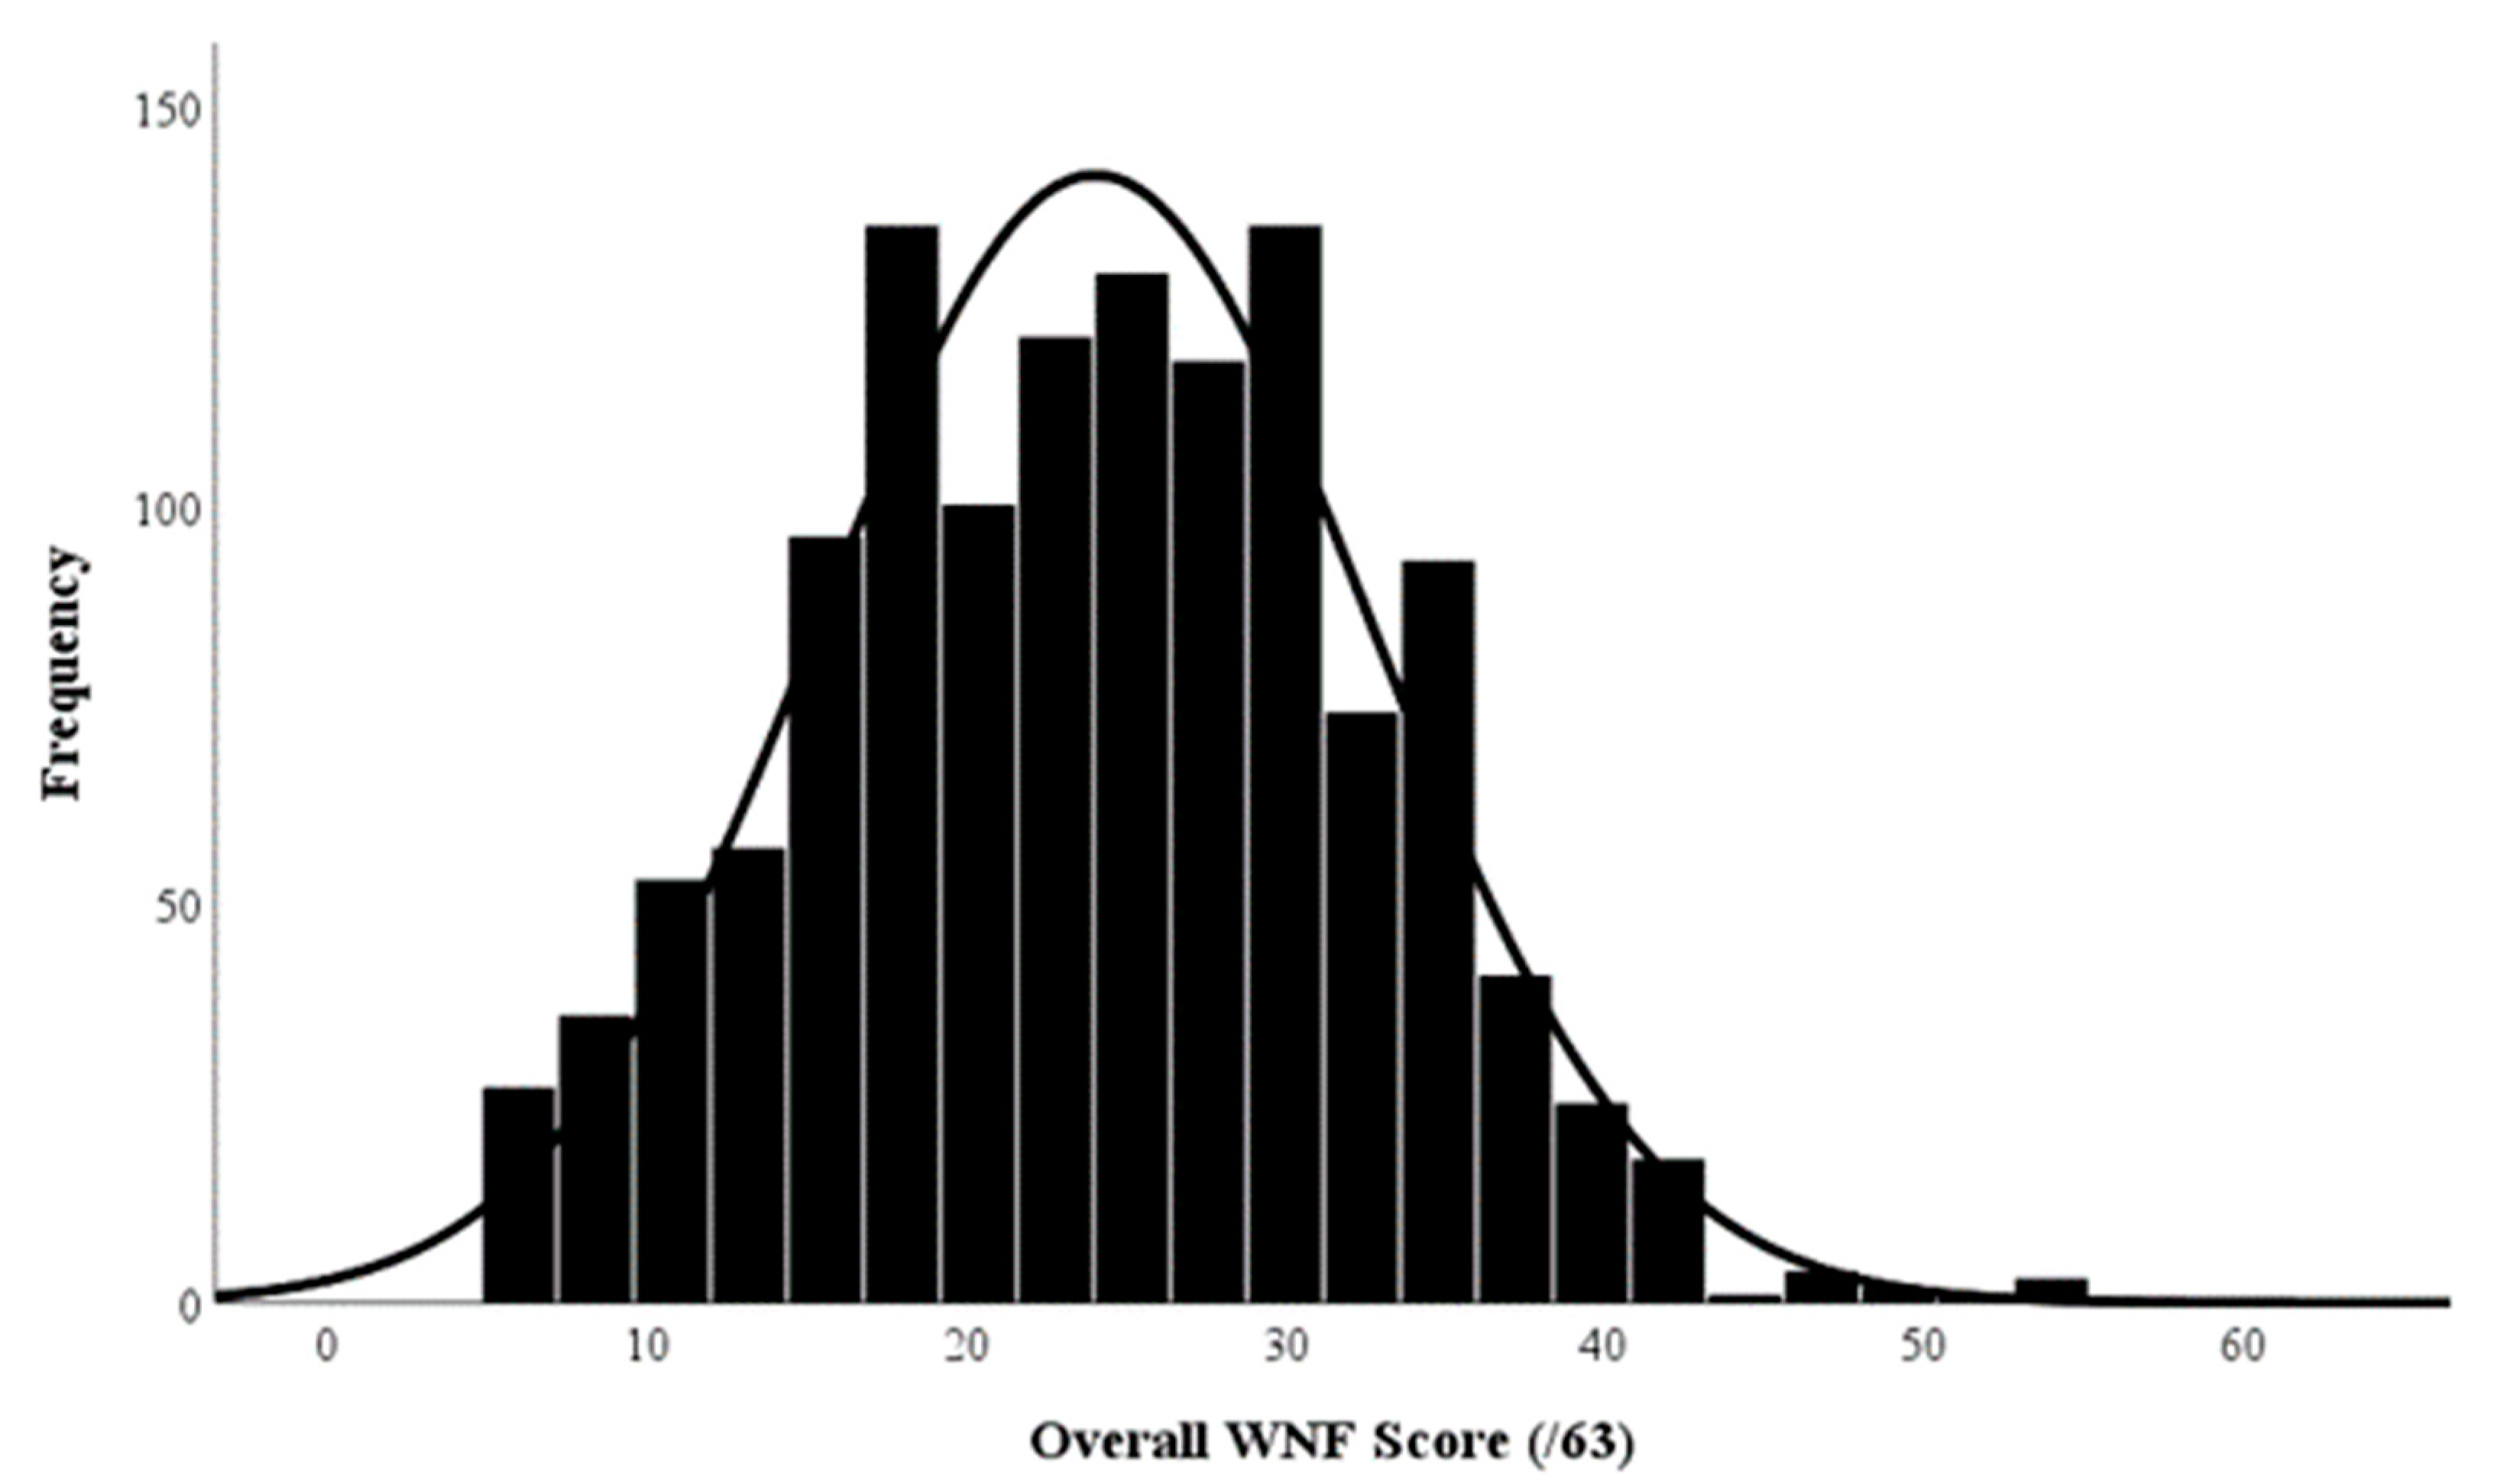
Given this body of evidence, we decided to omit Item 2 (“I will drink almost any wine”) from the overall WNS score calculation going forward (hereafter referred to as the modified Wine Neophobia Scale—mWNS). Overall mWNS scores now ranged from 7 to 53.67 (M = 24.04, SD = 8.60; see Figure A2 for distributions).
3.3. Neophiles and Neophobes
As with Ristic et al. [26], we next divided the mWNS scores into quartiles and used these cut points to classify our participants into three groups: neophiles (1st quartile; mWNS score = <18), neither (2nd and 3rd quartiles; mWNS score = 18–30.99), and neophobes (4th quartile; mWNS score = 31+). Ultimately, we identified 316 neophiles (MmWNS = 12.98, SDmWNS = 3.31), 627 individuals who were classified as “neither” (MmWNS = 23.94, SDmWNS = 3.46), and 326 neophobes (MmWNS = 34.95, SDmWNS = 4.06).
3.3.1. Demographics
Next, we conducted a series of chi-square analyses to examine whether neophiles and neophobes differed with respect to their demographics. To facilitate this process, we first used median splits to create binary variables for age (younger = 19–54; older = 55+), income (low = CAD 0–85 k; high = CAD 86 k+), and education (no university vs. university degree).
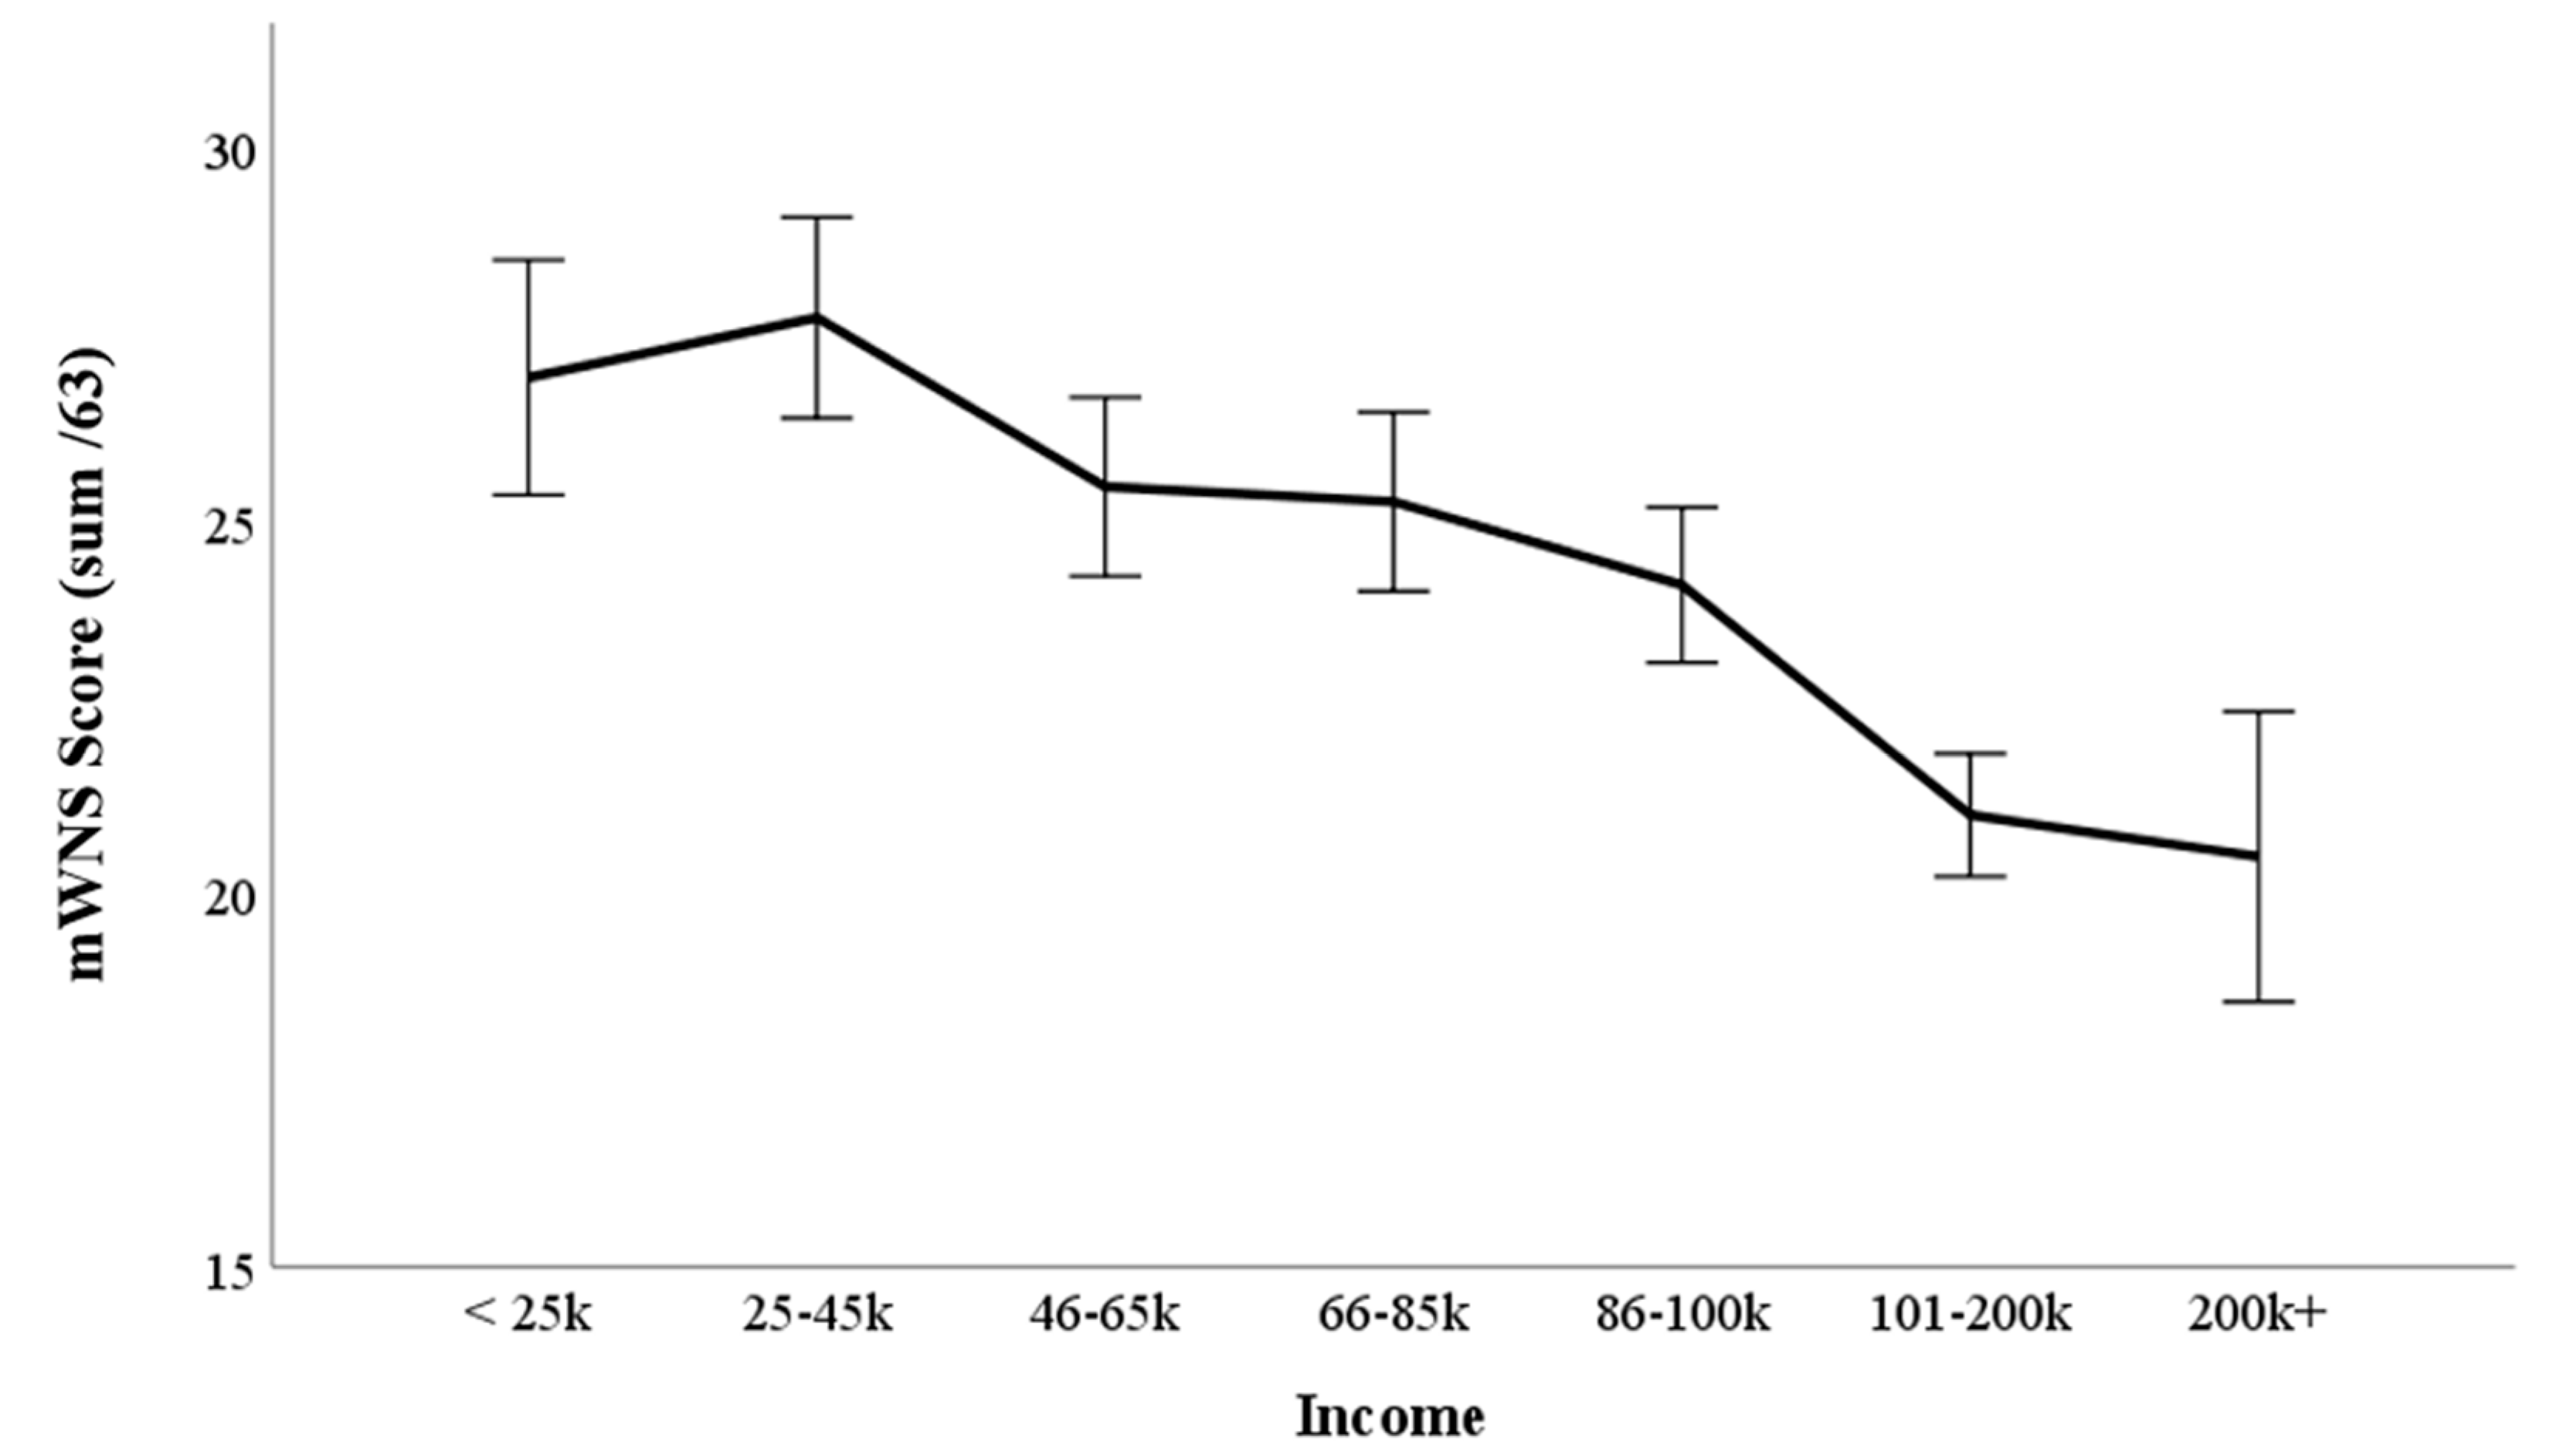
Neophiles and neophobes did not differ with respect to gender, χ2(1, N = 638) = 2.03, p = 0.16, or age, χ2(1, N = 589) = 0.02, p = 0.89. However, the two groups did differ with respect to income, χ2(1, N = 640) = 20.98, p <0.001, such that a greater proportion of low-income individuals were classified as neophobes and high-income individuals as neophiles. Interestingly, when we examined the relationship between all income categories and mWNS scores on a continuum using one-way ANOVA, there was a linear relationship between mWNS scores and income, F(61264) = 4.98, p < 0.001, η2 = 0.02, such that the “$101,000–$200,000” participants had lower neophobia scores than all other income groups, with the exception of the “$200 k+” group (see Figure 1).
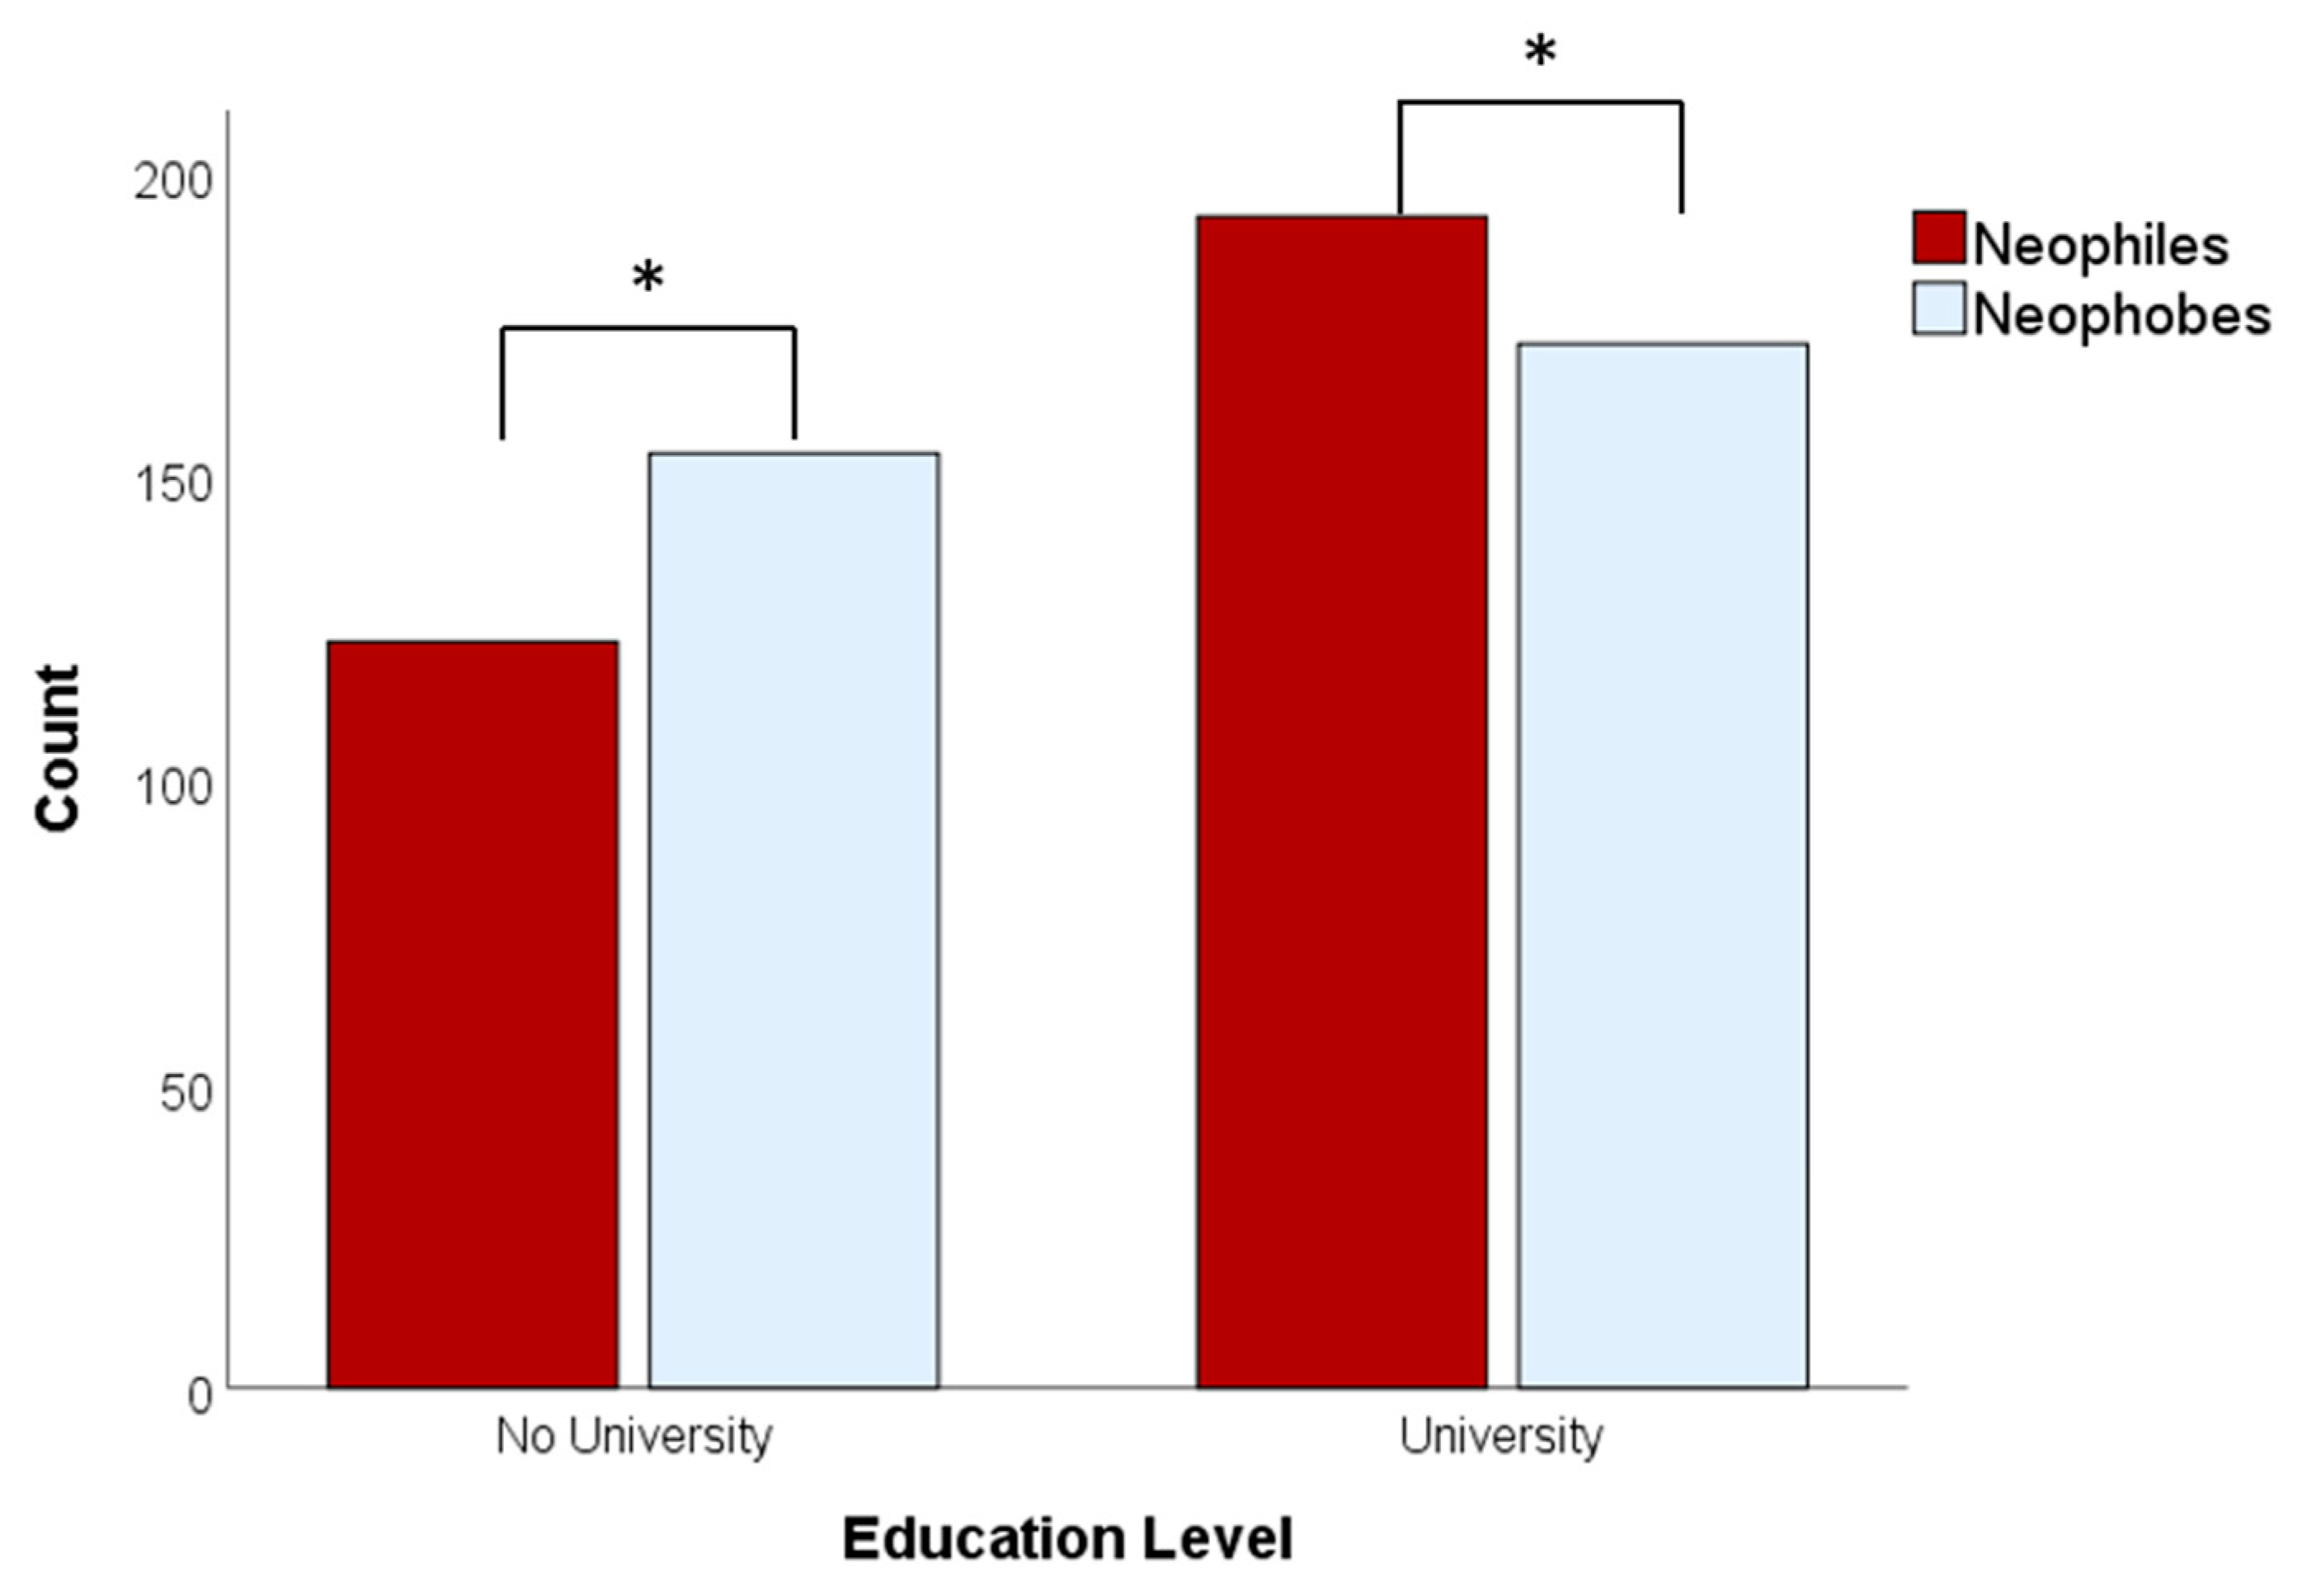
Neophiles and neophobes also differed with respect to amount of education, χ2(1, N = 642) = 4.52, p = 0.03, such that a larger proportion of university-educated participants were classified as neophiles, whereas a larger proportion of non-university-educated participants were classified as neophobes (see Figure 2). Overall, with the exception of the lack of finding with age, these results are fully congruent with those reported by Ristic et al. [26], who demonstrated that wine neophobes tend to be older, less educated, and with lower household incomes.
3.3.2. Wine Consumption and Purchasing Behaviors
Annual intake frequency (# days/year participants drink wine) ranged from 0 to 365 (M = 114.60, SD = 99.68), and annual wine intake (# of standard drinks consumed per year) ranged from 0 to 3840 units (M = 285.72, SD = 381.81). An independent samples t-test showed that neophiles and neophobes significantly differed with respect to their annual intake frequency, t(640) = 5.179, p < 0.001, d = 0.41, such that neophiles consumed wine more frequently (M = 136.56, SD = 103.15) than did neophobes (M = 95.52, SD = 97.59). However, neophiles (M = 334.05, SD = 398.46) and neophobes (M = 273.90, SD = 447.78) did not statistically differ with respect to annual wine intake, t(640) = 1.796, p = 0.07, d = 0.14. Neophiles (M = 2.33, SD = 1.38) and neophobes (M = 2.56, SD = 2.01) also did not differ with respect to the number of standard glasses of wine consumed in a single session, t(640) = −1.66, p = 0.10, d = 0.13.
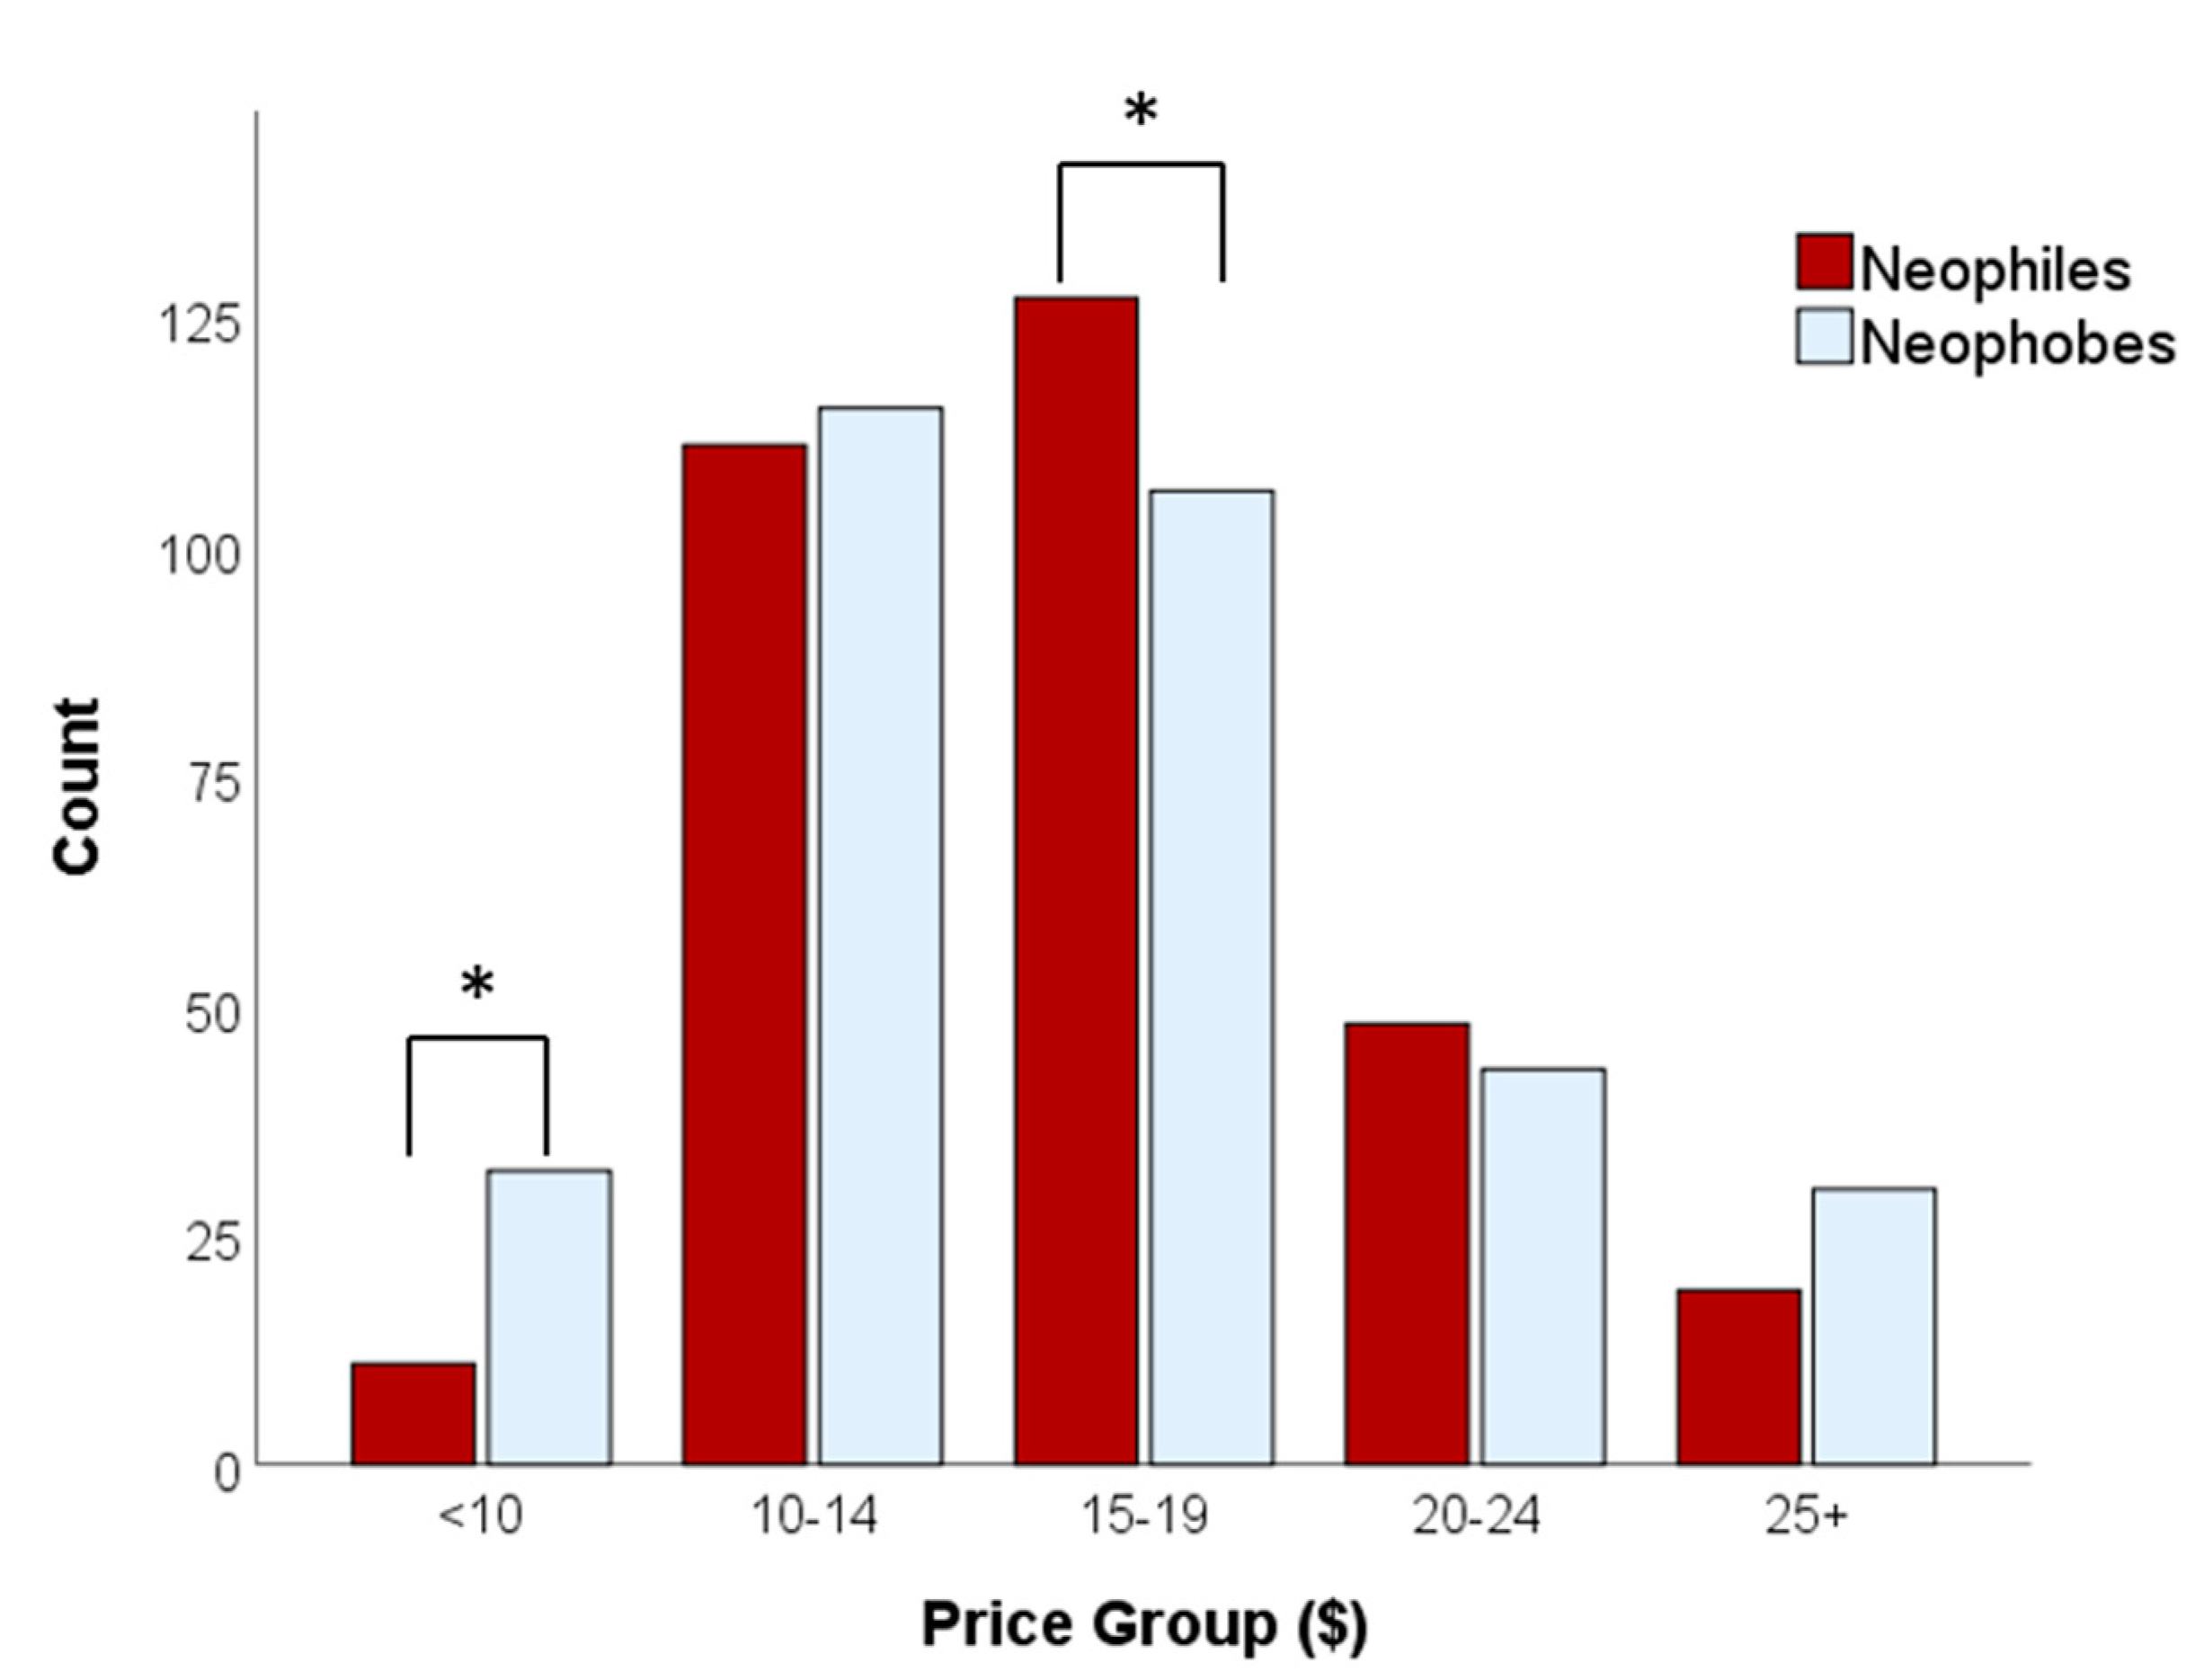
Next, we examined whether neophiles and neophobes differed with respect to the average amount paid per 750 mL bottle of wine. The mean price paid per bottle was CAD 16.55 (SD = 5.61), with 87 participants reporting that they typically pay less than CAD 10 per bottle, 476 paying CAD 10–14.99 per bottle, 458 paying CAD 15–19.99 per bottle, 177 paying CAD 20–24.99 per bottle, and 70 paying CAD 25 or more per bottle. A chi-square analysis with Bonferroni-corrected pairwise z-tests showed that neophiles and neophobes differed with respect to average price paid per bottle, χ2(4, N = 642) = 14.81, p = 0.005, such that there were significantly more neophobes in the “<$10” group, and significantly more neophiles in the “$15–$19.99” group (see Figure 3).
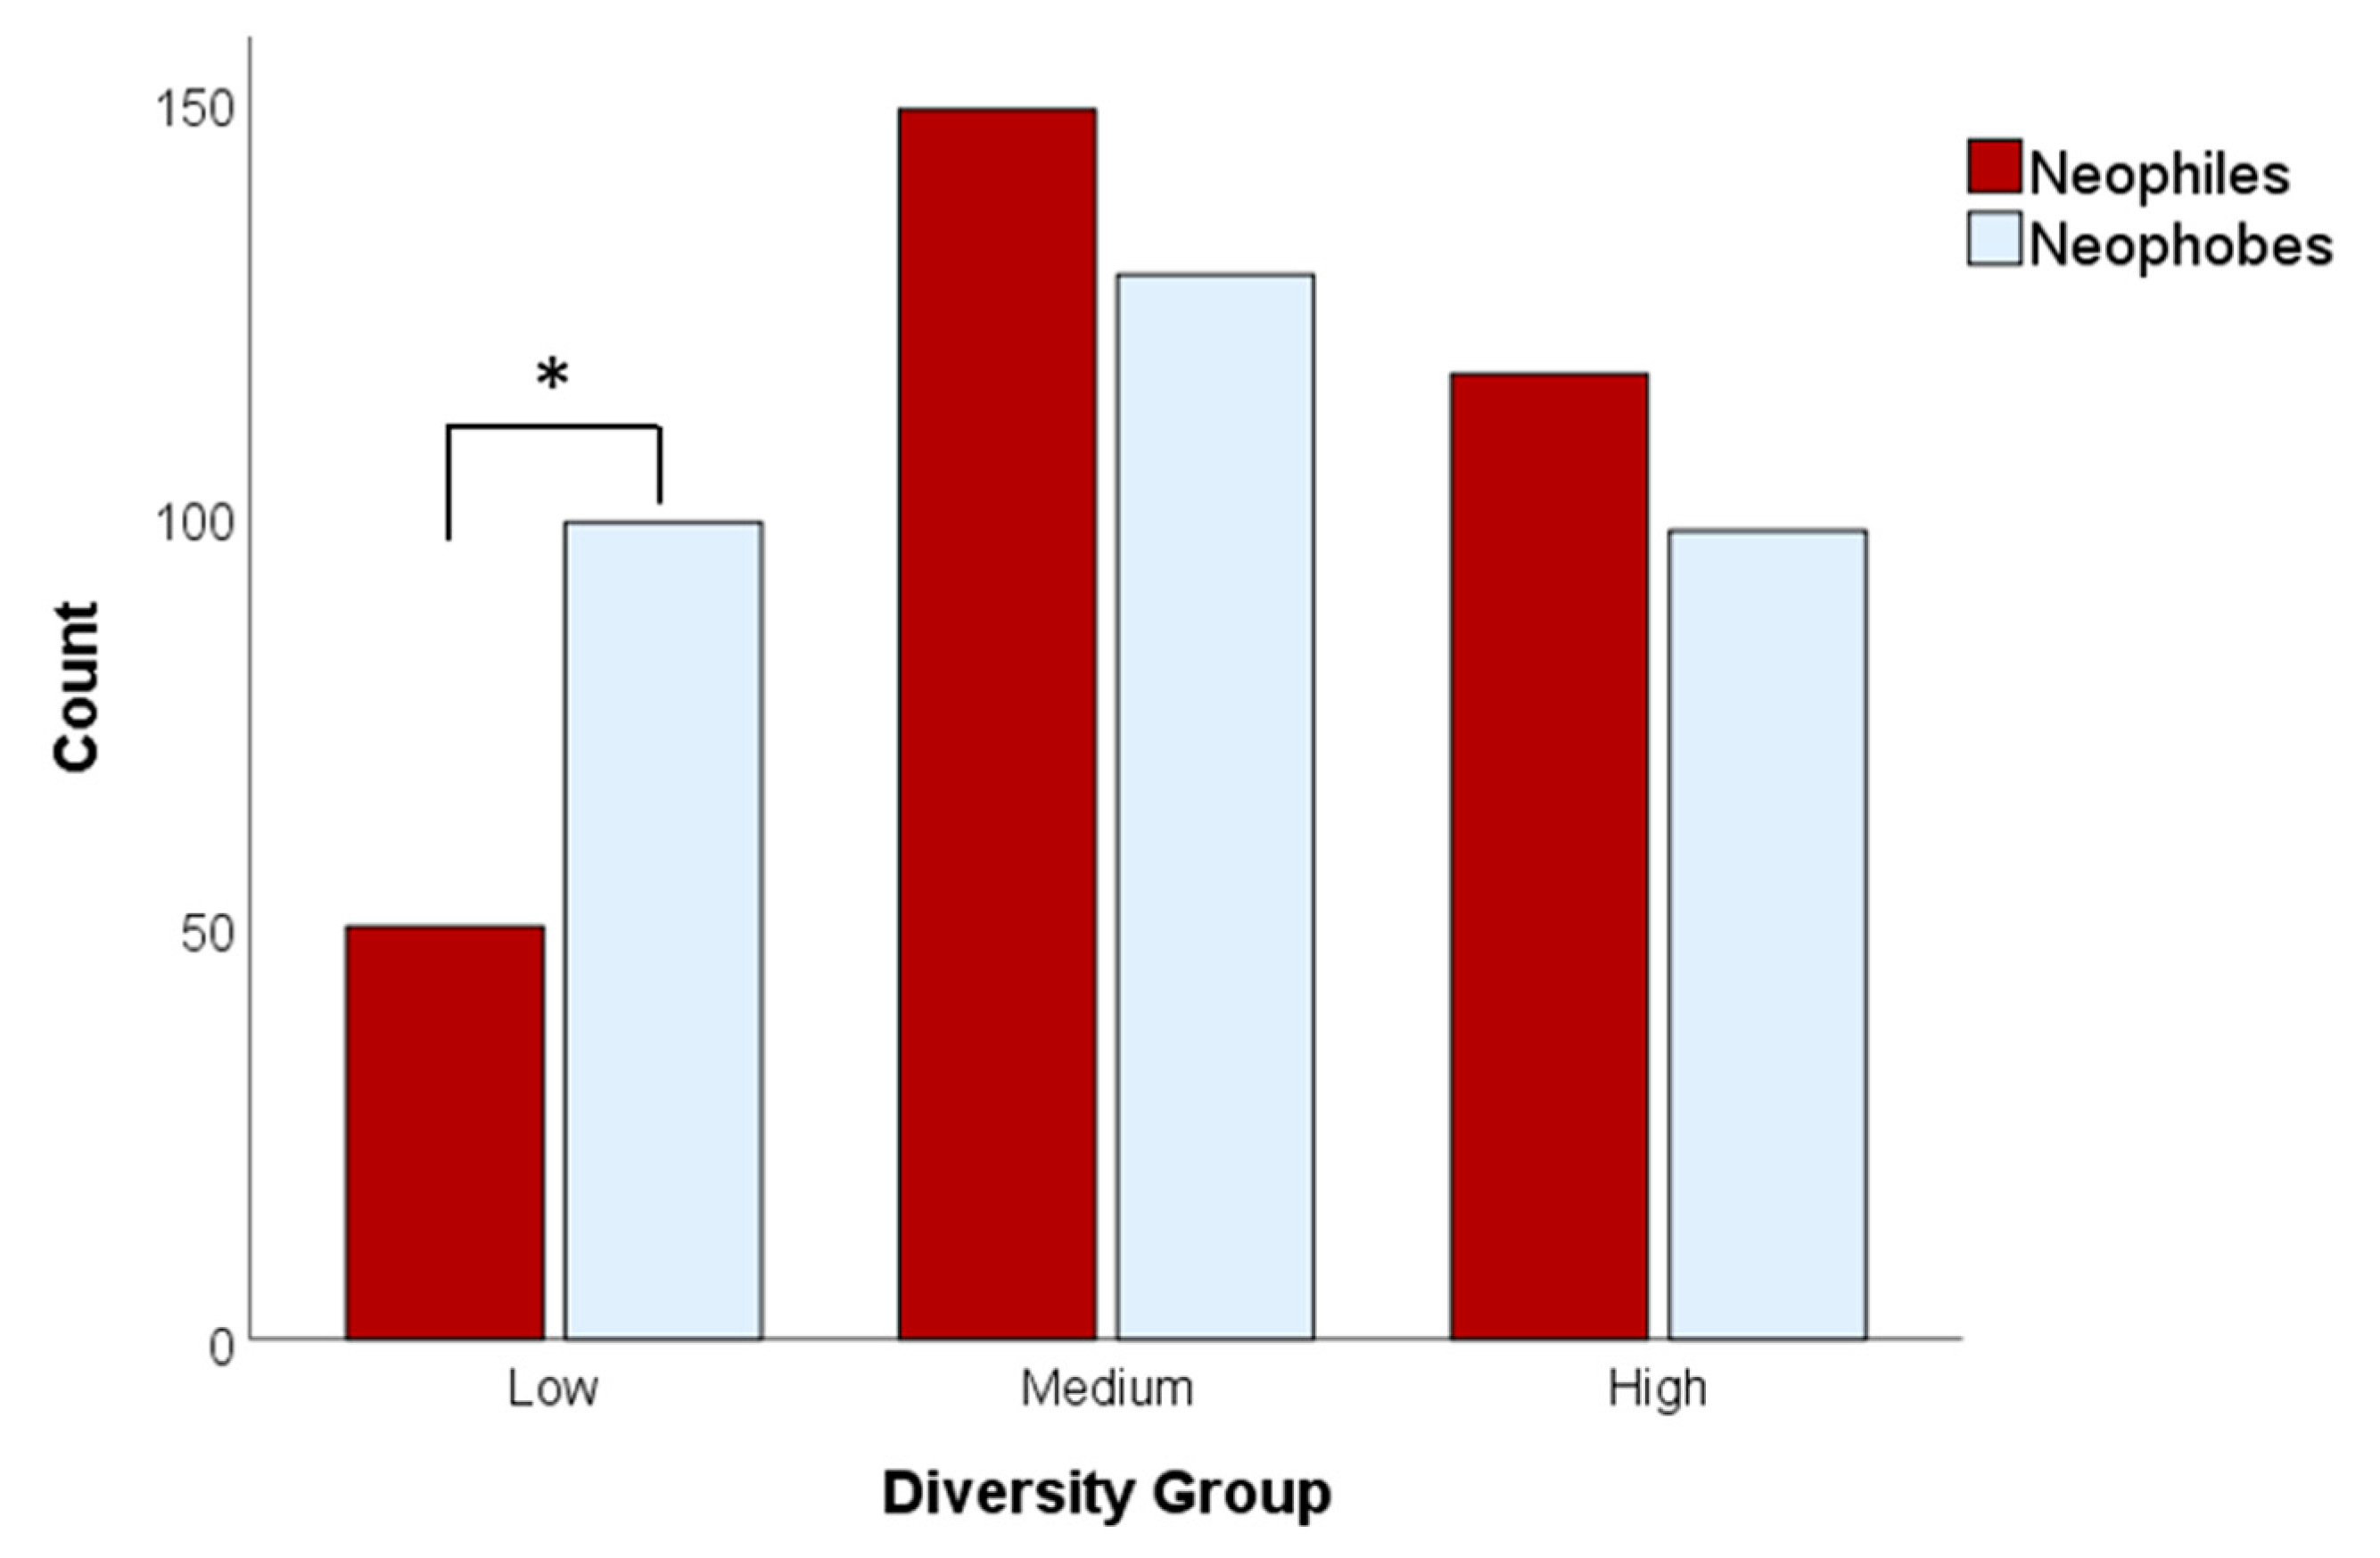
Finally, we examined the relationship between consumption diversity (i.e., diversity of wine-type selection) and neophilia/neophobia. Diversity scores ranged from 0 (no wine) to 8 (all categories of wine), with a mean of 4.32 (SD = 2.13) different types of wine consumed at least some of the time. To better examine the relationship between diversity and neophilia/neophobia, we divided participants into three diversity groups: low (0–2 categories; N = 306), medium (3–5 categories; N = 566), and high (6–8 categories, N = 397). Next, we conducted a chi-square analysis with Bonferroni-corrected pairwise z-tests. Neophiles and neophobes differed with respect to diversity, χ2(2, N = 642) = 19.08, p < 0.001, such that there were significantly more neophobes than neophiles in the low diversity group (see Figure 4).
3.3.3. Wine Involvement
Wine involvement scores ranged from 13 to 49 (M = 32.32, SD = 5.70), and wine knowledge scores ranged from 4 to 20 (M = 12.15, SD = 3.36). There was a very strong, positive correlation (r = 0.694) between wine involvement and wine knowledge; thus, we decided to eliminate the wine knowledge variable and use only the wine involvement scores going forward. A paired-samples t-test showed that neophiles (M = 35.50, SD = 6.07) had significantly higher wine involvement scores than did neophobes (M = 29.99, SD = 5.49), t(621) = 8.83, p = 0.003, d = 0.99.
To further explore the relationship between mWNS scores and wine involvement, we divided wine involvement scores using tertiles to create three wine involvement groups: low (N = 363; involvement score: >29), medium (N = 507; involvement score: 30–35), and high (N = 367; involvement score: 36+). Next, we conducted a series of 2 (neophilia/neophobia) × 2 (low, medium, high involvement) factorial ANOVAs with Scheffe post hoc analyses to determine whether the relationships between wine neophilia/neophobia and annual intake frequency, annual wine intake, price paid per bottle, and consumption diversity were influenced by the level of wine involvement (i.e., the interaction between neophilia/neophobia and wine involvement).
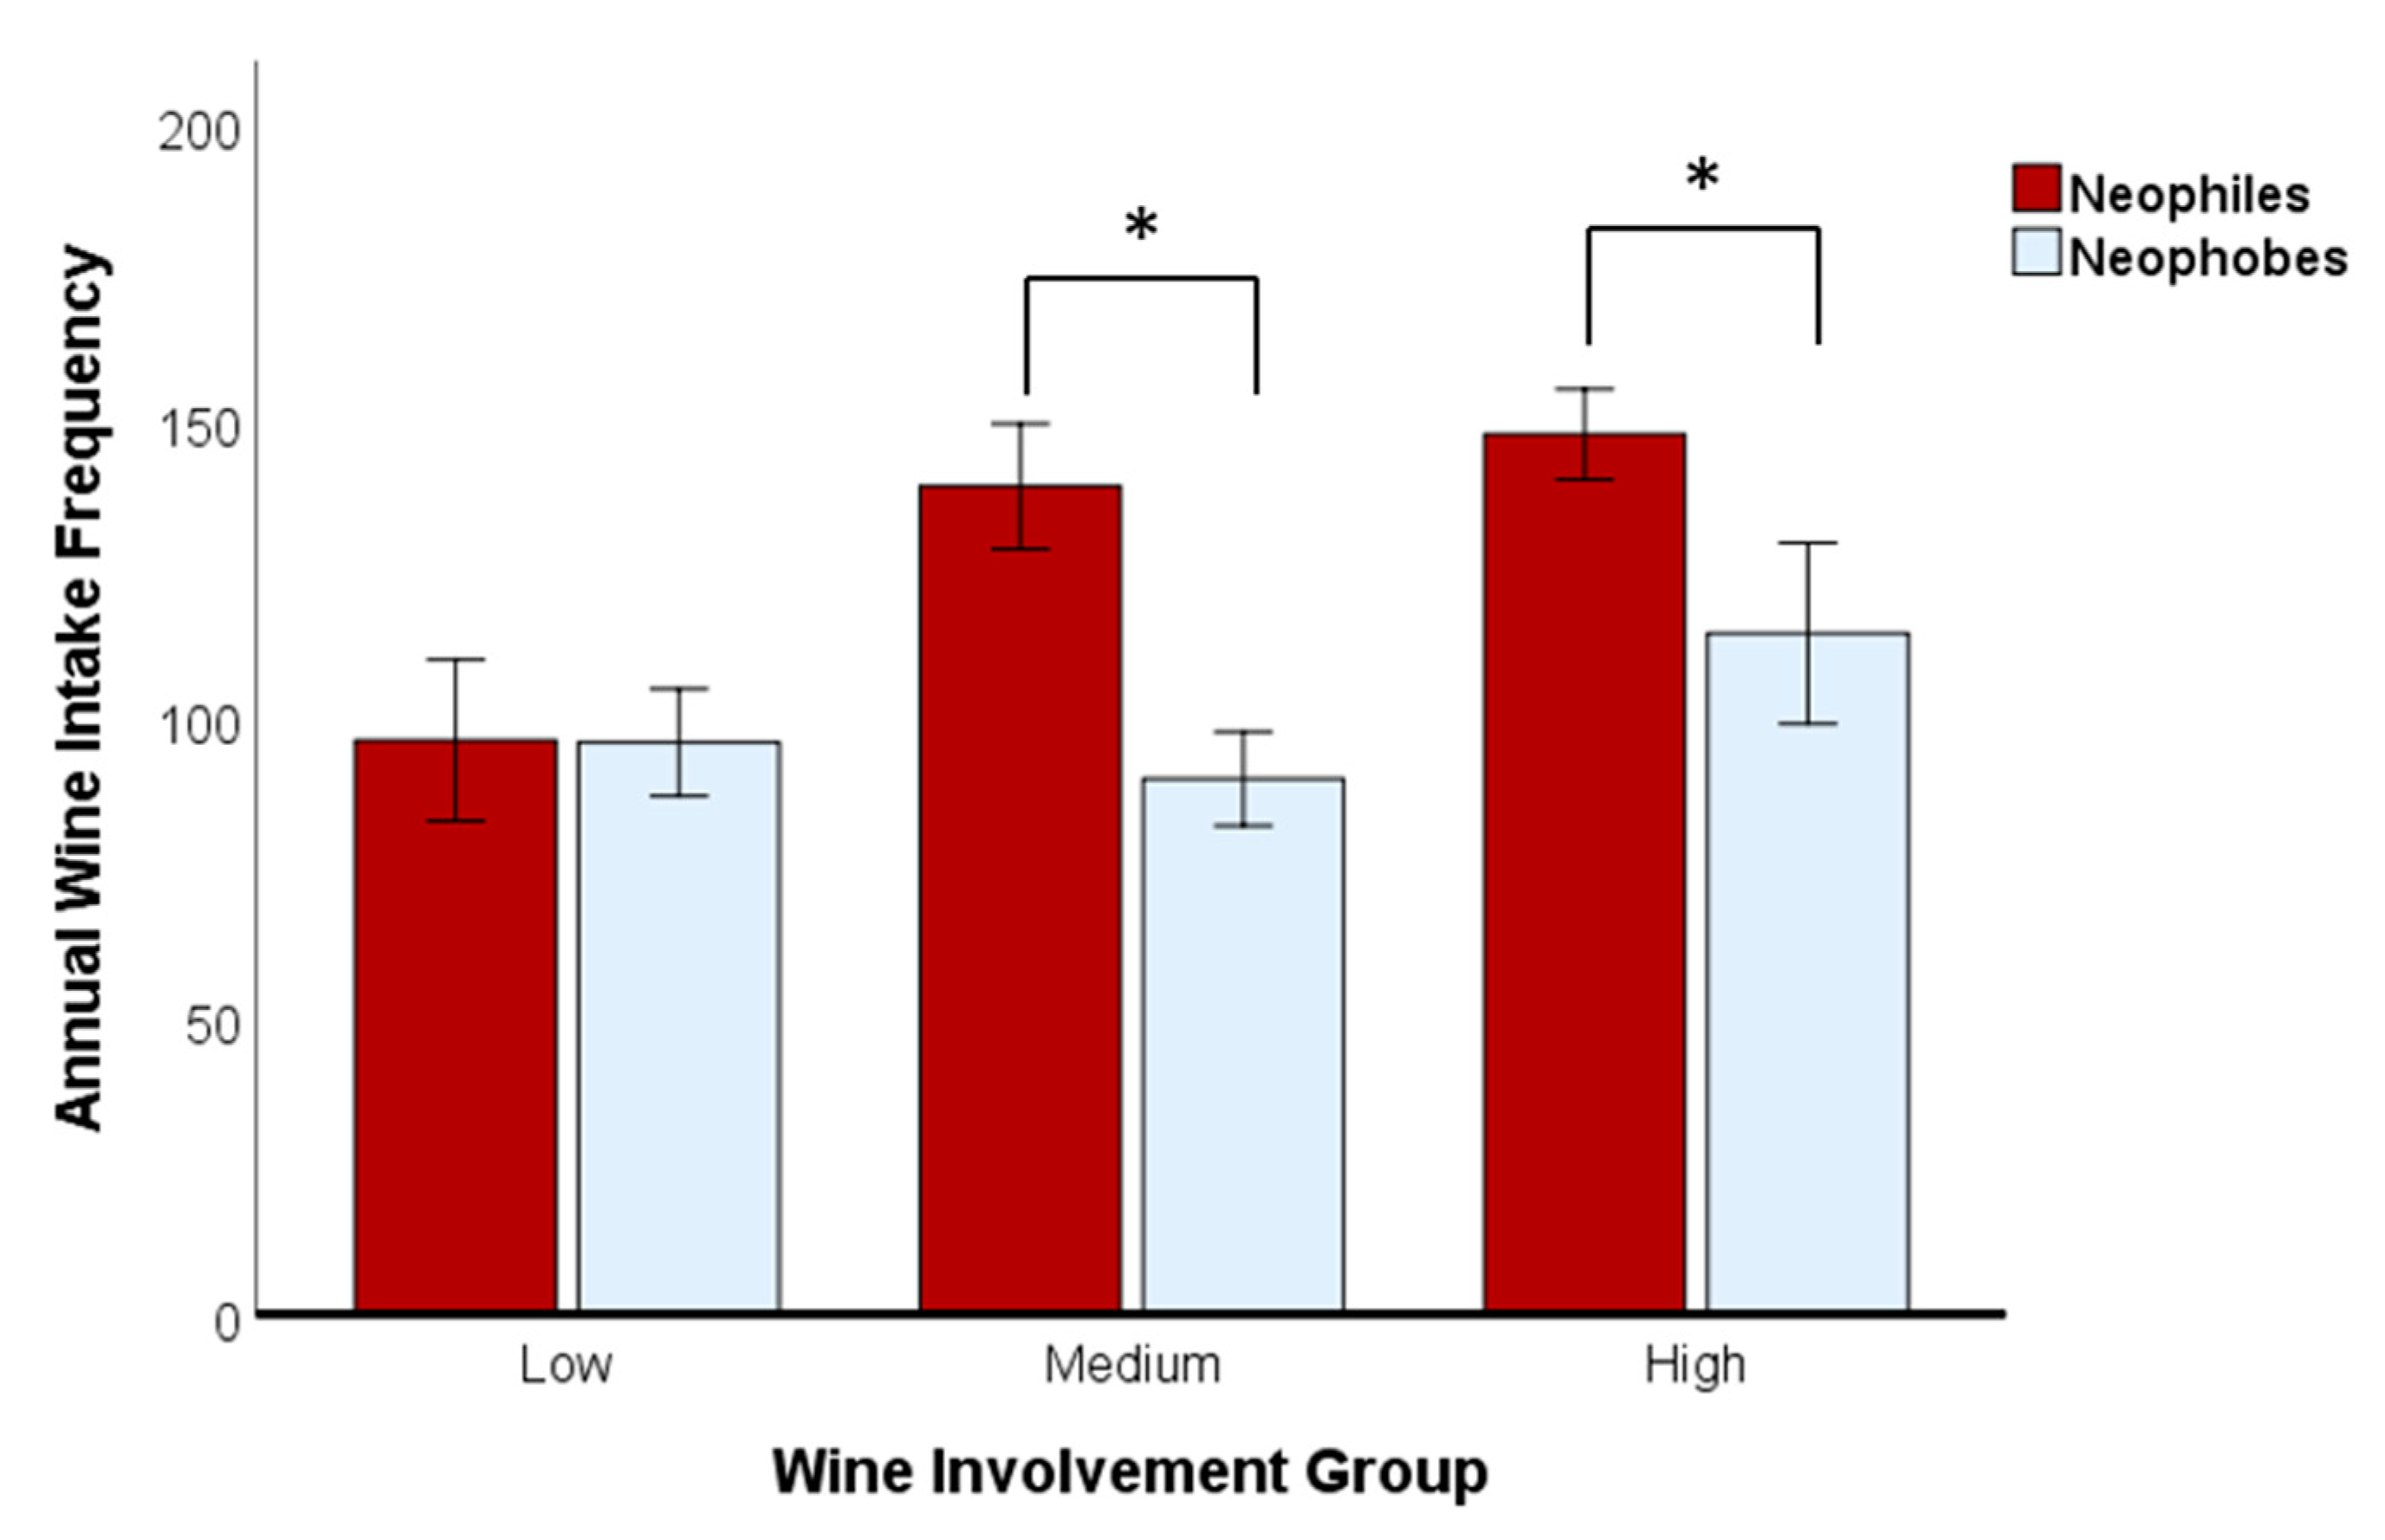
For annual intake frequency, there was a main effect of neophilia/neophobia, F(1, 642) = 9.45, p = 0.002, ηp2 = 0.02, such that neophiles drank wine more frequently than did neophobes. There was also a main effect of wine involvement, F(2, 642) = 4.41, p = 0.013, ηp2 = 0.01, such that individuals with greater wine involvement also tended to drink wine more frequently. Of particular interest, the interaction between neophilia/neophobia and wine involvement approached significance, F(2, 642) = 2.73, p = 0.06, ηp2 = 0.01. A follow-up simple effects analysis showed that neophiles and neophobes did not differ with respect to their intake frequency for the low wine involvement group, t(175) = 0.021, p = 0.98, d = < 0.01. However, neophiles drank wine more frequently than did neophobes for both the medium, t(248) = 3.74, p < 0.001, d = 0.50, and the high, t(213) = 2.09, p = 0.04, d = 0.34, involvement groups (see Figure 5).
For both annual wine intake, F(2, 642) = 2.73, p = 0.06, ηp2 = 0.01, and wine consumption diversity, F(2, 642) = 16.35, p < 0.001, ηp2 = 0.05, there was a main effect of wine involvement, such that the high involvement individuals consumed more, and more diverse, wine than the low involvement individuals. However, there was no main effect of neophilia/neophobia, nor an interaction (all F’s < 1.6, all p’s > 0.20).
Lastly, there was a main effect of neophilia/neophobia for average price paid per 750 mL bottle of wine, F(1, 642) = 6.87, p = 0.009, ηp2 = 0.01, such that neophiles paid more per bottle of wine, on average, as compared to neophobes. Additionally, there was a main effect of wine involvement, F(2, 642) = 18.17, p < 0.001, ηp2 = 0.05, such that the individuals in the low wine involvement group paid less per bottle as compared to the medium and high involvement groups. However, the interaction was not significant, F(2, 642) = 0.51, p = 0.60, ηp2 = 0.002.3.1.
4. Discussion
Wine consumers’ willingness or reluctance to try new products are important considerations that inform wine style innovation and consumer segmentation in an increasingly competitive global wine market. In this study, we sought to validate and optimize the Wine Neophobia Scale (WNS) developed by Ristic et al. [26] in a large Canadian sample and further examine how wine neophobia was associated with demographic and behavioral characteristics relevant to wine purchase and intake.
Effect of Likert Scale on WNS.
Our first goal was to assess whether different versions of the WNS affected its precision and reliability. The existing WNS uses a nine-point Likert scale, whereas the Food Neophobia Scale (FNS) from which it was adapted uses a seven-point Likert scale. Although there are numerous benefits to providing participants with a larger number of response alternatives, this can also lead to significant drawbacks, such as a reduction in the proportion of the scale that is actually used and an increase in response time [31]. As such, we administered a five-, seven-, or nine-point Likert scale to our participants. Overall, there was no effect of number of response alternatives, such that standardized (z) scores did not differ as a function of scale version. In addition, all three scale versions were reasonably reliable. Therefore, future researchers should feel comfortable using the number of response alternatives that meet their specific research needs (e.g., greater specificity, reduced response time, etc.).
4.1. Replicating Ristic et al. 2016
Our second goal was to examine whether we could replicate the findings of Ristic et al. [26] using a large, online sample of Canadian wine consumers. Although the reliability of the WNS with our sample approximated that reported by both Ristic et al. [26] and Nguyen et al. [28], and our modelling yielded similar results to Ristic (i.e., unidimensional solution from a confirmatory factor analysis), scale Item 2 (“I will drink almost any wine”) was ultimately omitted from the aggregate WNS score calculation given its negative effect on the reliability of the total scale, poor factor loadings, and because the best-fitting model of the data was that which excluded Item 2.
As with the other WNS items, Item 2 was adapted from the FNS and was originally phrased as “I will eat almost anything” [3]. Across several studies on food neophobia, this particular questionnaire item has a tendency to behave differently as compared to the other items. For instance, Pliner and Hobden [3] found that it had the lowest item-whole correlation of all the items in the FNS, and numerous studies have shown weak loadings for it after factor analysis [12,15,35,36]. Indeed, a large-scale, multinational validation study of the FNS concluded that this particular item should be dropped from the scale entirely due to its poor fit with the other scale items [36]. It thus appears that this particular scale item, be it for food or wine, may capture something different than the others. Whereas most of the other scale items (with, perhaps, the exception of “I like wines from different countries”) seem to measure the tendency to be adventurous and try new things, Item 2 may instead represent a lack of discrimination regarding wine choices and, thus, does not necessarily capture neophobia. For example, a wine drinker who is unafraid to try new and different wines (i.e., a neophile) may also be discerning about the wines they choose and, thus, would not just drink any beverage that is classified as “wine”. Indeed, an experienced wine consumer might have established preferences for different wine styles and varietals based on past tasting experiences (e.g., likes Chardonnay and Bordeaux blends but dislikes fortified wine) and, despite being a neophile, might answer this question negatively. Our suggestion is to reevaluate the inclusion of this question going forward or perhaps change the wording from “I will drink almost any wine” to “I will try almost any wine”.
4.2. Characteristics of Neophobes and Neophiles
In addition to replicating the work of Ristic et al. [26], we were also interested in extending it in order to gain a better understanding of the characteristics of wine neophiles and neophobes. Such characterization can aid with market segmentation, as well as inform the recruitment of consumers for various stages of the product development process, including concept and prototype evaluation. For instance, Pickering and Hayes [37] segmented consumers into three clusters based on their liking scores for a range of wine styles and showed that differences in wine adventurousness were an important feature in defining each cluster.
4.2.1. Demographics
As with previous studies using the WNS [26,27,28], we found no relationship between wine neophobia and gender. However, unlike Ristic and colleagues who reported that wine neophobia increased as a function of age, we found no relationship between age and neophobia. Nguyen et al. [28] were also unable to find a relationship between neophilia/phobia and age. Although studies on food neophobia have shown an age effect, whereby adults over age 55 tend to be more neophobic [9,12], other studies have shown either a weak relationship between age and neophobia [13] or the opposite relationship, whereby older adults are less neophobic [12,38]. As such, the relationships between age in adults and wine neophobia require more detailed exploration, perhaps with the use of a longitudinal methodology.
Neophiles and neophobes differed with respect to both household income (neophiles reported a higher household income) and education (more neophiles were university educated than were neophobes). This finding is consistent not only with Ristic et al. [26] but also with a host of other studies that have shown a negative relationship between (food) neophobia and both income and education [10,12,13,36]. One explanation for these findings, as noted by Ristic et al. [26], may be that individuals who have lower incomes and less education may in turn have less exposure and access to novel wines. For example, an individual with a limited income may be uncomfortable spending money on an unfamiliar item that they are not sure they will enjoy and, thus, may tend to stick to a wine brand or style that is “tried and true”. Although there is certainly a genetic component to neophobia [14,39], there is also evidence that neophobia can be reduced via simple exposure [40], particularly in younger individuals [41]. As such, one area for future research with potential benefit to wine retailers and marketers is to determine whether varying levels of exposure to novel wines (e.g., through wine tastings) may reduce wine neophobia.
4.2.2. Wine Involvement
We assessed wine involvement using a shortened (10-item) version of the 24-item scale reported in Bruwer and Huang [33]. The adapted version still retains items from each of the five wine involvement dimensions of the original scale—interest, behavior, ritual, pleasure, and risk. As expected, there was a strong relationship between degree of wine involvement (e.g., attends tastings, uses specialist wine glasses, etc.) and neophobia, such that neophiles had a greater degree of wine involvement than neophobes. Given the strong relationship between involvement and neophobia, this raises the question of whether neophobic tendencies can be altered by encouraging greater involvement in wine. For example, if individuals had greater access to educational wine courses and tastings, interest, pleasure, and confidence may be heightened, and they may become less neophobic over time. Similarly, increasing involvement may also lead to higher wine competence and expertise, with wine expertise also shown to predict willingness to try new wines [25]. A limitation of our study is that both the original 24-item wine involvement scale and the 10-item version we used do not consider the importance of social networks, such as Instagram, Facebook, and Pinterest, nor social influencers to many wine consumers in the 2020s, especially younger cohorts (e.g., [42,43,44,45]). This could be addressed in future research on wine involvement with, for instance, the item “I often read magazines and publications about wine” replaced or supplemented with “I follow social network accounts or pages about wine”.
4.2.3. Wine Intake
Annual wine intake frequency (i.e., the number of days per year on which wine is consumed) was strongly related to neophobia, such that neophiles drank wine much more frequently than did neophobes. However, the number of standard drinks consumed per year was not associated with neophobia. That is, neophiles drink more frequently than neophobes but do not necessarily consume more alcohol than neophobes. Interestingly, there was an interaction between neophilia/neophobia and wine involvement for annual wine intake frequency, such that neophiles who indicated that they were moderately or highly involved with wine reported a higher frequency of wine intake than did moderately and highly involved neophobes. However, at low levels of involvement, the two groups did not differ. This finding is particularly important because it highlights that both neophilia/neophobia and wine involvement influence the frequency of wine intake. Specifically, the degree of wine involvement does not necessarily appear to affect wine intake frequency for neophobes but has a positive relationship with intake frequency for neophiles. More research is needed to better understand these findings, including an exploration of how other personality factors are associated with wine neophobia/philia and involvement. For instance, sensation seeking has previously been reported as negatively associated with food neophobia [16]. Perhaps wine neophiles are similarly sensation seekers, who seek out varied flavors of wine as a means of increasing sensation and pleasure. As such, it follows that they would sample a wider range of wines, and sample more frequently, than their neophobic counterparts.
4.2.4. Price per Bottle
With respect to average price paid per standard 750 mL bottle of wine, there were significantly more neophobes than neophiles in the “less than $10” category. This may suggest that neophobes are likely to pay less per bottle of wine as compared to neophiles, although this remains to be fully elucidated for wines priced at CAD 25+. Indeed, at a higher price category (CAD 15–19), there were significantly more neophiles than neophobes. This pattern of results held when we examined whether neophilia/neophobia and wine involvement interacted to explain price paid per bottle. Both neophilia/neophobia and wine involvement were associated with price paid, such that neophobes, and individuals with low involvement, paid less per standard bottle of wine. This finding, coupled with the relationship between neophobia and income reported above, may support the idea that neophobes are less likely to spend limited resources on novel products. Interestingly, this finding contradicts that of Castellini and Samoggia [27], who found no difference in price per bottle between neophobes and neophiles. However, their study specifically targeted Italian millennials. Millennials reportedly have different spending habits than other age cohorts and have a tendency to spend more for products [46]; thus, the relationship between wine neophobia and price per bottle may not have been evident with this age-restricted sample. Equally, the discrepancy may reflect cultural differences between Italians and Canadians. For instance, Italy has a rich wine history, and it is an integral part of daily Italian culture, much less so in Canada.
4.2.5. Wine Diversity
Finally, there was a complex relationship between diversity of wine choice and neophobia, such that there were significantly more neophobes than neophiles in the “low diversity” group (i.e., individuals who drink no more than two types of wine (e.g., red, white, or sparkling) at least some of the time), but no difference between neophobes and neophiles in the “medium” (three to five types of wine, at least some of the time) or “high” (six to eight types of wine, at least some of the time) diversity groups. Interestingly, when we later examined how both neophilia/neophobia and wine involvement related to diversity, there was no longer a main effect of neophilia/neophobia and no interaction between neophilia/neophobia and wine involvement. This indicates that the relationship between diversity and neophobia may in fact simply be due to the degree of wine involvement. That is, individuals who have low wine involvement also have lower diversity scores than those with high involvement in wine, regardless of whether they are neophobes or neophiles. As such, wine involvement, and not neophobia, is the critical factor that explains diversity in wine selections. Further research is needed to examine whether this pattern of results is limited to the broad category of wine styles. For instance, we would expect that within a wine style (e.g., red wine), the diversity of stylistic variants and brands sampled would be greater for wine neophiles.
4.3. Conclusions
An understanding of how personality factors affect preferences for, and intake of, wine is sparse in the literature, with wine neophobia especially poorly described despite the well-recognized importance of food neophobia in affecting general food behavior. Ristic et al. [26] have recently developed a tool for addressing this gap—the Wine Neophobia Scale (WNS). As such, the current study makes several important contributions. First, we established that the WNS is reliable when using anywhere between five and nine Likert point options, thereby providing more flexibility to future users of this scale. Second, we extended the findings of Ristic et al. [26] by validating the WNS with a large sample of Canadian wine drinkers, and recommend a modified seven-item version (mWNS) as an improvement on the original with respect to reliability and structure. In addition to showing that wine neophiles and neophobes differ with respect to income and education, we also report for the first time that these differences extend to wine intake frequency, price paid per bottle, and wine involvement. Finally, we show the importance of capturing wine involvement in future studies on wine neophobia, given its importance in explaining or mediating some behavioral measures. To the extent that wine neophobia is flexible, our findings provide some guidance for wine retailers and marketers. For instance, potential strategies for reducing neophobia—such as wine education programs and tastings—may increase knowledge, confidence, and exposure and reduce purchase risk. This, in turn, may serve to move neophobic consumers toward a more neophilic disposition, which we found is associated with higher price paid per bottle.
Author Contributions
Conceptualization, G.J.P. and B.K.; methodology, G.J.P. and B.K.; formal analysis, G.D. and G.J.P.; investigation, G.J.P.; resources, G.J.P.; data curation, G.J.P.; writing—original draft preparation, G.D. and G.J.P. writing— G.D., G.J.P., and B.K.; supervision, G.J.P.; project administration, G.J.P.; funding acquisition, G.J.P. and B.K. All authors have read and agreed to the published version of the manuscript.
Funding
This research was funded by the Ontario Grape and Wine Research Inc. (grant # 002100 to G.J.P. and B.K.), the Natural Sciences and Engineering Research Council of Canada (grant # DDG-2020-00012 to G.J.P.), and the Social Sciences and Humanities Research Council of Canada (grant to G.J.P.).
Institutional Review Board Statement
The study was conducted according to the guidelines of the Declaration of Helsinki and the Tri-Council, and approved by the Human Research Ethics Board of Brock University (File #19-130 PICKERING; Feb 3rd, 2020).
Informed Consent Statement
Informed consent was obtained from all subjects involved in the study.
Data Availability Statement
The data presented in this study are available on request from the corresponding author.
Acknowledgments
Shannon Ruzgys and Hannah Pickering, both of Brock University, are sincerely thanked for technical support.
Conflicts of Interest
The authors declare no conflict of interest.
Appendix A
Figure A1.
Best-fitting confirmatory factor analysis model, with standardized estimates, for the mWNS.
Figure A1.
Best-fitting confirmatory factor analysis model, with standardized estimates, for the mWNS.

Figure A2.
Distribution of the modified Wine Neophobia Scale (mWNS) scores (N = 1269).

References
- Ventura, A.K.; Worobey, J. Early Influences on the Development of Food Preferences. Curr. Biol. 2013, 23, R401–R408. [Google Scholar] [CrossRef] [Green Version]
- Harris, G. Development of taste and food preferences in children. Curr. Opin. Clin. Nutr. Metab. Care 2008, 11, 315–319. [Google Scholar] [CrossRef] [PubMed]
- Pliner, P.; Hobden, K.L. Development of a scale to measure the trait of food neophobia in humans. Appetite 1992, 19, 105–120. [Google Scholar] [CrossRef]
- Pliner, P. Development of Measures of Food Neophobia in Children. Appetite 1994, 23, 147–163. [Google Scholar] [CrossRef] [PubMed]
- Birch, L.L.; Marlin, D.W. I don’t like it; I never tried it: Effects of exposure on two-year-old children’s food preferences. Appetite 1982, 3, 353–360. [Google Scholar] [CrossRef]
- Galloway, A.T.; Lee, Y.; Birch, L.L. Predictors and consequences of food neophobia and pickiness in young girls. J. Am. Diet. Assoc. 2003, 103, 692–698. [Google Scholar] [CrossRef] [Green Version]
- Barrena, R.; Sánchez, M. Neophobia, personal consumer values and novel food acceptance. Food Qual. Prefer. 2013, 27, 72–84. [Google Scholar] [CrossRef]
- Gresham, G.; Hafer, J.; Markowski, E. Inter-functional Market Orientation Between Marketing Departments and Technical Departments in the Management of the New Product Development Process. JBAM 2006, 8, 43–65. [Google Scholar] [CrossRef]
- Fernández-Ruiz, V.; Claret, A.; Chaya, C. Testing a Spanish-version of the Food Neophobia Scale. Food Qual. Prefer. 2013, 28, 222–225. [Google Scholar] [CrossRef]
- Hursti, U.-K.K.; Sjödén, P.-O. Food and General Neophobia and their Relationship with Self-Reported Food Choice: Familial Resemblance in Swedish Families with Children of Ages 7–17 Years. Appetite 1997, 29, 89–103. [Google Scholar] [CrossRef]
- McFarlane, T.; Pliner, P. Increasing Willingness to Taste Novel Foods: Effects of Nutrition and Taste Information. Appetite 1997, 28, 227–238. [Google Scholar] [CrossRef] [PubMed]
- Tuorila, H.; Lähteenmäki, L.; Pohjalainen, L.; Lotti, L. Food neophobia among the Finns and related responses to familiar and unfamiliar foods. Food Qual. Prefer. 2001, 12, 29–37. [Google Scholar] [CrossRef]
- Meiselman, H.; King, S.; Gillette, M. The demographics of neophobia in a large commercial US sample. Food Qual. Prefer. 2010, 21, 893–897. [Google Scholar] [CrossRef]
- Knaapila, A.; Silventoinen, K.; Broms, U.; Rose, R.J.; Perola, M.; Kaprio, J.; Tuorila, H.M. Food Neophobia in Young Adults: Genetic Architecture and Relation to Personality, Pleasantness and Use Frequency of Foods, and Body Mass Index—A Twin Study. Behav. Genet. 2010, 41, 512–521. [Google Scholar] [CrossRef]
- Nezlek, J.B.; Forestell, C.A. Food neophobia and the Five Factor Model of personality. Food Qual. Prefer. 2019, 73, 210–214. [Google Scholar] [CrossRef]
- Alley, T.R.; Potter, K.A. Handbook of Behavior, Food and Nutrition. Handb. Behav. Food Nutr. 2011. [Google Scholar] [CrossRef]
- Frank, R.A.; Van Der Klaauw, N.J. The Contribution of Chemosensory Factors to Individual Differences in Reported Food Preferences. Appetite 1994, 22, 101–123. [Google Scholar] [CrossRef]
- Pliner, P.; Melo, N. Food Neophobia in Humans: Effects of Manipulated Arousal and Individual Differences in Sensation Seeking. Physiol. Behav. 1997, 61, 331–335. [Google Scholar] [CrossRef]
- Loewen, R.; Pliner, P. The Food Situations Questionnaire: A measure of children’s willingness to try novel foods in stimulating and non-stimulating situations. Appetite 2000, 35, 239–250. [Google Scholar] [CrossRef]
- Martins, Y.; Pliner, P. Human food choices: An examination of the factors underlying acceptance/rejection of novel and familiar animal and nonanimal foods. Appetite 2005, 45, 214–224. [Google Scholar] [CrossRef]
- Carbone, A.; Demaria, F.; Henke, R. The Sophistication of International Wine Trade: A New Import Measure. Ital. Econ. J. 2021, 1–20. [Google Scholar] [CrossRef]
- Migliore, G.; Thrassou, A.; Crescimanno, M.; Schifani, G.; Galati, A. Factors affecting consumer preferences for “natural wine”. Br. Food J. 2020, 122, 2463–2479. [Google Scholar] [CrossRef]
- Pickering, G.; Jain, A.; Bezawada, R. Segmentation and drivers of wine liking and consumption in US wine consumers. Int. J. Wine Res. 2014, 6, 9–19. [Google Scholar] [CrossRef] [Green Version]
- Pickering, G.J.; Thibodeau, M.K. Self-rated aversion to specific taste qualities and the PROP phenotype associate with alcoholic beverage intake and preference. Beverages 2021, 7, 37. [Google Scholar] [CrossRef]
- Hayes, J.E.; Pickering, G.J. Wine Expertise Predicts Taste Phenotype. Am. J. Enol. Vitic. 2011, 63, 80–84. [Google Scholar] [CrossRef] [PubMed] [Green Version]
- Ristic, R.; Johnson, T.E.; Meiselman, H.L.; Hoek, A.C.; Bastian, S. Towards development of a Wine Neophobia Scale (WNS): Measuring consumer wine neophobia using an adaptation of The Food Neophobia Scale (FNS). Food Qual. Prefer. 2016, 49, 161–167. [Google Scholar] [CrossRef]
- Castellini, A.; Samoggia, A. Millennial consumers’ wine consumption and purchasing habits and attitude towards wine innovation. Wine Econ. Policy 2018, 7, 128–139. [Google Scholar] [CrossRef]
- Nguyen, A.N.; Johnson, T.E.; Jeffery, D.W.; Danner, L.; Bastian, S.E. A cross-cultural examination of Australian, Chinese and Vietnamese consumers’ attitudes towards a new Australian wine product containing Ganoderma lucidum extract. Food Res. Int. 2019, 115, 393–399. [Google Scholar] [CrossRef]
- Market Data Forecast. North American Wine Market. 2020. Available online: https://www.marketdataforecast.com/market-reports/north-america-wine-market (accessed on 27 April 2021).
- Joshi, A.; Kale, S.; Chandel, S.; Pal, D.K. Likert Scale: Explored and Explained. Br. J. Appl. Sci. Technol. 2015, 7, 396–403. [Google Scholar] [CrossRef]
- Matell, M.S.; Jacoby, J. Is There an Optimal Number of Alternatives for Likert Scale Items? Study I: Reliability and Validity. Educ. Psychol. Meas. 1971, 31, 657–674. [Google Scholar] [CrossRef]
- Simms, L.J.; Zelazny, K.; Williams, T.F.; Bernstein, L. Does the number of response options matter? Psychometric perspectives using personality questionnaire data. Psychol. Assess. 2019, 31, 557–566. [Google Scholar] [CrossRef]
- Bruwer, J.; Huang, J. Wine product involvement and consumers’ BYOB behaviour in the South Australian on-premise market. Asia Pac. J. Mark. Logist. 2012, 24, 461–481. [Google Scholar] [CrossRef]
- Vecchio, R.; Lisanti, M.T.; Caracciolo, F.; Cembalo, L.; Gambuti, A.; Moio, L.; Siani, T.; Marotta, G.; Nazzaro, C.; Piombino, P. The role of production process and information on quality expectations and perceptions of sparkling wines. J. Sci. Food Agric. 2019, 99, 124–135. [Google Scholar] [CrossRef] [PubMed] [Green Version]
- Paupério, A.; Severo, M.; Lopes, C.; Moreira, P.; Cooke, L.; Oliveira, A. Could the Food Neophobia Scale be adapted to pregnant women? A confirmatory factor analysis in a Portuguese sample. Appetite 2014, 75, 110–116. [Google Scholar] [CrossRef]
- Ritchey, P.N.; Frank, R.A.; Hursti, U.-K.; Tuorila, H. Validation and cross-national comparison of the food neophobia scale (FNS) using confirmatory factor analysis. Appetite 2003, 40, 163–173. [Google Scholar] [CrossRef]
- Pickering, G.J.; Hayes, J.E. Influence of biological, experiential and psychological factors in wine preference segmentation. Aust. J. Grape Wine Res. 2017, 23, 154–161. [Google Scholar] [CrossRef]
- Demattè, M.L.; Endrizzi, I.; Gasperi, F. Food neophobia and its relation with olfaction. Front. Psychol. 2014, 5, 127. [Google Scholar] [CrossRef] [Green Version]
- Knaapila, A.; Tuorila, H.; Silventoinen, K.; Keskitalo, K.; Kallela, M.; Wessman, M.; Peltonen, L.; Cherkas, L.F.; Spector, T.D.; Perola, M. Food neophobia shows heritable variation in humans. Physiol. Behav. 2007, 91, 573–578. [Google Scholar] [CrossRef]
- Loewen, R.; Pliner, P. Effects of Prior Exposure to Palatable and Unpalatable Novel Foods on Children’s Willingness to Taste Other Novel Foods. Appetite 1999, 32, 351–366. [Google Scholar] [CrossRef]
- Mustonen, S.; Tuorila, H. Sensory education decreases food neophobia score and encourages trying unfamiliar foods in 8–12-year-old children. Food Qual. Prefer. 2010, 21, 353–360. [Google Scholar] [CrossRef]
- Pelet, J.-E.; Lecat, B.; Khan, J.; Rundle-Thiele, S.; Lee, L.; Ellis, D.; Wolf, M.M.; Kavoura, A.; Katsoni, V.; Wegmann, A.L. Winery website loyalty: The role of sales promotion and service attributes. Int. J. Wine Bus. Res. 2018, 30, 138–152. [Google Scholar] [CrossRef]
- Ingrassia, M.; Altamore, L.; Bacarella, S.; Columba, P.; Chironi, S. The Wine Influencers: Exploring a New Communication Model of Open Innovation for Wine Producers—A Netnographic, Factor and AGIL Analysis. J. Open Innov. Technol. Mark. Complex. 2020, 6, 165. [Google Scholar] [CrossRef]
- Chironi, S.; Altamore, L.; Columba, P.; Bacarella, S.; Ingrassia, M. Study of wine producers’ marketing communication in extreme territories—Application of the AGIL scheme to wineries’ website features. Agronomy 2020, 10, 721. [Google Scholar] [CrossRef]
- Martínez-López, F.J.; Anaya-Sánchez, R.; Fernández Giordano, M.; Lopez-Lopez, D. Behind influencer marketing: Key marketing decisions and their effects on followers’ responses. J. Mark. Manag. 2020, 36, 579–607. [Google Scholar] [CrossRef]
- Moreno, F.M.; Gil Lafuente, J.; Carreón, F.Á.; Moreno, S.M. The Characterization of the Millennials and Their Buying Behavior. Int. J. Mark. Stud. 2017, 9, 135. [Google Scholar] [CrossRef]
Figure 1.
Overall mWNS scores as a function of income. Error bars represent the standard error for each condition mean.
Figure 1.
Overall mWNS scores as a function of income. Error bars represent the standard error for each condition mean.

Figure 2.
Results of chi-square analysis showing the number of neophiles (red) and neophobes (blue) as a function of whether or not participants were university educated. Asterisk (*) denotes a significant difference between groups.
Figure 2.
Results of chi-square analysis showing the number of neophiles (red) and neophobes (blue) as a function of whether or not participants were university educated. Asterisk (*) denotes a significant difference between groups.

Figure 3.
Results of chi-square analysis showing the number of neophiles (red) and neophobes (blue) as a function of average price paid per 750 mL bottle of wine. Asterisk (*) denotes a significant difference between groups.
Figure 3.
Results of chi-square analysis showing the number of neophiles (red) and neophobes (blue) as a function of average price paid per 750 mL bottle of wine. Asterisk (*) denotes a significant difference between groups.

Figure 4.
Results of a chi-square analysis showing number of neophiles (red) and neophobes (blue) as a function of wine diversity group: low (0–2 wine categories), medium (3–5 wine categories), and high (6–8 wine categories). Asterisk (*) denotes a significant difference between groups.
Figure 4.
Results of a chi-square analysis showing number of neophiles (red) and neophobes (blue) as a function of wine diversity group: low (0–2 wine categories), medium (3–5 wine categories), and high (6–8 wine categories). Asterisk (*) denotes a significant difference between groups.

Figure 5.
Annual wine intake frequency as a function of neophilia/neophobia and degree of wine involvement. Error bars represent the standard error for each condition mean. Asterisk (*) denotes a significant difference between groups.
Figure 5.
Annual wine intake frequency as a function of neophilia/neophobia and degree of wine involvement. Error bars represent the standard error for each condition mean. Asterisk (*) denotes a significant difference between groups.


Table 1.
Breakdown of demographics (N = 1269).
| N | |
|---|---|
| Gender | |
| Female | 634 |
| Male | 629 |
| Undisclosed | 6 |
| Age | |
| Mean (SD) | 52.5 (15.3) |
| Range | 20–89 |
| Household Income | |
| Under CAD 25,000 | 83 |
| CAD 25,000–45,000 | 172 |
| CAD 46,000–65,000 | 198 |
| CAD 66,000–85,000 | 202 |
| CAD 86,000–100,000 | 200 |
| CAD 101,000–200,000 | 340 |
| CAD 200,000+ | 70 |
| Highest Education | |
| High School diploma | 185 |
| Apprenticeship or trade certificate | 53 |
| College diploma | 327 |
| University undergraduate degree | 388 |
| University graduate degree | 315 |
Table 2.
Results of the confirmatory factor analyses for model suggested by Ristic et al. (2016), with and without questionnaire Item 2 (“I will drink almost any wine”).
Table 2.
Results of the confirmatory factor analyses for model suggested by Ristic et al. (2016), with and without questionnaire Item 2 (“I will drink almost any wine”).
| Model | Chi-Square | RMSEA | CFI | NFI |
|---|---|---|---|---|
| Item 2 included | 31.91, p < 0.001 | 0.042 | 0.993 | 0.990 |
| Item 2 excluded | 15.67, p = 0.048 | 0.028 | 0.998 | 0.995 |
Note: A good-fitting model has a non-significant chi-square, a root-mean-square error of approximation (RMSEA) of below 0.08, and a comparative fit index (CFI) and normed fit index (NFI) of greater than 0.95; Brown, 2006; Ristic et al. 2016.
Publisher’s Note: MDPI stays neutral with regard to jurisdictional claims in published maps and institutional affiliations. |
© 2021 by the authors. Licensee MDPI, Basel, Switzerland. This article is an open access article distributed under the terms and conditions of the Creative Commons Attribution (CC BY) license (https://creativecommons.org/licenses/by/4.0/).
Share and Cite
MDPI and ACS Style
Pickering, G.J.; Dale, G.; Kemp, B. Optimization and Application of the Wine Neophobia Scale. Beverages 2021, 7, 41. https://0-doi-org.brum.beds.ac.uk/10.3390/beverages7020041
AMA Style
Pickering GJ, Dale G, Kemp B. Optimization and Application of the Wine Neophobia Scale. Beverages. 2021; 7(2):41. https://0-doi-org.brum.beds.ac.uk/10.3390/beverages7020041
Chicago/Turabian StylePickering, Gary J., Gillian Dale, and Belinda Kemp. 2021. "Optimization and Application of the Wine Neophobia Scale" Beverages 7, no. 2: 41. https://0-doi-org.brum.beds.ac.uk/10.3390/beverages7020041
Note that from the first issue of 2016, this journal uses article numbers instead of page numbers. See further details here.