Article

A Fast, Straightforward and Inexpensive Method for the Authentication of Baijiu Spirit Samples by Fluorescence Spectroscopy

1
Department of Chemistry, Eastern Kentucky University, Richmond, KY 40475, USA
2
Department of Biological & Chemical Sciences, New York Institute of Technology, Old Westbury, NY 11568, USA
3
Process NMR Associates, LLC, Poughkeepsie, NY 12603, USA
4
Department of Chemistry, Biochemistry & Physics, Marist College, Poughkeepsie, NY 12601, USA
5
Department of Chemistry and Physics, McNeese State University, Lake Charles, LA 70601, USA
*
Author to whom correspondence should be addressed.
Submission received: 9 July 2021 / Revised: 31 August 2021 / Accepted: 2 September 2021 / Published: 14 September 2021

Abstract

:
The Chinese spirit baijiu is currently the world’s bestselling spirit, with more than ten billion liters sold in 2018. This is a figure that puts its sales higher than whiskey, vodka, gin, and tequila combined. The multitude of baijiu varieties available in the market differ in several ways ranging from aging to the traditional artisanship involved in producing the final spirit to several other features, including the rarity of the bottle. A result of these differences is a wide distribution of prices for the various baijiu products. Consequently, a single bottle of baijiu can cost anywhere from a few dollars, up to thousands of US dollars. The price differences among the various baijiu spirits necessitate the existence of reliable scientific methods that can efficiently differentiate and authenticate the qualities of baijiu spirits. In addition, the existence of such methods facilitates the prevention of counterfeit sales of the final product. Considering this, we introduce an analytical chemistry method that distinguishes amongst different baijiu spirits based on fluorescence spectroscopy. Its attributes include the low cost and convenience that allows analysis either before or while the spirit is in the market. Our work herein focuses on the analysis of thirty different varieties of baijiu spirits from six different distilleries from East Asia and North America by fluorescence emission spectroscopy, which is associated to the price of the product. For the analysis, we employed a HORIBA FLUOROLOG 3 (HORIBA—Jobin Yvon) spectrometer. Major advantages of this method include the low cost, as no consumables except a quartz reusable cuvette are required, the minimal waste, and finally the quick processing of data.

Graphical Abstract

1. Introduction

The Chinese spirit baijiu (also known as shaojiu) is one of the most famous alcoholic drinks in the Eastern world, and while it has yet to become popular in the West, its popularity is steadily rising as is indicated by its growing sales. Although the Chinese alcohol culture is estimated to be close to 9000 years old, the making of baijiu started when Western techniques of distillation arrived in China. It quickly became popular as it became easy and inexpensive to produce in a way that today it stands as the national drink of China, produced by more than 14,000 distilleries, making it the number one selling spirit in the world [1].
One of the most famous baijius in the world is named Moutai, which is produced in the town of Maotai in China. Moutai undergoes a unique fermentation and distilling process, which drive its price very high. This make is it susceptible to considerable counterfeit production [2]. The method of baijiu-making is based on solid-state fermentation and distillation. This includes mixing sorghum grains, water, and a fermentation agent called daqu, xiaoqu, or mijiu. It is followed by incubation and solid-state fermentation in an underground pit or buried jar for long periods of time [3,4]. During the process, microbes are formed and they convert the raw materials into substrates, making them suitable for alcoholic fermentation and allowing flavors to form [1,2]. One classification of baijiu spirits is based on the flavor and aroma characteristics, listing 12 types of baijiu: strong flavor, light flavor, sauce flavor, rice flavor, feng flavor, laobaigan flavor, te flavor, sesame flavor, jiugui flavor, herbal flavor, yubingshaojiu flavor, and mixed flavor [1]. The number of years of aging is usually the most important parameter that ultimately assign the sample a certain price value. Another important parameter that contributes to the monetary value is the fact that the fermentation agent is extremely sensitive to the surrounding environment of the area in which it is produced, and the flavor is different according to the different baijiu regions [2]. Finally, another variable is the alcohol content as in the final product ethanol is usually between 40 to 55% [2]. The outcome of all these parameters is that different baijiu spirits have different properties most notably different tastes and smells, and these properties lead to different valuations of the products. As a result, the various varieties of Chinese baijiu range in prices from tens of dollars to thousands of dollars per bottle.
From ancient times to the present day, baijiu has been associated with numerous health benefits. As with any potentially addictive substance such as alcohol, moderation has been linked to health benefits especially in studies of certain cultures and societies [5]. From the Essentials of Chinese Materia Medica it is indicated that moderate amounts of baijiu may eliminate the feeling of cold, fatigue, and phlegm dampness [6]. Although the health effects of baijiu have been controversial, with one study suggesting its “anti-cancer” properties, it is widely accepted that the product contains three times the amount of terpenoids than grape wines, linalool, alpha-pinene, beta-myrcene and several other micronutrients, which are linked to certain health benefits. A large number of antioxidant compounds have been reported in baijiu, such as acids, phenolic compounds, pyrazines, sulfur-containing compounds, and terpenoids, as well as some peptides. One such peptide is Ala-Lys-Arg-Ala, which is known to come from sesame flavor-type baijiu to induce antioxidant defense mechanisms [7,8,9,10,11]. The process of fermentation is linked to the volume of these beneficial substances, explaining the wide variation of prices for the same product.
As happens with any commercial product that sells in the markets, with a wide spectrum of prices due to the different quality of baijiu, many efforts exist to defraud the consumers by mixing low quality baijiu into originally high-priced empty baijiu bottles. This problem of counterfeiting of baijiu spirit is most probably the biggest threat to retailers that are interested in the high-quality products and it is a problem that steadily increases, as there are few straightforward and inexpensive methods to provide adequate identification and authentication [12]. Considering the existing and rising popularity of the Chinese baijiu market, we set out to identify a sustainable method to authenticate bottles of baijiu quickly and easily. We considered methods that involve analysis of minimal preparation, minimal wait times, and minimal waste. The result was to identify fluorescence spectroscopy as a reliable method for authenticating baijiu samples and making it possible to distinguish the quality of the given baijiu sample based on its fluorescence properties. Fluorescence was the choice method as it is a well-established method with the ability to detect fluorescent molecules at concentrations as low as one part per trillion [13]. Fluorescence spectroscopy is also known to be 1–3 orders of magnitude more sensitive than UV-visible spectroscopy. One clear disadvantage to using fluorescence spectroscopy is the inability to obtain the chemical profile of the sample; an advantage is the interpretation in the differences of the fluorescence spectra is much less systematic than other techniques such as infrared spectroscopy, NMR, Raman, and mass spectral data [14].

2. Materials and Methods

2.1. Baijiu Samples

Thirty samples of baijiu spirit were obtained from Brewing and Distilling Analytical Services located in Lexington, KY, USA. The samples were collected from six different distilleries from East Asia and North America. The samples collected contain all flavor types from the assorted baijiu types [4].

2.2. Baijiu Mixtures

Each of the thirty samples were priced in dollars (USD) per one liter of sample. The samples were then ranked in order from most to least expensive. A 50:50 mixture of the most expensive baijiu spirit and least expensive baijiu spirit was made by measuring 1.5 g of each in a test tube. This was duplicated using the most expensive Moutai spirit and least expensive Moutai spirit. Each 50:50 mixture was analyzed in triplicate for both emission and excitation. A second and third mixture was made by taking 1.5 g of the 50:50 mixtures and adding 1.5 g of the respective inexpensive spirit, creating a 25:75 mixture of expensive to inexpensive spirit. Both 25:75 mixtures were analyzed in triplicate for excitation and emission. An additional two mixtures were created by adding 1.5 g of 50:50 mixture to 1.5 g of the respective expensive spirit resulting in a 75:25 mixture of expensive to inexpensive spirit for both the Moutai and baijiu samples. Both 75:25 spirit mixtures were run in triplicate for excitation and emission. All Moutai spectra were recorded on the same spectra for comparison as well as all baijiu spirits.

2.3. Fluorescence Measurements

All samples were analyzed using a HORIBA FLOUOROLOG 3 (HORIBA–Jobin Yvon, Edison, NJ, USA) in triplicate. The total fluorescence spectra were obtained by recording the emission and excitation spectra in the 200–900 nm range. The fluorescence spectra were presented in the fluorescence intensity as a function of either excitation or emission wavelengths. The excitation and emission slit widths were 5 nm. The acquisition interval and the integration time were maintained at 1 nm and 2 s, respectively. The undiluted samples were measured directly in a 10 mm Suprasil quartz cuvette. A plastic cap was placed over the cuvette to protect the samples from air. All spectra were recorded and overlapped on the same spectrum to compare for differences.

3. Results and Discussion

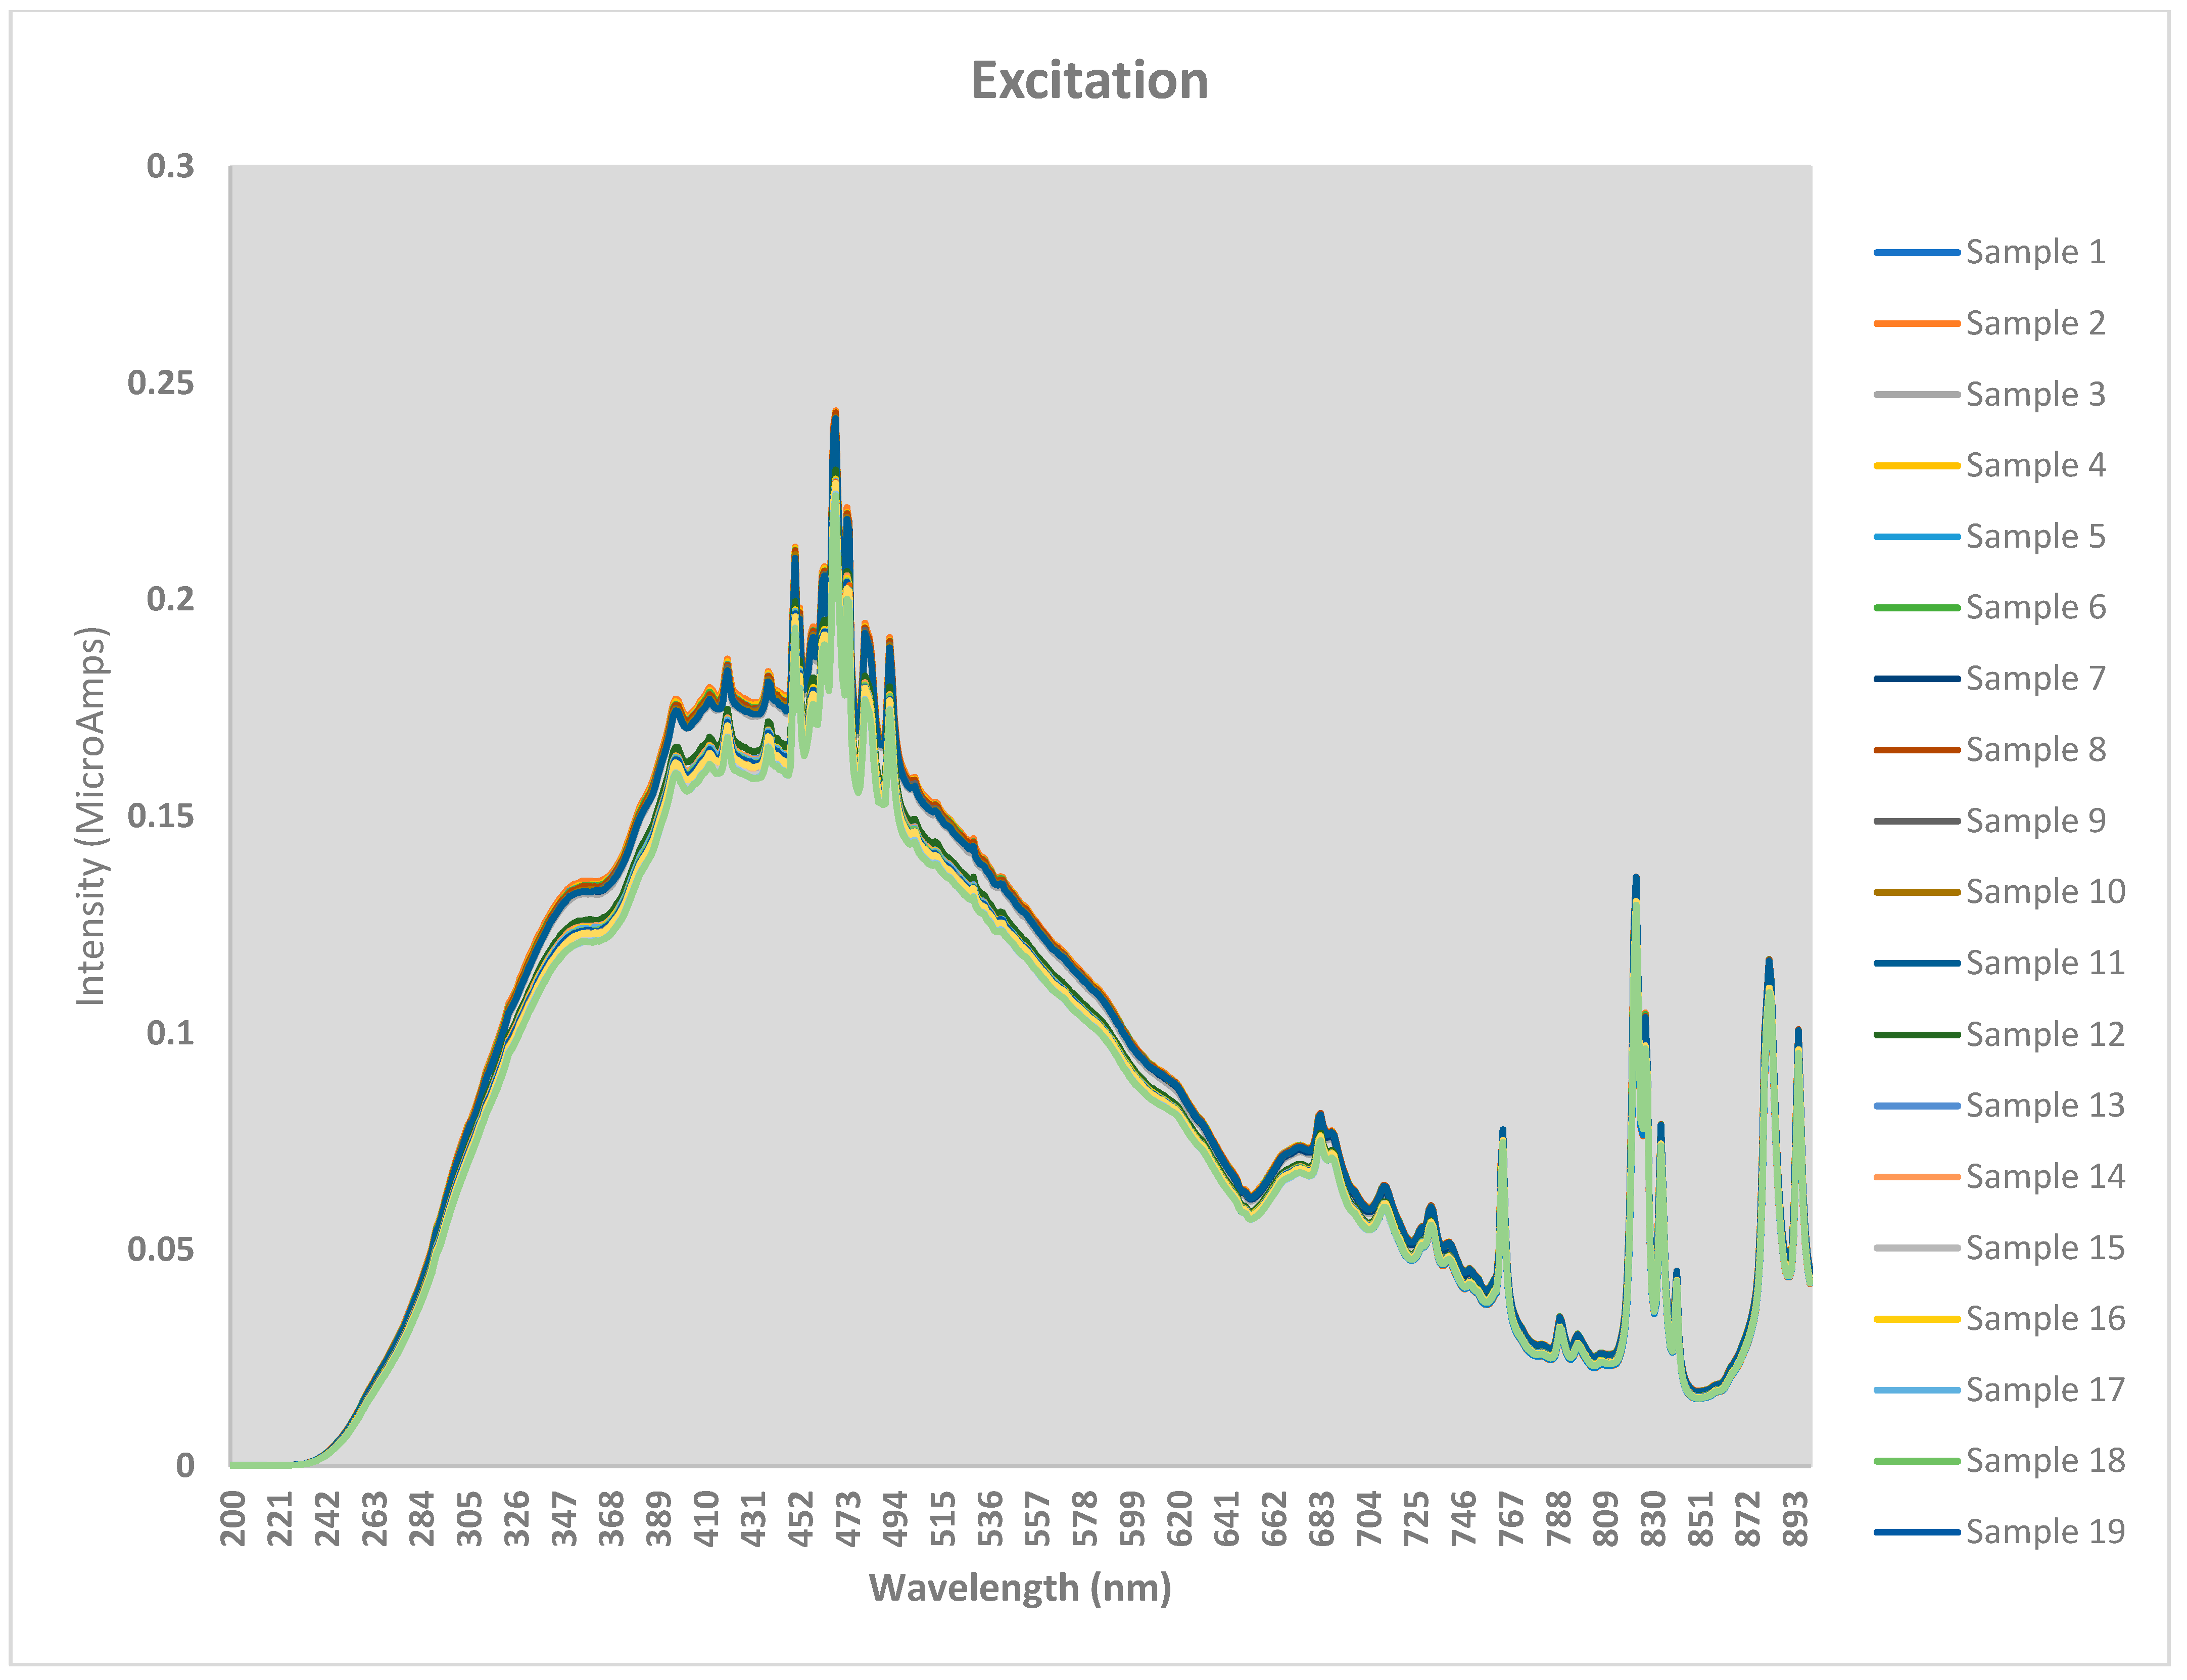
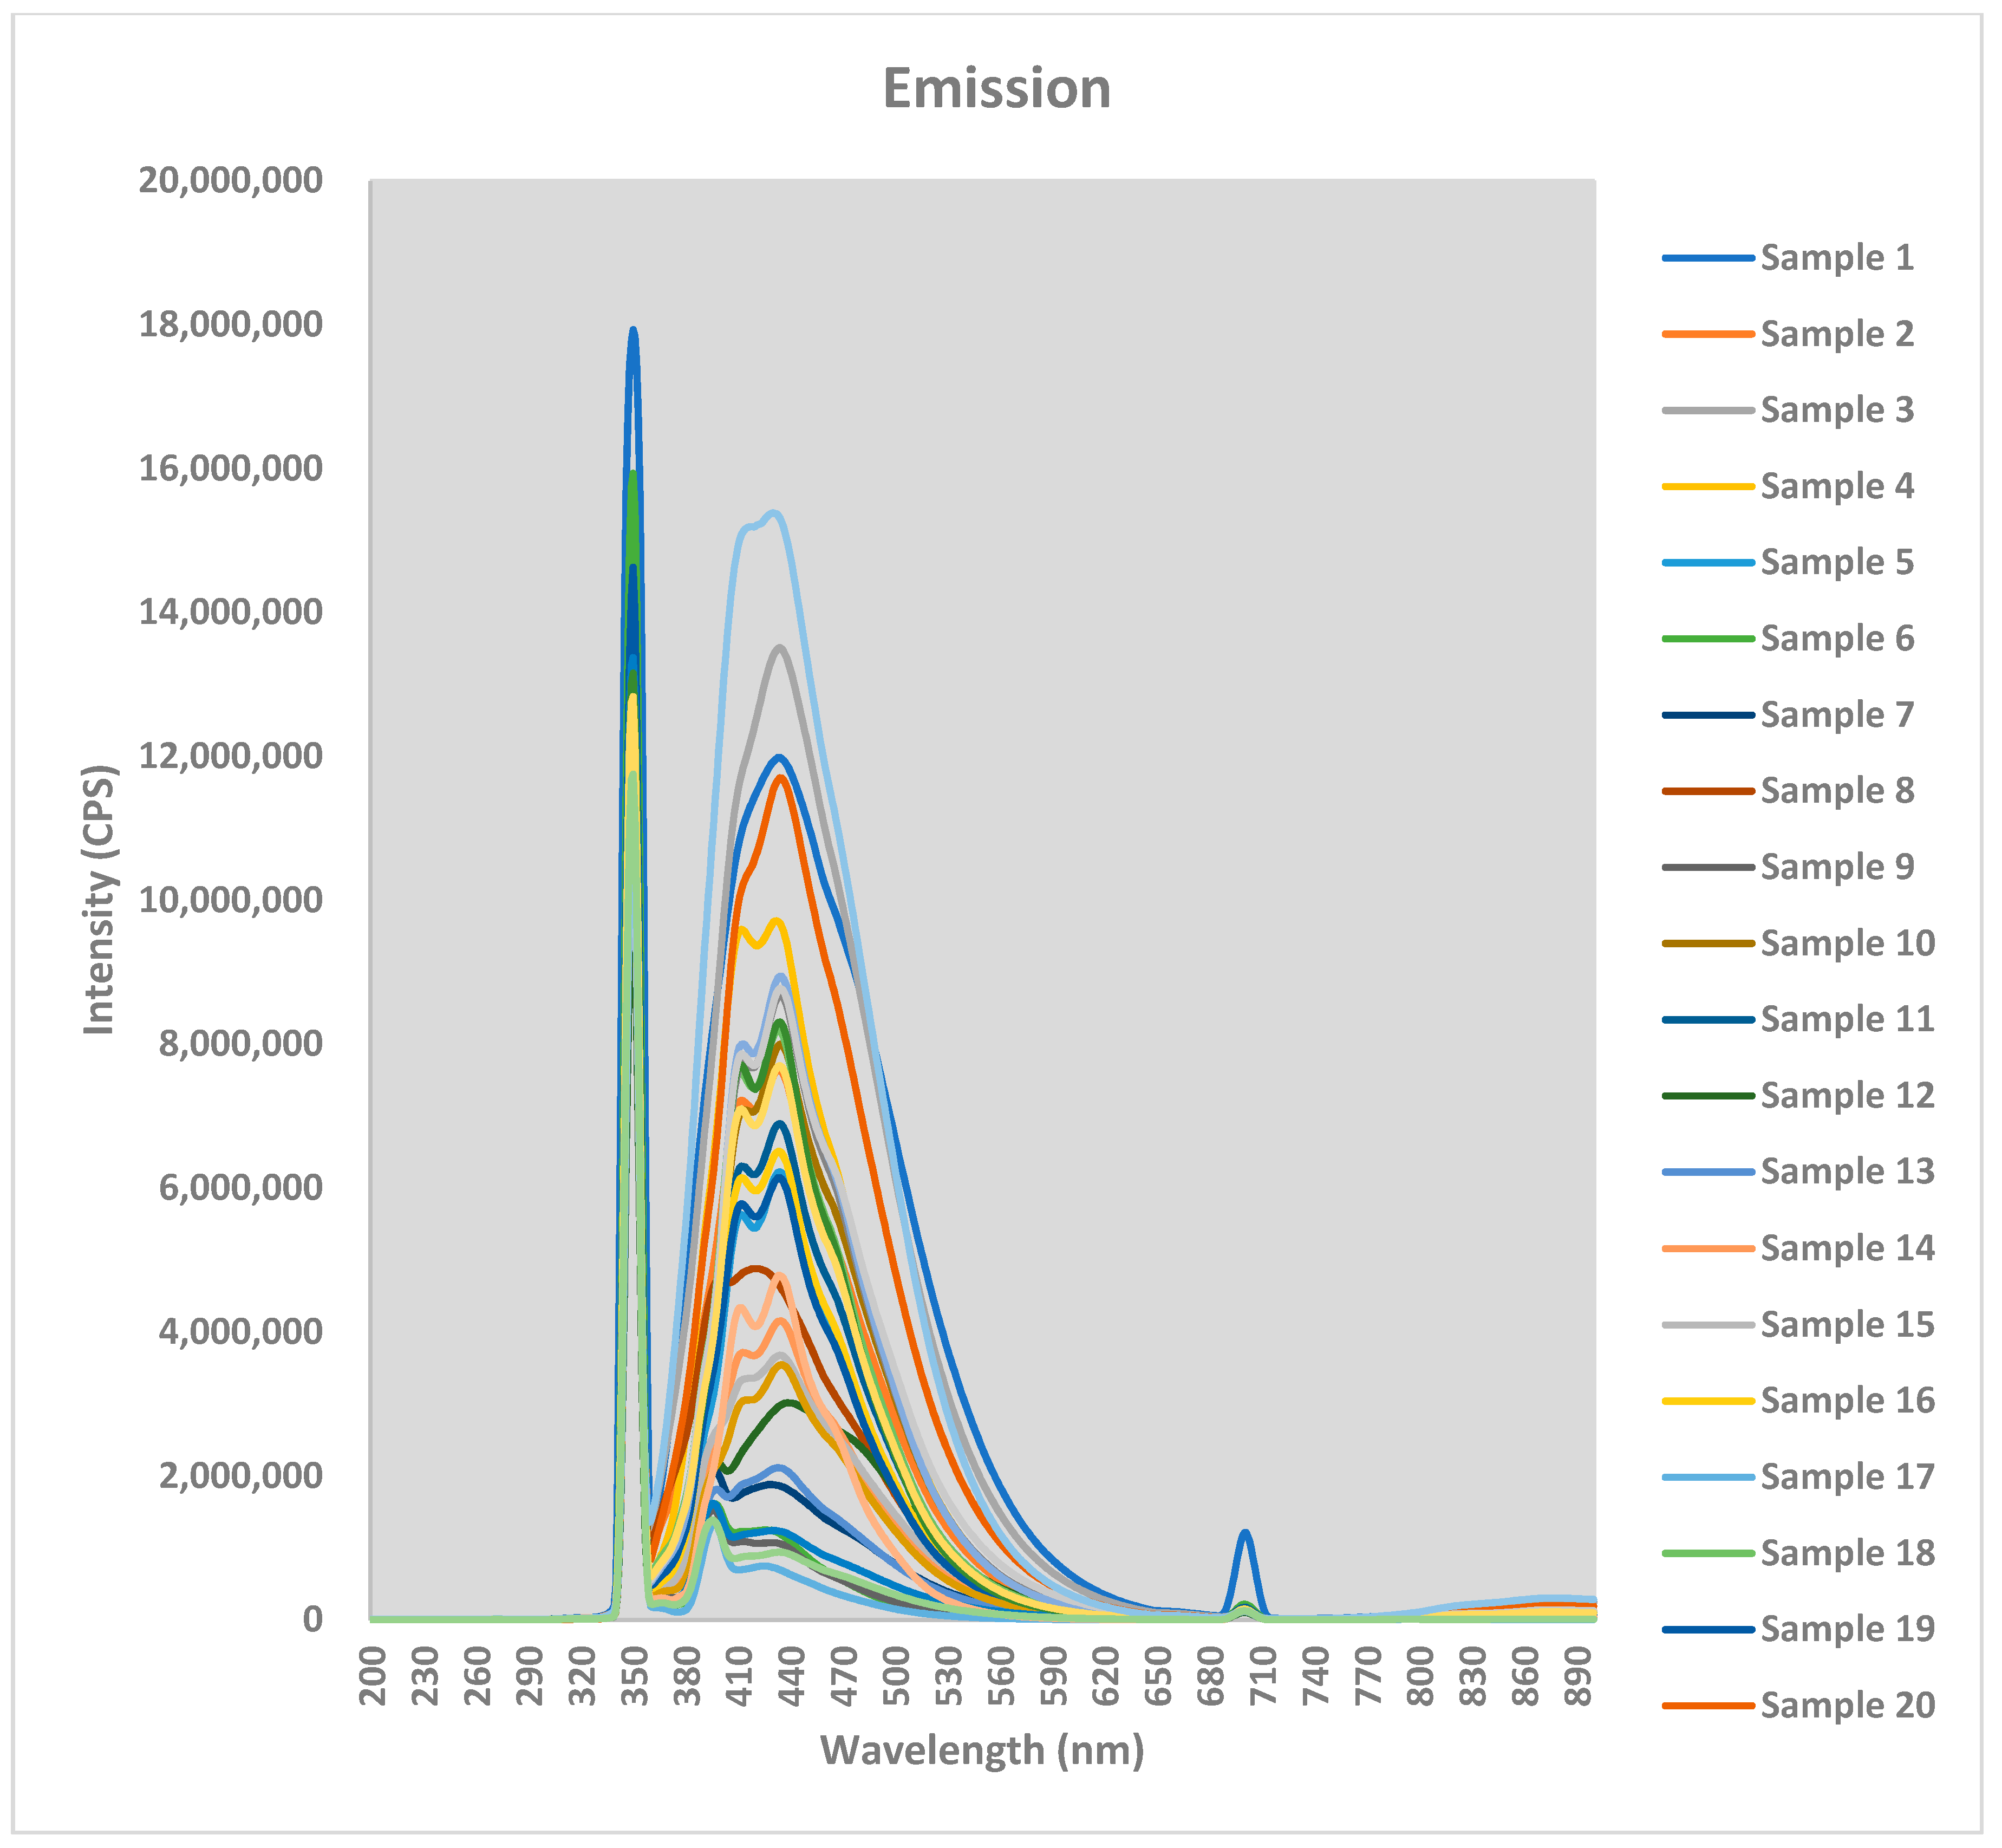
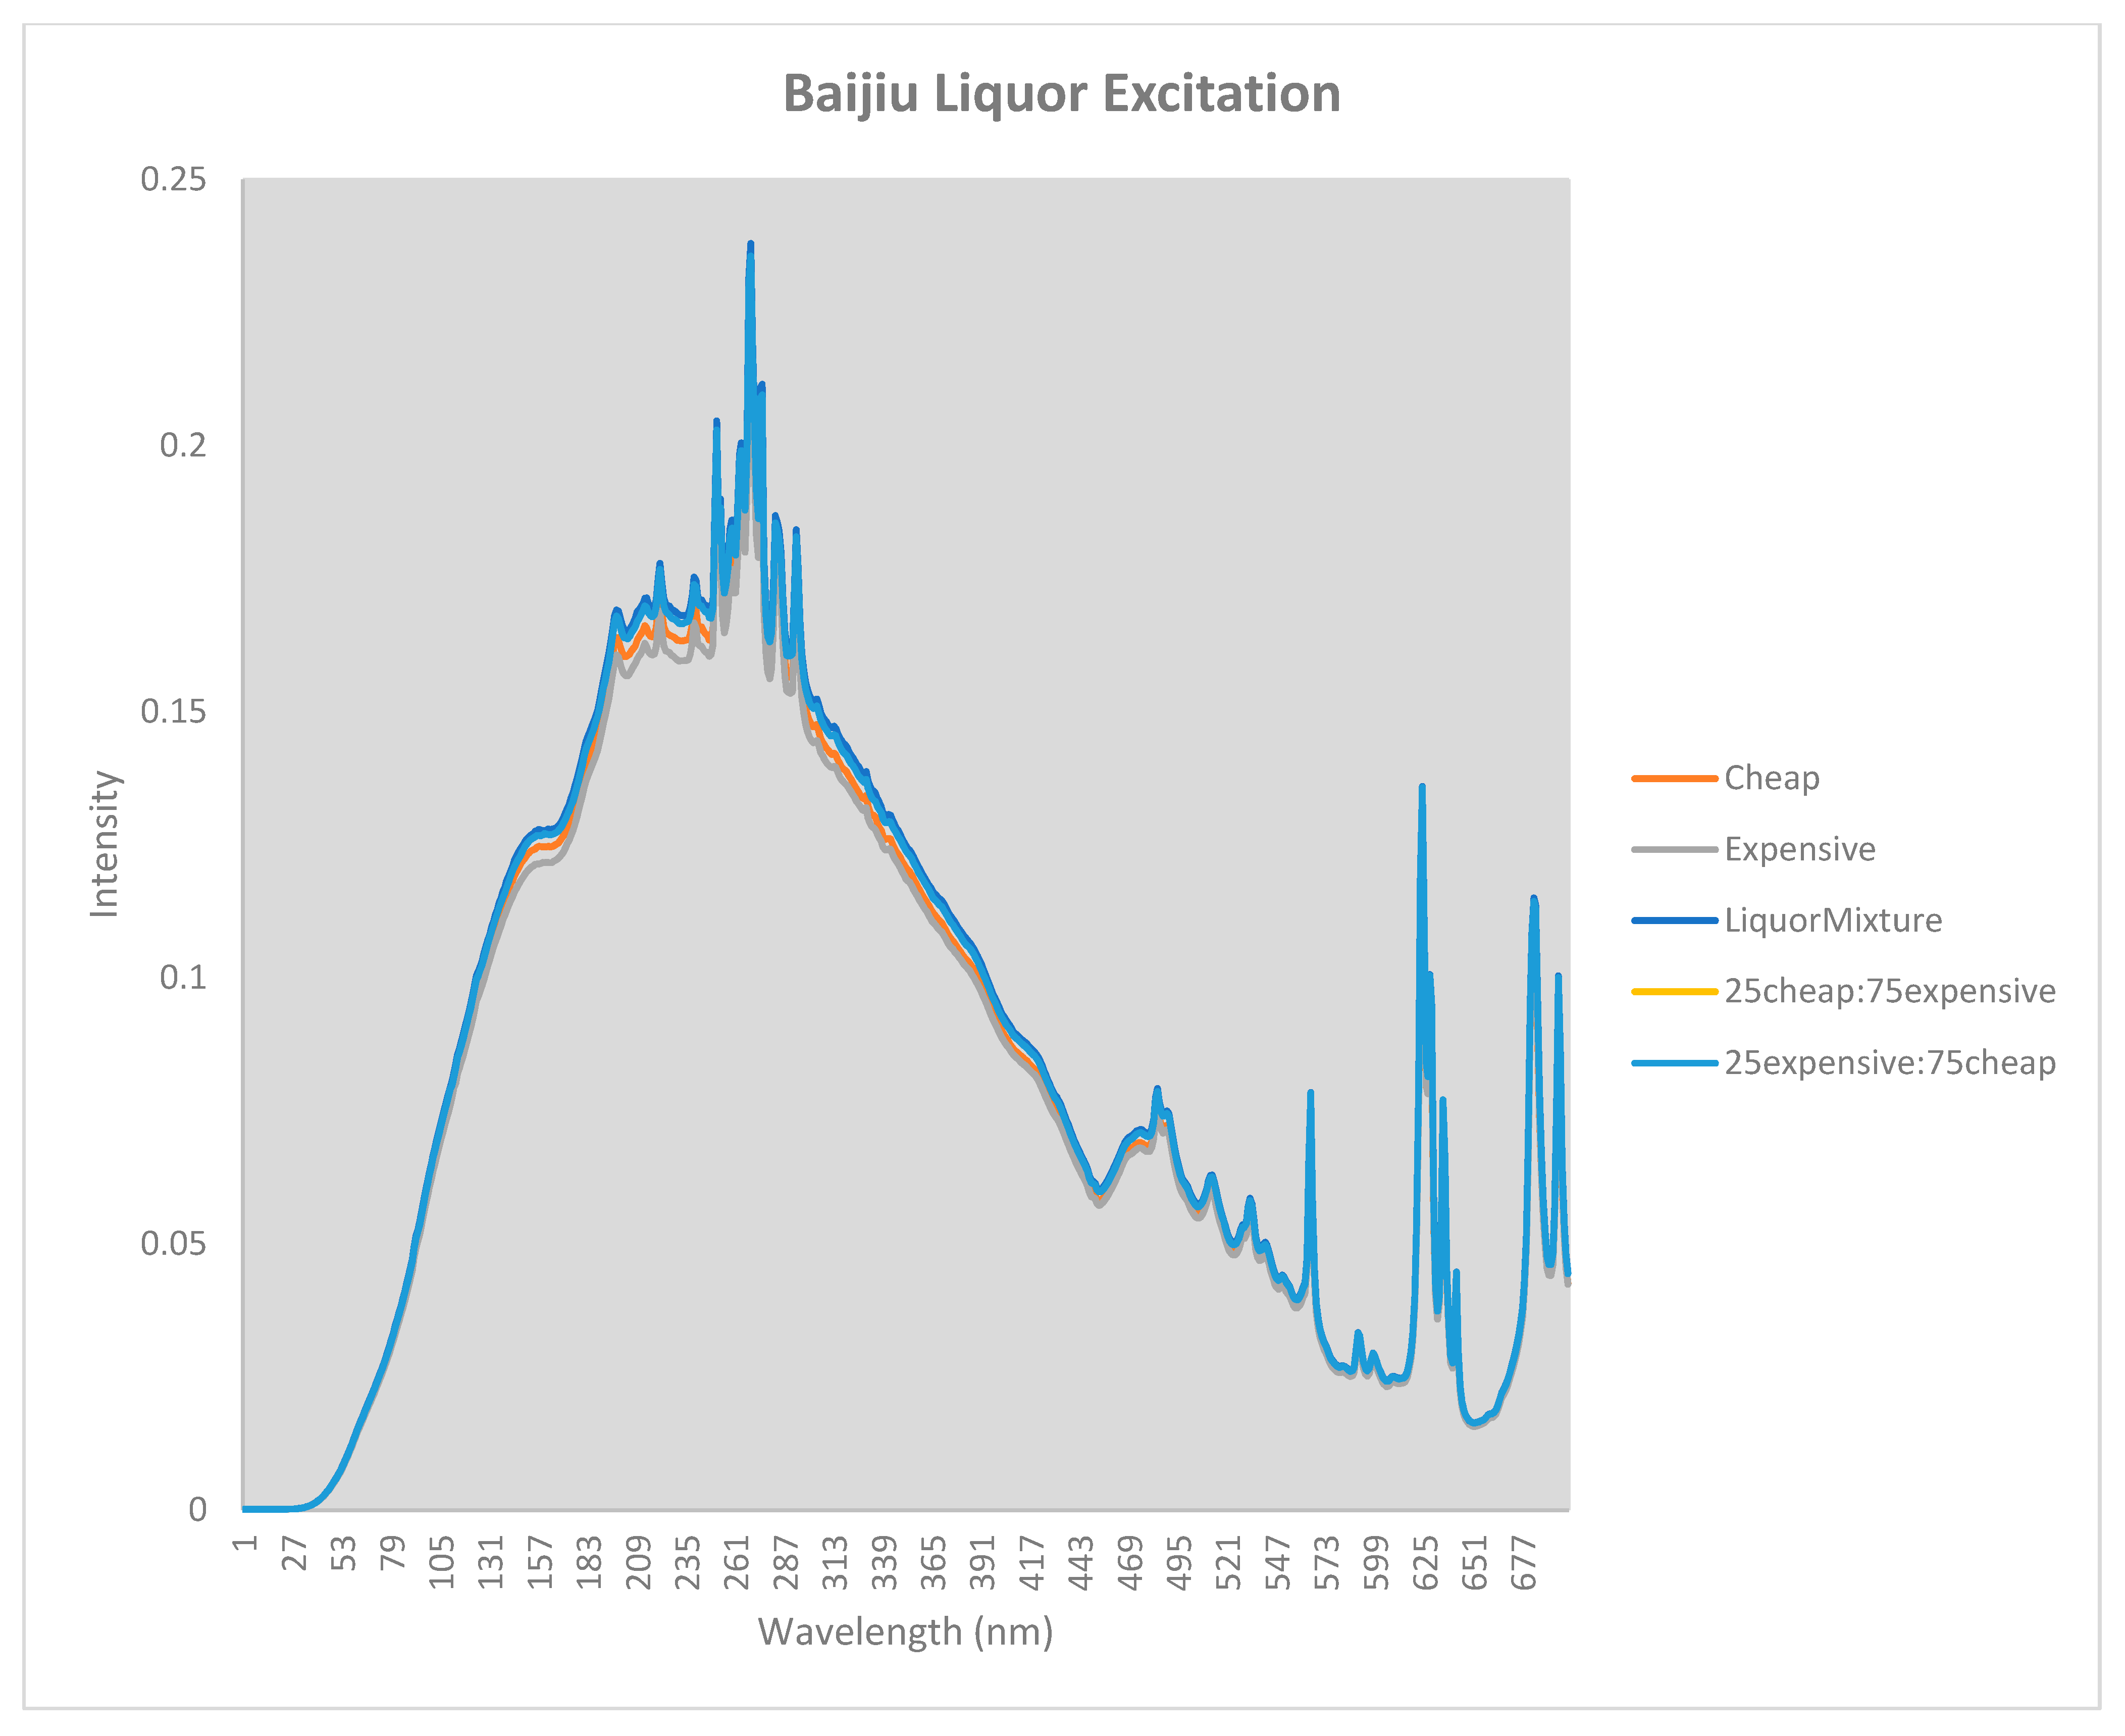
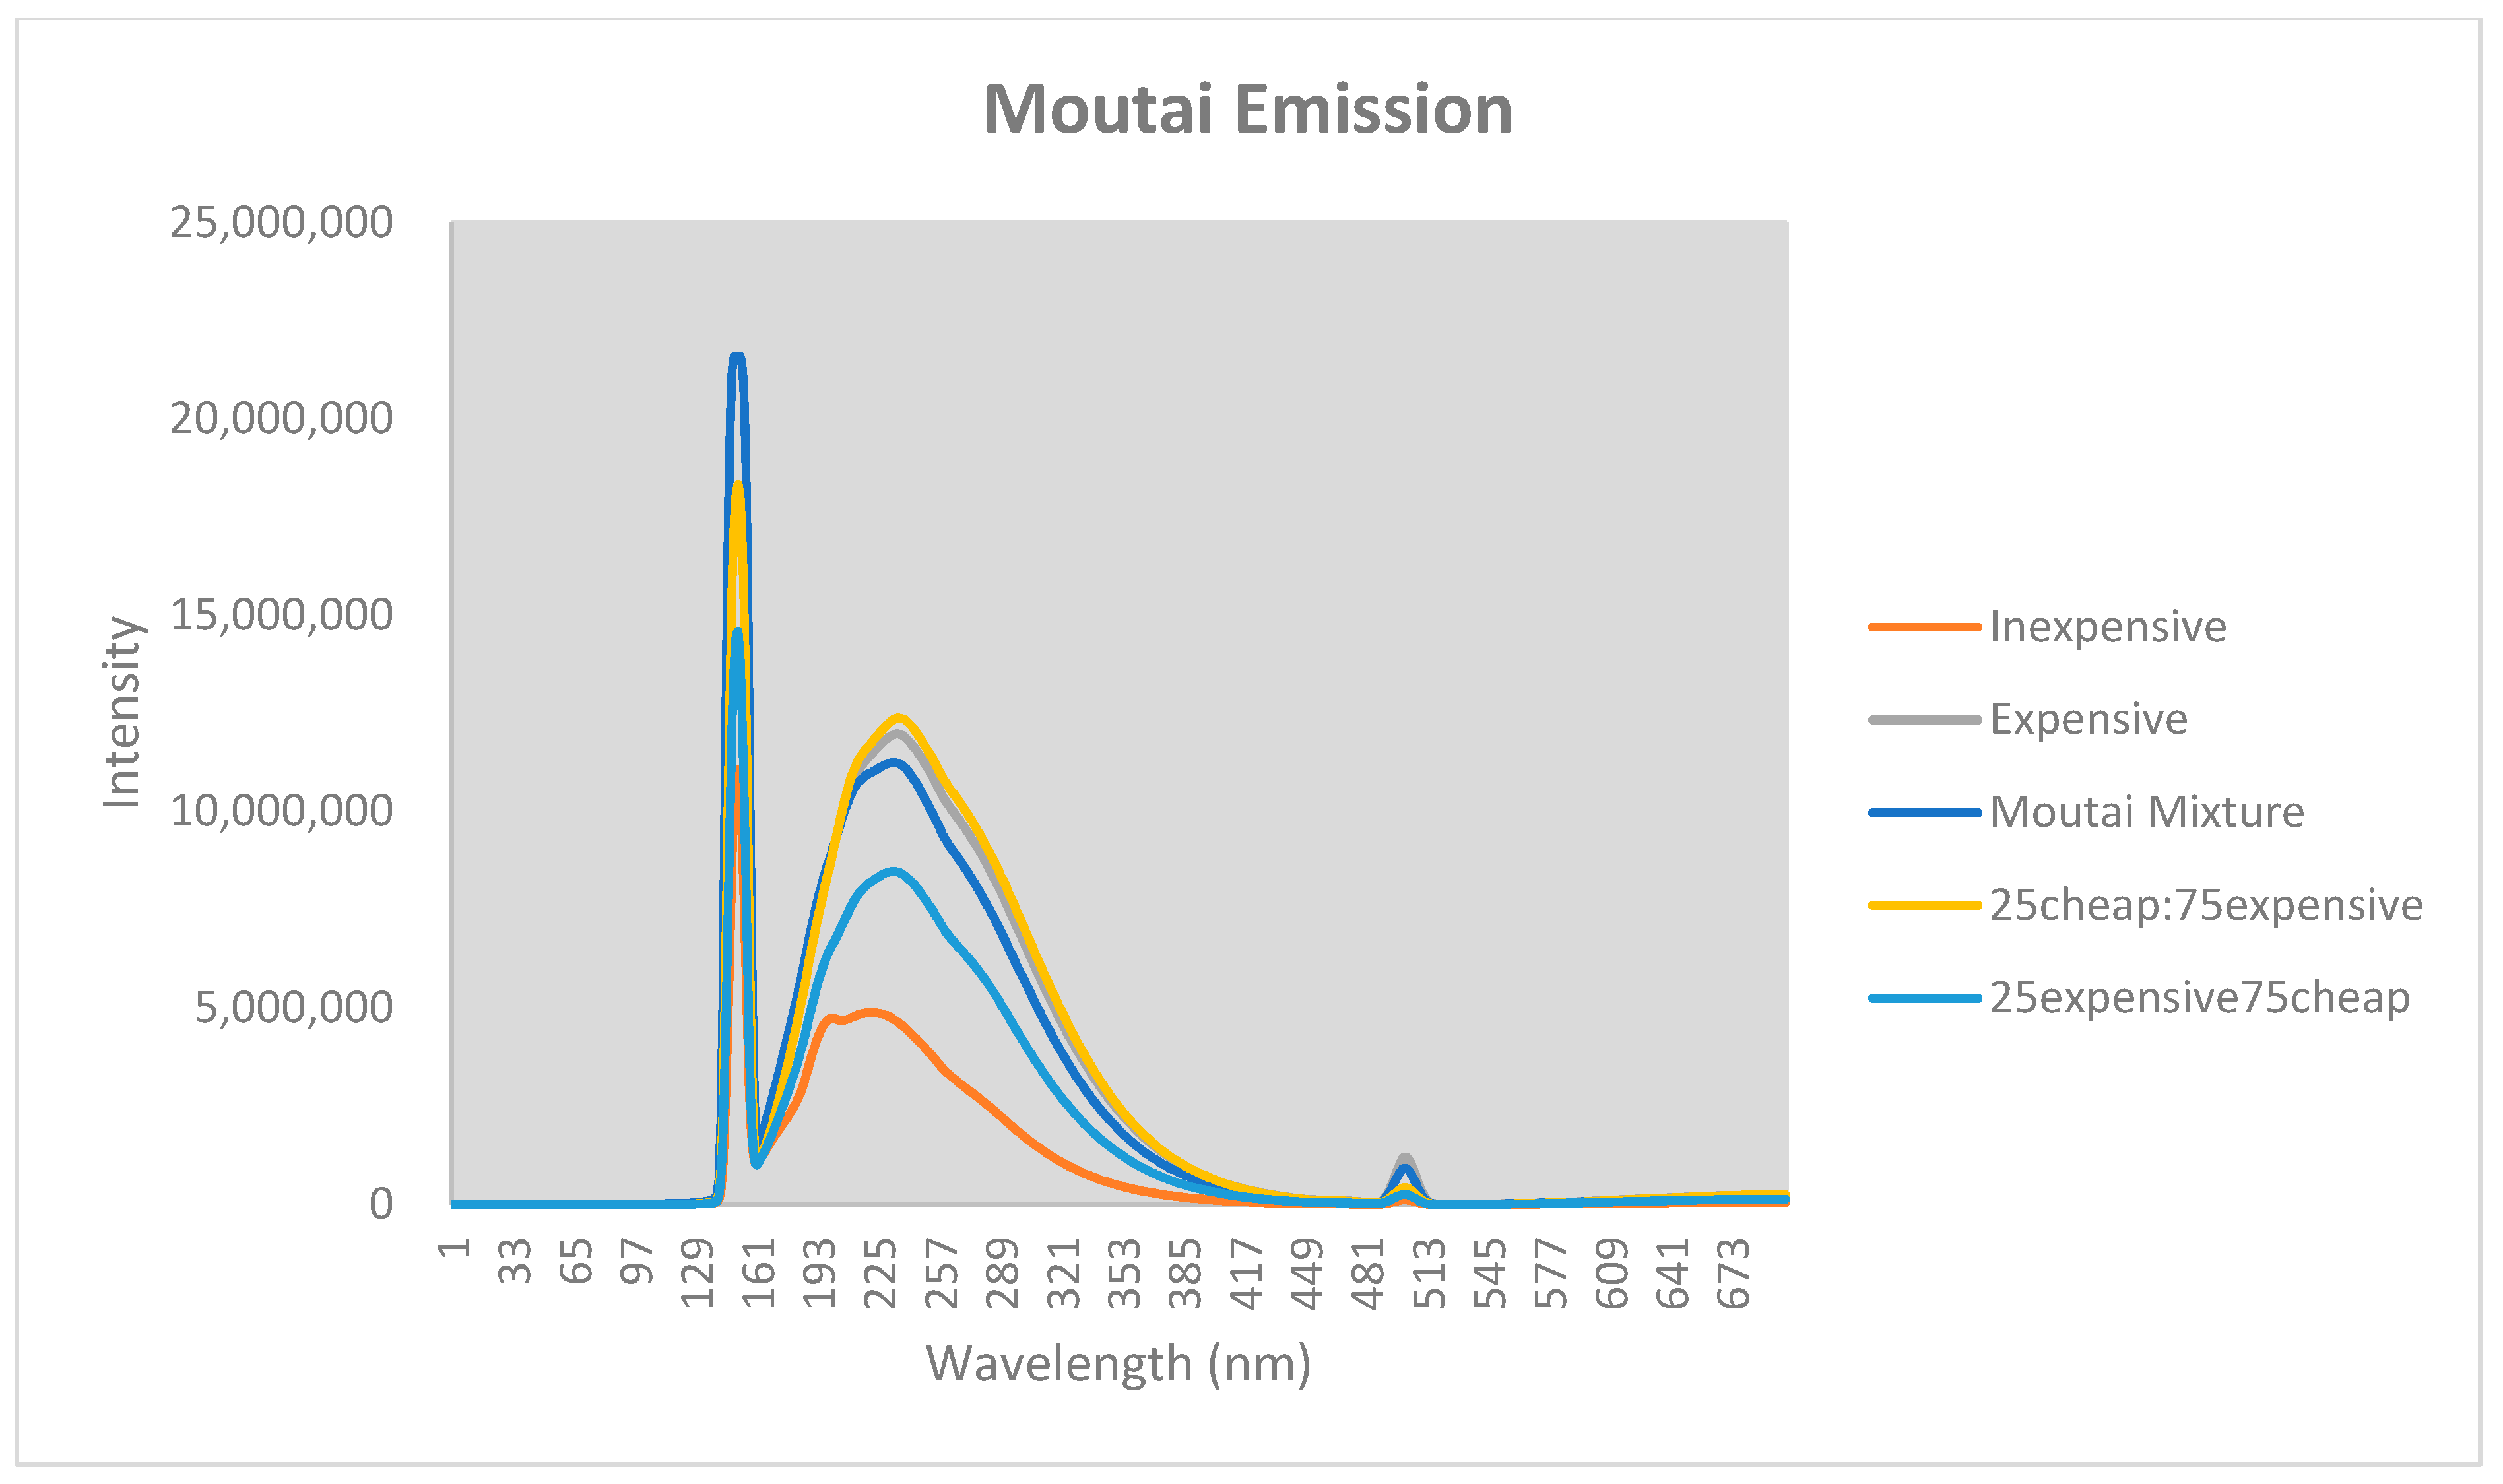
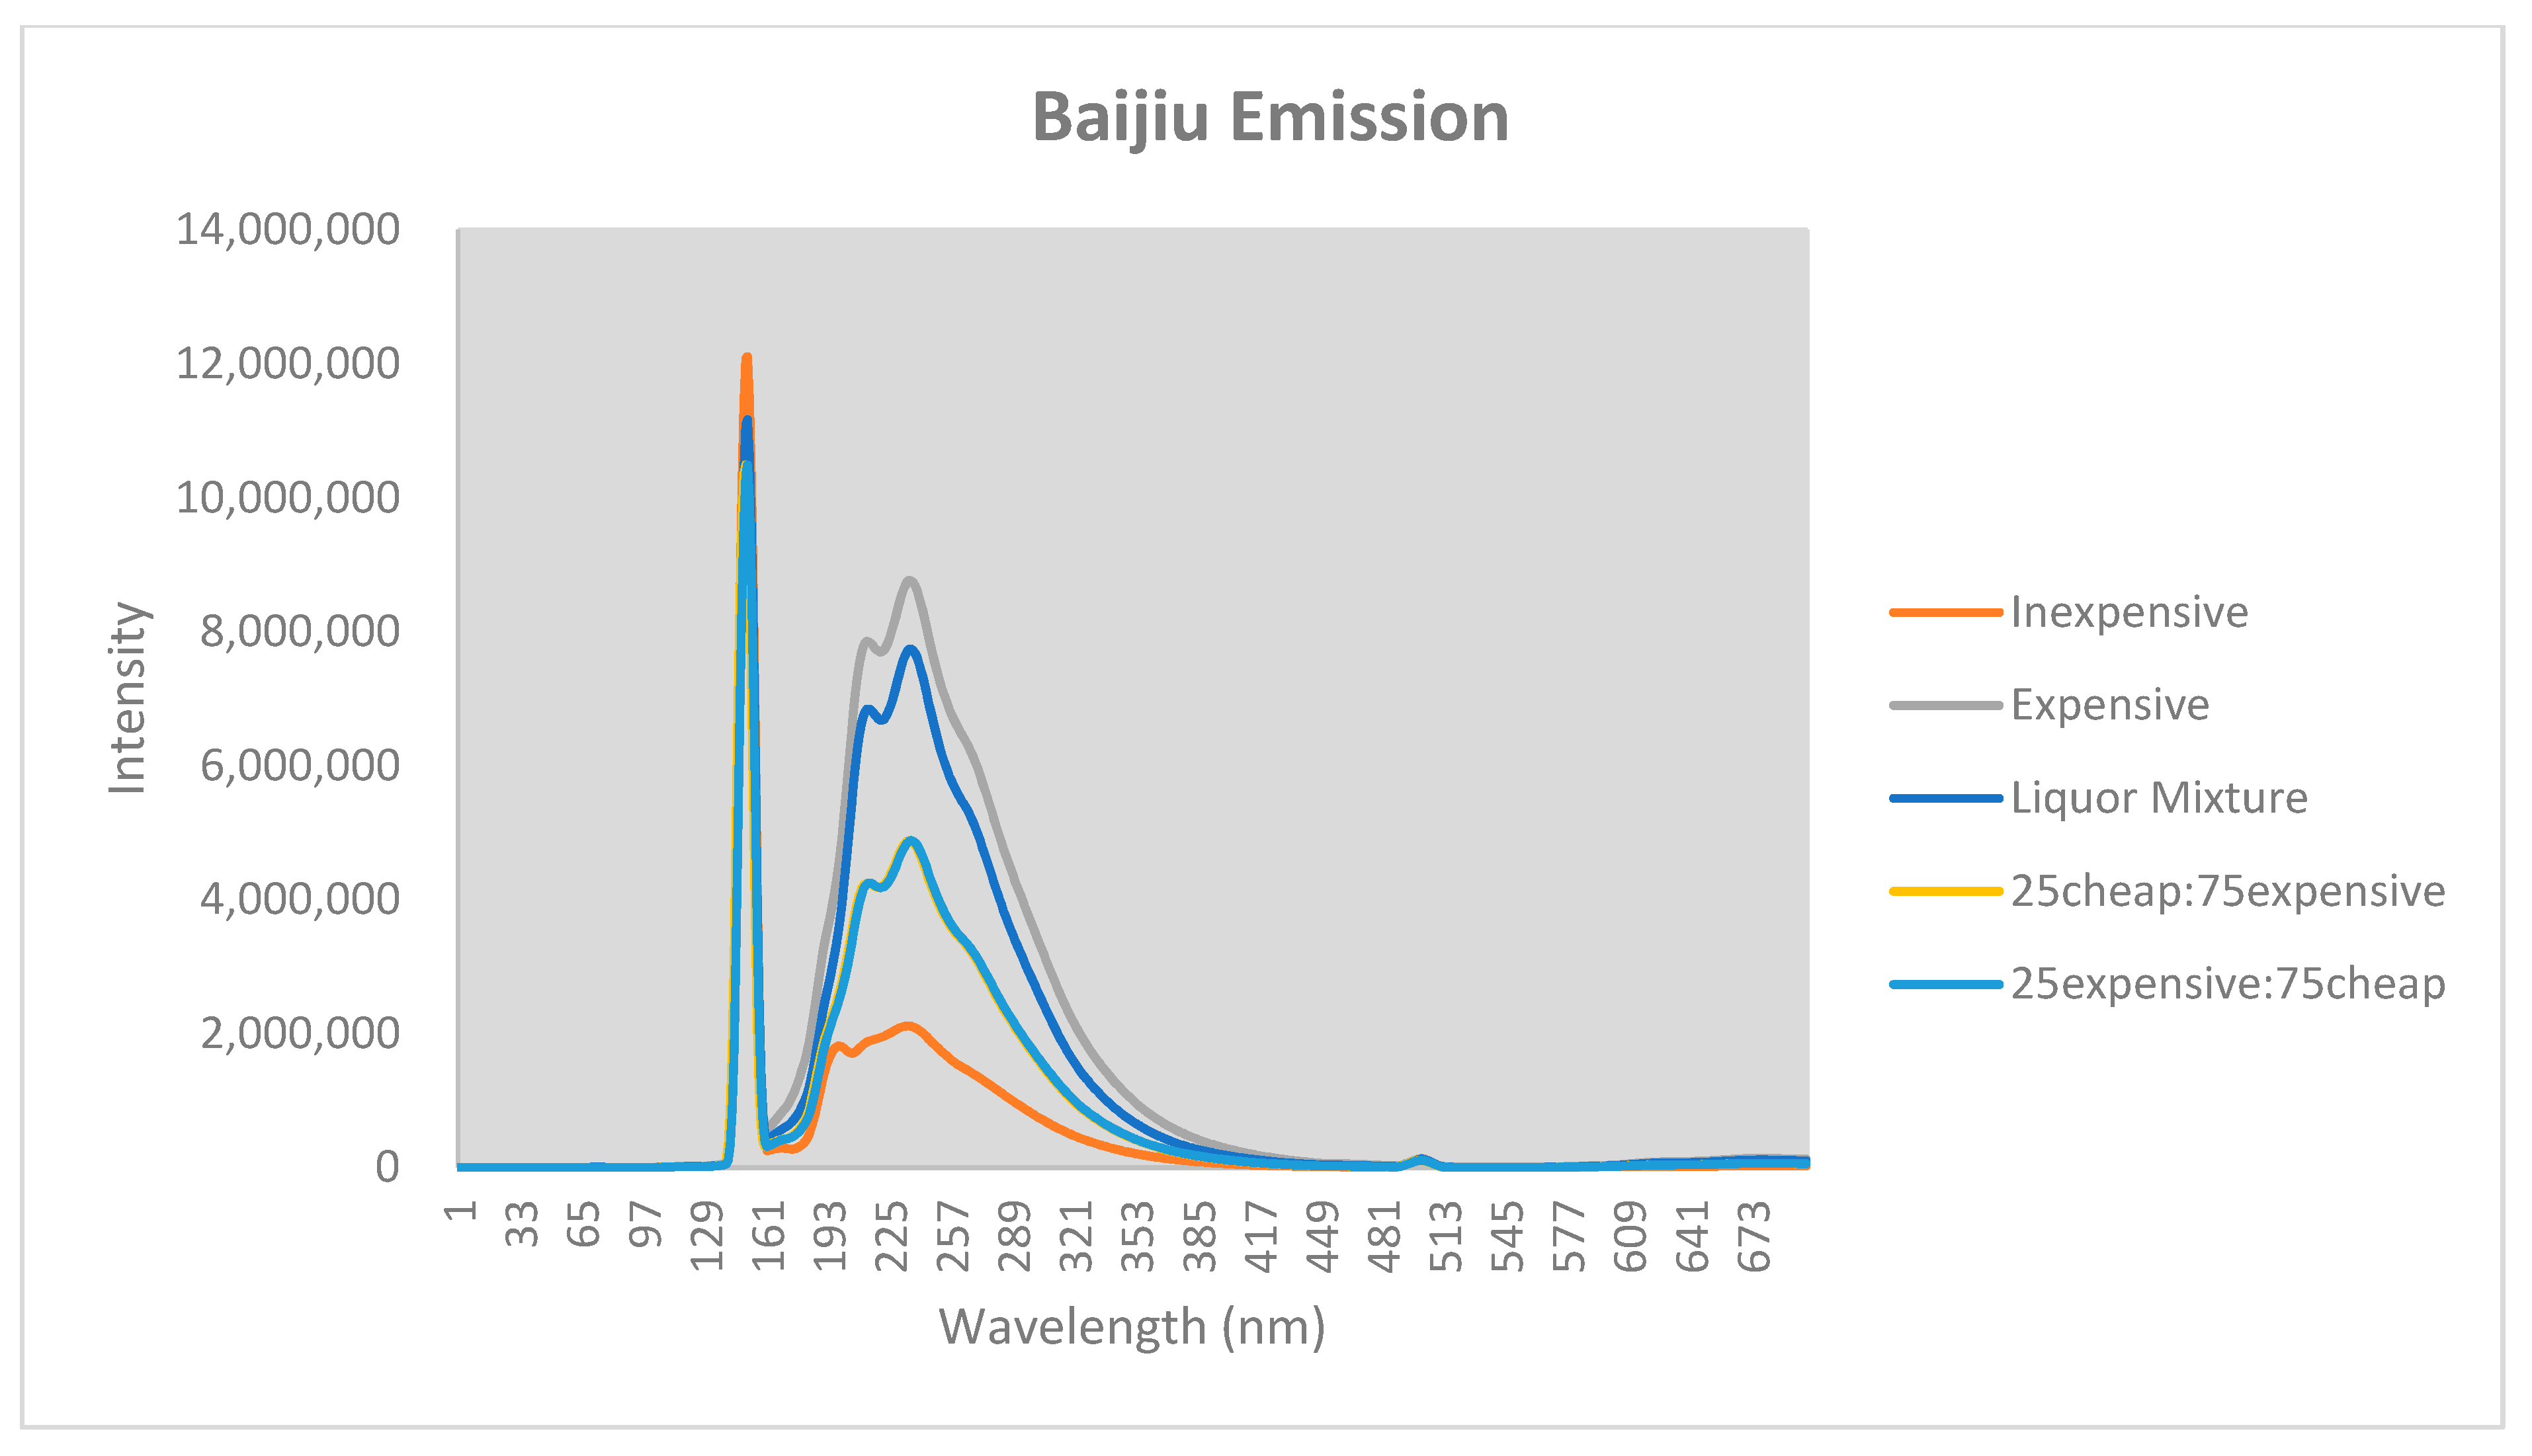
3.1. Fluorescence Spectra of Baijiu Spirits

The fluorescence spectra for all thirty baijiu samples were obtained by recording the emission excitation spectrums from 200–900 nm. The spectra for all thirty baijiu samples can be seen in Figure 1 and Figure 2.
The difference in intensity levels can also be attributed to the different chemical makeup of the individual baijiu spirits. As can be seen in Figure 1 and Figure 2, there are visible visual differences in the emission spectra between individual baijiu samples verifying the ability to distinguish different types of baijiu samples. As can be seen in Figure 1, there appears a grouping into two different types of samples which originates from the influence of alcohol, with one group being samples with about 40%, and the other samples with about 60%. This is imperative for the identification of individual solutions of a specific baijiu spirit if it is not already known, and this technique can also be used to recognize counterfeit samples. Table 2 is a correlation summary table that demonstrates as the price of baijiu increases, the absorption increases. This was an unexpected finding that was discovered after plotting the data.
Running multiple regression on excel setting price as “Y” range and using the excitation maxima of the emission wavelengths of 350, 435 and 700 nm yielded Table 3.
An interesting finding with Table 3 is when comparing the fluorescence emission values at 435 and 700 nm with price ($/L), p-values of less than 0.05 are calculated. This signifies that we fail to accept the null hypothesis and there is a correlation between price and excitation maxima for the fluorescence emission spectra at 435 and 700 nm. One possible reasoning for a higher excitation maximum is that the higher priced baijius could contain more flavor compounds. Lower priced baijius may not have been aged as long, and do not contain as many fluorescent compounds. Some limitations of fluorescence spectroscopy is that it does not reveal the chemical makeup of the baijiu spirits. To garner this information, it would be useful to utilize a mass spectrometry technique such as GC-MS, LC-MS, DART, etc. The broader picture of this study was that we were able to distinguish different baijiu samples using fluorescence spectroscopy along with being able to determine if a baijiu spirit was counterfeit by making different baijiu spirits.

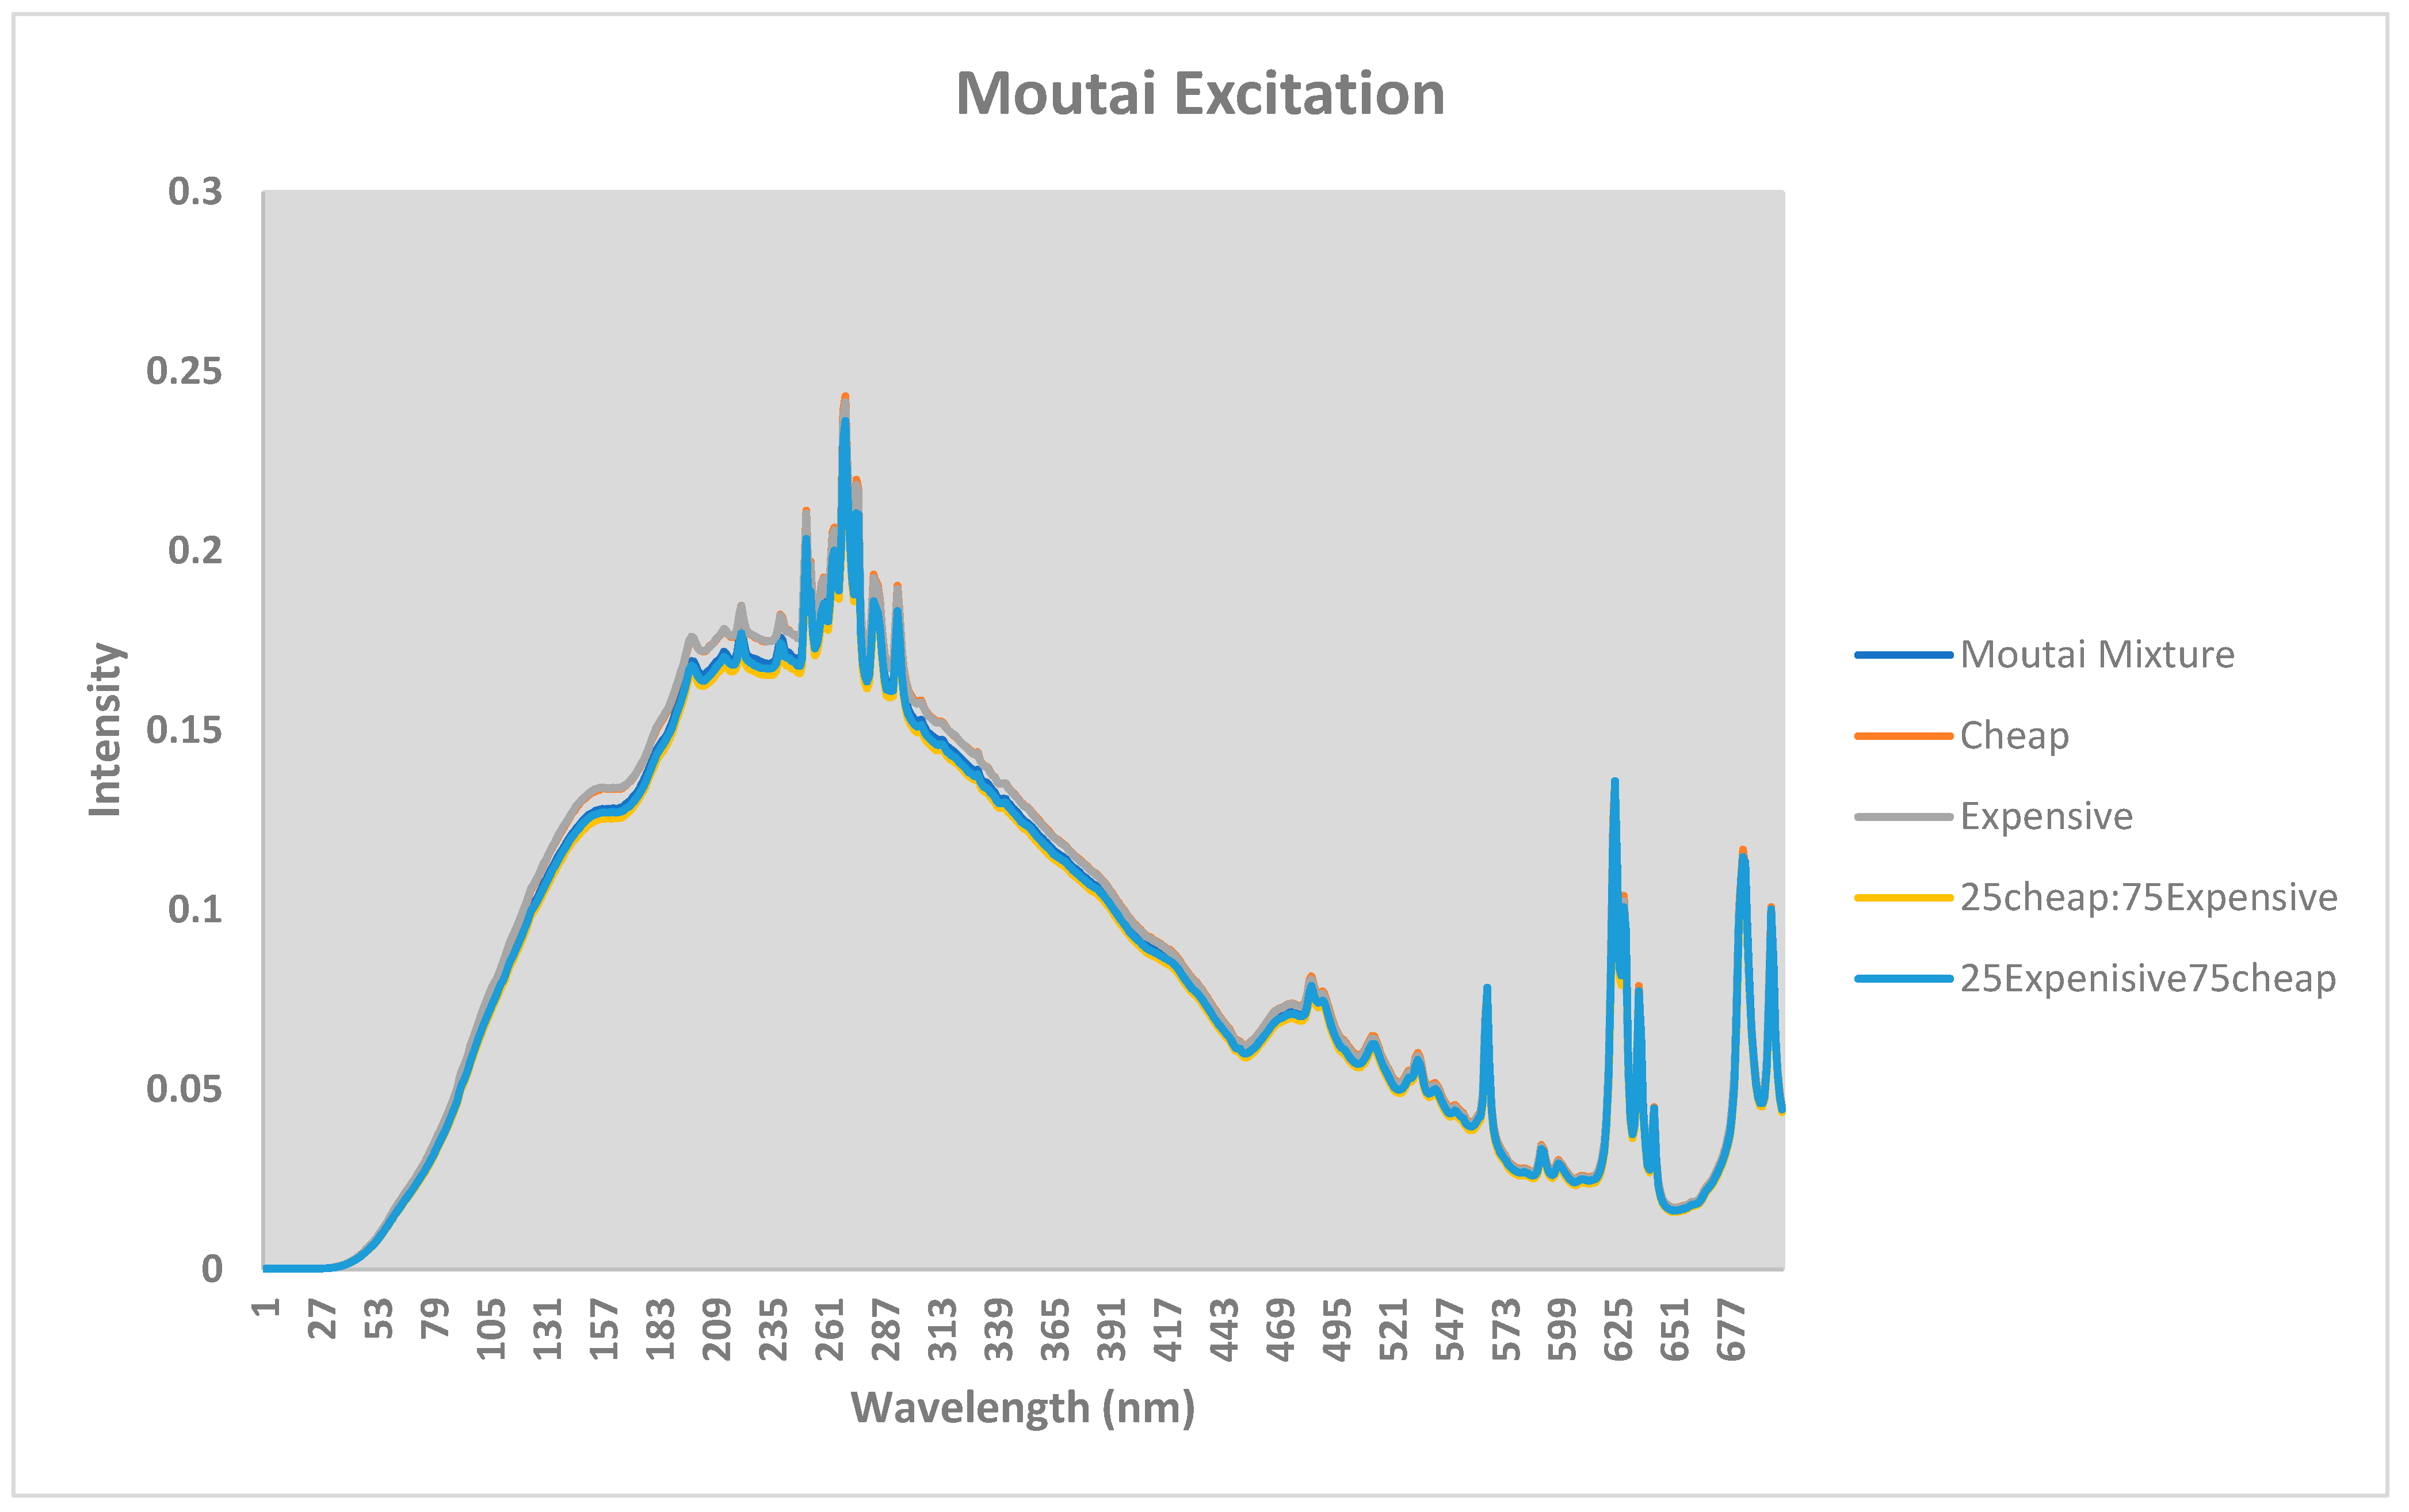
3.2. Fluorescence Spectra for Baijiu Mixtures

As counterfeiters are looking to maximize profits one of the ways to do this would be to mix an inexpensive baijiu with an expensive baijiu sample. In 2019 a total of forty-seven suspects were arrested in a baijiu scam in Shanghai; the police estimated the scam if sold genuine would have yielded USD 8.5 million [15]. To test the theory of distinguishing different mixtures, an inexpensive baijiu or Moutai sample were mixed with an expensive baijiu or Moutai spirit in a 25:75 mixture. The experiment was carried out in both directions as counterfeiters would still be able to profit if the spirit samples were 75:25 expensive to inexpensive. The different mixtures of Moutai and baijiu spirit were obtained by recording the emission spectrum and excitation spectrum for a series of wavelengths between 200 to 900 nm. As was seen previously the excitation spectra for both types of alcohol of mixtures was indistinguishable, as is shown in Figure 3 and Figure 4.

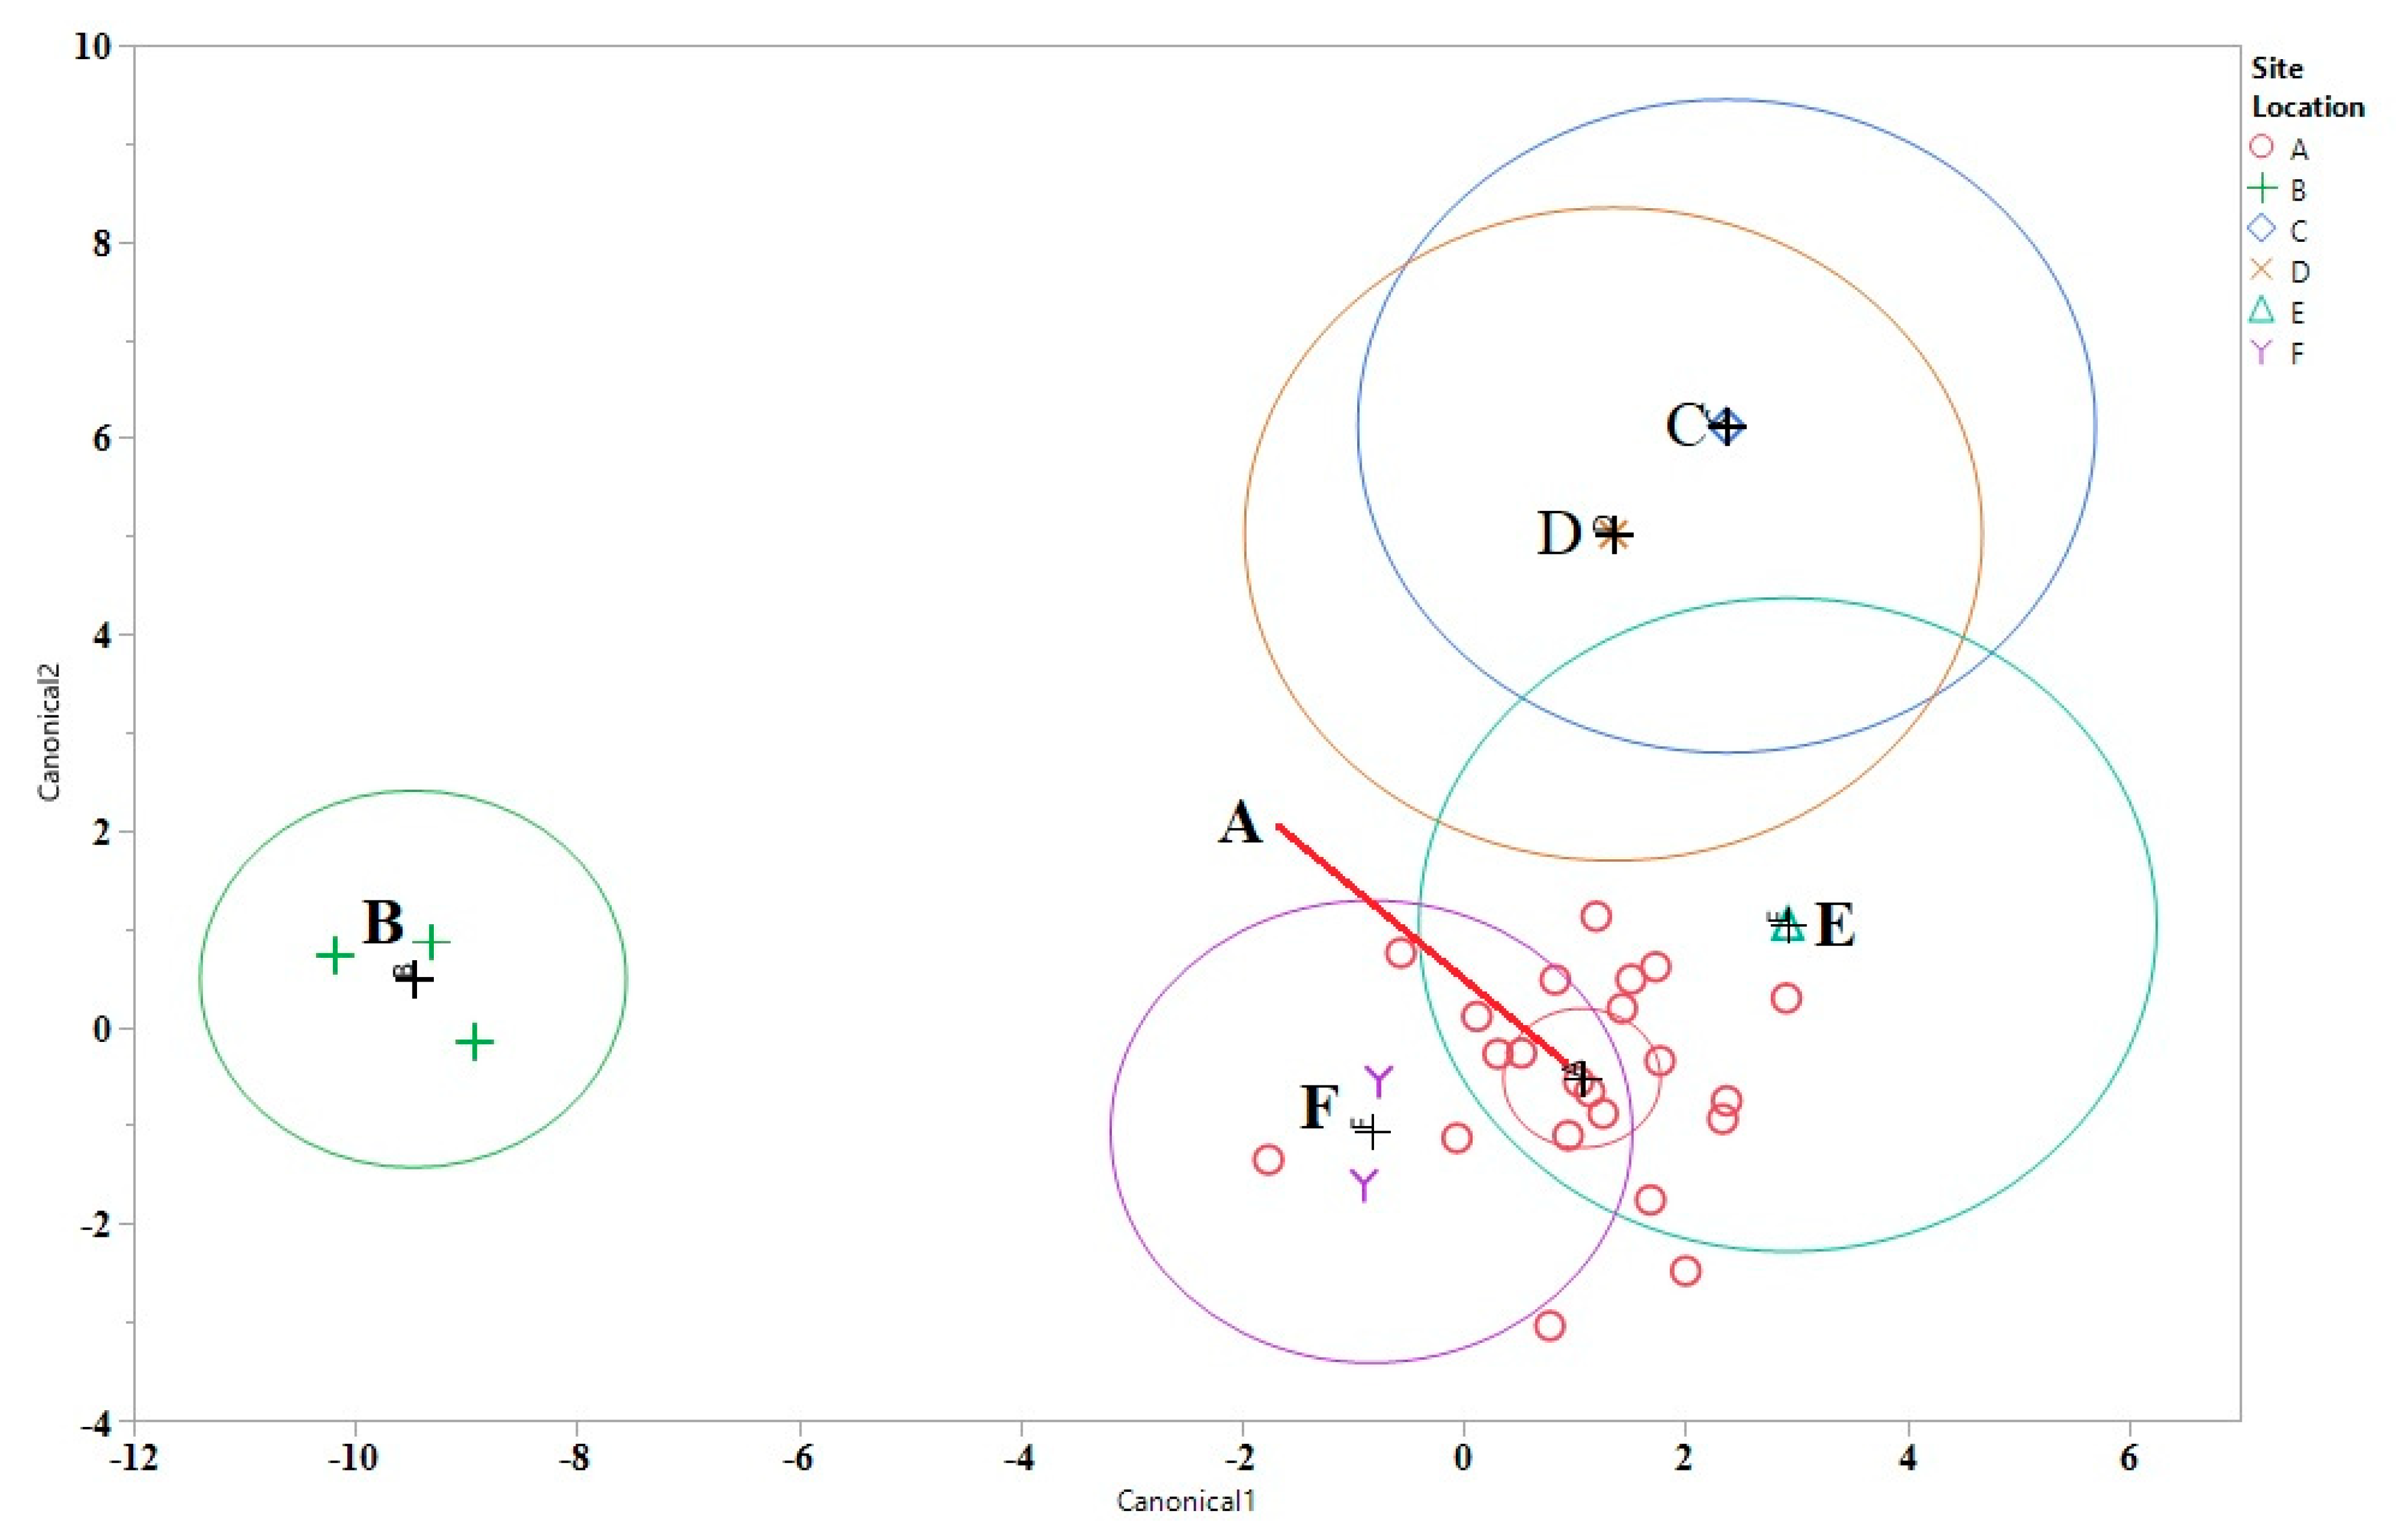
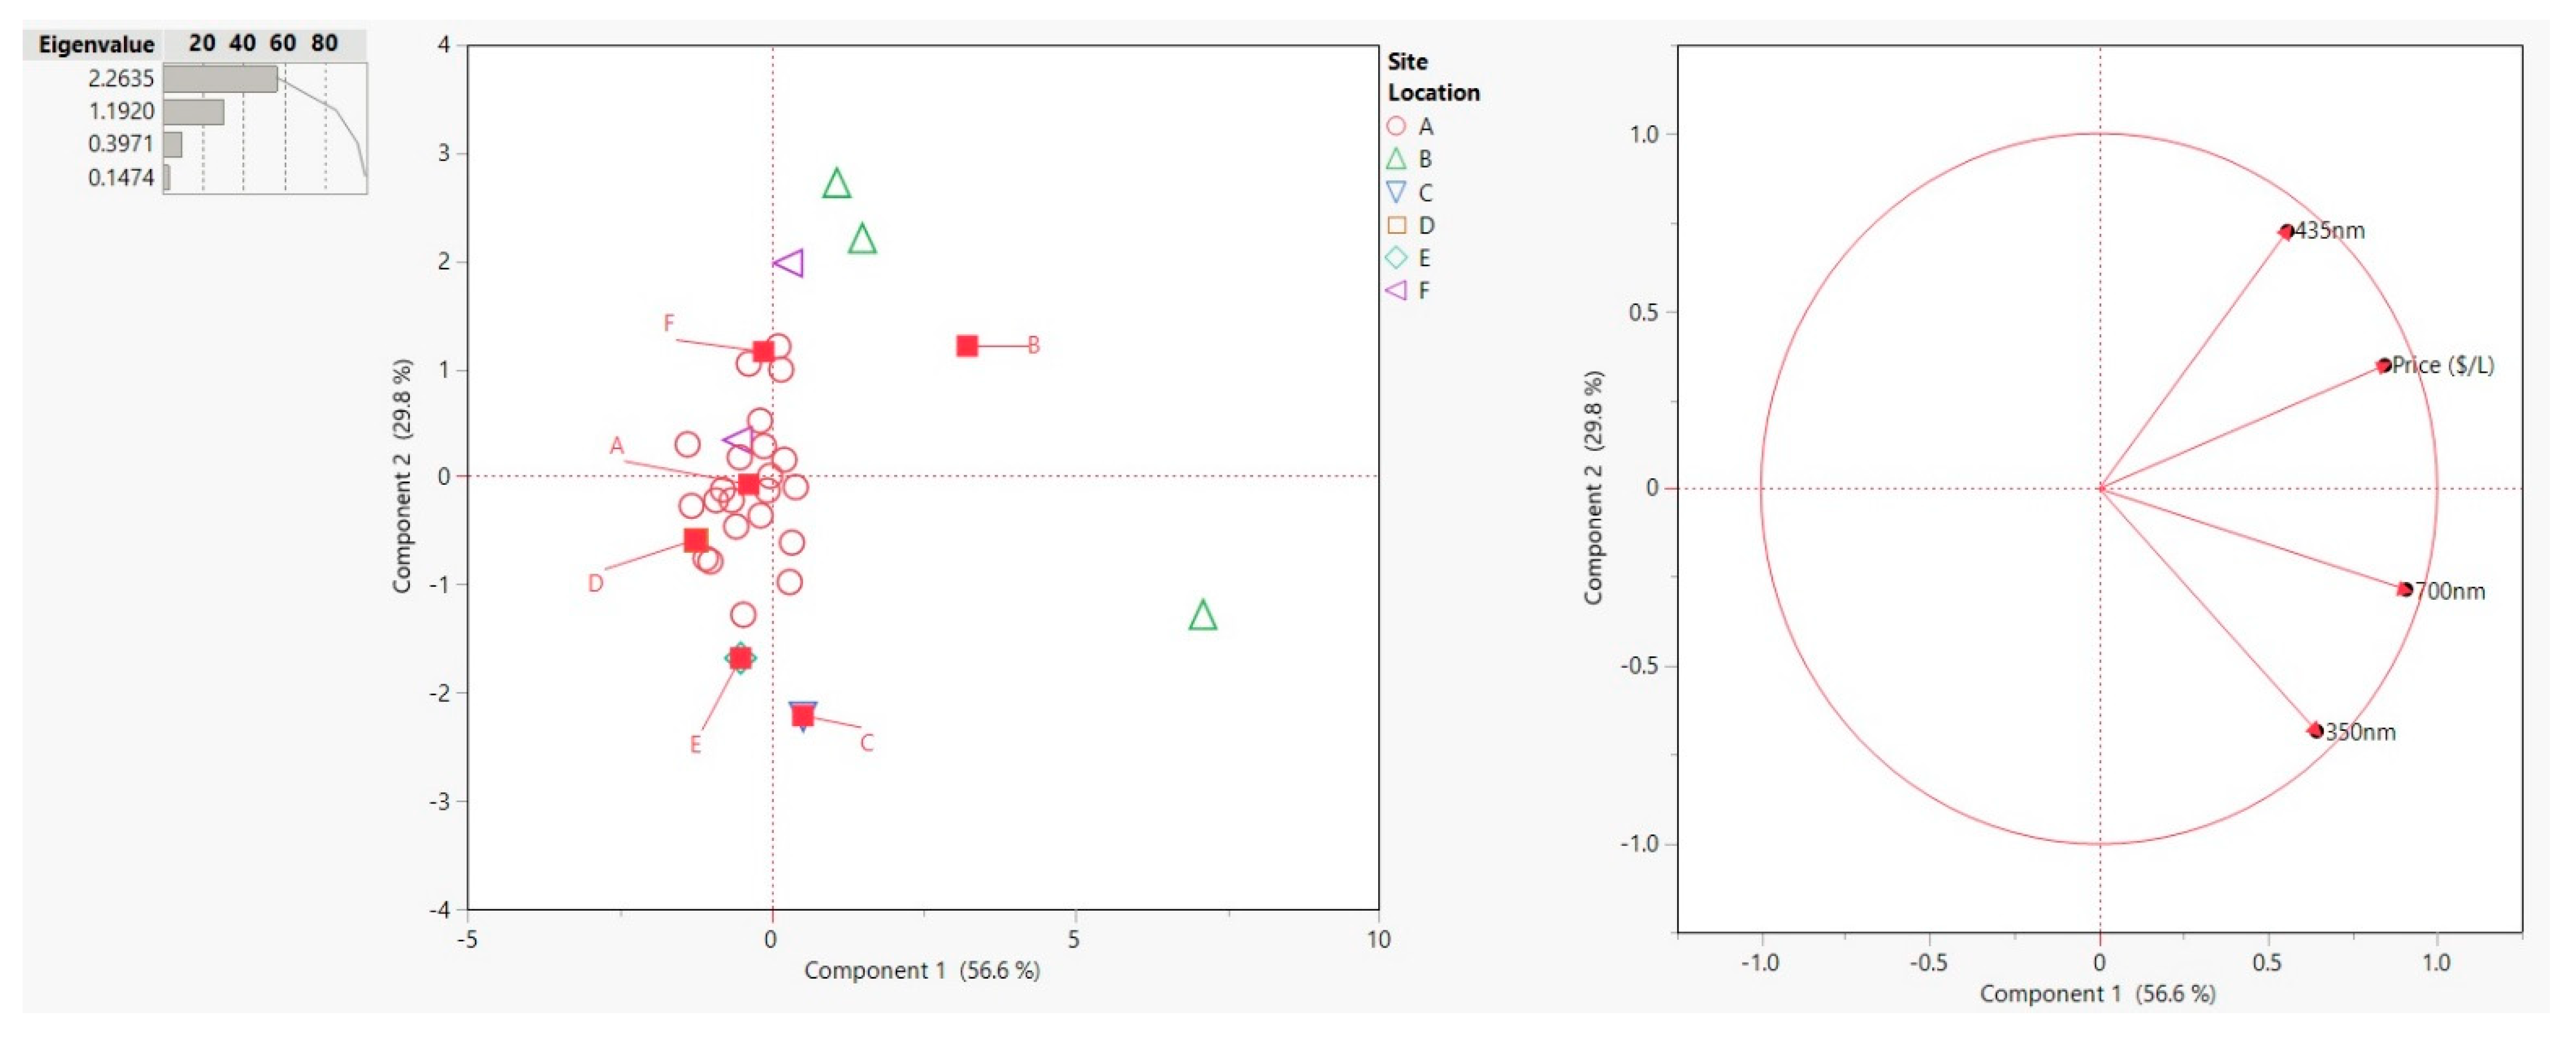
3.3. Chemometrics and Statistical Analysis

The usage of chemometrics to separate out the different distilleries builds upon a previous study by Zhang et al., who identified sauce-flavored Chinese baijiu by organic acids, trace elements, and stable carbon isotope ratios [16]. For the discriminate analysis plot all data were processed the same, using JMP 14. Data were normalized by using z-scores. The data included all fluorescence emission data and price data ($/L). Figure 7 is the linear discriminant analysis (LDA) plot of the data. The LDA plot shows good separation between the distilleries.
Site B had the highest prices and had higher values for the fluorescence emission at 435 and 700 nm. Sites C and D had similar fluorescence emission values at 435 and at 700 nm. Site A had the most samples with 21 and had the widest variety of variances amongst the calculated variables. As the sample size increases the utilization of chemometric techniques improves. Unfortunately we were limited to one sample from distilleries C, D, and E, but as the sample size increased for distilleries A, B, and F the groupings from the chemometric analysis became more discernible [17].
In the PCA model, the first two principal component axes resolve 86% of the total data variance. (Figure 8), the main trend is that the price is more strongly correlated with the emission at 435 nm as these two vectors have a small angle between them. Site location B had the two samples with the highest price as well as the samples with the highest emission spectra at 435 nm. On the opposite end of the score plot was site location E which was one of the lower priced samples.

4. Conclusions

Fluorescence spectroscopy is a reliable tool that can be employed for the determination of different baijiu spirits. In addition, fluorescence spectroscopy is capable of distinguishing between different ratios of baijiu and Moutai spirits. The fluorescent spectroscopy analysis reveals similar excitation and emission maxima occurring at 467, 765, 822, 883nm, and 350, 435, and 700 nm, respectively. The different intensity levels from the emission spectra provide a visual identity to the individual baijiu samples. Though the concentrations cannot be determined visually by the spectra, the change in shape or intensity of the spectra can be noted as potential adulteration of counterfeited baijiu samples. One unexpected fact this study showed was that this study proved when comparing price ($/L) with the two emission lines at 435 and 700 that this value is statistically significant with a p-value ≤ 0.05. The quality of a product is generally up to the consumer. Generally, a higher priced product will be a better quality product, with the higher emissions observed with the higher priced products; these products probably have more organic molecules that probably fluoresce due to aging and other factors that go into the production of baijiu. Although our approach does have limitations, fluorescence is a quick and simple methodology that can be implemented to develop information on either adulterated or unadulterated baijiu spirits. Fluorescence spectroscopy shows promising results in authenticating baijiu samples and giving preliminary information on adulterated or counterfeited baijiu samples. This study also demonstrates that chemometrics can be utilized to separate out different distilleries. The work from this study shows that a lab technician/lay person could utilize fluorescence spectroscopy to distinguish different baijiu spirits. This research opens the door for a quick commercialization method observing just three different fluorescence wavelengths to be able to identify counterfeit baijiu spirits. This work is preliminary work and the application as a routine analysis requires further studies on a greater number of samples, representative of a great number of spirit types, producers, and regions. As the authors were limited to 6 mL/sample, future studies could build upon this study further by investigating other aspects of why there is an increase in the emission spectroscopy by targeting specific trace metals or organic compounds in baijiu products.

Author Contributions

Conceptualization, R.L.B. and D.D.B.; Methodology, All authors; Validation, R.L.B. and D.D.B.; Resources, D.D.B., P.G. and J.C.E.; data curation; All authors; writing—original draft preparation, R.L.B. and D.D.B.; writing-review and editing, All authors, supervision and project administration, All authors. All authors have read and agreed to the published version of the manuscript.

Funding

This Research received no external funding.

Data Availability Statement

Data is available upon request.

Acknowledgments

The authors would like to thank Kimberly Savaglio for her work with the graphical abstract.

Conflicts of Interest

The authors declare no conflict of interest.

References

  1. Liu, H.; Sun, B. Effect of Fermentation Processing on the Flavor of Baijiu. J. Agric. Food Chem. 2018, 66, 5425–5432. [Google Scholar] [CrossRef]
  2. Xu, Y.; Sun, B.; Fan, G.; Teng, C.; Xiong, K.; Zhu, Y.; Li, J.; Li, X. The Brewing Process and Microbial Diversity of Strong Flavour Chinese Spirits: A Review. J. Inst. Brew. 2017, 123, 5–12. [Google Scholar] [CrossRef]
  3. Li, W.; Chen, S.-J.; Wang, J.-H.; Zhang, C.-Y.; Shi, Y.; Guo, X.-W.; Chen, Y.-F.; Xiao, D.-G. Genetic Engineering to Alter Carbon Flux for Various Higher Alcohol Productions by Saccharomyces Cerevisiae for Chinese Baijiu Fermentation. Appl. Microbiol. Biotechnol. 2018, 102, 1783–1795. [Google Scholar] [CrossRef] [PubMed]
  4. Zheng, X.-W.; Han, B.-Z. Baijiu, Chinese Liquor: History, Classification and Manufacture. J. Ethn. Foods 2016, 3, 19–25. [Google Scholar] [CrossRef] [Green Version]
  5. Casswell, S. Public Discourse on the Benefits of Moderation: Implications for Alcohol Policy Development. Addiction 1993, 88, 459–465. [Google Scholar] [CrossRef] [PubMed]
  6. Zhu, Y.-P. Chinese Materia Medica: Chemistry, Pharmacology and Applications; CRC Press: Boca Raton, FL, USA, 1998; ISBN 90-5702-285-0. [Google Scholar]
  7. Wu, J.; Huo, J.; Huang, M.; Zhao, M.; Luo, X.; Sun, B. Structural Characterization of a Tetrapeptide from Sesame Flavor-Type Baijiu and Its Preventive Effects against AAPH-Induced Oxidative Stress in HepG2 Cells. J. Agric. Food Chem. 2017, 65, 10495–10504. [Google Scholar] [CrossRef] [PubMed]
  8. Yang, T.; Li, G.; Wu, L.; Zhuang, M. Research on Health Factor in Liquor & Breeding of Health Factor-Producing Bacteria and Its Application in Liquor Production (I) Research on Health Factors in Chinese Liquor. Liquor-Mak. Sci. Technol. 2010, 12, 65–69. [Google Scholar]
  9. Li, C.U.I. Nutrition Component of Chinese Liquor and Its Benefit to Human Health. Liquor Mak. 2008, 1, 15–18. [Google Scholar]
  10. Huang, F.L.; Wang, H.B. Analysis on the Relationship between Chinese Liquor and Health. Liquor Mak. 2013, 40, 14–19. [Google Scholar]
  11. Veith, I. The Yellow Emperor’s Classic of Internal Medicine; University of California Press: Berkley, CA, USA, 2015; ISBN 0-520-96324-5. [Google Scholar]
  12. Ya, Z.; He, K.; Lu, Z.; Yi, B.; Hou, C.; Shan, S.; Huo, D.; Luo, X. Colorimetric Artificial Nose for Baijiu Identification. Flavour Fragr. J. 2012, 27, 165–170. [Google Scholar] [CrossRef]
  13. Rye, H.S.; Dabora, J.M.; Quesada, M.A.; Mathies, R.A.; Glazer, A.N. Fluorometric Assay Using Dimeric Dyes for Double-and Single-Stranded DNA and RNA with Picogram Sensitivity. Anal. Biochem. 1993, 208, 144–150. [Google Scholar] [CrossRef] [PubMed]
  14. Beć, K.B.; Grabska, J.; Bonn, G.K.; Popp, M.; Huck, C.W. Principles and Applications of Vibrational Spectroscopic Imaging in Plant Science: A Review. Front. Plant. Sci. 2020, 11, 1226. [Google Scholar] [CrossRef] [PubMed]
  15. Chan, M. Huge Fake Baijiu Scam Busted. Available online: https://www.baijiublog.com/huge-fake-baijiu-scam-busted/ (accessed on 10 February 2021).
  16. Zhang, J.; Tian, Z.; Ma, Y.; Shao, F.; Huang, J.; Wu, H.; Tian, L. Origin Identification of the Sauce-Flavor Chinese Baijiu by Organic Acids, Trace Elements, and the Stable Carbon Isotope Ratio. J. Food Qual. 2019, 2019, 7525201. [Google Scholar] [CrossRef] [Green Version]
  17. Sharaf, M.A.; Illman, D.L.; Kowalski, B.R. Chemometrics; John Wiley & Sons: Hoboken, NJ, USA, 1986; Volume 117, ISBN 0-471-83106-9. [Google Scholar]
Figure 1. Excitation spectrums of all thirty baijiu samples.
Beverages 07 00065 g001
Figure 2. Emission spectra of all thirty baijiu samples. The excitation spectra for all thirty baijiu spirits did not have any distinguishable differences and had maxima at 467, 765, 822, and 883 nm. Differences in the emission spectra were observed corresponding to the intensity levels at the observed maxima 350, 435, and 700 nm; the excitation wavelength used was for emission was 350 nm. Table 1 shows price differences for the different samples that were analyzed. Sample brand names were left off due to privacy.
Beverages 07 00065 g002
Figure 3. Moutai excitation of different ratios of inexpensive to expensive Moutai spirits.
Beverages 07 00065 g003
Figure 4. Baijiu spirit excitation of different ratios of inexpensive to expensive baijiu spirits. Visual differences can be noted in the emission spectra for both mixtures, which can be seen in Figure 5 for Moutai and Figure 6 for baijiu spirits.
Beverages 07 00065 g004
Figure 5. Moutai emission of different ratios of inexpensive to expensive baijiu spirits.
Beverages 07 00065 g005
Figure 6. Baijiu emission of different ratios of inexpensive to expensive baijiu spirits. Generally, the inexpensive alcohol had the lowest intensity, and the most expensive alcohol had the highest or second highest intensity. The intensity values of the 50:50 mixtures for both alcohols exist between the most expensive and least expensive alcohol intensity level. The 25:75 inexpensive to expensive baijiu spirit mixture appeared between the 50:50 mixture intensity level and the cheap baijiu spirit intensity level. Even though the concentrations cannot be distinguished, there is still a visual difference between concentrations that can be used to determine differences in the purity for a specific spirit. The differentiation of the visual aspects of the mixture spectra can provide preliminary details of possible adulteration of baijiu spirits. This can be detected visually by the fluorescence spectra even when limited to mixing similar formulated spirits.
Beverages 07 00065 g006
Figure 7. LDA plot of data.
Beverages 07 00065 g007
Figure 8. Principal component analysis (PCA) with the score plot on the left side and loading plot on the right side. The plots models 86% of the total data variance. Variance proportions are shown along each component axis.
Beverages 07 00065 g008
Table 1. Baijiu spirit samples and price/L in USD.
Alcohol NamePrice ($/L)ABVAlcohol NamePrice ($/L)ABV
Spirit 1112353Spirit 1611946
Spirit 285658Spirit 1710840
Spirit 370953Spirit 1810466
Spirit 438158Spirit 1910453
Spirit 535458Spirit 2010353
Spirit 632240Spirit 219056
Spirit 729638Spirit 227846
Spirit 826738Spirit 237738
Spirit 920740Spirit 247158
Spirit 1019956Spirit 257056
Spirit 1118356Spirit 267053
Spirit 1217143Spirit 276158
Spirit 1314043Spirit 285958
Spirit 1413650Spirit 294052
Spirit 15129.5846Spirit 3023.7738
ABV: Alcohol by volume.
Table 2. Correlation table relation of price to emission wavelength—R values.
Price ($/L)350 nm435 nm700 nm
Price ($/L)1
350 nm0.231
435 nm0.57−0.021
700 nm0.660.690.261
Table 3. Regression table statistics.
CoefficientsStandard Errort Statp-ValueLower 95%Upper 95%Lower 95.0%Upper 95.0%
Intercept4.18 × 1022.99 × 1021.400.17−1.97 × 1021.03 × 103−1.97 × 1021.03 × 103
350 nm−4.23 × 10−52.49 × 10−5−1.700.10−9.34 × 10−58.84 × 10−6−9.34 × 10−58.84 × 10−6
435 nm2.35 × 10−58.10 × 10−62.900.0086.83 × 10−64.01 × 10−56.83 × 10−64.01 × 10⁻⁵
700 nm9.83 × 10−42.25 × 10−44.370.00025.21 × 10−41.44 × 1035.21 × 10−41.44 × 10⁻³
Publisher’s Note: MDPI stays neutral with regard to jurisdictional claims in published maps and institutional affiliations.

