
Beer Quality Evaluation—A Sensory Aspect


Faculty of Food Technology Osijek, Josip Juraj Strossmayer University of Osijek, F. Kuhača 20, 31000 Osijek, Croatia
*
Authors to whom correspondence should be addressed.
Beverages 2022, 8(1), 15; https://0-doi-org.brum.beds.ac.uk/10.3390/beverages8010015
Submission received: 13 February 2022
/
Accepted: 23 February 2022
/
Published: 2 March 2022
Abstract
:The world’s beer market has never been more diverse. Most beers are produced in modern and technologically advanced breweries that use high quality raw materials, thus resulting in minor differences of physical–chemical properties between various beers (of the same style). However, consumers focus on constant quality and sensory properties of their chosen beer. Sensory evaluation is not an easy task and involves flexible methods for determination of differences and changes between beers. It is commonly used in breweries to provide constant quality of finished products, but also to ensure the quality of different raw materials (water, malt, hops) and to minimize the influence of the production process on final quality of beer.
1. Introduction
Beer is one of the most consumed beverages in all corners of the world. Due to its popularity and the quantity of produced beer, this is a truly competitive market, especially since the industry is always trying to attract new and younger customers. The craft beer movement is on the rise and is offering many different sensory aspects of beer. To ensure the quality of raw materials and of finished products, sensory analysis should be a mandatory tool. It is a method of evaluating beer quality by using only the senses of an individual panelist. Most usual beers’ properties that require constant evaluation are freshness, quality, craftsmanship, balance, conformity to style or brand, and drinkability [1]. Beer’s taste and smell should be evaluated to obtain the information on how different people react to different products, to determine which group of people likes a certain type of beer [2].
Despite the achieved stability of beer, colloidal, and non-colloidal, all beers are susceptible to changes of sensory properties over time [3]. Improper storage (UV light, temperature fluctuations), transport and finally the serving of beer affects (and impairs) its characteristic sensory properties. In order to ensure the quality of beer on the market, quality control is a common procedure in the brewery. There are several steps in the brewing industry that should be monitored to ensure a quality beer:
- Prior and after packaging;
- Monitoring of beer prior to release to the market;
- Evaluation of samples from the market.
Troubleshooting the flavor-stability issues, microbiological problems, and taint incidents and evaluation of trial samples to support process or product improvement are important steps as well [4]. There are many commercially [5,6,7,8] available sensory test methods, and they all try to comprehensively capture the shortcomings of other sensory test methods.
Evaluating beer is not an easy task. Beer is comprised of more than 800 chemical compounds originating from different raw material (malt, yeast, water and hops), and many of them are formed during maturation and storage. Sensory evaluation of beer is a serious job that often comes down to the number of panelists (evaluators) and to the words they would use to describe the appearance of one property [9]. Sensory analysis consists of several steps shown in Table 1 [9].
Even though many food products, including beer, can be evaluated via electronic nose or tongue, choosing humans for such evaluation is a better choice because panelists can take into consideration and provide a holistic experience of the tasted beer [9]. Determining quality in the food industry, especially in brewing, is very hard, since consumers have a different viewpoint on what a quality product means for them. For some, quality is associated with exclusivity and high price. Others view quality as affordable and not pricey or products they traditionally buy for years. In a nutshell, if it is not valued by the consumer, it is a waste of time (and money) for the company. So, in order to have a satisfied consumer, it is important to deliver a product free from defects, consistent with all previous batches with a corresponding sensory profile [9].
2. Sensory Analysis Applied to Beer
2.1. Sensory Analysis in General
Sensory analysis is defined as a science discipline dealing with the evaluation of flavored sensations. It emerged as a scientific discipline in the 20th century, and was defined as evaluation of organoleptic character of foodstuff and exclusively by human senses [10]. Nonetheless, sensory analysis was a crucial part of human history, and it was used in the determination of edible and non-edible substances, as well a distinct evaluation of different and preferable foods.
Sensory evaluation consists of five basic senses [10]:
- -
- Olfactometric–smell;
- -
- Gustatory–taste;
- -
- Haptic–touch;
- -
- Optic–vision;
- -
- Acoustic–hearing.
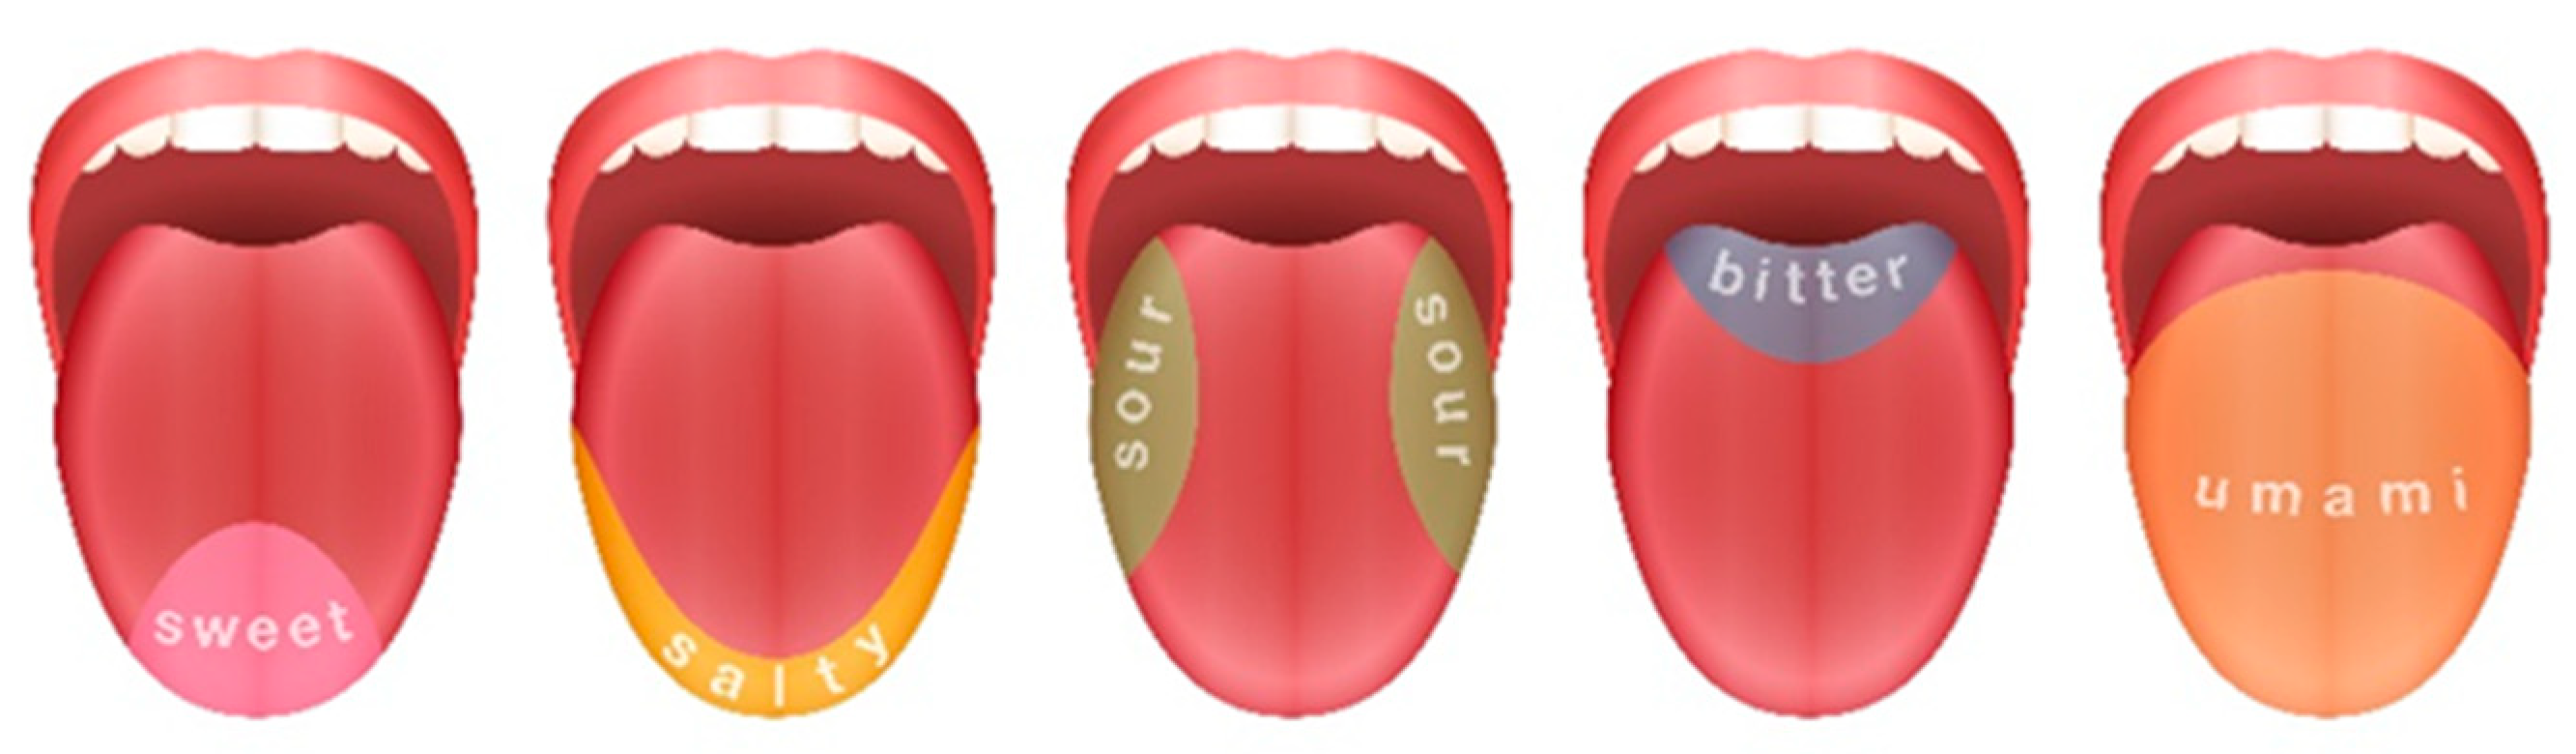
Senses of smell and taste are narrowly connected, and if one of them is corrupted, the other will be less sensitive to stimuli. Human tongue and taste receptors are shown in Figure 1.
Since beer is such a complex beverage, consisting of many volatile compounds, it is important to use all senses, including smell.
There are several conditions that should be met when it comes to beer sensory evaluation: taste neutralizers such as salami (not spicy or too salty), cheese (sans aromas and spices), and bread (plane white) [9,10] should be used. Technical conditions that are required for a successful sensory analysis of beer include appropriate glassware, number of samples (6–8 per hour), amount of the sample in the glass, technique of degustation, time of the analysis (ideal is between 10–11 A.M.) [10].
2.2. Analysing Beer
What to for look in beer? What defines the quality of beer? Why conduct a sensory analysis? Certainly, some of the important components and quality traits are the visual attributes such as foam volume, foam persistence, color, and clarity. Usually, they correlate with the consumers’ first impression, leading to a liking or disliking response. Alcohol content (correlated with sweetness), carbon dioxide content (also related with the visual attributes, mouthfeel and release of aromas), and the absence of off–flavors greatly affect the acceptance among the consumers [11,12,13,14]. Characteristics of beer quality (or of good beer) are [10] generally dependent on the beer style, but some basic properties include:
- Pleasant characteristic smell;
- High mouthfeel;
- Good fulness (body);
- Bitterness with a good quality (not astringent);
- Without off-flavors.
The evaluator has to know and understand the basic beer production process and raw materials used for production. This is important, since many aromas and tastes originate from different raw materials.
As mentioned before, sensory analysis of beer is complex since beer consists of over 800 chemical compounds. The dynamics and mechanisms of aroma release from model systems show that aroma release in alcoholic beverages is more complex than in other beverages and that further studies are required to provide insights into how aroma is perceived in a glass prior to consumption. To avoid discrepancies and obtain uniform results, panelists are asked to follow the same tasting procedure for each sample [15].
To assess the appearance, beer foam for head depth, bubble size and color and lacing (foam adhering to the glass during consumption) should be evaluated. Beer color and clarity should also be considered. Some sensory evaluation methods [8] do not consider the appearance since it can be quantified by using physical–chemical methods in the lab which are considered to be objective.
Aroma can be best evaluated after swirling the beer in the glass. A lid or a hand can be used to trap the volatile components into the headspace of a glassware. After the lid is removed, it is important to remember the initial aroma. Certain notes will surely pop out right away, such as sulfuric compounds. Small sniffs are required to identify any other volatiles.
Taste can be detected to take a sample into the mouth and swirl to cover all of the inside of the mouth and tongue. It is important to completely fill the mount with beer because, as can be seen from Figure 1, taste buds for different tastes are located on different parts of the tongue. For example, bitterness can be detected toward the back of the tongue and after swallowing. Mouthfeel, a different characteristic, can parallelly be detected during tasting. The aftertaste can be recognized after swallowing [15]. Mouthfeel is a sensation of the haptic perception of the food product on the surface of the oral cavity (the sparkling of carbon dioxide, the oiliness of fats, and astringency) [16,17,18,19,20]. All components sum up the perceived flavor as a result of complex reactions between the senses, as can be seen from Figure 2. A good example is when beers with higher CO2 content taste more sour but less astringent.
3. Sensory Analysis Requirements
To provide objective sensory analysis and to avoid greater mistakes while evaluating, many requirements have to be met, but first and foremost is to choose a leader of the panel. A dedicated leader who would meticulously take care of all the preparations, supervise the analysis and analyze the results if necessary. A leader has to govern and organize many things, yet this can become tedious, so the leader must also work on being motivated and on top of things all the time [9]. Things to considered if being a leader are reported in the following sub-sections.
3.1. Space and Equipment
Space in which the sensory analysis would take place has to be suitable for it. It would be ideal if it would be a dedicated room with tasting booths, natural lighting, and a kitchen with running water, a fridge and a dishwasher [9].
In case this is not available, the room should be separated to avoid noises and strong smells, especially if the analysis is done in the production facility. Besides, it should be clean and bright and provide enough space to accommodate all of your panelists comfortably. Additional requirements include stabile temperature (21 °C), air humidity around 80%, panelist should be separated by panels, there should be no carpet in the room, colors should be neutral and no smoking allowed [9,10].
3.2. Samples
Samples should be collected and stored correctly. Storage temperature should be kept cool, at approx. 4 °C. Minimal temperature should be no less than 2 °C and storage time should not be longer than 2 or 3 weeks prior to testing. The storage facility should be dark, no UV light in it and no strange odors are allowed (musty notes can enter beer even through the bottle cap). However, serving should be done at room temperature. Samples should be anonymous and served randomly. Identification can take place after the testing [4,9,10]. Samples are to be poured into the glass prior serving them to the panelists. Additionally, if more than one package of the same beer is to be served to the panelists, it is good to open multiple bottles and combine them into one serving glassware to avoid uneven flavors. Namely, flavors and smells in one bottle can be significantly different than the ones in another bottle so it is better to mix it up and make a uniform serving [4].
Samples are to be designated with three-digit numbers, not with only one number or letter. To avoid bias reaction from the panelists, it is recommended to shuffle the samples, make their distribution random [4].
3.3. Sensory Methods
Choosing the appropriate sensory method that can be applied by all of your panelists is very important. Documents that can comprehensively unite all of the information, and appropriate and correct labeling of the samples is crucial for further analysis [9]. A more detailed overview of this subsection will be elaborated in Section 4. Methods of sensory analysis.
3.4. Panel
Even though participation in a sensory panel seems like a reward for the employee, it can be a difficult task. However, this analysis is just as important as any other quality analysis, chemical or microbiological. In order to get a functional panel, you have to consider the human factor, meaning that physical and physiological state of a panel member can influence the result. A runny nose caused by colds or allergies directly impact the ability to taste, but other conditions, such as stress, can also impair concentration and the capacity to taste. Human factor also includes the susceptibility to assume what is expected from the panelist so he/she can act upon it or try to find out the opinion of other panel members. Panelists can become unobservant or tired of perpetual analysis. This can be resolved by implementing different (competitor) beers or impaired samples (spiking with flavor standards) [9].
Panelist familiar with the product should only be used for descriptive or difference testing. They should not be used for any type of preference testing or any testing relating them to a “traditional” consumer.
The goal of every training program is to recognize the possibilities for every beer sensory panelist and to help him achieve his maximum in distinction as much flavors and smells as possible. Adopting a standardized lexicon that can help him describe the sensations is also an imperative [2].
Starting sessions can be done in a fortnight, every day during weekdays. The program has to be short, but efficient, in order not to provoke any resistance toward it. To increase the flexibility, programs should be standardized and provide easily accessible leaning materials adjusted to all types of candidates [2].
4. Methods for Beer Analysis
Different sensory analysis methods are used in beer evaluation. Each of them has a purpose to give the investigator the needed information. Generally, there are five basic sensory evaluation methods: difference tests, descriptive tests, ranking tests, free-choice test, drinkability test. Sometimes a mixture of methods is needed in order to get the full picture on investigated properties [2]. Some of the tests and their applications are shown in Table 2.
Most common sensory tests in the brewing industry are triangular and tetrad tests (difference tests). Duo-trio test and 2-out-of-5 tests are also descriptive tests that can be used in brewing industry. Difference tests are useful if you aim to determine if there is a detectable difference between samples with triangular test being the most widely used test in the industry. However, in order to obtain statistically important data, at least 24 participants are needed. This test informs the investigator that there is a detectable difference (or not), but it provides no information about the intensity or the nature of difference. It is approachable since it requires no training and anyone can do it. Tetrad test is similar, but it requires a tester to pair up the two different beers (you get two samples of beer A and two samples of beer B). The number of panelists in a tetrad test is only 8, and it is more facile to pair the same samples than to find the odd one [9].
In case you need a more detailed sensory report, i.e., to determine and describe the flavor profile of a beer, a descriptive test is the correct choice. The accurate identification of a problematic smell or taste demands the knowledge of sensory analysis terminology in brewing, and mostly requires trained panelists. Descriptive tests rely on free-choice profiling and QDA® (quantitative descriptive analysis®) tests [9]. Free-choice profiling can be conducted with no training. They taste the beer and give their own description of any impression they detected. QDA® relies on the identification of flavors present in the beer, but also to quantify their intensity. The scale of quantification can be arbitrary, but identical for all panelists. This method requires intensive and continuous training of at least 8–10 panelists [9].
Certainly, one of the more interesting sensory tests is the drinkability test. It basically consists of giving several kinds of beer (different malt/adjuncts ratio; degree of attenuation) to the consumers. Each beer is given to a healthy volunteer at the rate of 3 mL/kg body weight in spaces of 15 min apart. The drank volume gets noted, so the beer resulting with the highest drank volume is designated as highly drinkable. Other factors, such as stomach fullness or tastiness can be observed as well [21,22,23,24]. An excellent paper written by Čejka et al. [25] extensively describes the drinkability method and offers different evaluation techniques for this test. Čejka et al. report that drinkability method fundamentally differs from the sensory evaluation since the aim of sensory evaluation is to acquire details about beer’s organoleptic properties via trained panelists while drinkability can be carried out with dedicated consumers. The aim of this test is to invoke the subconscious preferences of a consumer while drinking beer in a relaxed atmosphere, which is best done by using a Mondiac Research Design. The preferred beer (measured in drank volume) will be judged as preferable [25].
Dynamic methods (measured over time) are taking place in beer sensory analysis. Wakihira et al. [26] reported an interesting article about drinkability using a dynamic method Temporal Dominance of Sensations (TDS) focused on flavor attributes [27]. TDS is a descriptive multi-attribute methodology and regards to attribute interactions [28]. It involves the description of the general product perception resulting in a real-time flavor profile [29]. In short, TDS provides supplementary temporal information, perceived during the drinking process, and relates them with qualitative changes not measurable with the usual sensory profile analysis methods. This method saves more time than other dynamic methods [30].
The results reported by [26] emphasized the importance of monitoring dynamic wanting over sips since product differences in wanting were nonexistent at the beginning and over time became more important. It turned out that the product with the highest wanting score was designated as lower in standout flavor. This implies that beer with greater sensory load is not as desired as the one with less flavor.
Sensory analysis is a very important economic factor. For example, if the difference test is not done properly, the consequence could be a drop of beer sales since the consumers notice the difference in beer quality and dislike the non-consistency in production. More examples are noted in Table 3.
In any case, to conduct a sensory analysis and to obtain reliable data, a panel needs to be formed and educated. The most important part of the beer sensory evaluation training is the use of standardized, internationally recognized terminology. The combined efforts of the European Brewing Convention, American Association of Brewing Chemists and Master Brewers of America resulted in standardized terminology graphically expressed via The Flavor Wheel [2,15]. The Flavor Wheel can be accessed and seen in different literature [6,7,15,20,43] that reproduced the wheel with permission from the American Society of Brewing Chemists, St. Paul, MN, USA. The Flavor Wheel consists of different flavor terms that are usual in the brewing technology. It is composed of 14 different classes (basic terms), familiar in the brewing industry (aromatic, cereal, mouthfeel, etc.). To narrowly describe a flavor, classes are divided on 1st tier terms (alcoholic, solvent-like, etc.) and 2nd tier terms (spicy, woody, walnut, etc.). There are 44 objective terms of the first tier and 78 terms of the second tier [44,45].
5. Analysis and Interpretation of Sensory Tests Data
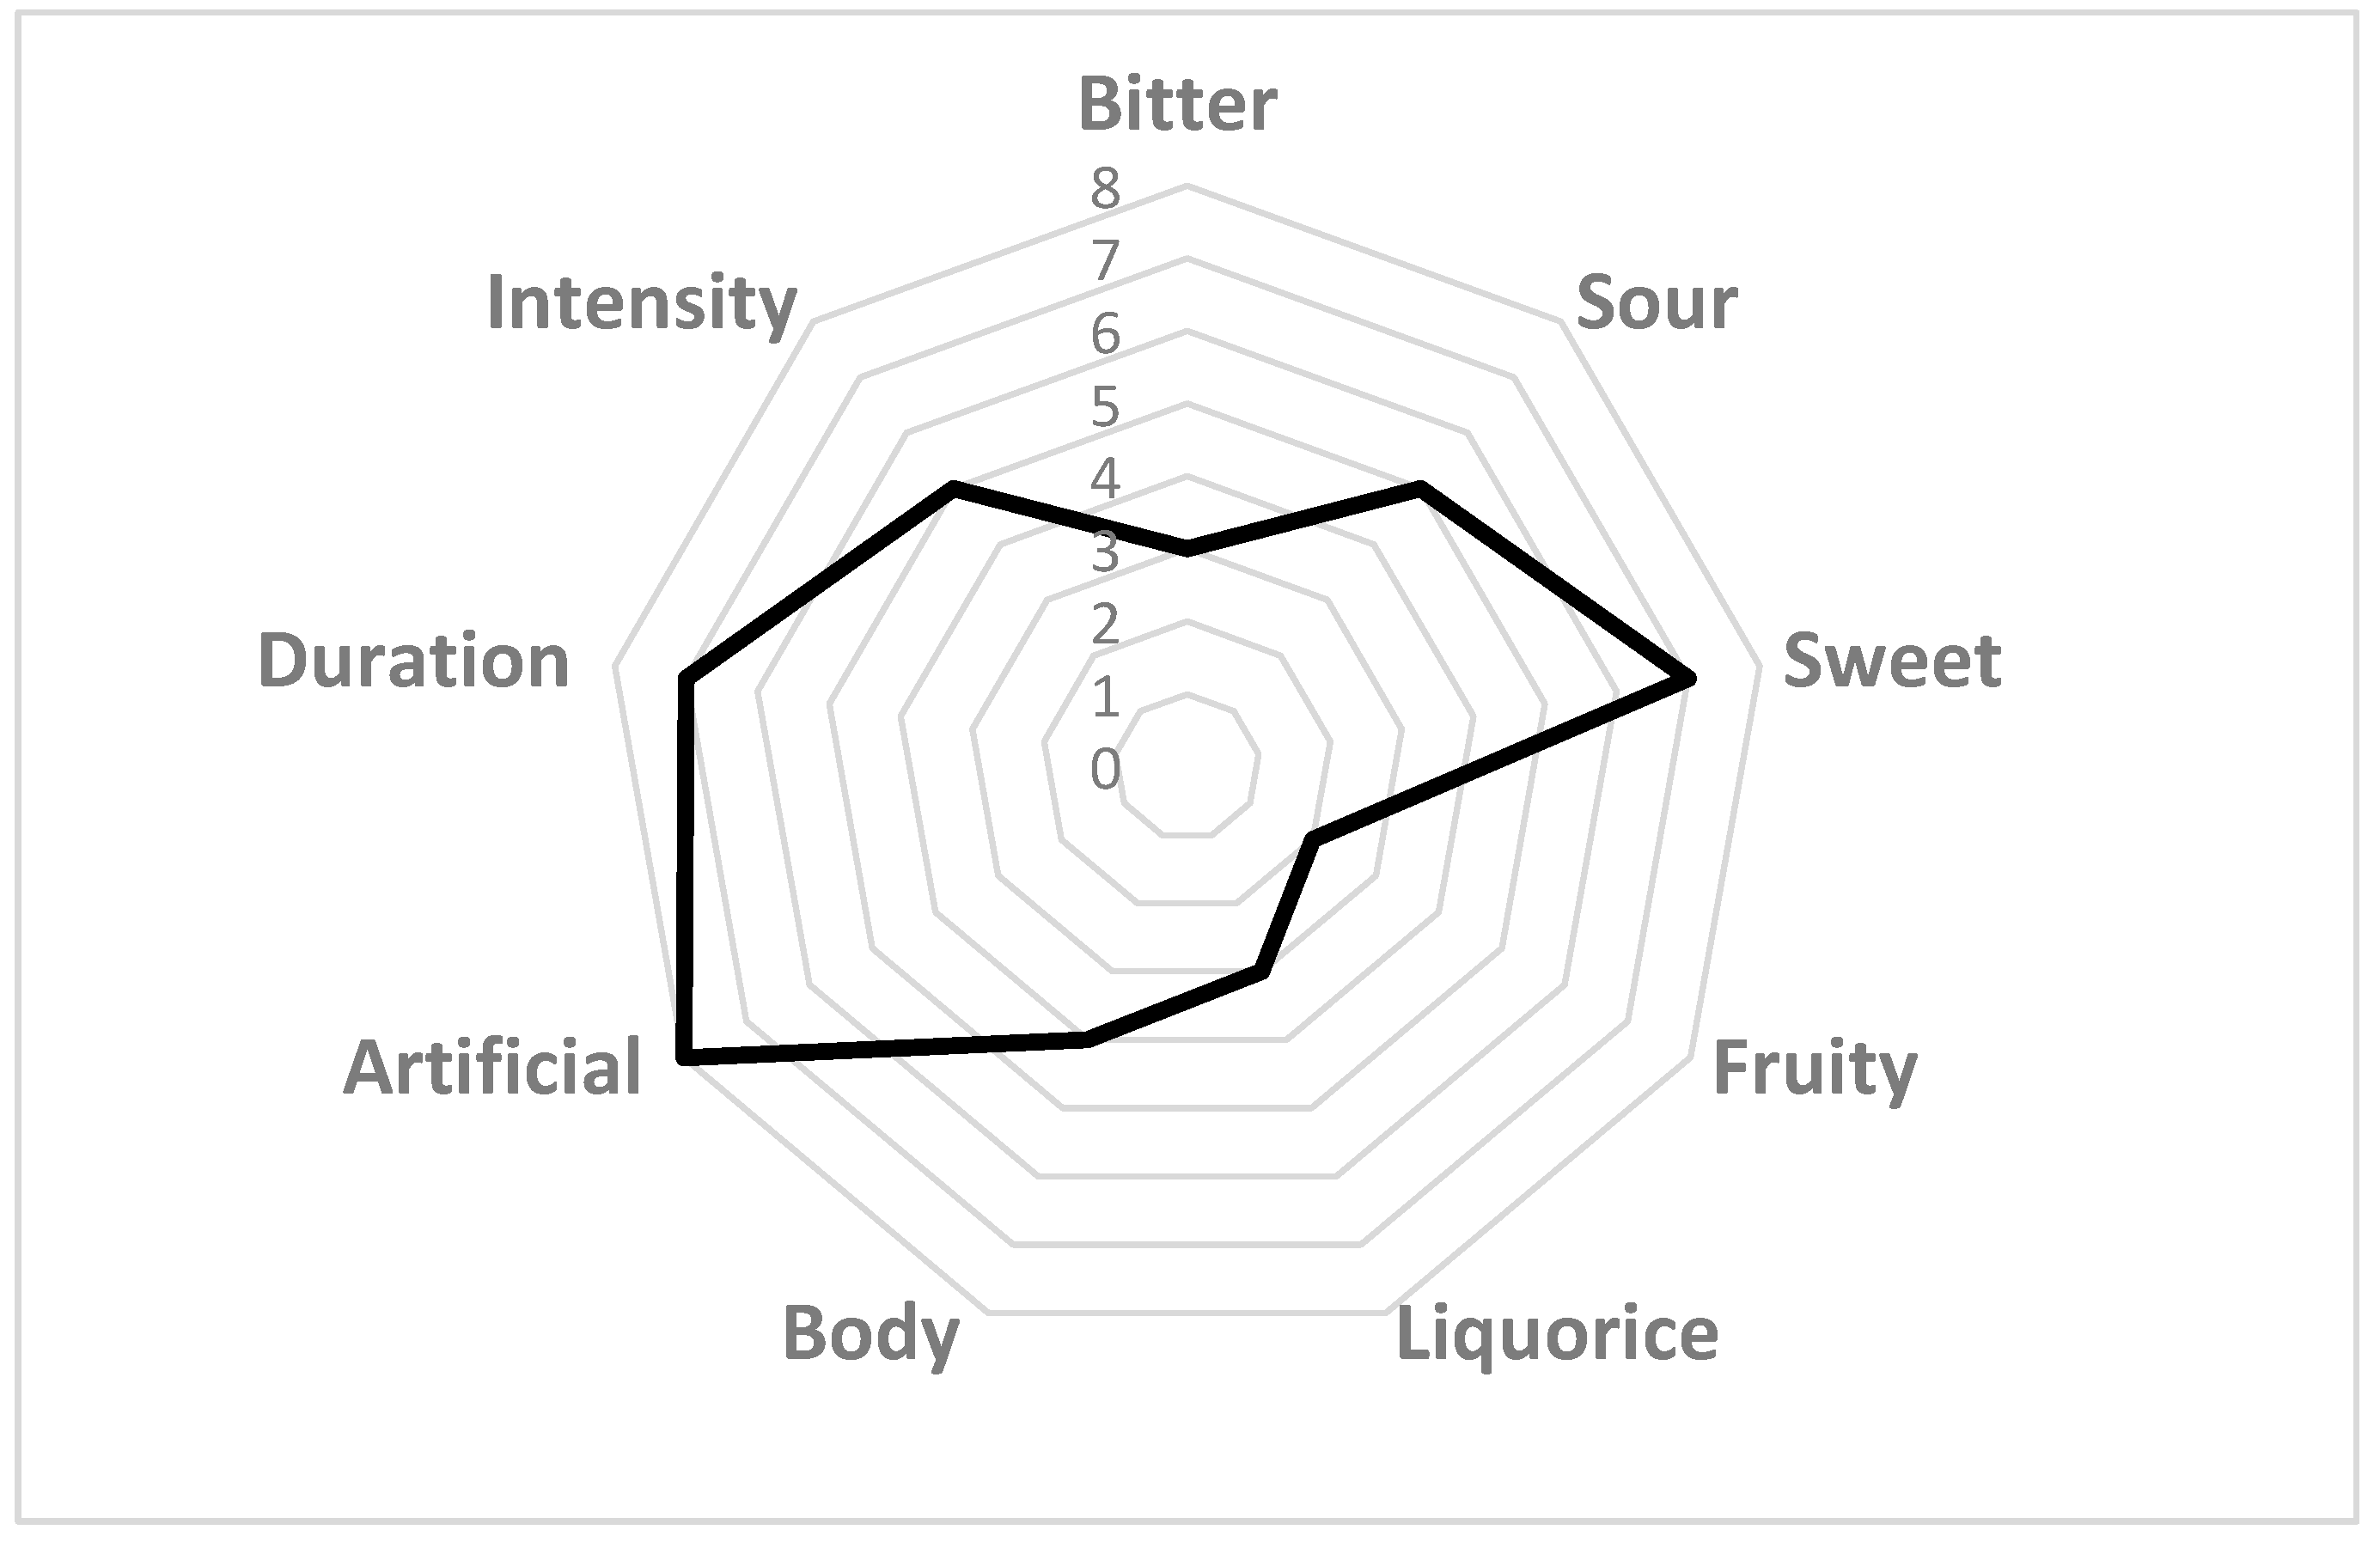
Upon finishing the sensory analysis, data are expected to be handled, analyzed and interpreted. Each sensory test can be analyzed in different ways using different statistical methods. Here is where the panel leader finishes his role. Certain sensory procedures can be analyzed by calculating the average responses for individual attributes or quality ratings. Statistical significance should always be calculated since it can be important in understanding the extent to which differences in mean responses can be relied upon when comparing results from two or more samples [4,9]. Statistical tests can assume that the data fits a predefined distribution pattern–parametric tests, or they can make no assumptions about the distribution of the data (non-parametric tests). The usual data analysis relies on Chi-squared test, F-test, T-test, Kramer’s rank-sum test, Friedman test, and Analysis of Variance (ANOVA). Basic statistical analysis can be carried out using different mathematical and statistical applications and tools approachable to wider audience. However, multivariate analysis, which includes principal component analysis, Generalized Procrustes Analysis, and cluster analysis, can be used to determine the correlation within complex data sets [4,9]. Today, almost all application for statistical analysis have the possibility to generate graphics, which are a great way of visualizing complex sets of data. For example, QDAs data is often used to generate spider (Figure 2) or waterfall graphs [9].
After the data analysis reports are done and the conclusion has been set, the panel leader gives the results to the designated person in breweries, who will take appropriate action based on the results. Sometimes the results require no action, i.e., not to change the recipe or the process parameters if the sample tested good on sensory analysis. In another case, if samples fail to comply with the specification, reports should provide sufficient guidance to brewers to allow them to make targeted improvements [4,9]. Further on, one cannot designate a product as “unsatisfactory” if no specific quality defects are identified, so it is important to state at least three errors that would result in an improvement in the quality score.
Data management is an important job, so collecting data in the most efficient way and extracting the possibilities for improving the quality are challenging. Staff should be presented with the results only if they represent a valid and uniform set of data, meaning that tests should have been carried out with a sufficient number of well-trained assessors, of known competence, under conditions specified by the test procedure [46].
Assessment of test method validity can be done via international standards (ISO 17025) [47].
6. Conclusions
A chimera of different sciences and scientific disciplines needed to narrow and deepen the knowledge of taste and flavor of beer. There are useful sensory methods and tests, but they all require a dedicated leader and panelists. Training can be more or less extensive, adjusted to the test that would be conducted, but the experiment should always be well-designed.
Future trends inevitably include the development and implementation of different computer sciences, digital analytical methods and even artificial intelligence (AI) into the food and beverage safety and analytics, but human senses will always be irreplaceable when sensory analysis is in question.
Author Contributions
Conceptualization, K.H. and K.M.; investigation, K.H. and V.K.; writing—original draft preparation, K.H.; writing—review and editing, K.M.; supervision, K.H.; All authors have read and agreed to the published version of the manuscript.
Funding
This research received no external funding.
Institutional Review Board Statement
Not applicable.
Informed Consent Statement
Not applicable.
Conflicts of Interest
The authors declare no conflict of interest.
References
- The Sensory Evaluation. Available online: https://beerandbrewing.com/dictionary/nB20s1RI6j/ (accessed on 15 December 2021).
- Simpson, W.J.; Canteranne, E. Sensory analysis in modern brewery operations. Brauwelt Int. 2001, 4, 280–286. [Google Scholar]
- Nádaský, P.; Šmogrovičová, D. Senzorická stabilita piva. Chem. Listy 2010, 104, 838–845. [Google Scholar]
- Simpson, W.J. Sensory Analysis in the Brewery. In Brewing Materials and Processes A Practical Approach to Beer Excellence, 1st ed.; Bamforth, C.W., Ed.; Academic Press: Cambridge, MA, USA, 2016; pp. 257–289. [Google Scholar]
- American Society of Brewing Chemists, Online. Sensory Analysis Methods. Available online: https://www.asbcnet.org/Methods/SensoryAnalysis/Pages/default.aspx (accessed on 14 December 2021).
- Analytica EBC. Sensory Analysis. Available online: https://brewup.eu/ebc-analytica/sensory/sensory-analysis-selection-and-training-of-assessors-im-am/13.4 (accessed on 13 December 2021).
- MEBAK. Sensory Analysis. Available online: https://www.carllibri.com/epages/62355332.sf/en_GB/?ObjectID=38260772 (accessed on 13 December 2021).
- DLG. International Quality Test for Beer, Craft Beer and Beer Mix Beverages. Available online: https://www.dlg.org/en/food/dlg-testcenter-food/tests-food/beer-craft-beer (accessed on 13 December 2021).
- Gómez-López, J. Sensory Evaluation of Beer. In The Craft Brewing Handbook A Practical Guide to Running a Successful Craft Brewery, 1st ed.; Smart, C., Ed.; Woodhead Publishing: Sawston, UK, 2019; pp. 191–215. [Google Scholar]
- Micro-Brewing Learning and Training Program. Available online: https://www.presentica.com/doc/11072649/learning-and-training-program-pdf-document (accessed on 22 December 2021).
- Baert, J.J.; De Clippeleer, J.; Hughes, P.S.; De Cooman, L.; Aerts, G. On the origin of free and bound staling aldehydes in beer. J. Agric. Food Chem. 2012, 60, 11449–11472. [Google Scholar] [CrossRef] [PubMed]
- Cooper, D.J.; Husband, F.A.; Mills, E.N.C.; Wilde, P.J. Role of beer lipid-binding proteins in preventing lipid destabilization of foam. J. Agric. Food Chem. 2002, 50, 7645–7650. [Google Scholar] [CrossRef]
- Gonzalez Viejo, C.; Fuentes, S.; Li, G.; Collmann, R.; Condé, B.; Torrico, D. Development of a robotic pourer constructed with ubiquitous materials, open hardware and sensors to assess beer foam quality using computer vision and pattern recognition algorithms: RoboBEER. Food Res. Int. 2016, 89, 504–513. [Google Scholar] [CrossRef]
- Viejo, C.G. Integration of non-invasive biometrics with sensory analysis techniques to assess acceptability of beer by consumers. Physiol. Behav. 2018, 200, 139–147. [Google Scholar] [CrossRef]
- Parker, D.K.; Campden, B.R.I. Beer: Production, sensory characteristics and sensory analysis. In Alcoholic Beverages Sensory Evaluation and Consumer Research, 1st ed.; Piggot, J., Ed.; Woodhead Publishing: Sawston, UK, 2012; pp. 133–158. [Google Scholar]
- Schmelzle, A. The beer aroma wheel. Updating beer flavor terminology according to sensory standards. Brew. Sci. 2009, 62, 26–32. [Google Scholar]
- Saison, D.; De Schutter, D.P.; Uyttenhove, B.; Delvaux, F.; Delvaux, F.R. Contribution of staling compounds to the aged flavor of lager beer by studying their flavour thresholds. Food Chem. 2009, 114, 1206–1215. [Google Scholar] [CrossRef]
- Langstaff, S.A.; Lewis, M.J. The mouthfeel of beer—A review. J. Inst. Brew. 1993, 99, 31–37. [Google Scholar] [CrossRef]
- Meilgaard, M.C.; Dalgliesh, C.E.; Clapperton, J.F. Beer flavor terminology. J. Am. Soc. Brew. Chem. 1979, 37, 47–52. [Google Scholar] [CrossRef]
- Langstaff, S.A.; Guinard, J.X.; Lewis, M.J. Sensory evaluation of the mouthfeel of beer. J. Am. Soc. Brew. Chem. 1991, 49, 54–59. [Google Scholar] [CrossRef]
- Fushiki, T.; Kodama, H.; Yonezawa, T.; Morimoto, K. Physiological aspects of beer drinkability. In Culinary Arts and Sciences: Global and National Perspectives; Edwards, J.S.A., Ed.; Computational Mechanics Publications: Southampton, UK, 1996; pp. 489–497. [Google Scholar]
- Nagao, Y.; Kodama, H.; Yonezawa, T.; Taguchi, A.; Fujino, S.; Nakahara, K.; Fushiki, T. Correlation between the drinkability of beer and gastric emptying. Biosci. Biotechnol. Biochem. 1998, 62, 846–851. [Google Scholar] [CrossRef] [Green Version]
- Nagao, Y.; Kodama, H.; Yamaguchi, T.; Yonezawa, T.; Taguchi, A.; Fujino, S.; Morimoto, K.; Fushiki, T. Reduced urination rate while drinking beer with an unpleasant taste and off-flavor. Biosci. Biotechnol. Biochem. 1999, 63, 468–473. [Google Scholar] [CrossRef]
- Yonezawa, T.; Fushiki, T. Testing for Taste and Flavour of Beer. In Analysis of Taste and Aroma, 1st ed.; Jackson, J.F., Linskens, H.F., Eds.; Springer: Berlin, Germany, 2002; pp. 29–45. [Google Scholar]
- Čejka, P.; Dvořák, J.; Kellner, V.; Čulík, J.; Olšovská, J. Drinkability of beers and the methods applied for its assessment. Kvas. Prum. 2011, 57, 406–412. [Google Scholar] [CrossRef]
- Wakihira, T.; Miyashitaa, S.; Kobayashia, M.; Uemuraa, K.; Schlichb, P. Temporal dominance of sensations (TDS) paired with dynamic wanting: A new method of sensory evaluation with consumers for a better understanding of beer drinkability. Food Qual. Prefer. 2020, 86, 103992. [Google Scholar] [CrossRef]
- Medoro, C.; Cianciabella, M.; Camilli, F.; Magli, M.; Gatti, E.; Predieri, S. Sensory Profile of Italian Craft Beers, Beer Taster Expert versus Sensory Methods: A Comparative Study. Food Nutr. Sci. 2016, 7, 454–465. [Google Scholar] [CrossRef] [Green Version]
- Pineau, N.; Schlich, P.; Cordelle, S.; Mathonniere, C.; Issanchou, S.; Imbert, A.; Rogeaux, M.; Etievant, P.; Koster, E. Temporal Dominance of Sensations: Construction of the TDS Curves and Comparison with Time-Intensity. Food Qual. Prefer. 2009, 20, 450–455. [Google Scholar] [CrossRef]
- Vazquez-Araujo, L.; Parker, D.; Woods, E. Comparison of Temporal-Sensory Methods for Beer Flavor Evaluation. J. Sens. Stud. 2013, 28, 387–395. [Google Scholar] [CrossRef]
- Déléris, I.; Saint-Eve, A.; Guo, Y.; Lieben, P.; Cypriani, M.-L.; Jacquet, N.; Brunerie, P.; Souchon, I. Impact of Swallowing on the Dynamics of Aroma Release and Perception during the Consumption of Alcoholic Beverages. Chem. Senses 2011, 36, 701–713. [Google Scholar] [CrossRef] [Green Version]
- Sensory Evaluation. Available online: https://face-cii.in/sites/default/files/presentation/3dec/Aruna%20ram%20Kumar.pdf (accessed on 15 December 2021).
- Zoecklein, B.W. Sensory Analysis Section 4. Available online: https://www.apps.fst.vt.edu/extension/enology/downloads/wm_issues/Sensory%20Analysis/Sensory%20Analysis%20-%20Section%204.pdf (accessed on 15 December 2021).
- Zoecklein, B.W. Sensory Analysis Section 5. Available online: https://www.apps.fst.vt.edu/extension/enology/downloads/wm_issues/Sensory%20Analysis/Sensory%20Analysis%20-%20Section%205.pdf (accessed on 14 December 2021).
- Sensory Analysis Manual; Institute of Brewing: London, UK, 1995.
- IFST: Policy Statement on Ethical and Professional Practices for the Sensory Analysis of Foods. Available online: https://www.ifst.org/membership/networks-and-communities/special-interest-groups/sensory-science-group/ifst-guidelines.2010 (accessed on 12 July 2021).
- Standard Test Method for Sensory Analysis e Triangle Test. ASTM E1885e97. Available online: https://www.astm.org/e1885-97.html (accessed on 16 December 2021).
- Standard Guide for Sensory Evaluation of Beverages Containing Alcohol. ASTM E1879e00. Available online: https://standards.globalspec.com/std/3799470/astm-e1879-00 (accessed on 16 December 2021).
- Standard Test Method for Directional Difference Test. ASTM E2164e01. Available online: https://www.document-center.com/standards/show/ASTM-E2164/history/2001%20R07%20EDITION (accessed on 16 December 2021).
- Standard 5495: Sensory Analysis e Methodology e Paired Comparison Test. International Organization for Standardization, Paris. Available online: https://www.iso.org/standard/31621.html (accessed on 16 December 2021).
- Standard 8589: Sensory Analysis e General Guidance for the Design of Test Rooms. International Organization for Standardization, Paris. Available online: https://www.iso.org/standard/36385.html (accessed on 18 December 2021).
- Standard 13299: Sensory Analysis e Methodology e General Guidance for Establishing a Sensory Profile. International Organization for Standardization, Paris. Available online: https://www.iso.org/standard/58042.html (accessed on 19 December 2021).
- Standard 4120: Sensory Analysis e Methodology e Triangle Test. International Organization for Standardization, Paris. Available online: https://www.iso.org/standard/33495.html (accessed on 19 December 2021).
- Olšovska, J. Available online: http://www.hmelj-giz.si/ihgc/doc/LdV%20BS%20-%20Sensory%20Analysis%20of%20Beer%20Workshop.pdf (accessed on 21 December 2021).
- Brouhard, J. Introduction to Beer Evaluation. Available online: https://irp-cdn.multiscreensite.com/bd6d17f3/files/uploaded/Introduction%20to%20Beer%20Evaluation.pdf (accessed on 21 December 2021).
- Meilgaard, M.; Dalgliesh, C.E.; Clapperton, J.F. Beer flavour terminology. J. Inst. Brew. 1997, 85, 38–42. [Google Scholar] [CrossRef]
- Etaio, I.; Albisu, M.; Ojeda, M.; Gil, P.F.; Salmeron, J.; Perez Elortondo, F.J. Sensory quality control for food certification: A case study on wine. Panel training and qualification, method validation and monitoring. Food Control. 2010, 21, e542–e548. [Google Scholar] [CrossRef]
- Standard 17025: General Requirements for the Competence of Testing and Calibration Laboratories. International Organization for Standardization, Paris. Available online: https://www.iso.org/publication/PUB100424.html (accessed on 27 December 2021).
Figure 1.
Scheme of human tongue and taste receptors position.

Figure 2.
Example of spider graph.


Table 1.
Basic steps of sensory analysis adapted from [9].
Table 1.
Basic steps of sensory analysis adapted from [9].
| Step | Description | |
|---|---|---|
| 1 | Choosing the method | Robust, scientific method. |
| 2 | Evoking a response to stimuli/Selecting the samples | To minimize the errors and maximize the method efficiency, samples and conditions in which the serving/tasting occurs have to be uniform and consistent. |
| 3 | Quantifying the response | To obtain data that can be subjected to statistical analysis. |
| 4 | Statistical analysis | Choosing the appropriate statistical analysis method. |
| 5 | Interpretation | To evaluate and understand why is there a statistical difference (or not) between the samples. |
Table 2.
Common sensory analysis used in breweries, adapted from [2,31,32,33,34,35,36,37,38,39,40,41,42].
| Method | Example | Type of Evaluator | Application |
|---|---|---|---|
| Difference test | Triangular test Duo-trio test Directional Difference | Panelist | To find the difference between two or more samples. To match the identical samples |
| Descriptive test | Defining the profile of taste Quantitative-descriptive analysis® | Panelist | They provide a quantitative measure of characteristics that allows for comparison of intensity between products |
| Preference test | Paired comparison A-not A test | Consumers | Preference test should be performed separately and after a difference test |
| Drinkability test | Measuring the consumed volume of preferred beer | Consumers | Measuring the drinkability of one beer as oppose to another |
| Hybrid descriptive analysis | Determination of choice | Panelists and consumers | Identification of relations between the products and segregation of consumers based on their preferences |
| 9 point hedonic scale | Ranking test Magnitude determination test | Panelists | Measuring the intensity of one or more properties |
Table 3.
Efficiencies of sensory analysis, adapted from [2].
Table 3.
Efficiencies of sensory analysis, adapted from [2].
| Method | Example | Mission | Consequences of Failed Mission |
|---|---|---|---|
| Difference test | Triangular test Duo-trio test Directional Difference | To perceive the consistency in production To perceive if the production operations have any influence on flavor To perceive if beers produced in one brewery taste the same as the ones produced in another brewery | Non-consistent beers Consumers notice the non-consistency Sales drop |
| Descriptive test | Defining the profile of taste Quantitative-descriptive analysis® | To perceive what makes a beer different from other beers To measure these differencesTo precisely determine the problem so it could be fixed | Slow problem-solving response Unsolved issues of flavor and taste Consumers notice the changes in quality Sales drop |
| Preference test | Paired comparison A-not A test | To understand what beer consumers like | Sales drop |
| Drinkability test | Measuring the volume of preferred beer | To correlate the relationship between the production process and drinkability | Lack of understanding the key influences on drinkability Consumers do not consume beer as much as possible Sales drop |
| Hybrid descriptive analysis | Determination of choice | The need to know which beer the consumers like The need to divide consumers into groups, depending on their choices | Consumers can be offered by a beer they do not like or at a wrong time Sales drop |
| 9 point hedonic scale | Ranking test Magnitude determination test | To understand what makes a beer different from others | Bad attention to the company |
Publisher’s Note: MDPI stays neutral with regard to jurisdictional claims in published maps and institutional affiliations. |
© 2022 by the authors. Licensee MDPI, Basel, Switzerland. This article is an open access article distributed under the terms and conditions of the Creative Commons Attribution (CC BY) license (https://creativecommons.org/licenses/by/4.0/).
Share and Cite
MDPI and ACS Style
Habschied, K.; Krstanović, V.; Mastanjević, K. Beer Quality Evaluation—A Sensory Aspect. Beverages 2022, 8, 15. https://0-doi-org.brum.beds.ac.uk/10.3390/beverages8010015
AMA Style
Habschied K, Krstanović V, Mastanjević K. Beer Quality Evaluation—A Sensory Aspect. Beverages. 2022; 8(1):15. https://0-doi-org.brum.beds.ac.uk/10.3390/beverages8010015
Chicago/Turabian StyleHabschied, Kristina, Vinko Krstanović, and Krešimir Mastanjević. 2022. "Beer Quality Evaluation—A Sensory Aspect" Beverages 8, no. 1: 15. https://0-doi-org.brum.beds.ac.uk/10.3390/beverages8010015
Note that from the first issue of 2016, this journal uses article numbers instead of page numbers. See further details here.