
The Influence of Green and Black Tea Infusion Parameters on Total Polyphenol Content and Antioxidant Activity by ABTS and DPPH Assays

 ,
,  ,
,
Abstract
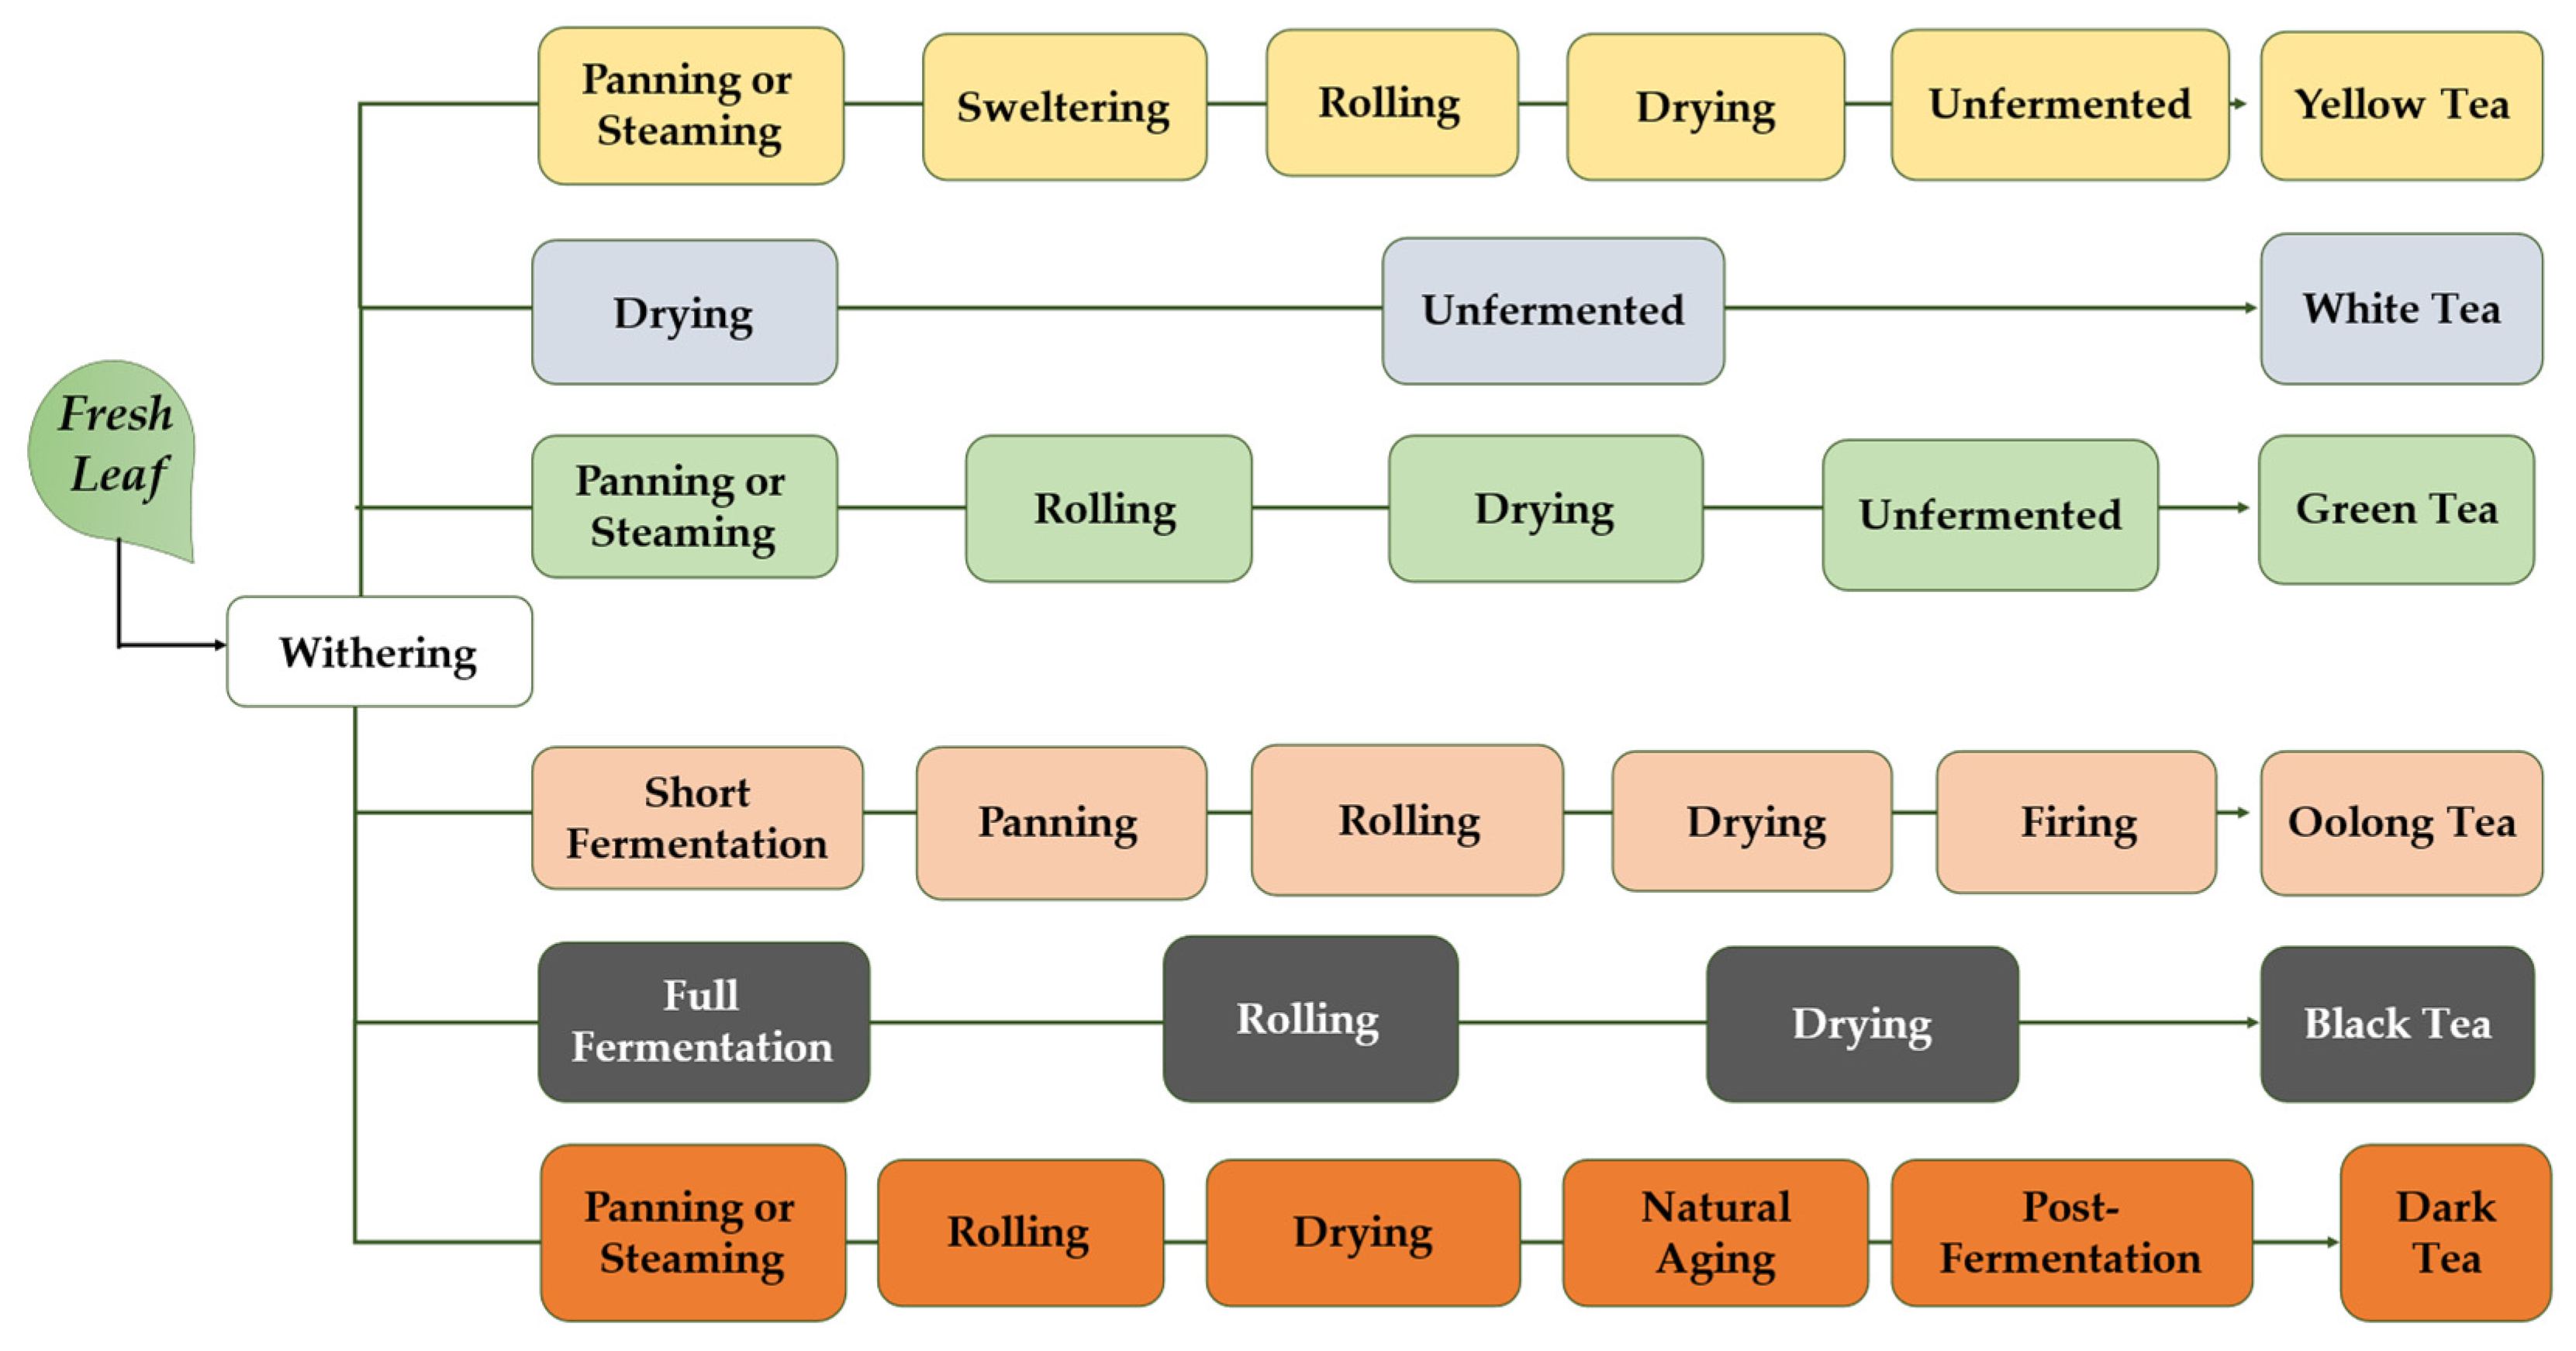
:1. Introduction
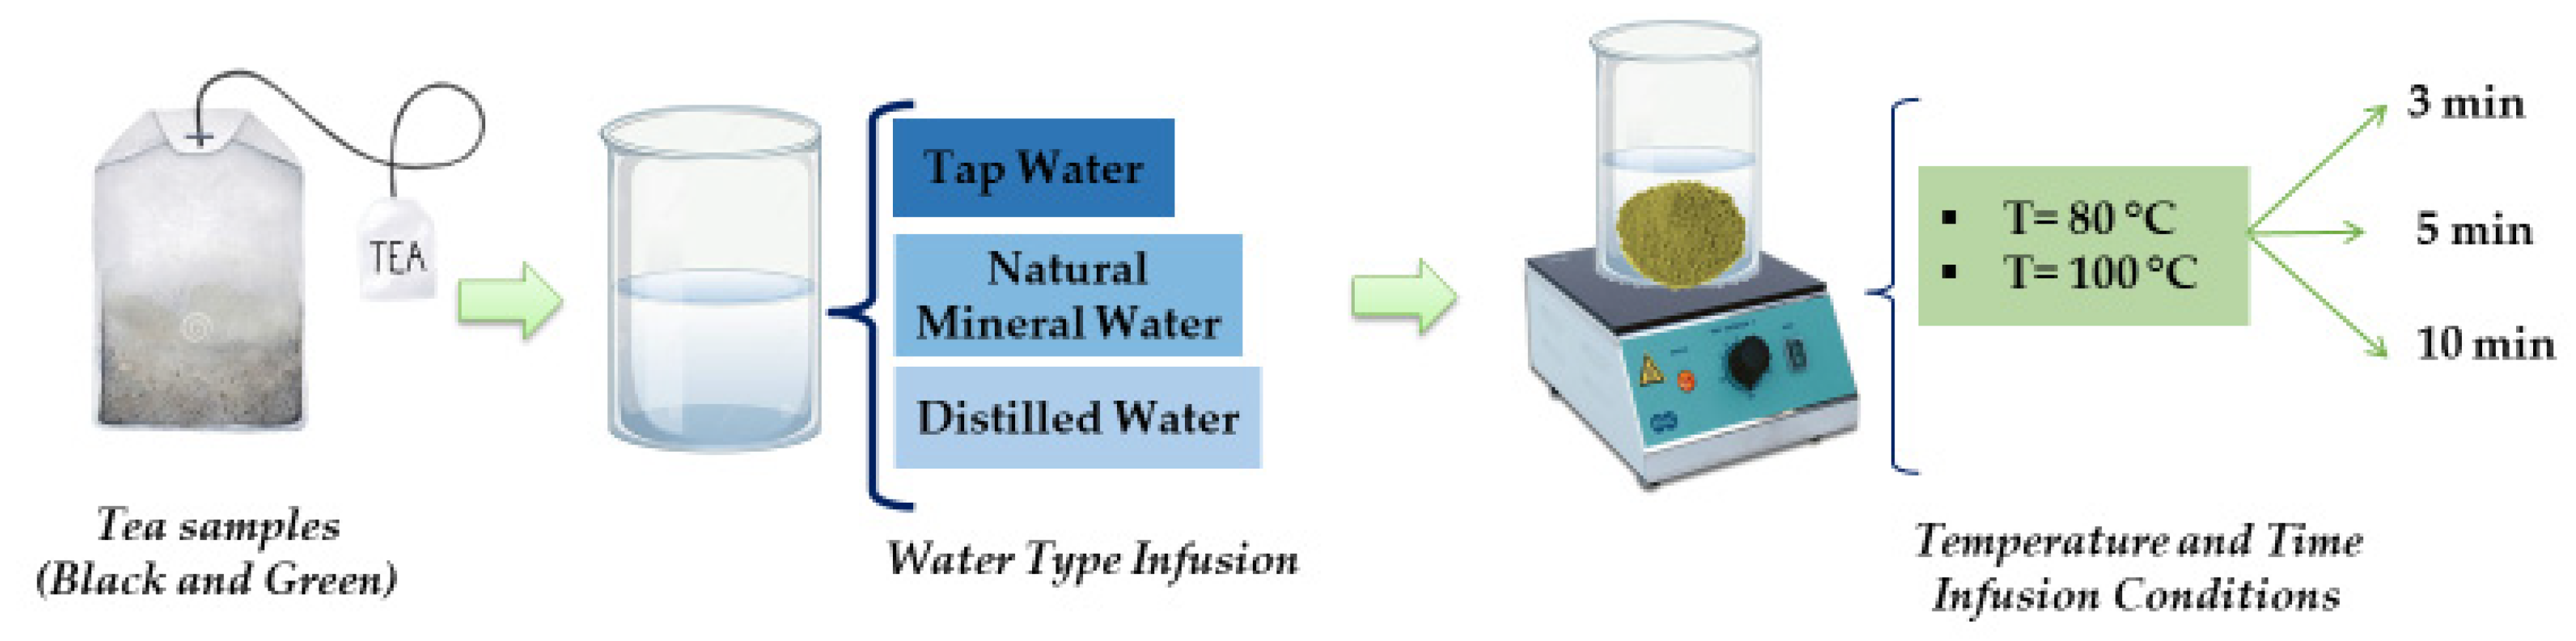
2. Materials and Methods
2.1. Chemicals
2.2. Instruments
2.3. Samples
2.4. Aqueous Tea Extract Preparation
2.5. Polyphenols Aqueous Extraction at Different pH
2.6. Determination of Total Polyphenol Content (Folin–Ciocâlteu)
2.7. Determination of Antioxidant Activity (ABTS and DPPH Assays)
2.8. Statistical Analysis
3. Results and Discussion
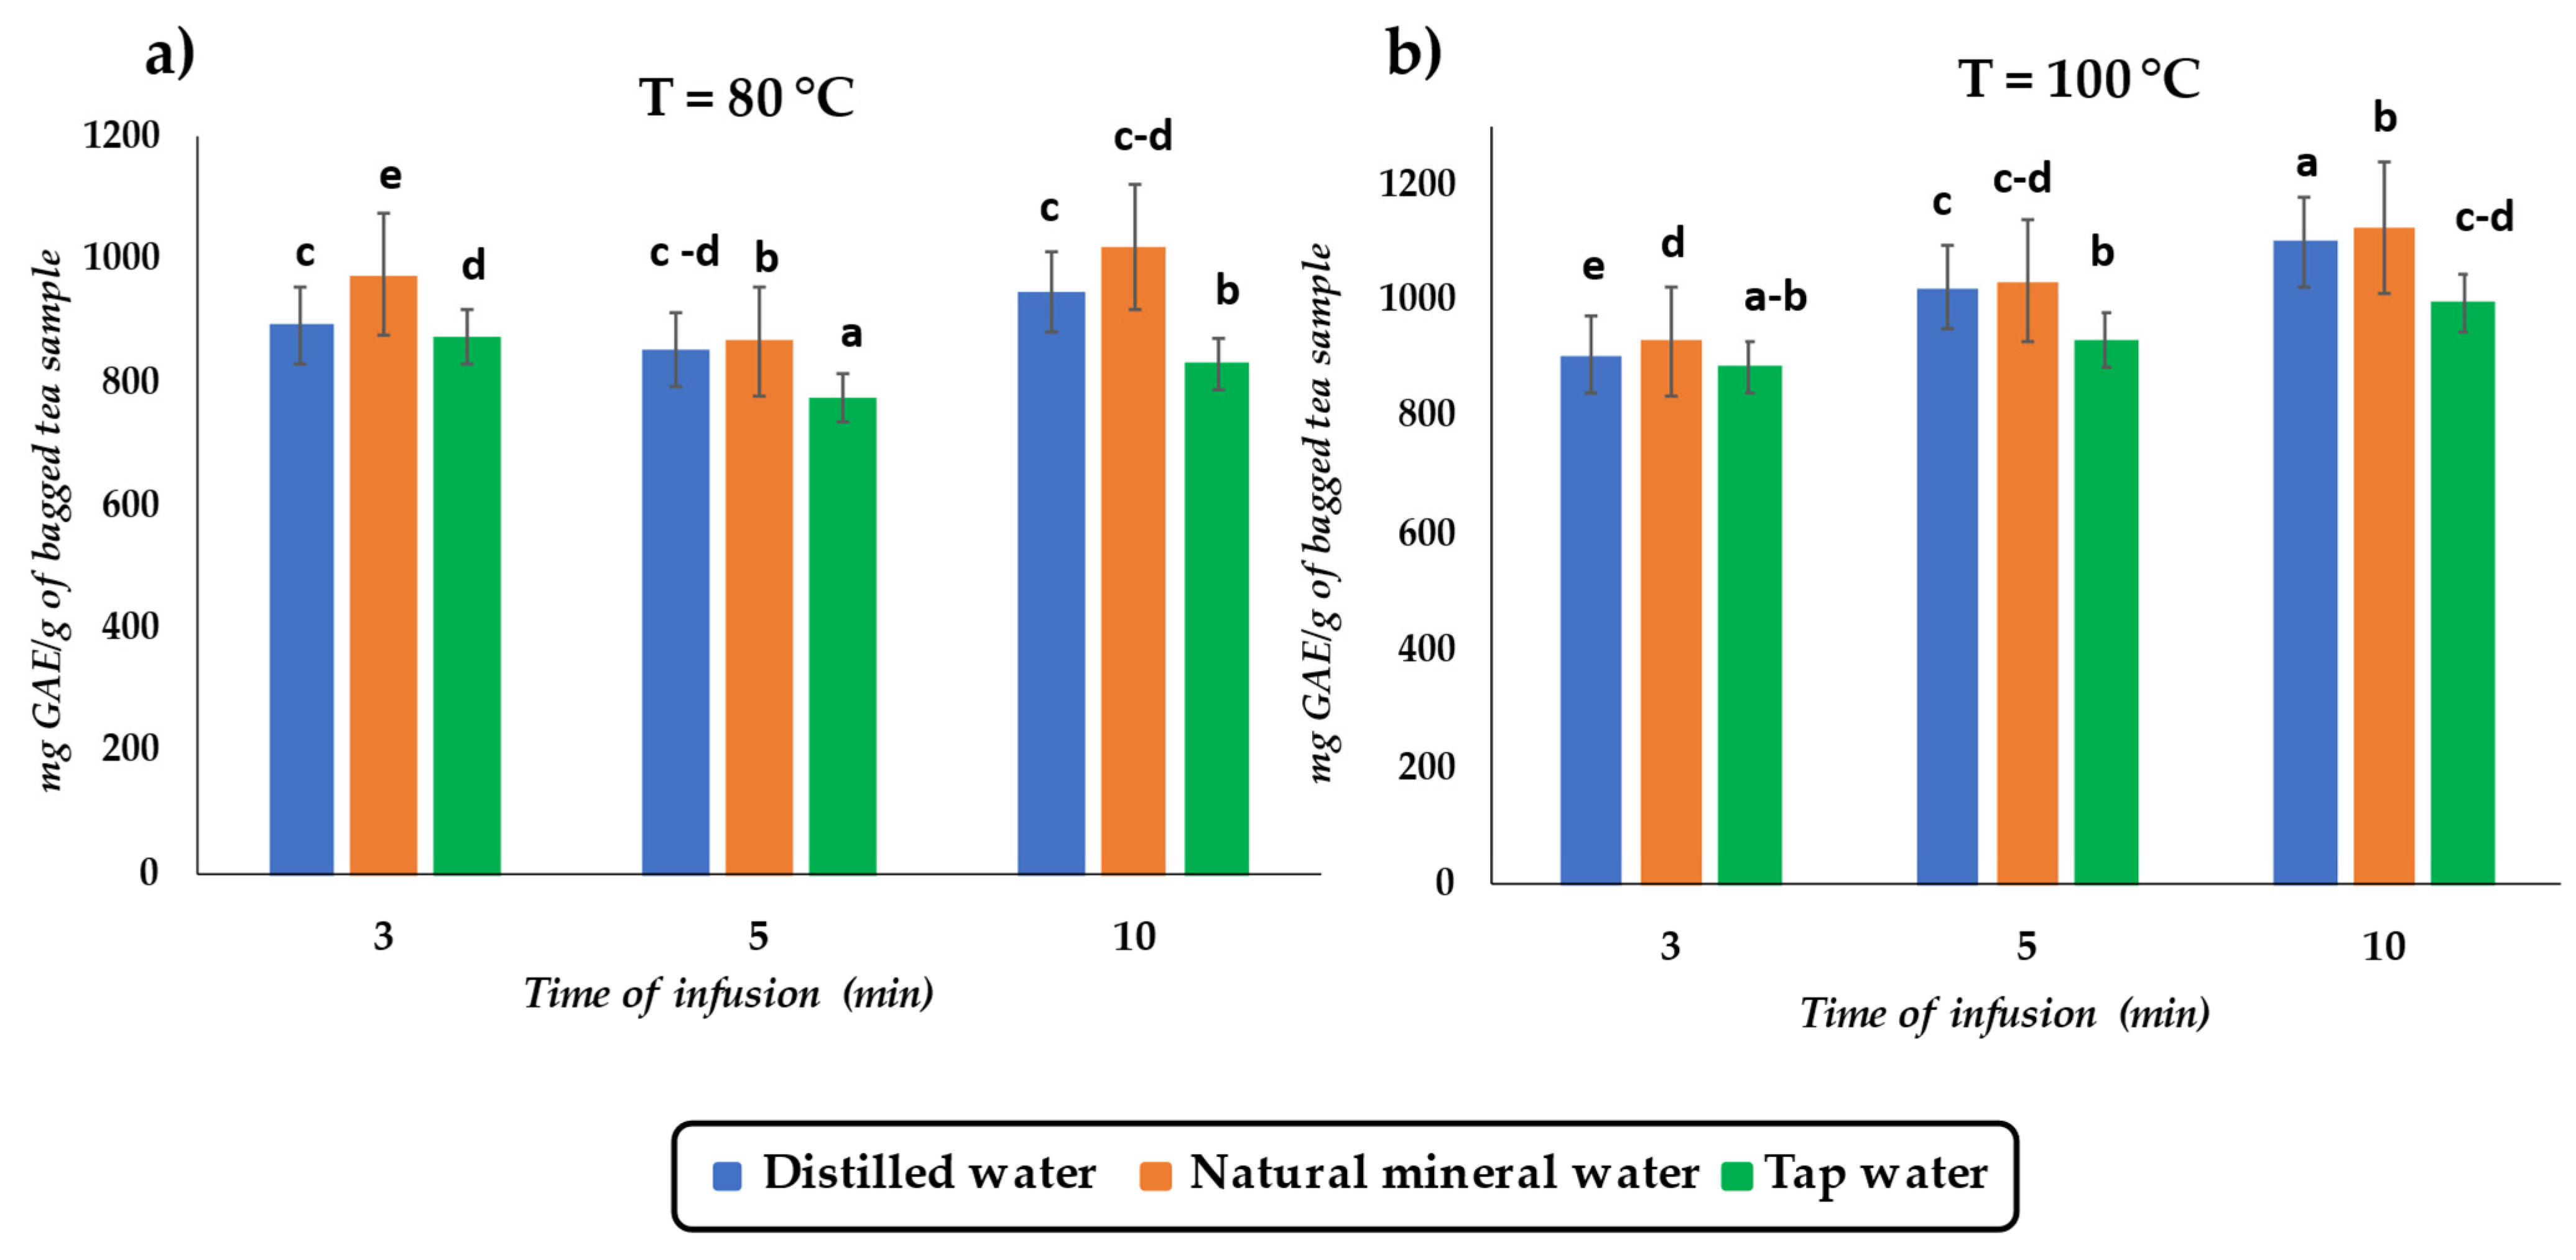
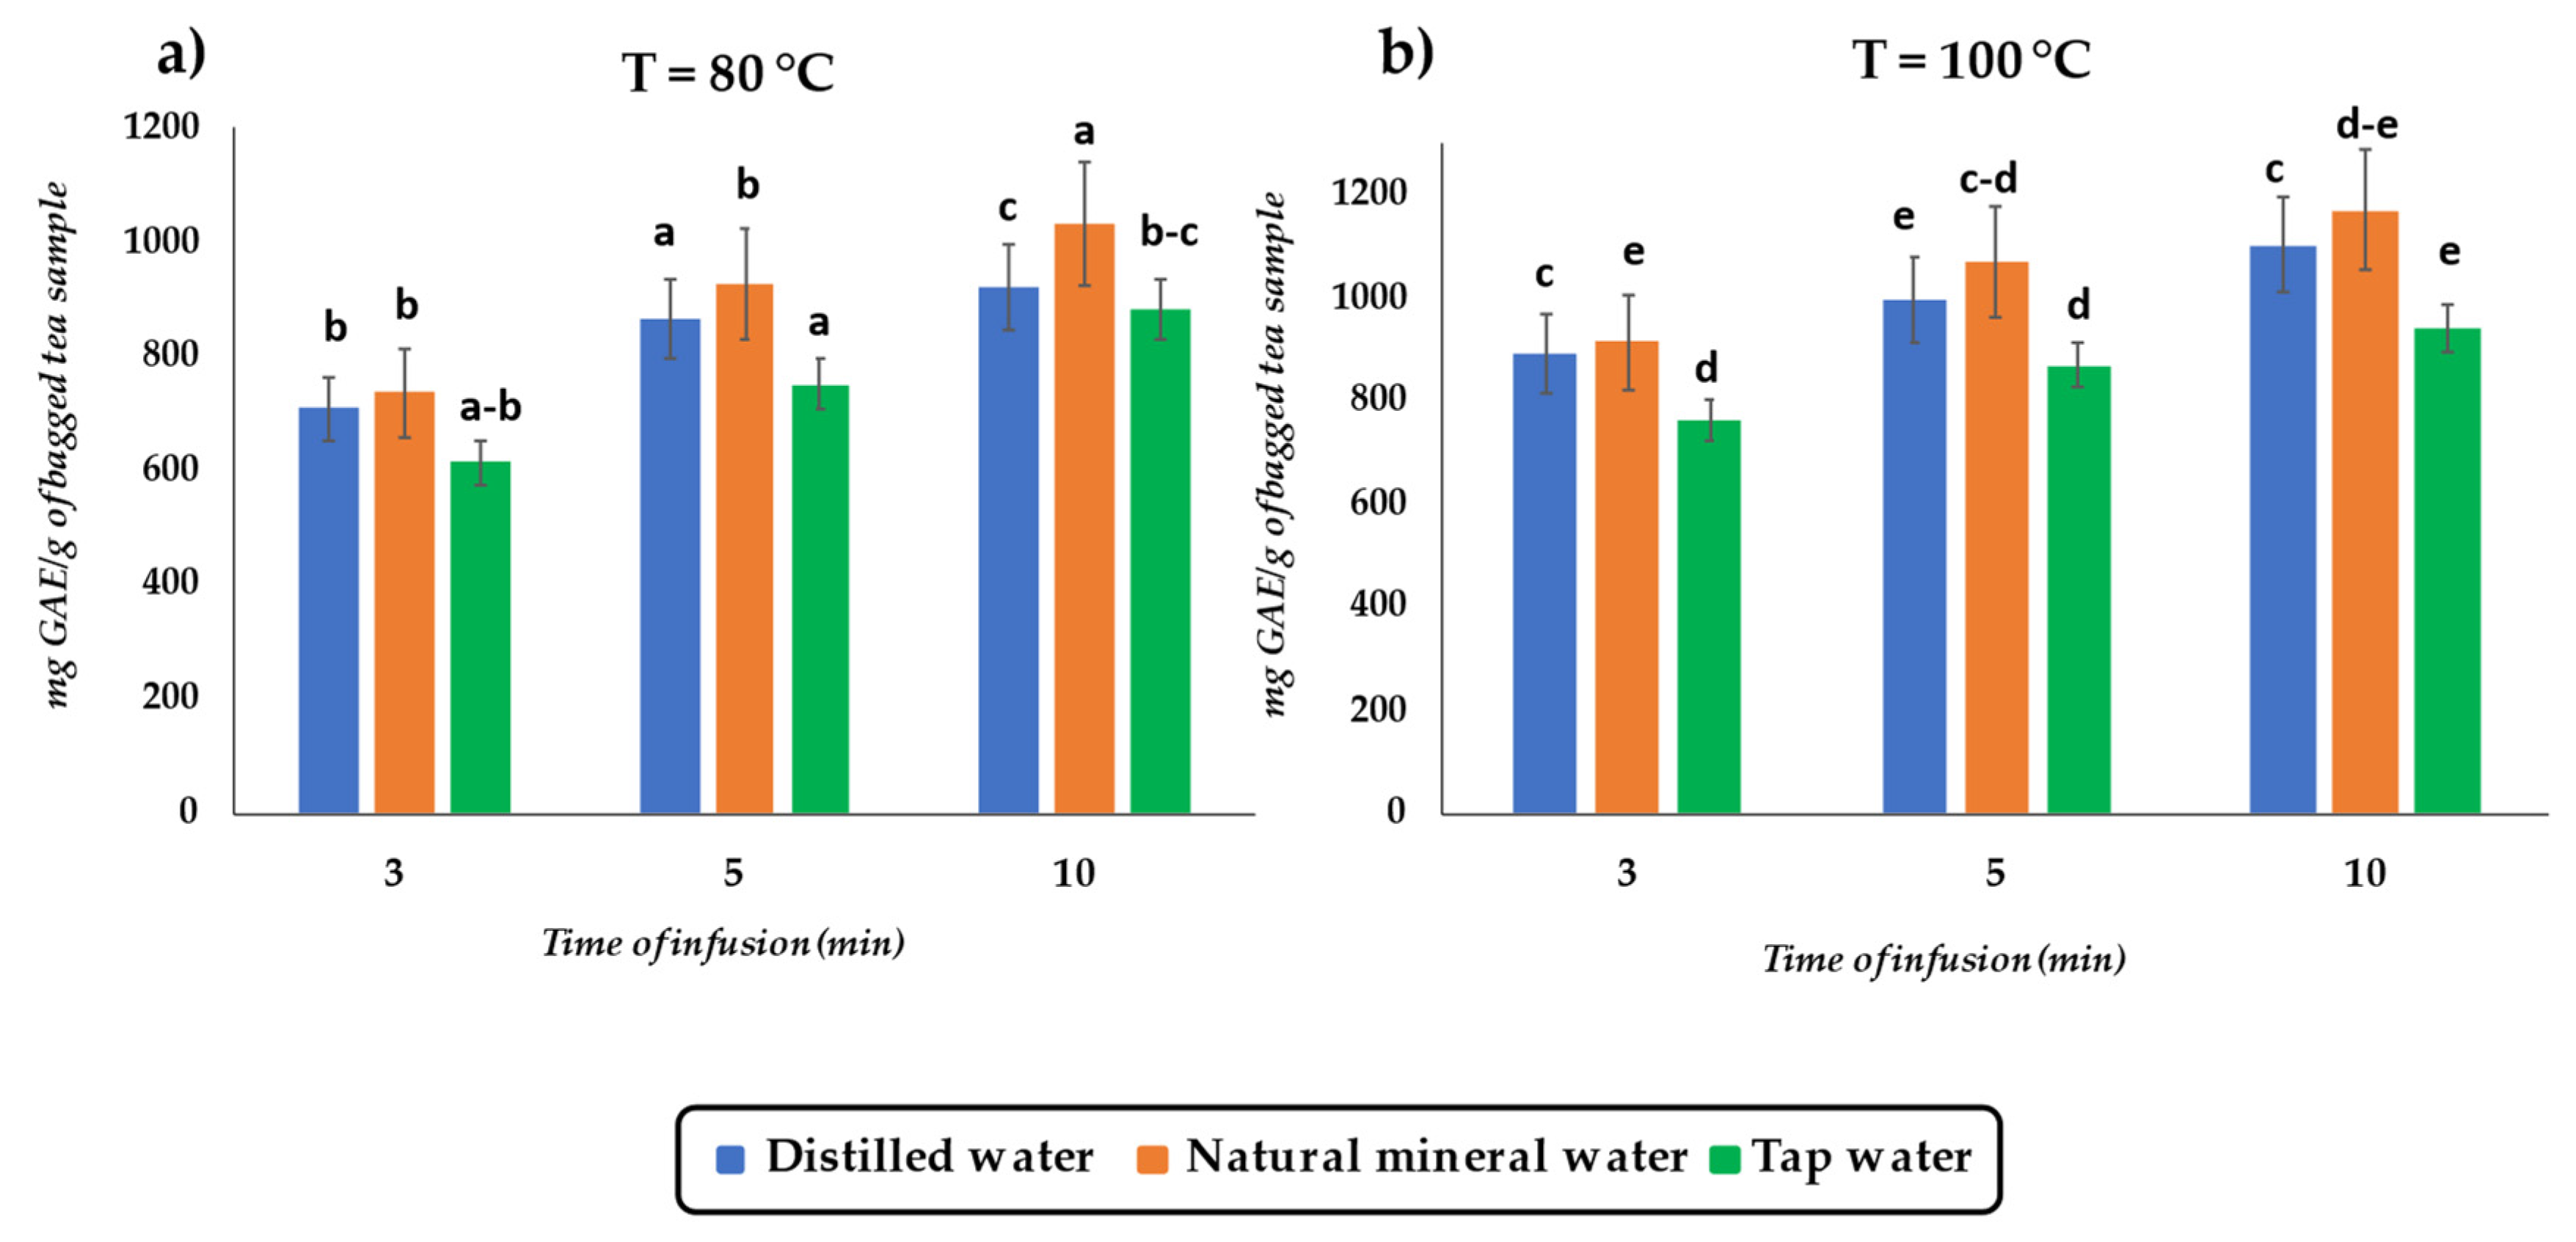
3.1. Effect of Infusion Variables on TPC
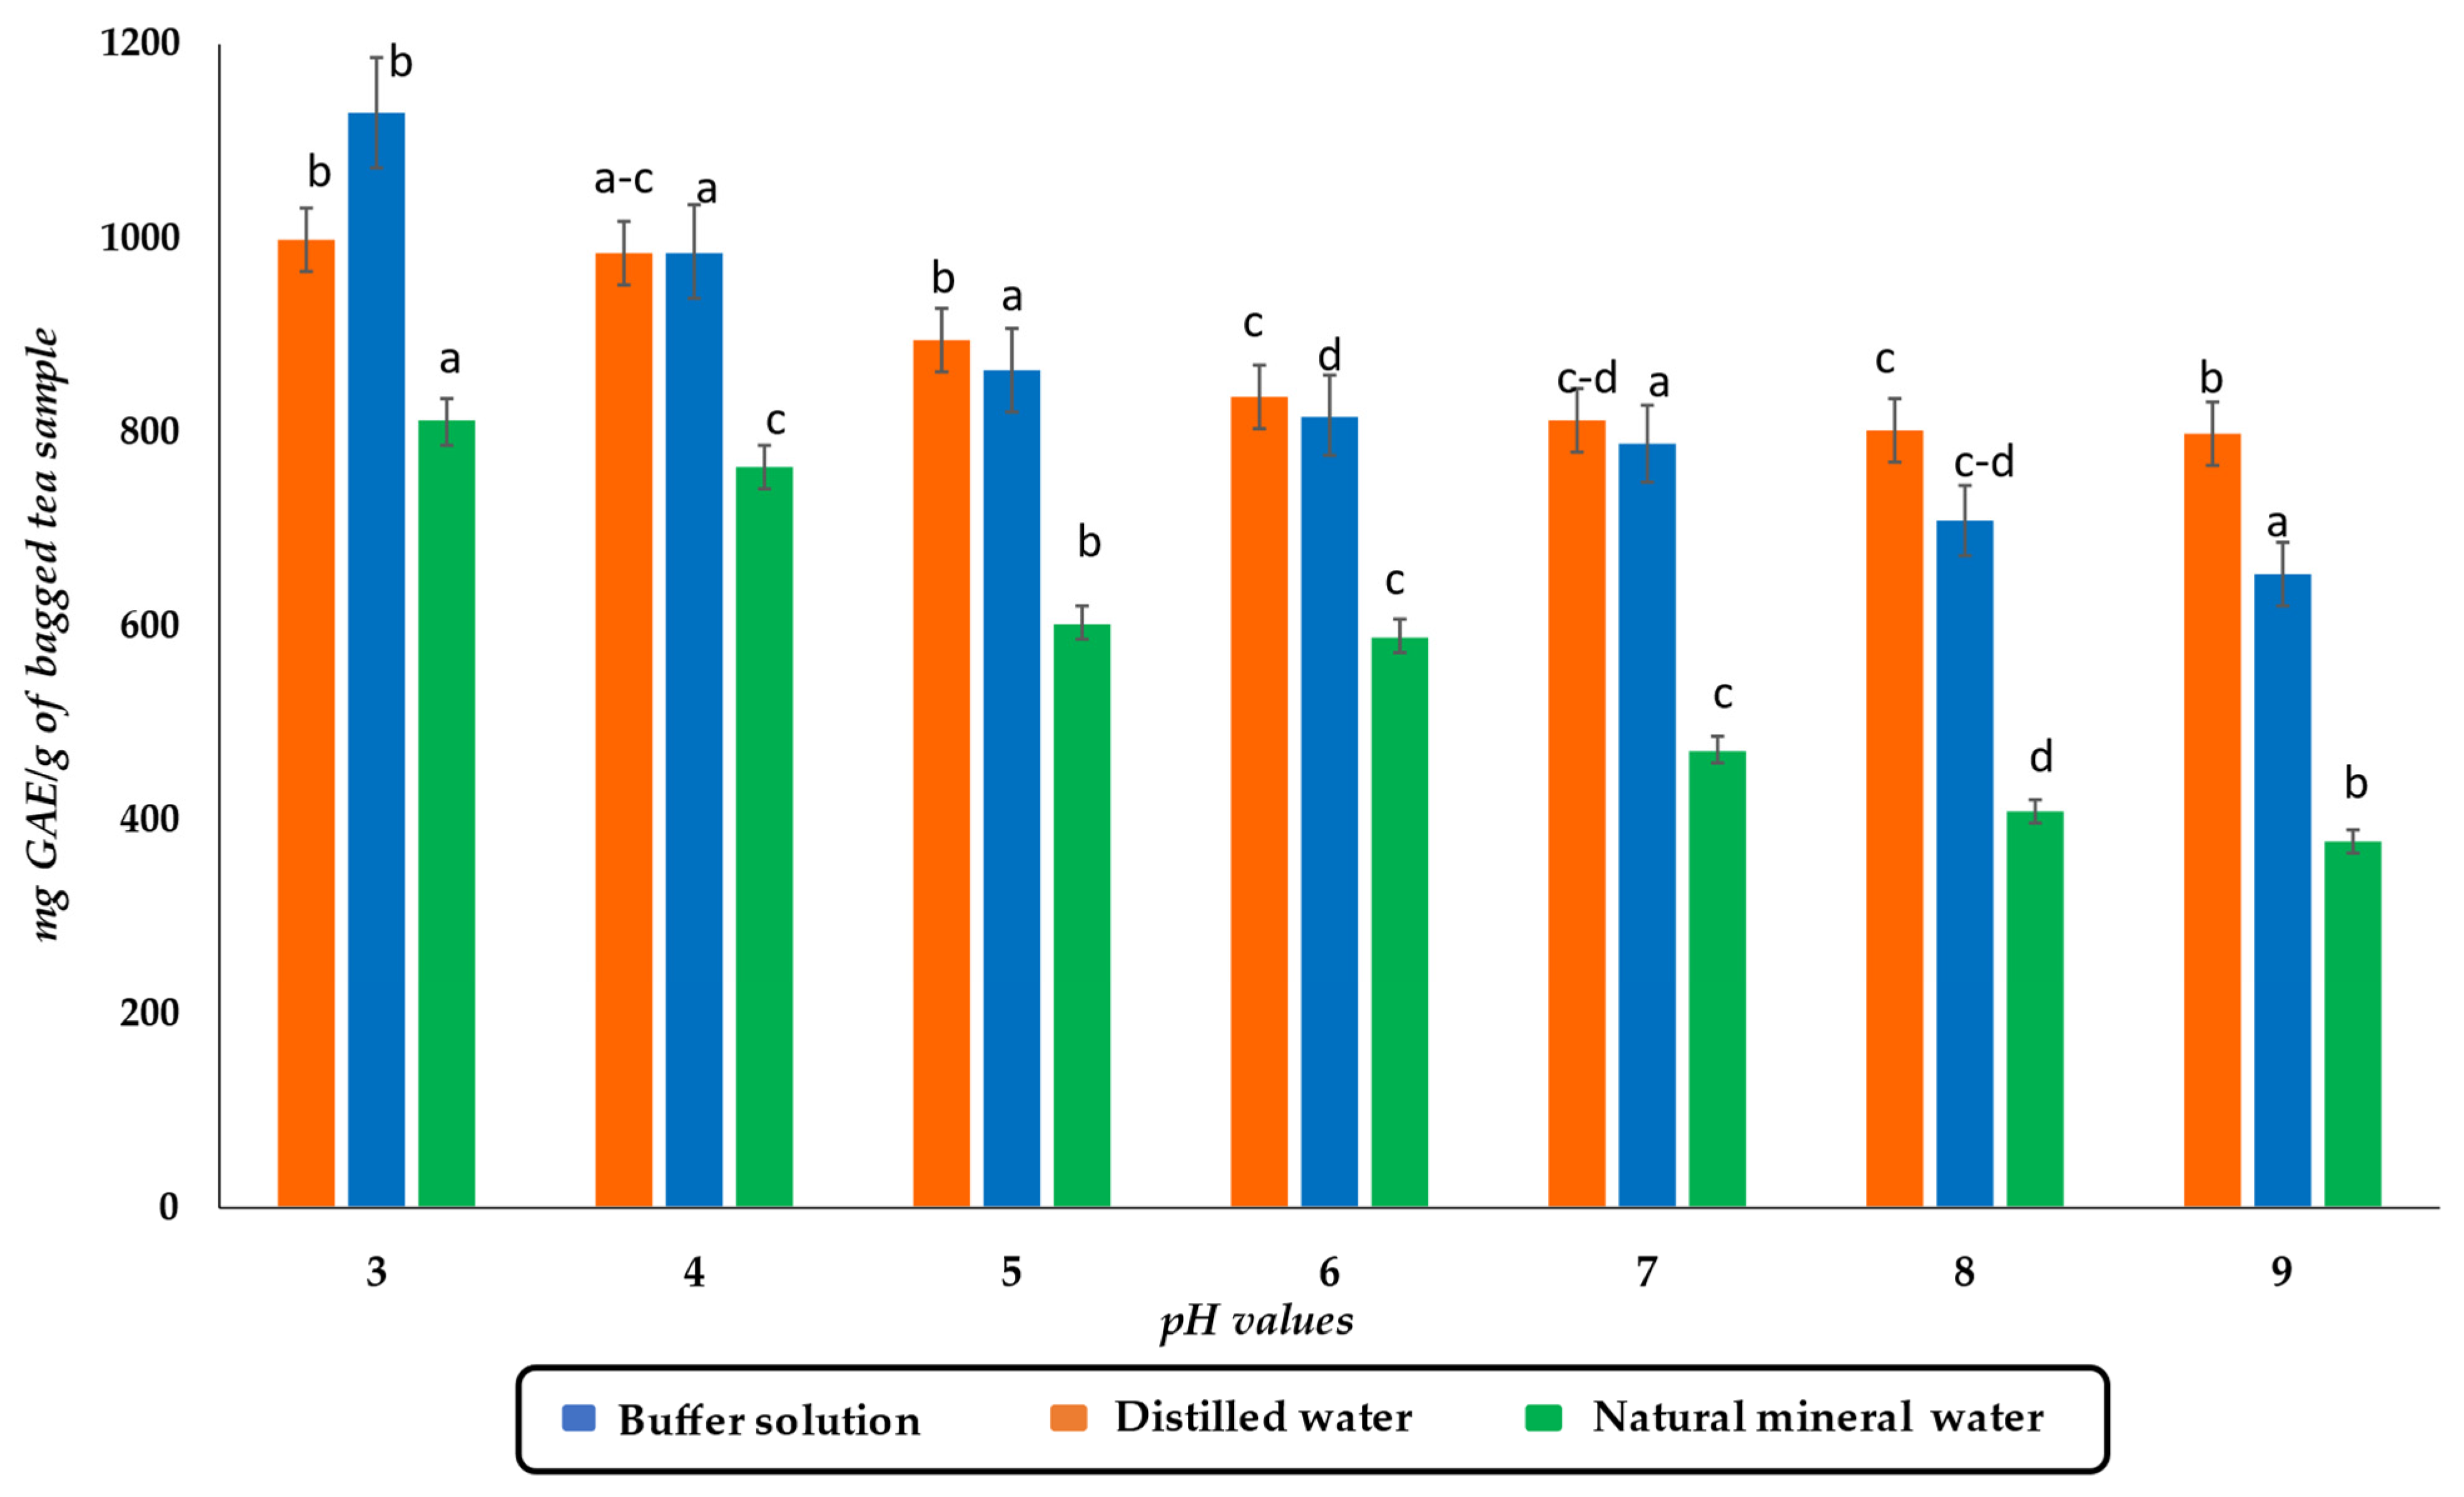
3.2. Effect of pH of Aqueous Solution on TPC
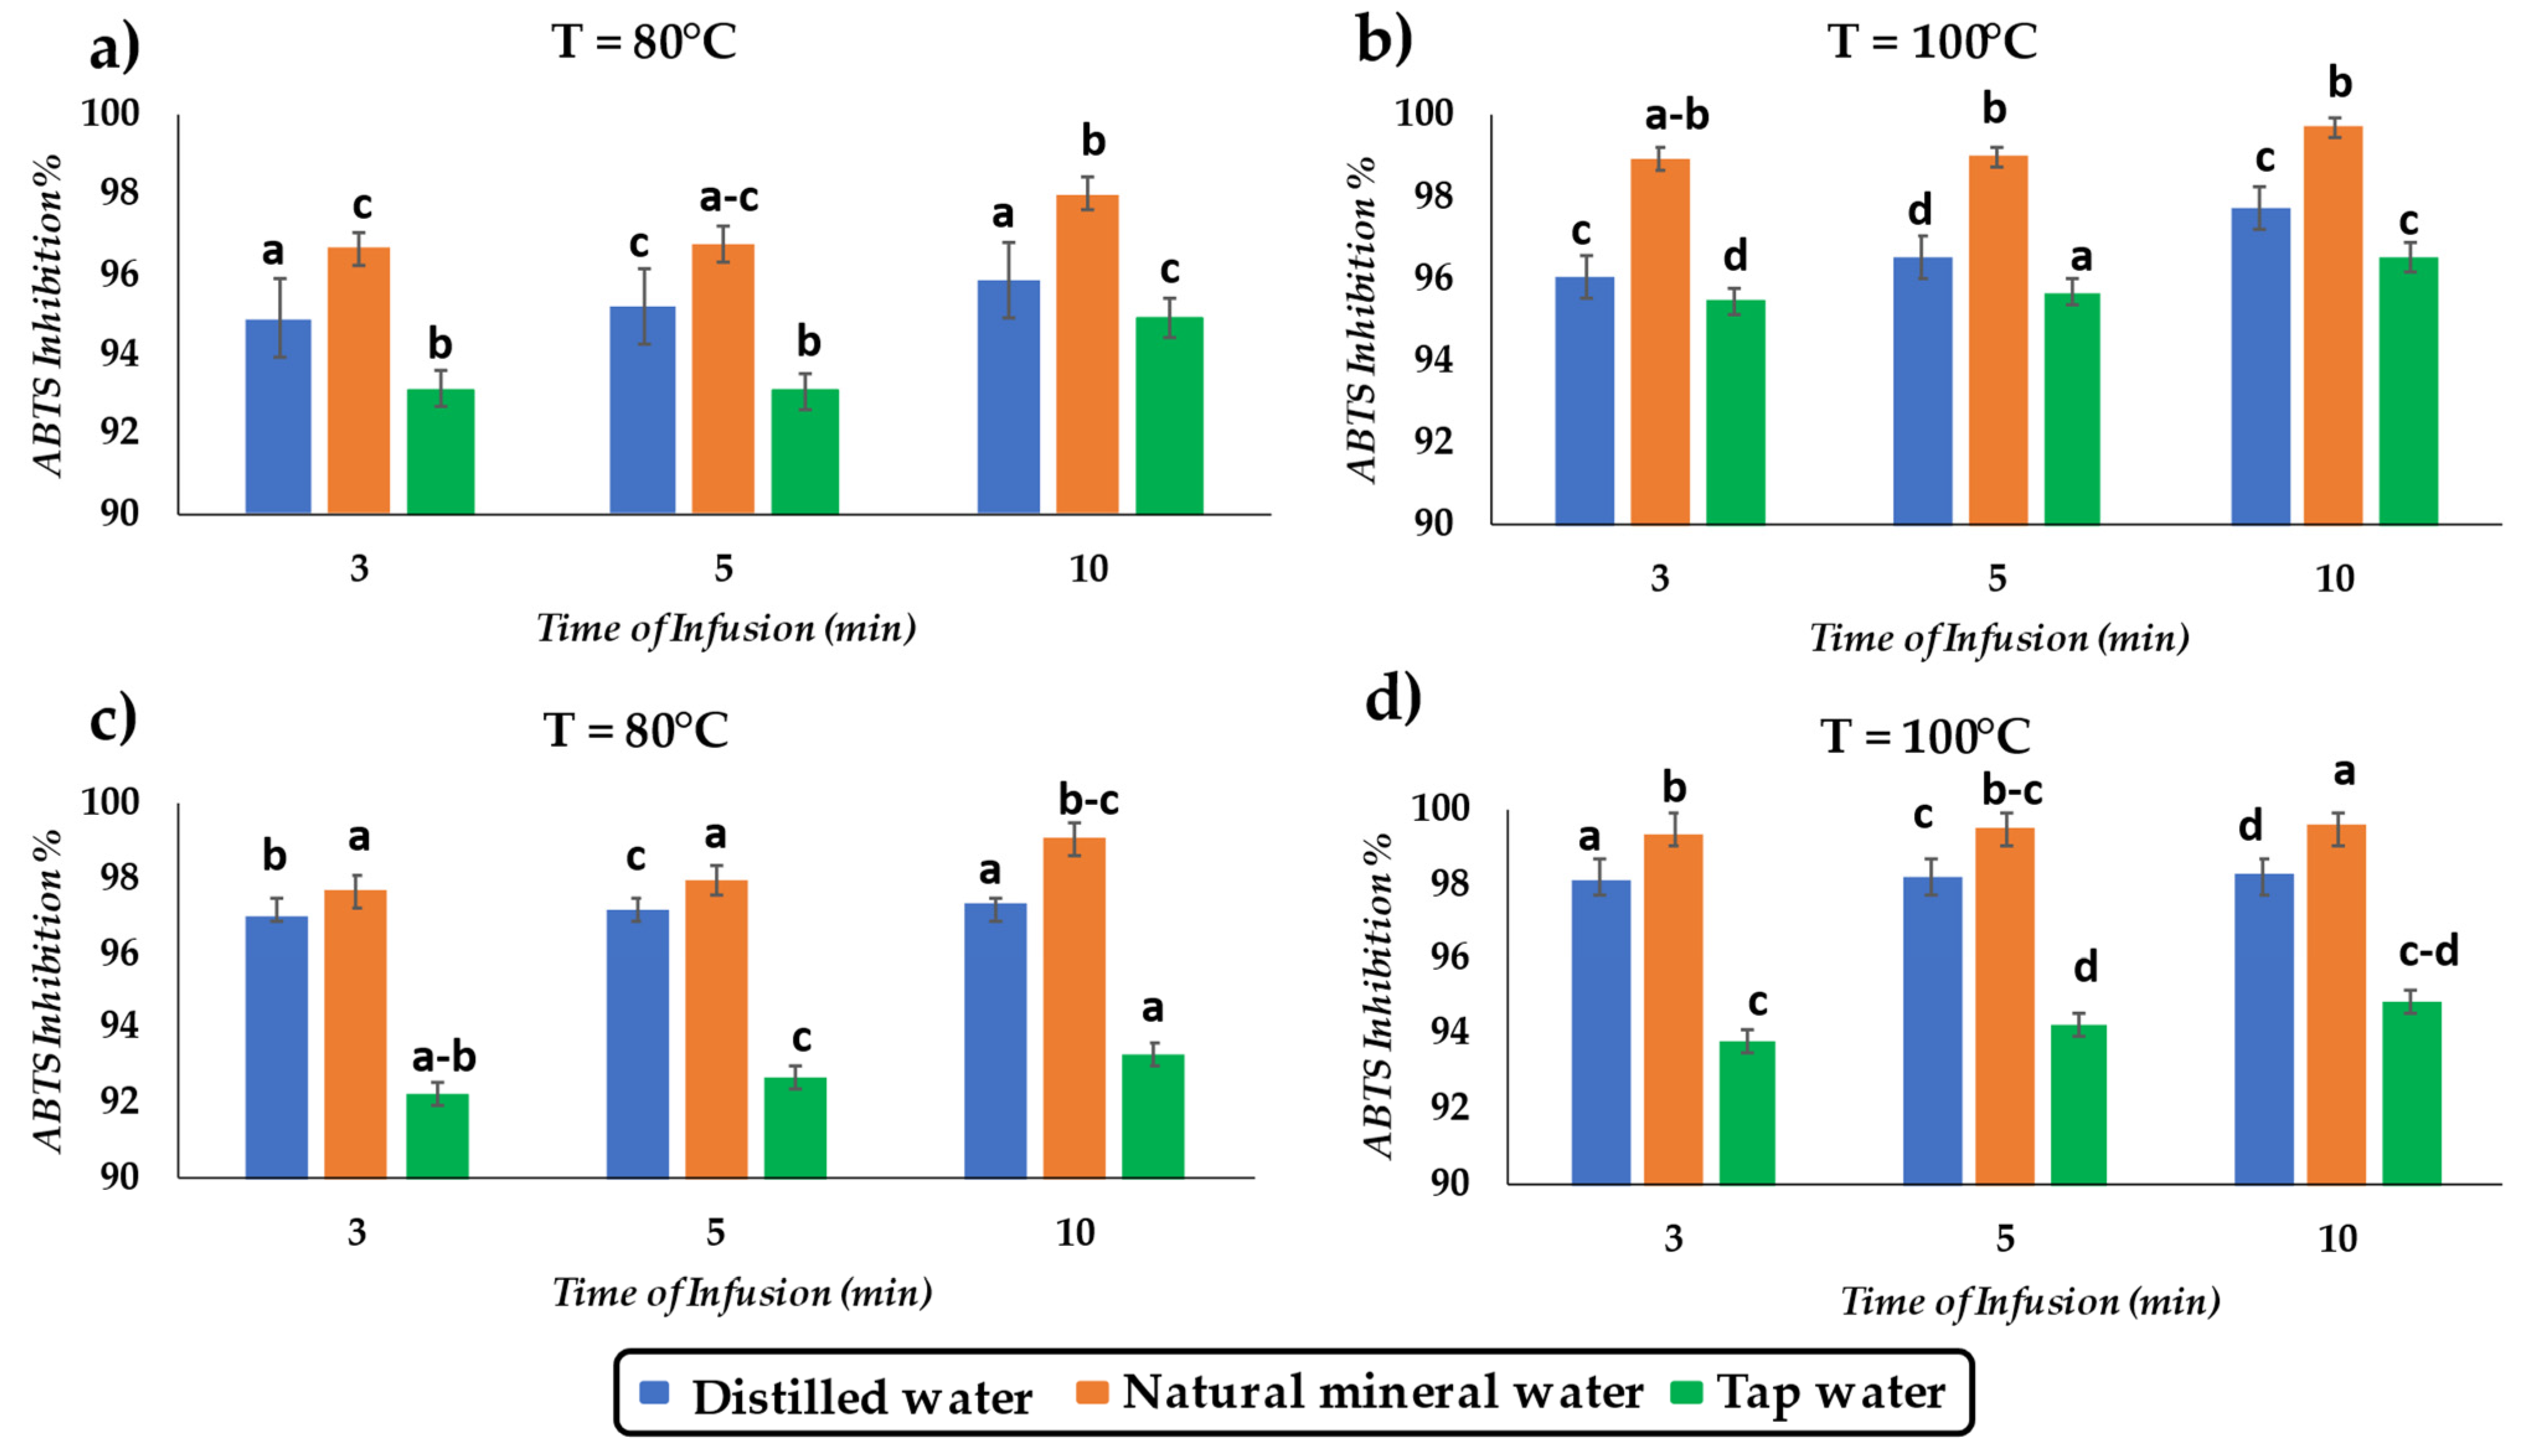
3.3. ABTS Assay of Tea Infusions
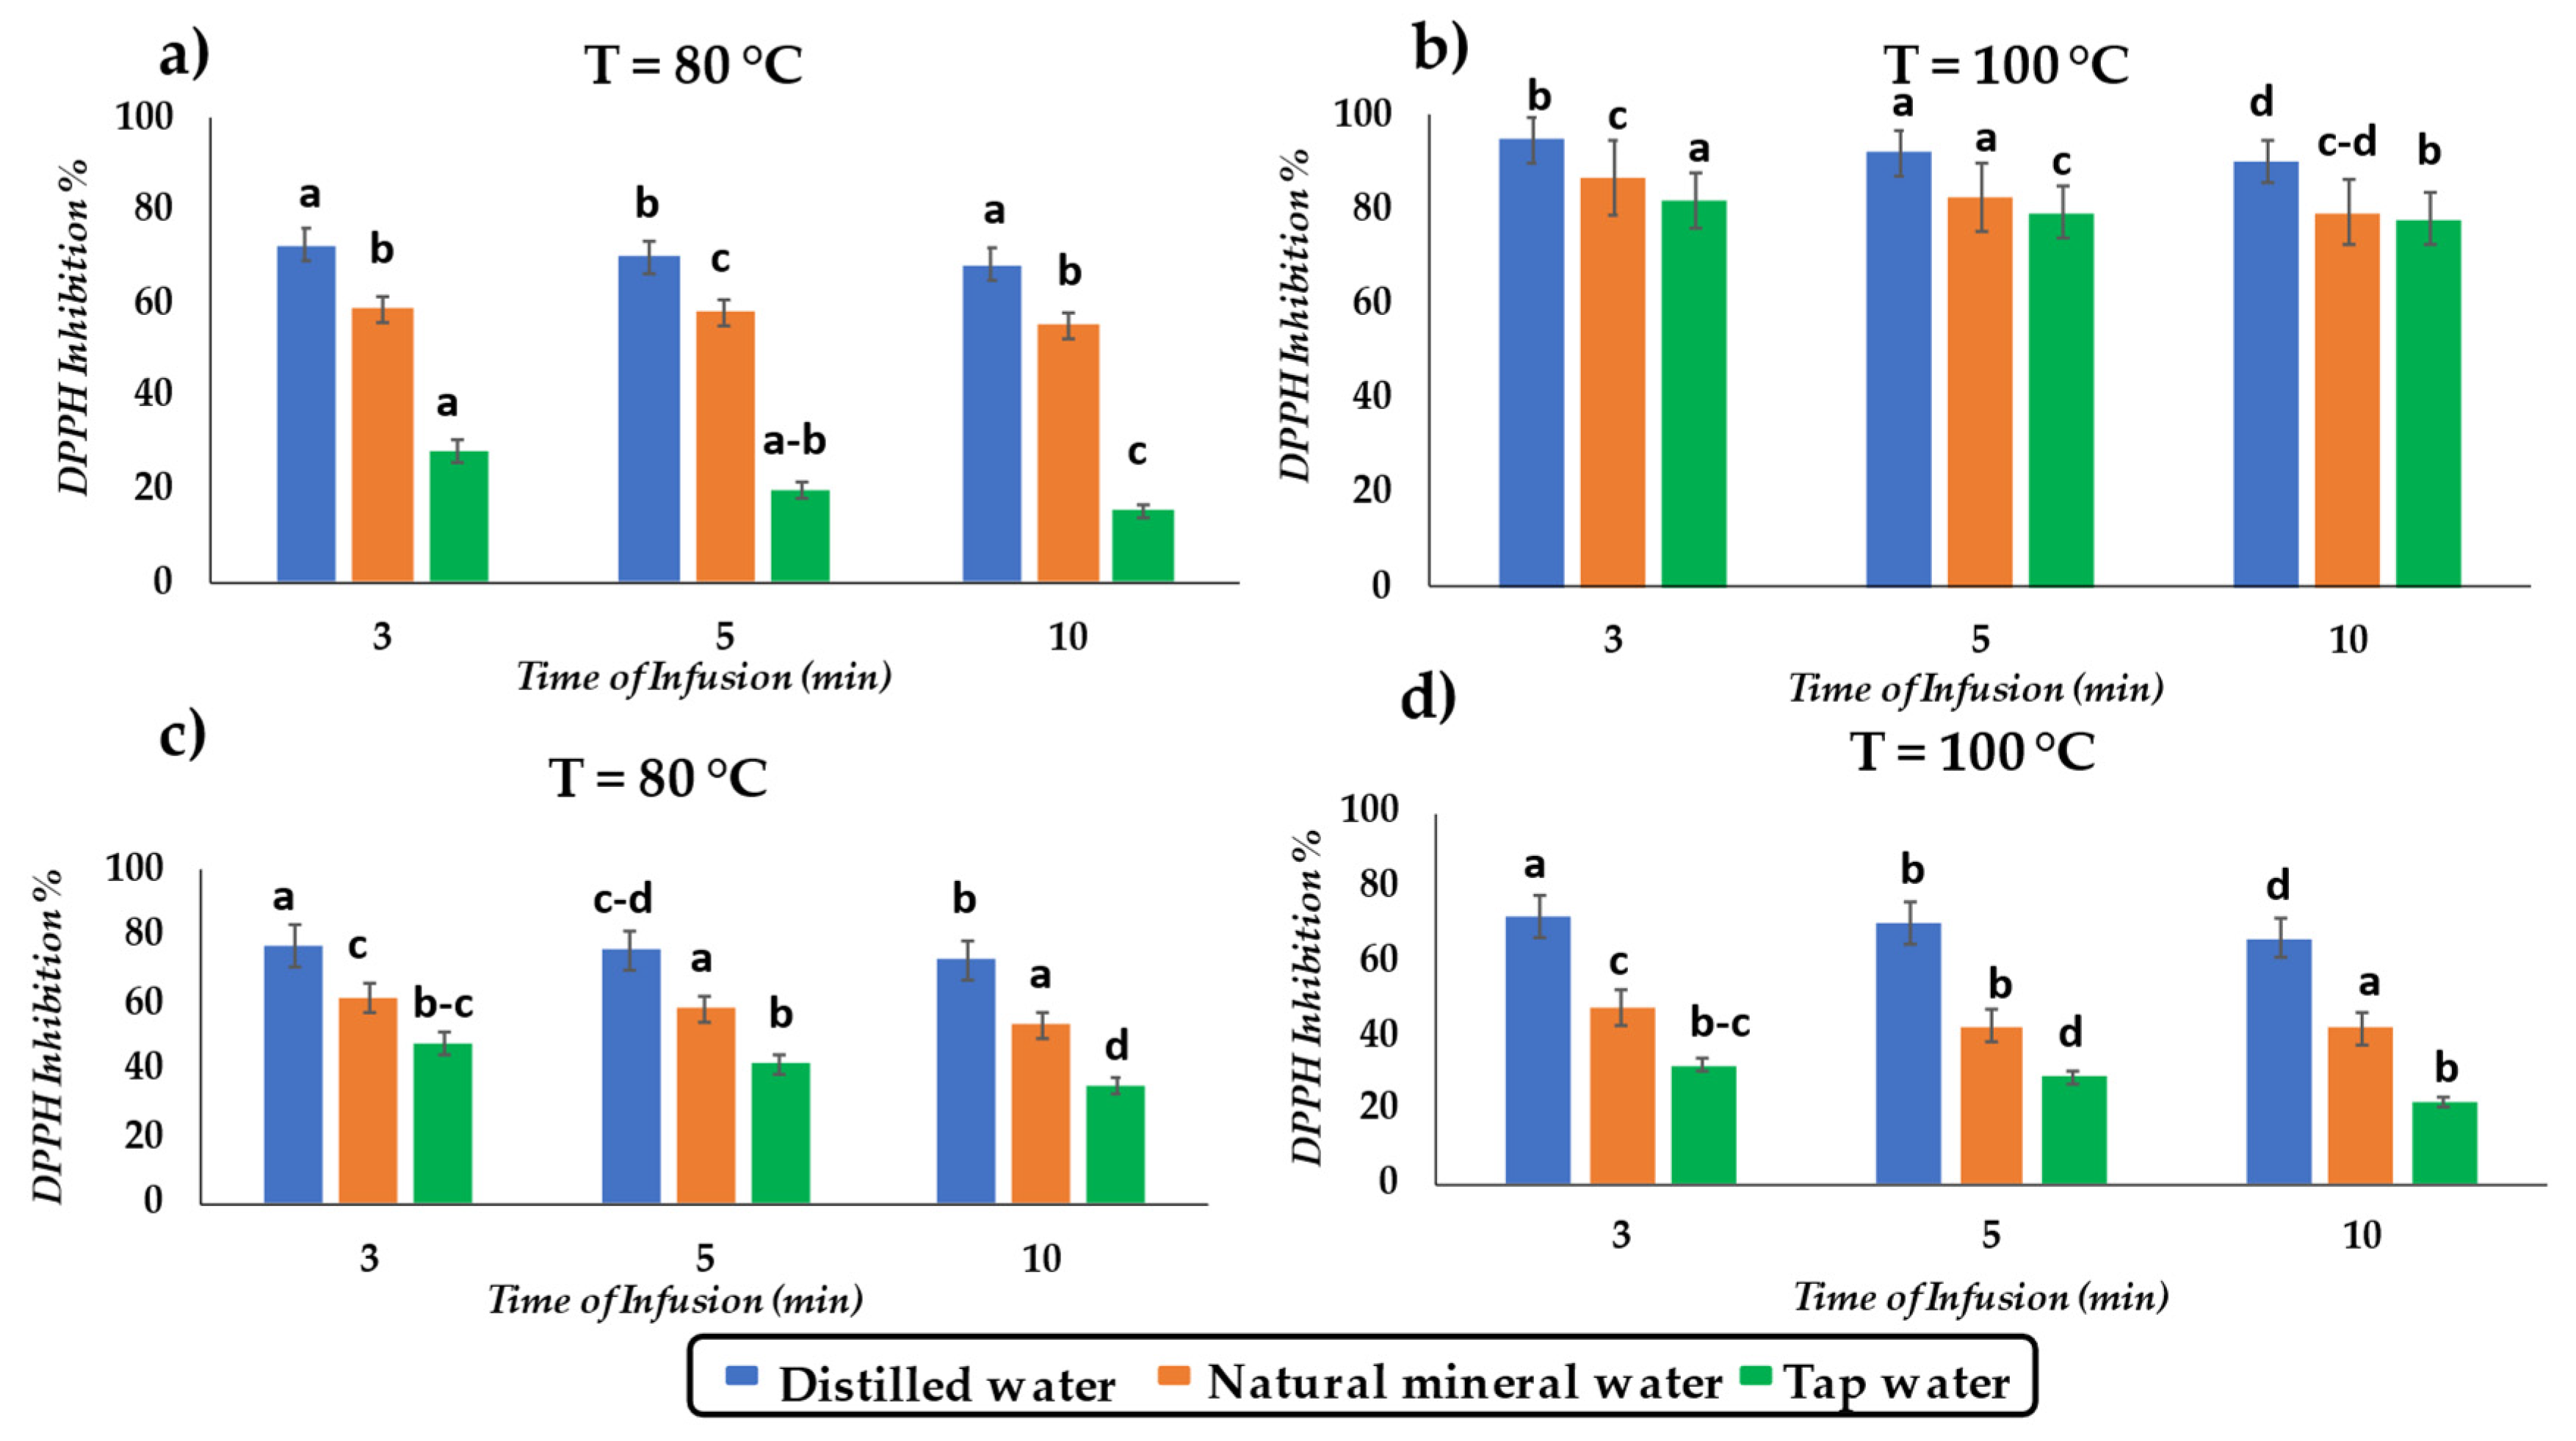
3.4. DPPH Activity of Tea Infusions
4. Conclusions
Author Contributions
Funding
Institutional Review Board Statement
Informed Consent Statement
Conflicts of Interest
References
- FAO. Report: World Tea Production and Trade, Current and Future Development; Food and Agriculture Organization: Rome, Italy, 2015. [Google Scholar]
- Fairtrade International. Innovation and Resilience for a More Sustainable World; Annual Report 2019–2020; Fairtrade International: Bonn, Germany, 2020. [Google Scholar]
- Observatory of Economic Complexity (OEC). Available online: https://oec.world/en/profile/hs92/tea (accessed on 26 October 2021).
- Statista. Statista Consumer Market Outlook—Segment Report. 2021. Available online: https://0-www-statista-com.brum.beds.ac.uk/study/48824/tea-report/ (accessed on 26 October 2021).
- Takemoto, M.; Takemoto, H. Synthesis of Theaflavins and Their Functions. Molecules 2018, 23, 918. [Google Scholar] [CrossRef] [PubMed] [Green Version]
- Diniz, P.H.G.D.; Barbosa, M.F.; de Melo Milanez, K.D.T.; Pistonesi, M.F.; de Araújo, M.C.U. Using UV–Vis spectroscopy for simultaneous geographical and varietal classification of tea infusions simulating a home-made tea cup. Food Chem. 2016, 192, 374–379. [Google Scholar] [CrossRef] [PubMed]
- Gonçalves Bortolini, D.; Windson Isidoro Haminiuk, C.; Cristina Pedro, A.; de Andrade Arruda Fernandes, I.; Maria Maciel, G. Processing, chemical signature, and food industry applications of Camellia sinensis teas: An overview. Food Chem. 2021, 12, 100160. [Google Scholar] [CrossRef] [PubMed]
- Teixeira, A.M.; Sousa, C. A review on the Biological Activity of Camellia Species. Molecules 2021, 26, 2178. [Google Scholar] [CrossRef]
- Jeszka-Skowron, M.; Zgoła-Grześkowiak, A.; Frankowski, R. Cistus incanus a promising herbal tea rich in bioactive compounds: LC–MS/MS determination of catechins, flavonols, phenolic acids and alkaloids—A comparison with Camellia sinensis, Rooibos and Hoan Ngoc herbal tea. J. Food Compost. Anal. 2018, 74, 71–81. [Google Scholar] [CrossRef]
- Siddiqui, I.A.; Adhami, V.M.; Saleem, M.; Mukhtar, H. Beneficial effects of tea and its polyphenols against prostate cancer. Mol. Nutr. Food Res. 2006, 50, 130–143. [Google Scholar] [CrossRef]
- Graham, G.H. Green tea composition, consumption, and polyphenol chemistry. Prev. Med. 1992, 21, 334–350. [Google Scholar] [CrossRef]
- Zargar, B.; Majeed, D.; Ganai, S.A.; Mir, S.A.; Dar, B.N. Effect of different processing parameters on antioxidant activity of tea. J. Food Meas. Charact. 2018, 12, 527–534. [Google Scholar] [CrossRef]
- Dhaouadi, K.; Fattouch, S.; Hamdaoui, M.H. Extraction, identification and quantification of the polyphenols of green and black tunisian tea decoctions commercialized as “Garden of Tea”. Acta Hortic. 2010, 853, 199–206. [Google Scholar] [CrossRef]
- Bhebhe, M.; Füller, T.N.; Chipurura, B.; Muchuweti, M. Effect of solvent type on total phenolic content and free radical scavenging activity of black tea and herbal infusions. Food Anal. Methods 2016, 9, 1060–1067. [Google Scholar] [CrossRef]
- Orak, H.; Yagar, H.; Isbilir, S.; Demirci, A.; Gumus, T. Antioxidant and antimicrobial activities of white, green and black tea extracts. Acta Aliment. 2013, 42, 379–389. [Google Scholar] [CrossRef]
- Anand, J.; Upadhyaya, B.; Rawat, P.; Rai, N. Biochemical characterization and pharmacognostic evaluation of purified catechins in green tea (Camellia sinensis) cultivars of India. 3 Biotech. 2015, 5, 285–294. [Google Scholar] [CrossRef] [PubMed] [Green Version]
- Nibir, Y.M.; Sumit, A.F.; Akhand, A.A.; Ahsan, N.; Hossain, M.S. Comparative assessment of total polyphenols, antioxidant and antimicrobial activity of different tea varieties of Bangladesh. Asian Pac. J. Trop. Biomed. 2017, 7, 352–357. [Google Scholar] [CrossRef]
- Li, Y.; Du, Y.; Zou, C. Effects of pH on antioxidant and antimicrobial properties of tea saponins. Eur. Food Res. Technol. 2009, 228, 1023–1028. [Google Scholar] [CrossRef]
- Somsong, P.; Tiyayon, P.; Srichamnong, W. Antioxidant of green tea and pickle tea product, miang, from northern Thailand. Acta Hortic. 2018, 1210, 241–248. [Google Scholar] [CrossRef]
- McAlpine, M.; Ward, W.E. Influence of steep time on polyphenol content and antioxidant capacity of black, green, rooibos and herbal tea. Beverages 2016, 2, 17. [Google Scholar] [CrossRef]
- Das, A.; Kalita, A.; Raychaiudhuri, U.; Chakraborty, R. Synergistic effect of herbal plant extract (Hibiscus subdariffa) in maintain the antioxidant activity of decaffeinated green tea from various parts of Assam. J. Food Sci. Technol. 2019, 56, 5009–5016. [Google Scholar] [CrossRef]
- Cleverdon, R.; Elhalaby, Y.; McAlpine, M.; Gittings, W.; Ward, W.E. Total polyphenol content and antioxidant capacity of tea bags: Comparison of Black, green, red rooibos, chamomile and peppermint over different steep time. Beverages 2018, 4, 15. [Google Scholar] [CrossRef] [Green Version]
- Astill, C.; Birch, M.R.; Dacombe, C.; Humphrey, P.G.; Martin, P.T. Factors Affecting the Caffeine and Polyphenol Contents of Black and Green Tea Infusions. J. Agric. Food Chem. 2001, 49, 5340–5347. [Google Scholar] [CrossRef]
- Dorkbuakaew, N.; Ruengnet, P.; Pradmeeteekul, P.; Nimkamnerd, J.; Nantitanon, W.; Thitipramote, N. Bioactive compounds and antioxidant activities if Camellia sinensis var. assamica in different leave maturity from Northern Thailand. Int. Food Res. J. 2016, 23, 2291–2295. [Google Scholar]
- Fernando, C.D.; Soysa, P. Extraction kinetics of phytochemicals and antioxidant activity during black tea (Camellia sinensis L.) brewing. Nutr. J. 2015, 14, 74. [Google Scholar] [CrossRef] [PubMed] [Green Version]
- Enam, F.; Mursalat, M.; Guha, U.; Aich, N.; Anik, M.I.; Nisha, N.S.; Esha, A.A.; Khan, M.S. Dental erosion potential of beverages and bottled drinking water in Bangladesh. Int. J. Food Prop. 2017, 20, 2499–2510. [Google Scholar] [CrossRef] [Green Version]
- Rapa, M.; Ciano, S.; Ruggieri, R.; Vinci, G. Bioactive compounds in cherry tomatoes (Solanum Lycopersicum var. Cerasiforme): Cultivation techniques classification by multivariate analysis. Food Chem. 2021, 355, 129630. [Google Scholar] [CrossRef]
- Thaipong, K.U.; Boonprakob, K.; Crosby, L.; Cisneros-Zevallos, D.; Hawkins, B. Comparison of ABTS, DPPH, FRAP, and ORAC assays for estimating antioxidant activity from guava fruit extracts. J. Food Compos. Anal. 2006, 19, 669–675. [Google Scholar] [CrossRef]
- Zujko, M.E.; Witkowska, A.M. Antioxidant Potential and Polyphenol Content of Selected Food. Int. J. Food Prop. 2011, 14, 300–308. [Google Scholar] [CrossRef]
- Álvarez, R.; Araya, H.; Navarro-Lisboa, R.; Lopez de Dicastillo, C. Evaluation of Polyphenol Content and Antioxidant Capacity of Fruits and Vegetables Using a Modified Enzymatic Extraction. Food Technol. Biotechnol. 2016, 54, 462–467. [Google Scholar] [CrossRef]
- Simsek, M.; Sufer, O. Infusion of walnut (Juglans regia L.) shell tea: Multi response optimization and antioxidant potential. J. Appl. Res. Med. Aromat. Plants 2020, 20, 100278. [Google Scholar] [CrossRef]
- Kowalska, J.; Marzec, A.; Domian, E. Influence of Tea Brewing Parameters on the Antioxidant Potential of Infusions and Extracts Depending on the Degree of Processing of the Leaves of Camellia sinensis. Molecules 2021, 26, 4773. [Google Scholar] [CrossRef]
- Ananingsih, V.K.; Sharma, A.; Zhou, W. Green tea catechins during food processing and storage: A review on stability and detection. Food Res. Int. 2013, 50, 469–479. [Google Scholar] [CrossRef]
- Vuong, Q.V.; Golding, J.B.; Stathopoulos, C.E.; Roach, P.D. Effects of aqueous brewing solution pH on the extraction of the major green tea constituents. Food Res. Int. 2013, 53, 713–719. [Google Scholar] [CrossRef]
- Gadkari, P.V.; Balaraman, M. Catechins: Sources, extraction and encapsulation: A review. Food Bioprod. Process. 2015, 93, 122–138. [Google Scholar] [CrossRef]
- Wyrostek, J.; Kowalski, R. The Effect of Water Mineralization on the Extraction of Active Compounds from Selected Herbs and on the Antioxidant Properties of the Obtained Brews. Foods 2021, 10, 1227. [Google Scholar] [CrossRef] [PubMed]
- Dudonné, S.; Vitrac, X.; Coutière, P.; Woillez, M.; Mérillon, J.M. Comparative study of antioxidant properties and total phenolic content of 30 plant extracts of industrial interest using DPPH, ABTS, FRAP, SOD, and ORAC assays. J. Agric. Food Chem. 2009, 57, 1768–1774. [Google Scholar] [CrossRef] [PubMed]
- Roshanak, S.; Rahimmalek, M.; Goli, S.A.H. Evaluation of seven different drying treatments in respect to total flavonoid, phenolic, vitamin C content, chlorophyll, antioxidant activity and color of green tea (Camellia sinensis or C. assamica) leaves. J. Food Sci. Techol. 2015, 53, 721–729. [Google Scholar] [CrossRef] [Green Version]
- Prior, R.L.; Wu, X.; Schaich, K. Standardized Methods for the determination of antioxidant capacity and phenolics in food and dietary supplementation. J. Agric. Food Chem. 2005, 10, 4290–4302. [Google Scholar] [CrossRef]


| Parameter | Unit | NMW | TP | DW |
|---|---|---|---|---|
| Electrical conductivity at 20 °C | µS/cm | 668 | 571 | 6.8 |
| pH | - | 7.06 | 7.50 | 7.00 |
| Fixed residue | mg/L | 440 | 408 | <1 |
| Hardness | F° | 13.3 | 33.5 | <0.01 |
| Calcium (Ca2+) | mg/L | 124 | 104.0 | - |
| Magnesium (Mg+) | mg/L | 29.4 | 18.70 | - |
| Sodium (Na+) | mg/L | 4.0 | 4.1 | - |
| Potassium (K+) | mg/L | 1.2 | 0.97 | - |
| Bicarbonate (HCO3−) | mg/L | 498 | 399 | - |
| Sulfates (SO42−) | mg/L | 17.2 | 16.60 | - |
| Chlorides (Cl−) | mg/L | 6.6 | 6.5 | - |
| Nitrates (NO3−) | mg/L | 2 | 2.99 | - |
| Nitrites (NO2−) | mg/L | <0.002 | <0.01 | - |
Publisher’s Note: MDPI stays neutral with regard to jurisdictional claims in published maps and institutional affiliations. |
© 2022 by the authors. Licensee MDPI, Basel, Switzerland. This article is an open access article distributed under the terms and conditions of the Creative Commons Attribution (CC BY) license (https://creativecommons.org/licenses/by/4.0/).
Share and Cite
Vinci, G.; D’Ascenzo, F.; Maddaloni, L.; Prencipe, S.A.; Tiradritti, M. The Influence of Green and Black Tea Infusion Parameters on Total Polyphenol Content and Antioxidant Activity by ABTS and DPPH Assays. Beverages 2022, 8, 18. https://0-doi-org.brum.beds.ac.uk/10.3390/beverages8020018
Vinci G, D’Ascenzo F, Maddaloni L, Prencipe SA, Tiradritti M. The Influence of Green and Black Tea Infusion Parameters on Total Polyphenol Content and Antioxidant Activity by ABTS and DPPH Assays. Beverages. 2022; 8(2):18. https://0-doi-org.brum.beds.ac.uk/10.3390/beverages8020018
Chicago/Turabian StyleVinci, Giuliana, Fabrizio D’Ascenzo, Lucia Maddaloni, Sabrina Antonia Prencipe, and Margherita Tiradritti. 2022. "The Influence of Green and Black Tea Infusion Parameters on Total Polyphenol Content and Antioxidant Activity by ABTS and DPPH Assays" Beverages 8, no. 2: 18. https://0-doi-org.brum.beds.ac.uk/10.3390/beverages8020018