
The Healthy Eater’s Idea and Related Behavior of a Healthy Diet—A Case Study with Kombucha Drinkers


1
Department of Food Science and Technology, College of Agricultural and Environmental Sciences, University of Georgia, Griffin, GA 30223, USA
2
Experimental Statistics, College of Agricultural and Environmental Sciences, University of Georgia, Griffin, GA 30223, USA
*
Author to whom correspondence should be addressed.
Beverages 2022, 8(2), 25; https://0-doi-org.brum.beds.ac.uk/10.3390/beverages8020025
Submission received: 28 February 2022
/
Revised: 13 April 2022
/
Accepted: 14 April 2022
/
Published: 18 April 2022
(This article belongs to the Special Issue Plant-Based Beverages: Consumer Perception, Motivation and Demand in a Fast-Rising Market)
Abstract
:Consumers’ demand for ‘healthy’ food is growing at a fast pace. Beverages are one of the fastest-growing segments in the healthy food market. Kombucha is a product with a rapid market growth and is considered a ‘healthy beverage’. Kombucha drinkers (n = 296) in the contiguous United States (U.S.) were targeted to investigate differences in the various consumer segments regarding the healthy eater’s behavior, namely—(1) healthy diet stage-of-change attitudes, (2) healthy eating criteria, and (3) label information usage. An online survey questionnaire was used as a data collection tool. The data were analyzed via chi-square tests and multiple correspondence analysis (MCA). The majority of kombucha consumers were health-conscious and kombucha fitted into their view of a healthy diet. The female, older, western U.S. residents, and higher-educated consumers were more likely to take action and maintain a healthier diet. Healthy eaters’ idea of a healthy diet was very similar to that of the general population. Kombucha consumers focused mainly on sugar/calories and natural/organic ingredients. Additional investigations to expand the understanding of the healthy eater’s behavior with actual kombucha samples are needed in the future.
1. Introduction
1.1. Kombucha
Kombucha is a tea beverage, which is fermented with a symbiotic culture of bacteria and yeast (SCOBY) [1,2,3]. The word ‘healthy’ has been often used to describe kombucha in the literature [2,3,4]. In the late 2010s, kombucha captured the consumers’ attention as a healthy alternative to soft drinks in the U.S. [5]. The global market size of kombucha was USD (United States Dollars) 1.7 billion in 2019 [6]. The market is expected to continue its growth and reach ~USD 8 billion by the end of 2026 [7]. North America is the biggest market for kombucha at the global level [7,8]. With the increasing attention towards kombucha, many of the multinational food and beverage companies have started to enter the kombucha market by acquiring or investing in kombucha companies [8]. One of the examples of this is Pepsi Co.’s acquisition of a California-based kombucha company—KeVita—in 2016 [9]. In the 2017 annual report, Pepsi Co. included their kombucha brand in the ‘good-for-you’ category. The partial definition of ‘good-for-you’ includes the option that helps consumers meet the recommended daily intake of vegetables and fruits with low to no added sugars [10]. Most commercial kombucha products in the U.S. advertise its healthfulness by using terms like ‘healthy for your gut’ and ‘live culture’ [8].
1.2. Stage-of-Change
Stage-of-change is a psychographic construct based on the Transtheoretical Model (TTM), which is also called the stage-of-change model. TTM assumes that an individual’s behavior goes through certain stages to change their behavior [11,12]. First used in the smoking intervention for smokers, TTM is widely used nowadays in lifestyle intervention studies in food choices and dietary behaviors. Some examples of studies related to food choices and dietary behaviors are: fat and junk food avoidance [13], fruit and vegetable consumption [13,14,15,16], and nutrition label usage [17].
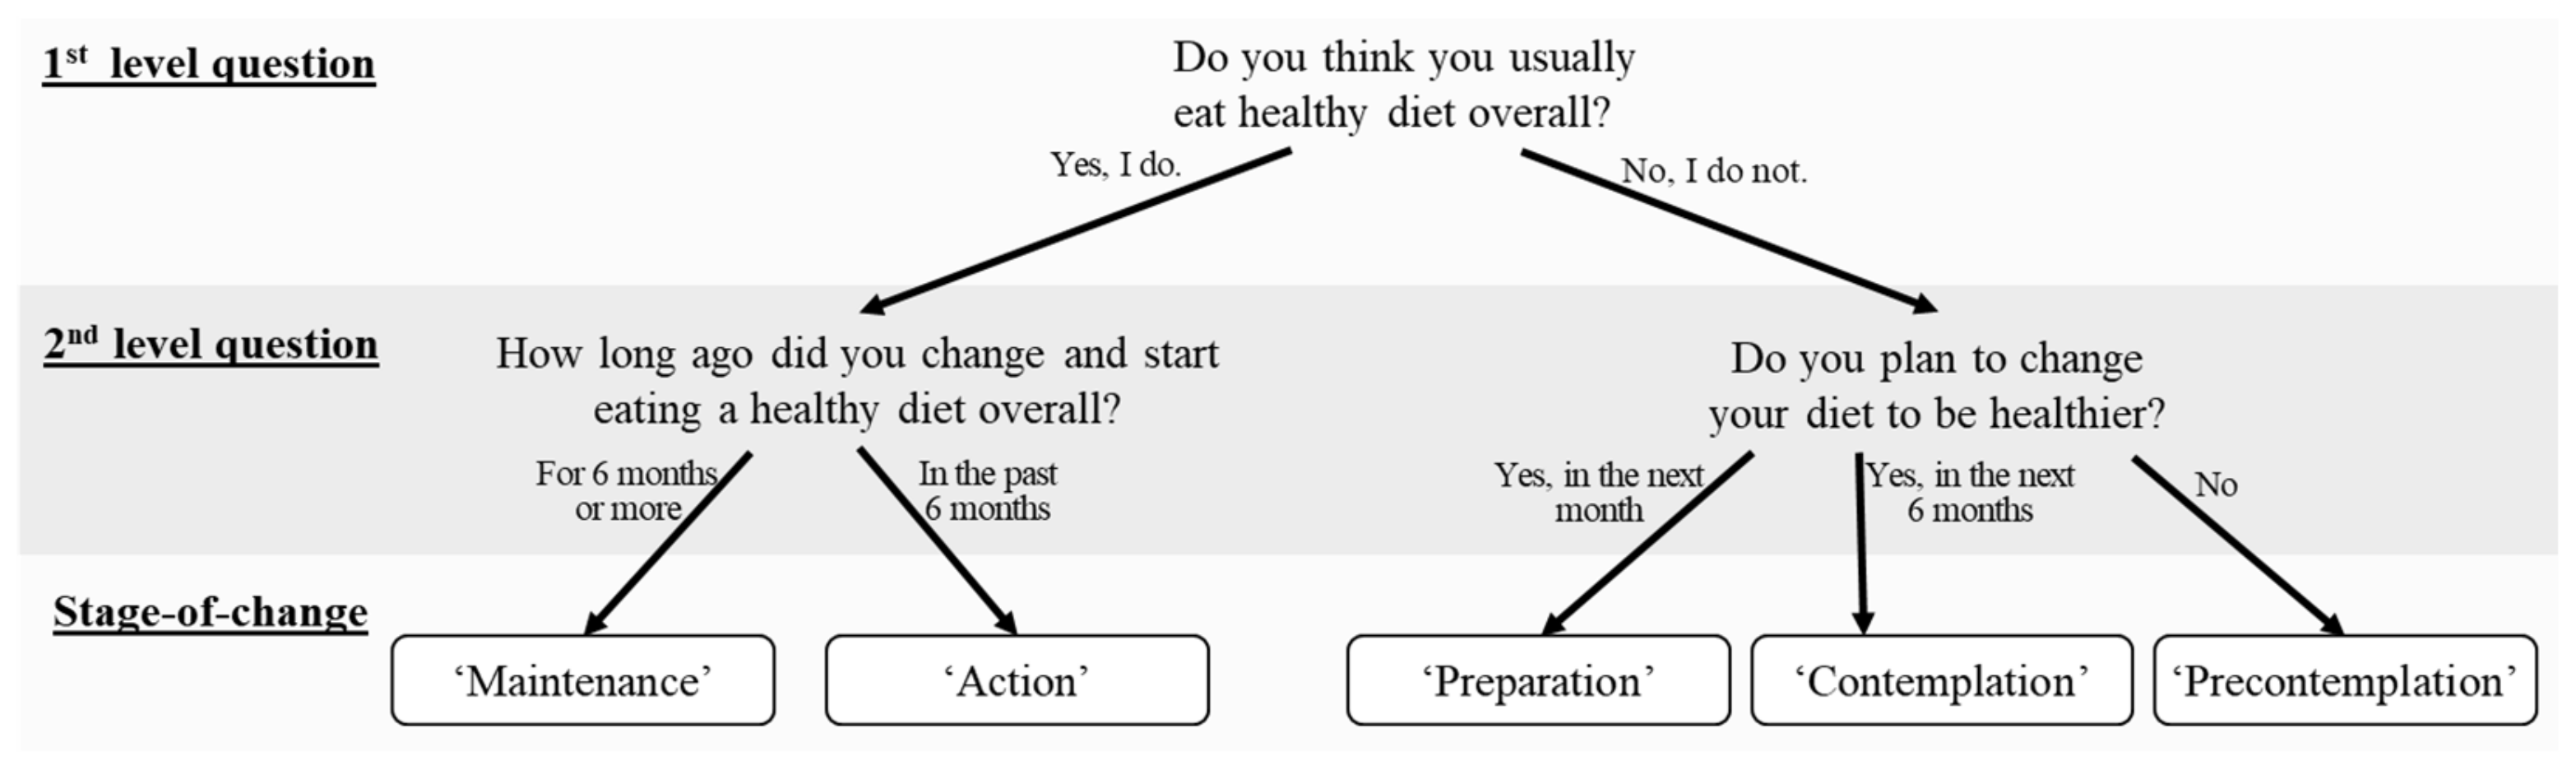
The TTM behavioral change process has five stages: 1. Precontemplation (unaware of the situation, no intention of changing), 2. Contemplation (aware and thinking of changing but not yet committed), 3. Preparation (making plans to change), 4. Action (behavior adjustment of actively modifying), and 5. Maintenance (maintain their changes for at least six months) [18,19,20]. The stage-of-change level is assessed by asking two-level questions related to the behavior changes. The first question asks the participants if they had taken an action and changed their behavior. If the answer is yes, the participants will be asked if the action was taken, and if the behavior was continued in the past 6 months (Action) or for more than 6 months (Maintenance). If the answer to the first question was a ‘no’, the participant is asked whether one does not have plans to change the behavior (Precontemplation), is considering changing the behavior in the next 6 months (Contemplation), or is considering changing the behavior in the next month (Preparation) [11,19].
1.3. Healthy Eating
Healthy eating is known to promote health and reduce the risk of diseases. Every five years, the United States Department of Agriculture (USDA) in conjunction with the Department of Health and Human Services (DHHS) releases the Dietary Guidelines for Americans (DGA) [21]. Although these guidelines target policymakers and health professionals, the public is indirectly affected via policy, advertisement, and commercials based on the guidelines. From the 2015–2020 DGA, the limit of sugar and saturated fat intake has been lowered to <10% of calories per day [21,22]. The consumers’ perception of healthy eating includes increasing their intake of fresh vegetables, fruits, and quality proteins, and also limiting the intake of sugar, salt, and fat [23,24,25]. The idea of the ‘ideal healthy diet’ is very homogeneous among countries and various socio-demographic groups [25].
1.4. Label and Ingredient
Commercial products in the U.S. are required to have a nutrition facts label and an ingredient list [26]. The ingredients are listed in descending order of the proportion by weight of each ingredient with its common or usual name. It has been reported that more than half of Americans read the nutrition facts label and/or the ingredient list when purchasing a food or beverage [27,28,29]. Consumers who look for healthy food use nutrition labels and seek out nutrition information [28,30,31]. In the nutritional fact sheets, caloric values and sugar contents are the main focus of consumers [27,29]. In general, consumers seem to be concerned about the amount and type of sugar in the food they consume [27]. The nutritional fact label was updated in 2016 by the U.S. Food and Drug Administration, which included making the caloric information larger and adding information on added sugars [32]. This allowed consumers to focus better on the caloric value [33,34] and sugar content [34,35] of the sugar sweetened beverages. The use of nutritional facts or ingredient lists is known to be influenced by gender, age, education, and income [28]. The trend of ‘clean labels’, which includes ‘organic’, ‘natural’, and ‘free from’ artificial ingredients/additives, is also garnering attention in the food and beverage industry because the consumer demands for products with clean labels are increasing in the market [36,37,38,39,40].
1.5. Objectives
Although kombucha has been marketed primarily as a healthy beverage, the place of kombucha in the consumers’ concept of a healthy diet is not known. The kombucha market has been growing rapidly in recent years; however, it is not clear how the consumers process the label and ingredient list information. Therefore, our research’s main objective was to collect quantitative information on the kombucha drinkers’ idea of healthy eating and the usage of the kombucha label and ingredients list by different consumer segments. The specific objectives of the research were to investigate differences in the various consumer segments regarding the healthy eater’s behavior in the context of their: (1) healthy diet stage-of-change attitudes, (2) healthy eating criteria, and (3) label information usage. An online survey instrument was created (Appendix A) and administered by Qualtrics® (Provo, UT, USA) for data collection.
2. Materials and Methods
2.1. Consumer Survey
A total of 300 kombucha consumers participated in the online survey. The duration of the survey data collection was eight days, from 18–26 June 2020. Among the 300 consumers in the study, 296 said kombucha fits into their idea of healthy eating. The data of 296 who viewed kombucha as healthy were used to focus on their concept of healthy eating and the label and ingredient usage. The participants were screened before starting the survey to ensure the criteria were met. The criteria of the screening were as follows: (1) age 18–65 y, (2) 40–50% male and 50–60% female, (3) equally distributed in four regions of the U.S.—Midwest, Northeast, South, and West, with a minimum of 50 in each region, and (4) those who consume kombucha more than once a month. The qualified participants who consented to voluntary participation were allowed to proceed with the survey. The survey administration was managed by Qualtrics®, where they were responsible for screening the consumers in their database according to our screening criteria.
2.2. Survey Questionnaire
The survey questionnaire (Appendix A) was comprised of five sections: (A) healthy eating, (B) kombucha label and ingredient, (C) psychographic—stage-of-change, (D) demographics, and (E) geographic (Appendix A). Various sources, such as the published literature, focus group studies, and general demographic questions were used to develop the survey. The question items for the section (A) healthy eating [23] and (C) psychographic—stage-of-change [41] were developed based on the published literature. The CATA items for the section (B) kombucha label and ingredients were obtained from the focus group study on kombucha drinkers.
2.3. Consumer Segmentation Groups
The demographic, geographic, and psychographic consumer segmentation (Table 1) was used to compare the healthy eating behavior. The general demographic factors (gender and generation) and socioeconomic factors (education and income) were included in the demographic segment. Except for gender, new variables were created for the rest of the demographic segmentation groups. The generation variables were created by using the participants’ year of birth (YOB)—Millennial (1981 ≤ YOB < 1997), Gen X (1965 ≤ YOB < 1981), and Boomers (YOB < 1965). Among the education levels, a new variable, ‘up to some college’, was created by combining ‘up to high school’ and ‘some college’. The income levels were categorized into two categories—high (entire household income less than USD 19,999 to USD 79,999) and high (entire household income from USD 80,000 to USD 150,000 or more). The U.S. regions (Midwest, Northeast, South, and West) were used as a geographical factor. The ‘stage-of-change’ status of the consumers was assessed by the consumers’ answer to two-level questions (Figure 1). The consumers were first asked whether they usually eat a healthy diet. If the answer was yes, the consumer was asked about the time when they changed and started eating a healthy diet in the past 6 months (Action) or whether they had maintained a healthy diet for more than 6 months (Maintenance) at the time of the survey. If the answer to the first question was a ‘no’, the consumer was asked whether she/he is planning ‘not’ to change their diet to be healthier (Precontemplation) or is considering changing her/his overall diet in the next 6 months (Contemplation) or is considering changing her/his overall diet in the next month (Preparation) to be more healthful. The healthy eating stage-of-change (precontemplation, contemplation, preparation, action, and maintenance) of kombucha consumers was reduced to three levels (non-action, action, and maintenance). The number of consumers in precontemplation, contemplation, and preparation was relatively low among the participants in our study. Since those three levels were composed of 10% of the total number of consumers, the three segments comprising of precontemplation, contemplation, and preparation, were combined to generate a new segment group called ‘non-action’.
2.4. Data Analysis
Categorial data were generated as a result of this survey, mainly single choice, and check-all-that-apply (CATA). For the analysis, contingency tables were created. Chi-square (χ2) test was performed to find the effect of consumer segments on each attribute, followed by the multiple correspondence analysis (MCA) using the chi-square distances to visualize the multivariate results. XLSTAT-Sensory version 2021.2.1 (Addinsoft, New York, NY, USA) was used for the data analysis.
3. Results and Discussions
3.1. Stage-of-Change
The majority of kombucha consumers (89.2%) were in the ‘Action’ and ‘Maintenance’ stage in the stage-of-change steps (Table 2). Both groups considered themselves to be generally eating a healthy diet. The maintenance group was made up of those who had made changes in their diet to be more healthful and maintained it for 6 months or more. The action group had also made changes in their diet but within the past 6 months. The non-action group (10.8%) considered their overall diet to be not very healthy. The consumers in this group might or might not have had plans to change their behavior but did not want to take any action to change their diet to be more healthy. The percentages of the Action/Maintenance groups from this study were relatively high compared to other health-related stages-of-change studies. Horneffer-Giner [42] noted that the stage-of-change of healthy eating among college students was predominantly in the non-action stage (80%) with only 20% in the Action/Maintenance stage. There were a few studies where around 50% of consumers took action to eat more fruits and vegetables. In a study conducted with Malaysian consumers, the percentage of participants who took action (Action/Maintenance) to eat more fruit and vegetable was around 43% [14]. Horacek et al. [16] reported that 45.7% of young males and 50.1% of young females in the U.S. took action (Action/Maintenance) to have more fruit consumption. Thus, compared to the consumer population from the other studies on healthy eating, kombucha consumers are a group who might be more open to taking action towards a healthier diet.
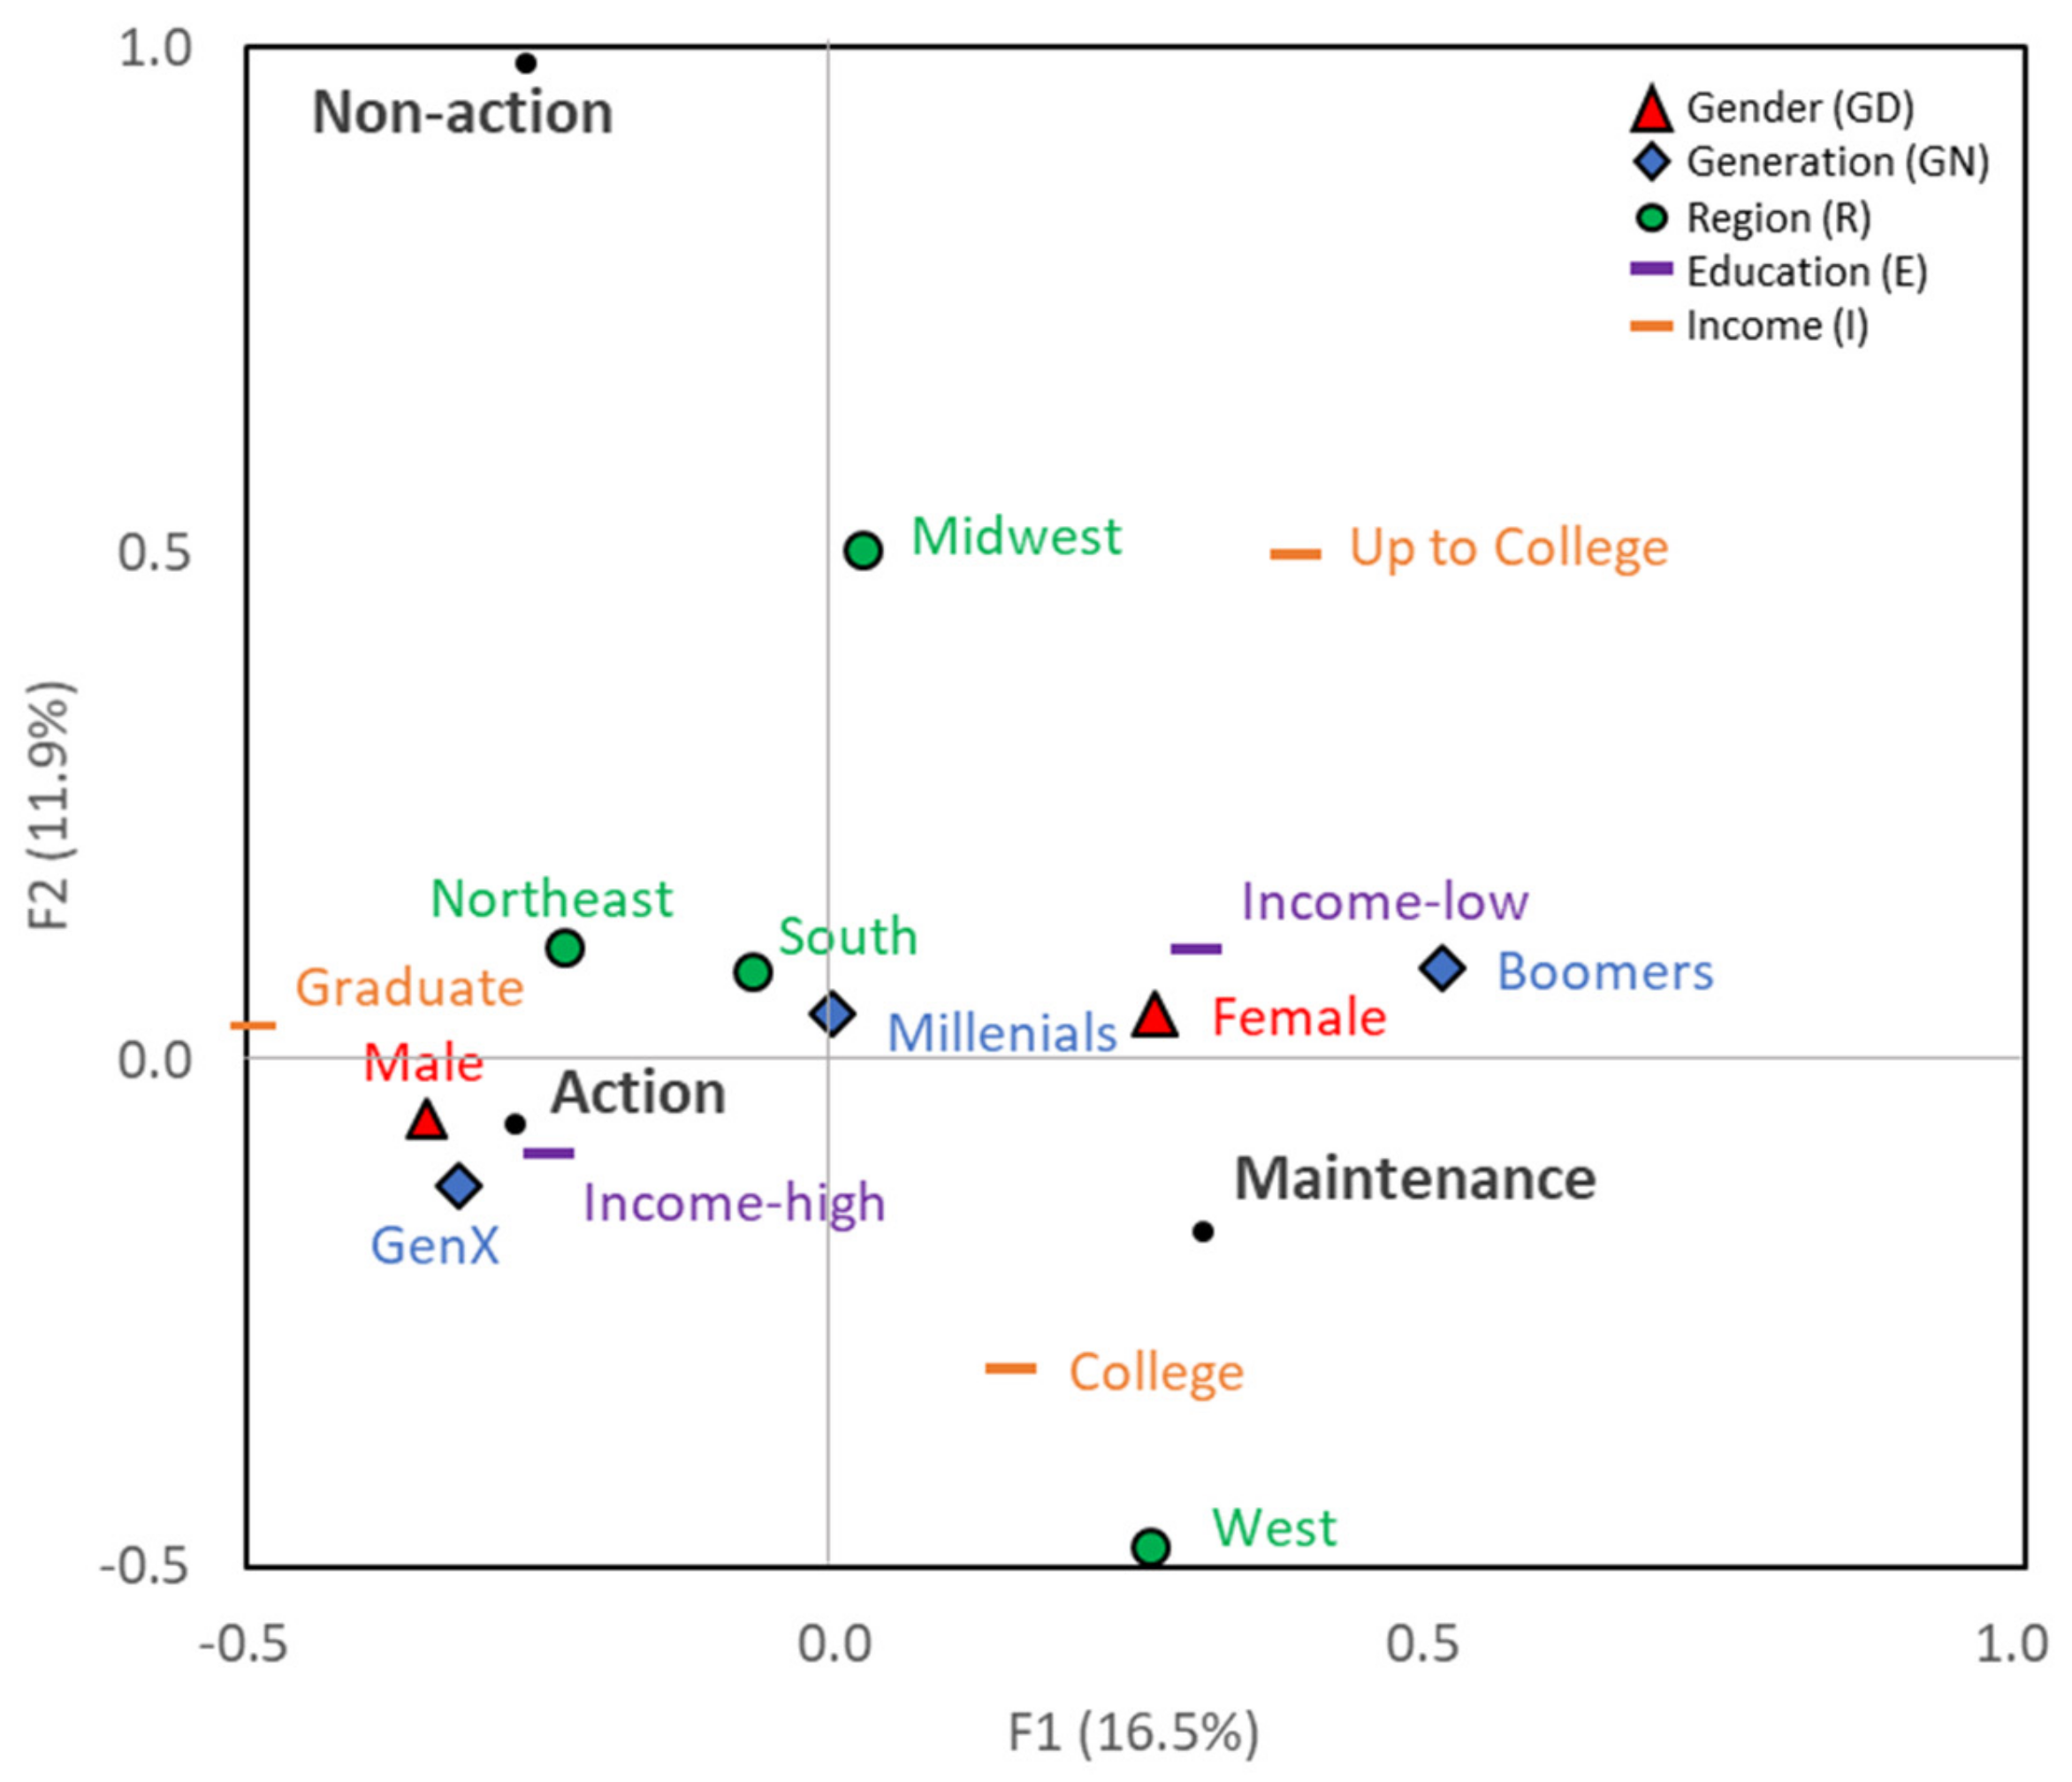
The proportion of the consumers in each stage-of-change level was influenced by both the demographic and geographic segments except for the income segments (Table 2). The effect of gender, generation, education, and region were all highly significant (p ≤ 0.01). More than half (55.3%) of the female consumers were in the maintenance group, as opposed to only 38.1% of the male consumers. This showed that more women consumers maintain a healthy diet longer than male consumers. In the generation segments, the boomers (66.2%) had a higher percentage of consumers in the maintenance group than Millennials (46.2%) or Gen X (37.5%). Among the four U.S. regions, consumers from the West region’s had an exceptionally high percentage of people who have a healthy diet, with 98.9% of those polled in the action and maintenance groups combined. The percentage of consumers in the action and maintenance groups combined was 85.4% for the South, 87.5% for Northeast, and 81.5% for the Midwest regions. The graduate school education group (53.3%) had more consumers who had started eating a healthy diet within the last six months compared to the ‘some college’ (31.1%) or ‘college degree’ (38.5%) groups. The ‘up to some college’ (52.7%) and ‘college degree’ (55.4%) groups had a higher percentage of consumers who reported that they had maintained a healthy diet for more than six months than graduate-level consumers (33.7%). This was also indicated in the MCA biplot for healthy diet stage-of-change (Figure 2). When reduced to two dimensions, dimension 1 (dim 1) explained 16.5%, and dimension 2 (dim 2) explained 11.9%, accounting for 28.4% of the total variation in the data. The ‘maintenance’ group was located in the 4th quadrant of the MCA graph with the terms ‘college’ and ‘west’ in the vicinity. The terms ‘female’ and ‘boomers’ were located on the 1st quadrant close to the ‘maintenance’ group. The ‘action’ group was located on the 3rd quadrant with ‘male’, ‘Gen X’, and ‘Graduate’.
The influence of consumer segments on healthy eating stage-of-change can also be found in other studies. Females are known to be more conscientious than males about their diets and health [43]. Among young adults in the U.S., fruit consumption stage-of-change for Action/Maintenance was higher in the female group (50.1%) than males (45.7%) [13]. When younger (19–34 years old) and older (61–78 years old) consumers were compared, older adults were in the higher stage-of-change for both healthy eating behaviors (increasing fruit and vegetable consumption and avoiding high-fat and junk food). The authors mentioned that the stage-of-change for older adults was the ‘ceiling’. This could mean that more older consumers are in the ‘Action/Maintenance’ or even just in the ‘Maintenance’ stage as compared to younger consumers. There have been several research studies conducted using gender and age as factors to examine the effect on the stage-of-change for healthy eating. However, geography and education were not commonly used as factors in such studies. One of the studies that looked at the influence of the consumers’ education on healthy eating was conducted by Glanz et al. [18]. The authors found that consumers with higher education levels tend to have a higher inclination towards healthy eating stage-of-change (fat reduction and increase in fiber intake).
3.2. Healthy Eating
3.2.1. Is Kombucha Healthy
All of the 296 kombucha consumers included in this study answered that kombucha fit into their view of a healthy diet. Kombucha has been described as healthy in the scientific literature and also in industry market research reports. When describing kombucha, researchers often used the term ‘healthy’ [2,4]. The terms such as ‘healthy for your gut’ and ‘live culture’ are commonly used to promote the healthfulness of kombucha in the U.S. market [8]. In the U.S. [10] and Australia [44], kombucha is heavily marketed as a healthy beverage. There has been a study to investigate the healthfulness of sugar-containing beverages in the Australian market [45]. Kombucha along with other beverage options such as water, coconut water, energy drink, soda, and juice were used as samples. The consumers were asked to rank the healthfulness of the beverages. Kombucha was considered to be healthier than the energy drink or soda, but less healthy compared to water or coconut water. An ordinal scale that compared the variables was used for the ranking method. It is difficult to gauge the degree of the consumers’ perception with the ordinal data obtained by ranking results. Due to the nature of the ranking method, it was not clear whether the consumers consider kombucha as a healthy beverage or not. The result from our research concluded that consumers consider kombucha to be a healthy beverage.
3.2.2. Healthy Eating
Among the 11 healthy eating options given to the consumers, seven items were chosen by more than 50% of the consumers as part of their perception of a healthy diet: ‘eating more fruits and vegetables (76.7%)’, ‘eating less “junk” and fast food (73.6%)’, ‘limiting sugar intake (68.6%)’, ‘eating more fresh (67.9%)’, ‘eating healthier protein sources (65.5%)’ ‘watching and paying more attention to what you eat (58.4%)’, and ‘eating less unhealthy fats (56.4%)’ (Table 3).
The concordant idea of a healthy diet among the kombucha consumers was (1) having more fruits and vegetables, fresh food, and healthier protein sources, (2) paying attention to what they eat, and (3) reducing or limiting fast food, sugar intake, and unhealthy fats. This accords well with the consumer’s healthy eating perception from similar studies in the literature. The online survey by International Food Information Council (IFIC) on American’s approach to making their diet healthy indicated that limiting sugars and carbohydrates, eating more fruits and vegetables, and selecting quality proteins were chosen as the common items [23]. Paquette [25] looked at healthy eating studies from different countries for 20 years. The researcher concluded that the idea of consumer’s healthy eating includes (1) increasing vegetables, fruits, and high-quality proteins, (2) limiting fat, salt, and sugar intake, (3) having fresh and unprocessed food, and (4) having a balanced and variety of food categories. The author further stated that the idea of healthy eating seems to be universal and homogeneous among all socio-demographic segments and countries.
3.3. Kombucha Label and Ingredient
3.3.1. Label Information
The terms ‘sugar content (55.4%)’ and ‘calorie (51.4%)’ were chosen by more than half of the consumers as the primary label information they read when selecting kombucha for purchase (Table 4). The consumers’ attention to sugar and calories in food and beverages has been widely documented in the literature. Consumers reported that they check calories (71%) and sugar (34%) before purchasing food or beverages [46]. From the nutrition facts panels, the most often used information are sugars (74.1%) and total calories (72.9%) [30]. Bucher and Siegrist [47] reported that sugar was one of the parts of label information that consumers check to decide on the healthfulness of a beverage. From an online survey study targeting the U.S. population, the ‘total sugar’ was chosen by consumers as one of the top three concerns when choosing beverages [48]. The updated nutritional fact panel in 2016 by the FDA will help consumers effectively obtain information on the sugar content and calories of the product [33,34,35].
Depending on what stage-of-change the consumer was at and also their gender, the usage of the label when selecting kombucha for purchase was different (Table 4). Around 20% of the non-action consumers said they do not have any specific label information that they check when selecting kombucha for purchase. This was much higher than the other two groups: action (3.3%) and maintenance (5.6%). This lack of action among the non-action group on label usage was also observed in research studies. When looking at the label usage of college students, 75.2% were categorized as the ‘non-action’ group [17]. This non-action group seemed to be curious and interested in using the label to aid the decision of healthy eating; however, they did not use the label regularly in real situations such as while buying the product. The correlation between the individuals who eat healthy food and the usage of the label has also been reported in other studies [28,30,31]. There was a noticeable difference (higher than other subgroups in each segment) of looking for ‘protein content’ for the male (42.9%) and action (48.4%) groups. The percentage of consumers considering protein content as an idea of healthy eating was 31.8% for females, 31.3% for the non-action group, and 27.5% for the maintenance group. Men’s preference for food with a high protein content was reported by Conklin et al. [49]. The attention towards protein in food such as protein-enriched foods and its effect on health and wellness has increased in recent years [50,51]. Protein-containing products are especially receiving attention among bodybuilders and athletes [52]. The general U.S. consumers’ interest in adding more protein to their diet was also reported by Nielsen [53]. Even though kombucha has not been marketed as a good source of protein, male and action groups said they check the protein on the kombucha label. This action might be due to their attempt to consume a high level of protein in the general diet, not specifically from kombucha. However, further investigation of the reason behind kombucha consumers’ attention to protein content in the label should be studied in the future.
3.3.2. Ingredient Information
Among the 12 ingredient-related factors displayed to the consumers (Table 5), the most checked ingredient information by kombucha consumers were ‘organic or natural (56.1%)’ followed by ‘natural flavoring (47%)’, and ‘kombucha content (45.9%)’. Regardless of the consumer segmentation groups that they belonged to, the information consumers look for in the ingredient list on a kombucha package was very similar. More and more consumers are now preferring and demanding natural and organic foods in the market [39,40]. The majority of commercial kombucha products in the U.S. market use statements such as ‘USDA organic’ or ‘natural’ on their bottles [8]. Murley and Chambers [54] reported that natural colors and flavors are one of the criteria that consumers use when making decisions about the naturalness of a product. Kombucha consumers also check if the kombucha that they are purchasing contains natural flavorings. Around half (45.9%) of kombucha consumers answered that they check the ‘kombucha content’ when purchasing kombucha. The ingredients on an ingredient list are listed in the descending order of the proportion by weight of the product [26]. Unlike general food labels and consumers’ use of it, how an ingredients list is used by consumers is not clearly known [55]. In the focus group study with kombucha consumers that we conducted, few consumers mentioned their knowledge of the order of the ingredients. Some participants mentioned that some of the kombucha products in the market do not mention kombucha as the first ingredient. The consumers’ awareness of the order of the ingredients list and their use of the list needs to be further investigated.
3.4. Limitations and Suggestions
The main limitation of our study is that we used an online survey instrument to collect data without actual consumer acceptability testing. The relationship between consumers’ survey responses on the labels and ingredients to their actual acceptability or behavior towards kombucha or healthy beverage products is not yet clear. Hence, a central location test with actual kombucha samples is recommended for future studies.
Kombucha drinkers are health-conscious consumers who generally have a healthy diet. Kombucha is one of the biggest growing healthy beverages in its market, and the result about its users gives valuable insight into its broader healthy food market. However, additional investigations to expand the understanding of the healthy eater’s behavior are needed in the future.
Regarding the research on the stage-of-change, there have been quite a few studies covering the effect of consumer segments such as gender and age. This research found a significant effect of region and education level on the healthy eating stage-of-change. However, we could not discuss such consumer segment effects due to the lack of the literature to reference. Studies including the various consumer segments to investigate their effect on consumer perception and behavior should be further conducted in the future.
4. Conclusions
Agreeing with the previous literature and the market advertisements describing kombucha as healthy, consumers do consider kombucha as a healthy beverage. Kombucha consumers, in general, were largely composed of individuals who are taking action to have a healthy diet. In particular, females, the older generation, Western U.S. residents, and higher-educated consumers changed and kept their behavior to have a healthy diet for a longer time. Kombucha consumers’ idea of a healthy diet was homogeneous across the various consumer segments that included: (1) increasing fresh vegetables, fruit, and quality proteins; (2) limiting fast food, sugar, and unhealthy fat. Sugar and calories were the most critical kombucha label information for this group of consumers. At the same time, organic/natural, natural flavoring, and kombucha content were checked by the kombucha consumers the most during purchase.
As the first research looking into the perception of kombucha’s healthfulness and information usage among consumers, this research will provide helpful information and insight to the researchers and the industry. Despite the kombucha drinkers’ agreement on the healthiness of the kombucha, their understanding and behavior related to a healthy diet and health-related information were somewhat heterogeneous and diverse. Thus, further investigation on the understanding and consumption behavior of kombucha consumers with kombucha samples should be carried out in the future.
Author Contributions
Conceptualization, J.K. and K.A.; methodology, J.K. and K.A.; formal analysis, J.K. and U.B.; investigation, J.K. and K.A.; data curation, J.K. and K.A.; writing—original draft preparation, J.K.; writing—review and editing, K.A.; visualization, J.K.; supervision, K.A.; project administration, J.K. and K.A. All authors have read and agreed to the published version of the manuscript.
Funding
This research received no external funding.
Institutional Review Board Statement
The study was conducted in accordance with the Declaration of Helsinki, and approved by the Institutional Review Board of University of Georgia (PROJECT00000159 dated 28 February 2019).
Informed Consent Statement
Informed consent was obtained by Qualtrics from all subjects involved in the study.
Data Availability Statement
The data presented in this article can be accessed from the corresponding author on request.
Conflicts of Interest
The authors declare no conflict of interest.
Appendix A
Consumer survey questionnaire

| Question | Data Type |
|---|---|
| [A] HEALTHY EATING | |
| What is considered eating healthy? | CATA a |
| eating fewer calories | |
| eating healthier protein sources | |
| eating less “junk” and fast food | |
| eating less carbohydrates | |
| eating less unhealthy fats | |
| eating more fresh, organic, less processed food | |
| eating more fruits and vegetables | |
| eating smaller portions or fewer unnecessary snacks | |
| limiting sugar intake | |
| switching to a vegetarian or vegan diet | |
| watching and paying more attention to what you eat | |
| Does kombucha fit into your view of a healthy diet? | Categorical |
| Yes | |
| No | |
| [B] LABEL & INGREDIENTS | |
| Please choose all the label information of kombucha that you check | CATA |
| added sugar | |
| calorie | |
| fat content | |
| live culture | |
| probiotic content of live cells | |
| probiotic strain (s) | |
| protein content | |
| serving size | |
| sugar content | |
| others, please specify | |
| none above | |
| protein content | |
| Please choose all the ingredient factors of Kombucha that you check | CATA |
| artificial coloring | |
| artificial flavoring | |
| artificial sweetener-stevia, erythritol | |
| kombucha content | |
| live culture | |
| organic or natural | |
| natural coloring | |
| natural flavoring | |
| type of tea-black tea, green tea, white tea, yerba mate | |
| type of water-sparkling water, carbonated water | |
| others, please specify | |
| none above | |
| QUESTION | DATA TYPE |
| [C] PSYCHOGRAPHIC-STAGE-OF-CHANGE | |
| Q1. Do you think you usually eat healthy diet overall? | Categorical |
| Yes, I do. → go to Q2-2 | |
| No, I do not. | |
| Q2-1. Do you plan to change your diet to be healthier? | Categorical |
| Yes, I am considering changing my overall diet in the next month to be more healthful. → ‘Preparation’ | |
| Yes, I am considering changing my overall diet in the next 6 months to be more healthful. → ‘Contemplation’ | |
| No, I have no plans to change my overall diet to increase its healthfulness. → ‘Precontemplation’ | |
| Q2-2. How long ago did you change and start eating a healthier diet overall? | Categorical |
| I made serious changes in my overall diet to be more healthful in the past 6 months → ‘Action’ | |
| I made changes to a more healthful diet and have eaten that way for 6 months or more. → ‘Maintenance’ | |
| [D] DEMOGRAPHIC | |
| Please indicate your gender. | Categorical |
| Female | |
| Male | |
| What is your year of birth? → used to generate a new variable ‘generation’ | Numeric |
| Millennial (1981 ≤ Year of Birth < 1997) | (Categorical) b |
| Gen X (1965 ≤ Year of Birth < 1981) | |
| Boomers (Year of Birth < 1965) | |
| What is the highest level of school you have completed or the highest degree you have received? | Categorical |
| Up to High school | |
| Some college | |
| College degree (Associates/Bachelors) | |
| Graduate school (Masters/MD/Ph.D.) | |
| → used to generate a new variable ‘education | |
| Up to some college-up to high school, some college | (Categorical) |
| College degree | |
| Graduate school | |
| Would you please give the best guess of your household income? Please indicate the answer that includes your entire household income in (previous year) before taxes. | Categorical |
| Less than $19,999 | |
| $20,000 to $39,999 | |
| $40,000 to $59,999 | |
| $60,000 to $79,999 | |
| $80,000 to $99,999 | |
| $100,000 to $149,999 | |
| $150,000 or more | |
| → used to generate a new variable ‘income’ | |
| Income-low-Less than $19,999 to $79,999 | (Categorical) |
| Income-high-$80,000 to $150,000 or more | |
| [E] GEOGRAPHIC | |
| In which region of the U.S. do you currently reside? | Categorical |
| Midwest | |
| Northeast | |
| South | |
| West |
[A]–[E] Categories of questions, a Check-all-that-apply, b The new data type after conversion.
References
- Dufresne, C.; Farnworth, E. Tea, kombucha, and health: A review. Food Res. Int. 2000, 33, 409–421. [Google Scholar] [CrossRef]
- Greenwalt, C.J.; Steinkraus, K.H.; Ledford, R.A. Kombucha, the fermented tea: Microbiology, composition, and claimed health effects. J. Food Prot. 2000, 63, 976–981. [Google Scholar] [CrossRef] [PubMed]
- Jayabalan, R.; Marimuthu, S.; Swaminathan, K. Changes in content of organic acids and tea polyphenols during kombucha tea fermentation. Food Chem. 2007, 102, 392–398. [Google Scholar] [CrossRef]
- Lobo, R.O.; Dias, F.O.; Shenoy, C.K. Kombucha for healthy living: Evaluation of antioxidant potential and bioactive compounds. Int. Food Res. J. 2017, 24, 541–546. [Google Scholar]
- Back, A. The Year of Fancy Water and Kombucha. Available online: https://www.wsj.com/articles/the-year-of-fancy-water-and-kombucha-11546269901 (accessed on 1 February 2022).
- Kombucha Market Size, Share & Trends Analysis Report By Flavor (Original, Flavored), By Distribution Channel (Supermarkets, Health Stores, Online Stores), By Region, And Segment Forecasts, 2020–2027: Report Summary. Available online: https://www.grandviewresearch.com/industry-analysis/kombucha-market (accessed on 1 February 2022).
- Kombucha Market Size 2020 | Global Business Strategies, Growing CAGR of 28.9%, Industry Revenue, Opportunities, Future Trends, Leading Players Update, Market Share, Analysis and Forecast by 2026. Available online: https://www.globenewswire.com/news-release/2020/07/28/2068398/0/en/Kombucha-Market-Size-2020-Global-Business-Strategies-Growing-CAGR-of-28-9-Industry-Revenue-Opportunities-Future-Trends-Leading-Players-Update-Market-Share-Analysis-and-Forecast-by-.html (accessed on 1 February 2022).
- Kim, J.; Adhikari, K. Current trends in kombucha: Marketing perspectives and the need for improved sensory research. Beverages 2020, 6, 15. [Google Scholar] [CrossRef] [Green Version]
- PepsiCo Announces Definitive Agreement to Acquire KeVita, a Leader in Fermented Probiotic Beverages. Available online: http://www.pepsico.com/news/press-release/pepsico-announces-definitive-agreement-to-acquire-kevita-a-leader-in-fermented-p11222016 (accessed on 1 February 2022).
- PepsiCo, Inc. Annual Report 2017. Available online: https://www.pepsico.com/docs/album/ets-testing-dont-delete-docs/pepsico-inc-2017-annual-report.pdf?sfvrsn=c6508fb3_2 (accessed on 1 February 2022).
- Prochaska, J.O.; DiClemente, C.C. Stages of change in the modification of problem behaviors. Prog. Behav. Modif. 1992, 28, 183–218. [Google Scholar]
- Prochaska, J.O.; Velicer, W.F. The transtheoretical model of health behavior change. Am. J. Health Promot. 1997, 12, 38–48. [Google Scholar] [CrossRef]
- Miller, L.M.S.; Cassady, D.L. Making healthy food choices using nutrition facts panels. The roles of knowledge, motivation, dietary modifications goals, and age. Appetite 2012, 59, 129–139. [Google Scholar] [CrossRef] [Green Version]
- Yen, W.C.; Shariff, Z.M.; Kandiah, M.; Taib, M.N.M. Stages of change to increase fruit and vegetable intake and its relationships with fruit and vegetable intake and related psychosocial factors. Nutr. Res. Pract. 2014, 8, 297–303. [Google Scholar] [CrossRef] [Green Version]
- Greene, G.W.; Fey-Yensan, N.; Padula, C.; Rossi, S.; Rossi, J.S.; Clark, P.G. Differences in psychosocial variables by stage of change for fruits and vegetables in older adults. J. Am. Diet. Assoc. 2004, 104, 1236–1243. [Google Scholar] [CrossRef]
- Horacek, T.M.; White, A.; Betts, N.M.; Hoerr, S.; Georgiou, C.; Nitzke, S.; Greene, G. Self-efficacy, perceived benefits, and weight satisfaction discriminate among stages of change for fruit and vegetable intakes for young men and women. J. Am. Diet. Assoc. 2002, 102, 1466–1470. [Google Scholar] [CrossRef]
- Smith, A.; Petty, S.; Drake, T. Applying the transtheoretical model to nutrition facts label use among college students. J. Nutr. Educ. Behav. 2018, 50, S116. [Google Scholar] [CrossRef]
- Glanz, K.; Patterson, R.E.; Kristal, A.R.; DiClemente, C.C.; Heimendinger, J.; Linnan, L.; McLerran, D.F. Stages of change in adopting healthy diets: Fat, fiber, and correlates of nutrient intake. Health Educ. Q. 1994, 21, 499–519. [Google Scholar] [CrossRef] [PubMed]
- Norcross, J.C.; Krebs, P.M.; Prochaska, J.O. Stages of change. J. Clin. Psychol. 2011, 67, 143–154. [Google Scholar] [CrossRef]
- Prochaska, J.O.; Norcross, J.C. Stages of change. Psychotherapy 2001, 38, 443–448. [Google Scholar] [CrossRef]
- U.S. Department of Health and Human Services; U.S. Department of Agriculture. 2015–2020 Dietary Guidelines for Americans. 8th Edition. December 2015. Available online: https://health.gov/our-work/food-nutrition/previous-dietary-guidelines/2015 (accessed on 1 February 2022).
- U.S. Department of Agriculture; U.S. Department of Health and Human Services. Dietary Guidelines for Americans, 2020–2025. 9th Edition. December 2020. Available online: https://www.dietaryguidelines.gov/ (accessed on 1 February 2022).
- 2019 Food and Health Survey. Available online: https://foodinsight.org/2019-food-and-health-survey (accessed on 1 February 2022).
- Margetts, B.M.; Martinez, J.A.; Saba, A.; Holm, L.; Kearney, M.; Moles, A. Definitions of ‘healthy’ eating: A pan-EU survey of consumer attitudes to food, nutrition and health. Eur. J. Clin. Nutr. 1997, 51, S23–S29. [Google Scholar]
- Paquette, M. Perceptions of healthy eating: State of knowledge and research gaps. Can. J. Public Health 2005, 96 (Suppl. 3), S15–S19. [Google Scholar] [CrossRef]
- U.S. Food & Drug Administration. CFR—Code of Federal Regulations Title 21 Part 101 Food Labeling. Available online: https://www.accessdata.fda.gov/scripts/cdrh/cfdocs/cfcfr/CFRSearch.cfm?CFRPart=101&showFR=1 (accessed on 1 February 2022).
- International Food Information Council (IFIC) Foundation Food & Health Survey: Consumer Attitudes toward Food, Nutrition & Health. Available online: https://foodinsight.org/wp-content/uploads/2006/05/2006foodandhealthsurvey.pdf (accessed on 1 February 2022).
- Ollberding, N.J.; Wolf, R.L.; Contento, I. Food label use and its relation to dietary intake among US adults. J. Am. Diet. Assoc. 2001, 111, S47–S51. [Google Scholar] [CrossRef]
- Wills, J.M.; Schmidt, D.B.; Pillo-Blocka, F.; Cairns, G. Exploring global consumer attitudes toward nutrition information on food labels. Nutr. Rev. 2009, 67 (Suppl. 1), S102–S106. [Google Scholar] [CrossRef]
- Christoph, M.J.; Larson, N.; Laska, M.N.; Neumark-Sztainer, D. Nutrition facts panels: Who uses them, what do they use, and how does use relate to dietary intake? J. Acad. Nutr. Diet 2018, 118, 217–228. [Google Scholar] [CrossRef]
- Lin, C.J.; Lee, J.; Yen, S.T. Do dietary intakes affect search for nutrient information on food labels? Soc. Sci. 2004, 59, 1955–1967. [Google Scholar] [CrossRef]
- U.S. Food & Drug Administration. Changes to the Nutrition Facts Label. Available online: https://www.fda.gov/food/food-labeling-nutrition/changes-nutrition-facts-label (accessed on 10 April 2022).
- Grebitus, C.; Davis, G.C. Change is good!? Analyzing the relationship between attention and nutrition facts panel modifications. Food Policy 2017, 73, 119–130. [Google Scholar] [CrossRef]
- Neuhofer, Z.; McFadden, B.R.; Rihn, A.; Wei, X.; Khachatryan, H.; House, L. Can the updated nutrition facts label decrease sugar-sweetened beverage consumption? Econ. Hum. Biol. 2020, 37, 100867. [Google Scholar] [CrossRef] [PubMed]
- Khandpur, N.; Graham, D.J.; Roberto, C.A. Simplifying mental math: Changing how added sugars are displayed on the nutrition facts label can improve consumer understanding. Appetite 2017, 114, 38–46. [Google Scholar] [CrossRef]
- Asioli, D.; Aschemann-Witzel, J.; Caputo, V.; Vecchio, R.; Annunziata, A.; Næs, T.; Varela, P. Making sense of the “clean label” trends: A review of consumer food choice behavior and discussion of industry implications. Food Res. Int. 2017, 99, 58–71. [Google Scholar] [CrossRef]
- Cheung, T.; Junghans, A.F.; Dijksterhuis, G.B.; Kroese, F.; Johansson, P.; Hall, L.; De Ridder, D. Consumers’ choice-blindness to ingredient information. Appetite 2016, 106, 2–12. [Google Scholar] [CrossRef] [Green Version]
- Gelski, J. Consumers Not Clear on Clean Label Definition. Available online: https://www.foodbusinessnews.net/articles/7407-consumers-not-clear-on-clean-label-definition (accessed on 1 February 2022).
- Hemmerling, S.; Canavari, M.; Spiller, A. Preference for naturalness of European organic consumers. Br. Food J. 2016, 118, 2287–2307. [Google Scholar] [CrossRef]
- Roman, S.; Sánchez-Siles, L.M.; Siegrist, M. The importance of food naturalness for consumers: Results of a systematic review. Trends Food Sci. Technol. 2017, 67, 44–57. [Google Scholar] [CrossRef]
- Soontrunnarudrungsri, A. Development and Validation of Screening Tools for Classification Consumers of Food Products Based on Eating Healthy Criteria. Ph.D. Thesis, Kansas State University, Manhattan, KS, USA, 2011. Available online: http://hdl.handle.net/2097/12132 (accessed on 1 February 2022).
- Horneffer-Ginter, K. Stages of change and possible selves: 2 tools for promoting college health. J. Am. Coll. Health 2008, 56, 351–358. [Google Scholar] [CrossRef]
- Gerend, M.A. Does calorie information promote lower calorie fast food choices among college students? J. Adolesc. Health 2009, 44, 84–86. [Google Scholar] [CrossRef]
- Brownbill, A.L.; Miller, C.L.; Braunack-Mayer, A.J. Industry use of ‘better-for-you’ features on labels of sugar-containing beverages. Public Health Nutr. 2018, 21, 3335–3343. [Google Scholar] [CrossRef] [PubMed] [Green Version]
- Brownbill, A.L.; Braunack-Mayer, A.J.; Miller, C.L. What makes a beverage healthy? A qualitative study of young adults’ conceptualisation of sugar-containing beverage healthfulness. Appetite 2020, 150, 104675. [Google Scholar] [CrossRef] [PubMed]
- Graham, D.J.; Jeffery, R.W. Location, location, location: Eye-tracking evidence that consumers preferentially view prominently positioned nutrition information. J. Am. Diet Assoc. 2011, 111, 1704–1711. [Google Scholar] [CrossRef] [PubMed] [Green Version]
- Bucher, T.; Siegrist, M. Children’s and parents’ health perception of different soft drinks. Br. J. Nutr. 2015, 113, 526–535. [Google Scholar] [CrossRef] [Green Version]
- Rampersaud, G.C.; Kim, H.; Gao, Z.; House, L.A. Knowledge, perceptions, and behaviors of adults concerning nonalcoholic beverages suggest some lack of comprehension related to sugars. Nutr. Res. 2014, 34, 134–142. [Google Scholar] [CrossRef]
- Conklin, M.T.; Cranage, D.A.; Lambert, C.U. College students’ use of point of selection nutrition information. Top. Clin. Nutr. 2005, 20, 97–108. [Google Scholar] [CrossRef]
- Banovic, M.; Arvola, A.; Pennanen, K.; Duta, D.E.; Brückner-Gühmann, M.; Lähteenmäki, L.; Grunert, K.G. Foods with increased protein content: A qualitative study on european consumer preferences and perceptions. Appetite 2018, 125, 233–243. [Google Scholar] [CrossRef]
- Schmidt, C. The Rise of Protein in Global Health and Wellness. Available online: https://foodproteins.globalfoodforums.com/food-protein-articles/the-rise-of-protein-in-the-global-health-and-wellness-and-supplement-arenas (accessed on 1 February 2022).
- Harwood, W.S.; Drake, M. Understanding implicit and explicit consumer desires for protein bars, powders, and beverages. J. Sens. Stud. 2019, 34, e12493. [Google Scholar] [CrossRef]
- We Are What We Eat: Healthy Eating Trends Around The World. Available online: https://www.nielsen.com/wp-content/uploads/sites/3/2019/04/january-2015-global-health-and-wellness-report.pdf (accessed on 1 February 2022).
- Murley, T.; Chambers, E. The influence of colorants, flavorants and product identity on perceptions of naturalness. Foods 2019, 8, 317. [Google Scholar] [CrossRef] [Green Version]
- Miller, L.M.S.; Cassady, D.L. The effects of nutrition knowledge on food label use. A review of the literature. Appetite 2015, 92, 207–216. [Google Scholar] [CrossRef] [Green Version]
Figure 1.
The two-level questions of healthy eating ‘stage-of-change’.

Figure 2.
Multiple correspondence analysis biplot of healthy diet stage-of-change with consumer segment groups.
Figure 2.
Multiple correspondence analysis biplot of healthy diet stage-of-change with consumer segment groups.

Table 1.
Consumer segmentation characteristics of the survey participants.
| Segmentation Groups | Consumer Number (n = 296) |
|---|---|
| Demographic | |
| Gender | |
| Female | 170 (57.4%) |
| Male | 126 (42.6%) |
| Generation | |
| Millennials (1981 ≤ YOB < 1997) | 135 (45.6%) |
| Gen X (1965 ≤ YOB < 1981) | 96 (32.4%) |
| Boomers (YOB < 1965) | 65 (21.7%) |
| Education | |
| Up to some college | 74 (25.0%) |
| College degree | 130 (43.9%) |
| Graduate school | 92 (31.1%) |
| Income | |
| Income—low (entire household income less than USD 19,999 to USD 79,999) | 136 (45.9%) |
| Income—high (entire household income from USD 80,000 to USD 150,000 or more) | 160 (54.1%) |
| Geographic | |
| Region | |
| Midwest | 54 (18.2%) |
| Northeast | 72 (24.3%) |
| South | 82 (27.7%) |
| West | 88 (29.7%) |
| Psychographic | |
| Stage-of-change | |
| Maintenance | 142 (48.0%) |
| Action | 122 (41.2%) |
| Non-action 1 | 32 (10.8%) |
1 The ‘non-action’ group combines ‘precontemplation’, ‘contemplation’, and ‘preparation’ groups.
Table 2.
Chi-square analysis for healthy eating stage-of-change of kombucha consumers.
| Segment Groups and Subgroups | Non-Action | Action | Maintenance | df N χ2 |
|---|---|---|---|---|
| n (%) a | n (%) | n (%) | ||
| Total (n = 296) | 32 (10.8) | 122 (41.2) | 142 (48) | |
| Gender | ||||
| Female (n = 170) | 15 (8.8) | 61 (35.9) | 94 (55.3) | 2 |
| Male (n = 126) | 17 (13.5) | 61 (48.4) | 48 (38.1) | 296 |
| 8.7 * | ||||
| Generation | ||||
| Millennials (n = 135) | 15 (11.1) | 57 (42.2) | 63 (46.7) | 4 |
| Gen X (n = 96) | 14 (14.6) | 46 (47.9) | 36 (37.5) | 296 |
| Boomers (n = 65) | 3 (4.6) | 19 (29.2) | 43 (66.2) | 13.6 ** |
| Region | ||||
| West (n = 88) | 1 (1.1) | 29 (33) | 58 (65.9) | 6 |
| South (n = 82) | 12 (14.6) | 36 (43.9) | 34 (41.5) | 296 |
| Northeast (n = 72) | 9 (12.5) | 36 (50) | 27 (37.5) | 23.5 *** |
| Midwest (n = 54) | 10 (18.5) | 21 (38.9) | 23 (42.6) | |
| Education | ||||
| Up to some college (n = 74) | 12 (16.2) | 23 (31.1) | 39 (52.7) | 4 |
| College degree (n = 130) | 8 (6.2) | 50 (38.5) | 72 (55.4) | 296 |
| Graduate school (n = 92) | 12 (13) | 49 (53.3) | 31 (33.7) | 16.1 ** |
| Income | ||||
| Income low (n = 136) | 17 (12.5) | 49 (36) | 70 (51.5) | 2 |
| Income high (n = 160) | 15 (9.4) | 73 (45.6) | 72 (45) | 296 |
| 2.9 |
a Number and percentage per row. * p < 0.05, ** p < 0.01, and *** p < 0.001.
Table 3.
Healthy eating of kombucha consumers.
| Total | Gender | Generation | Region | Education | Income | Stage-of-Change | ||||||||||||
|---|---|---|---|---|---|---|---|---|---|---|---|---|---|---|---|---|---|---|
| Total (n = 296) | Female (n = 170) | Male (n = 126) | Millennials (n = 135) | Gen X (n = 96) | Boomers (n = 65) | West (n = 88) | South (n = 82) | Northeast (n = 72) | Midwest (n = 54) | Some College (n = 74) | College Degree (n = 130) | Graduate School (n=92) | Income Low (n = 136) | Income High (n = 160) | Pre-Action (n = 32) | Action (n = 122) | Maint-enance (n = 142) | |
| n (%) | n (%) | n (%) | n (%) | n (%) | n (%) | n (%) | n (%) | n (%) | n (%) | n (%) | n (%) | n (%) | n (%) | n (%) | n (%) | n (%) | n (%) | |
| Health Eating | ||||||||||||||||||
| eating more fruits and vegetables | 227 (76.7) | 138 (81.2) | 89 (70.6) | 96 (71.1) | 74 (77.1) | 57 (87.7) | 68 (77.3) | 60 (73.2) | 58 (80.6) | 41 (75.9) | 54 (73) | 108 (83.1) | 65 (70.7) | 103 (75.7) | 124 (77.5) | 27 (84.4) | 80 (65.6) | 120 (84.5) |
| eating less “junk” and fast food | 218 (73.6) | 133 (78.2) | 85 (67.5) | 93 (68.9) | 69 (71.9) | 56 (86.2) | 68 (77.3) | 59 (72) | 55 (76.4) | 36 (66.7) | 53 (71.6) | 104 (80) | 61 (66.3) | 102 (75) | 116 (72.5) | 19 (59.4) | 81 (66.4) | 118 (83.1) |
| limiting sugar intake | 203 (68.6) | 126 (74.1) | 77 (61.1) | 84 (62.2) | 67 (69.8) | 52 (80) | 62 (70.5) | 54 (65.9) | 55 (76.4) | 32 (59.3) | 56 (75.7) | 92 (70.8) | 55 (59.8) | 95 (69.9) | 108 (67.5) | 26 (81.3) | 65 (53.3) | 112 (78.9) |
| eating more fresh | 201 (67.9) | 126 (74.1) | 75 (59.5) | 86 (63.7) | 65 (67.7) | 50 (76.9) | 62 (70.5) | 53 (64.6) | 52 (72.2) | 34 (63) | 49 (66.2) | 91 (70) | 61 (66.3) | 91 (66.9) | 110 (68.8) | 18 (56.3) | 72 (59) | 111 (78.2) |
| eating healthier protein sources | 194 (65.5) | 115 (67.6) | 79 (62.7) | 82 (60.7) | 64 (66.7) | 48 (73.8) | 59 (67) | 55 (67.1) | 48 (66.7) | 32 (59.3) | 48 (64.9) | 87 (66.9) | 59 (64.1) | 88 (64.7) | 106 (66.3) | 19 (59.4) | 78 (63.9) | 97 (68.3) |
| watching and paying more attention to what you eat | 173 (58.4) | 112 (65.9) | 61 (48.4) | 74 (54.8) | 54 (56.3) | 45 (69.2) | 51 (58) | 46 (56.1) | 43 (59.7) | 33 (61.1) | 41 (55.4) | 79 (60.8) | 53 (57.6) | 75 (55.1) | 98 (61.3) | 15 (46.9) | 66 (54.1) | 92 (64.8) |
| eating less unhealthy fats | 167 (56.4) | 105 (61.8) | 62 (49.2) | 64 (47.4) | 57 (59.4) | 46 (70.8) | 52 (59.1) | 45 (54.9) | 41 (56.9) | 29 (53.7) | 41 (55.4) | 80 (61.5) | 46 (50) | 74 (54.4) | 93 (58.1) | 18 (56.3) | 55 (45.1) | 94 (66.2) |
| eating smaller portions or fewer unnecessary snacks | 136 (45.9) | 87 (51.2) | 49 (38.9) | 60 (44.4) | 37 (38.5) | 39 (60) | 34 (38.6) | 39 (47.6) | 35 (48.6) | 28 (51.9) | 43 (58.1) | 63 (48.5) | 30 (32.6) | 74 (54.4) | 62 (38.8) | 17 (53.1) | 51 (41.8) | 68 (47.9) |
| eating less carbohydrates | 113 (38.2) | 73 (42.9) | 40 (31.7) | 44 (32.6) | 35 (36.5) | 34 (52.3) | 33 (37.5) | 30 (36.6) | 28 (38.9) | 22 (40.7) | 36 (48.6) | 50 (38.5) | 27 (29.3) | 50 (36.8) | 63 (39.4) | 13 (40.6) | 43 (35.2) | 57 (40.1) |
| eating fewer calories | 98 (33.1) | 45 (26.5) * | 53 (42.1) * | 42 (31.1) | 34 (35.4) | 22 (33.8) | 34 (38.6) | 22 (26.8) | 25 (34.7) | 17 (31.5) | 20 (27) | 45 (34.6) | 33 (35.9) | 42 (30.9) | 56 (35) | 11 (34.4) | 34 (27.9) | 53 (37.3) |
| switching to a vegetarian or vegan diet | 55 (18.6) | 31 (18.2) | 24 (19) | 18 (13.3) | 20 (20.8) | 17 (26.2) | 20 (22.7) | 12 (14.6) | 8 (11.1) | 15 (27.8) | 14 (18.9) | 26 (20) | 15 (16.3) | 28 (20.6) | 27 (16.9) | 7 (21.9) | 22 (18) | 26 (18.3) |
* Indicates Chi-square significance at p ≤ 0.05.
Table 4.
Kombucha label descriptions.
| Total | Gender | Generation | Region | Education | Income | Stage-of-Change | ||||||||||||
|---|---|---|---|---|---|---|---|---|---|---|---|---|---|---|---|---|---|---|
| Total (n = 296) | Female (n = 170) | Male (n = 126) | Millennials (n = 135) | Gen X (n = 96) | Boomers (n = 65) | West (n = 88) | South (n = 82) | Northeast (n = 72) | Midwest (n = 54) | Some College (n = 74) | College Degree (n = 130) | Graduate School (n=92) | Income Low (n = 136) | Income High (n = 160) | Pre-Action (n = 32) | Action (n = 122) | Maint-enance (n = 142) | |
| n (%) | n (%) | n (%) | n (%) | n (%) | n (%) | n (%) | n (%) | n (%) | n (%) | n (%) | n (%) | n (%) | n (%) | n (%) | n (%) | n (%) | n (%) | |
| Label | ||||||||||||||||||
| sugar content | 164 (55.4) | 95 (55.9) | 69 (54.8) | 69 (51.1) | 55 (57.3) | 40 (61.5) | 50 (56.8) | 38 (46.3) | 46 (63.9) | 30 (55.6) | 44 (59.5) | 66 (50.8) | 54 (58.7) | 69 (50.7) | 95 (59.4) | 15 (46.9) | 54 (44.3) | 95 (66.9) |
| calorie | 152 (51.4) | 95 (55.9) | 57 (45.2) | 62 (45.9) | 52 (54.2) | 38 (58.5) | 47 (53.4) | 40 (48.8) | 42 (58.3) | 23 (42.6) | 32 (43.2) | 69 (53.1) | 51 (55.4) | 64 (47.1) | 88 (55) | 15 (46.9) | 51 (41.8) | 86 (60.6) |
| serving size | 135 (45.6) | 78 (45.9) | 57 (45.2) | 60 (44.4) | 43 (44.8) | 32 (49.2) | 44 (50) | 32 (39) | 38 (52.8) | 21 (38.9) | 32 (43.2) | 59 (45.4) | 44 (47.8) | 56 (41.2) | 79 (49.4) | 16 (50) | 54 (44.3) | 65 (45.8) |
| probiotic strain (s) | 123 (41.6) | 75 (44.1) | 48 (38.1) | 46 (34.1) | 45 (46.9) | 32 (49.2) | 46 (52.3) | 34 (41.5) | 29 (40.3) | 14 (25.9) | 31 (41.9) | 51 (39.2) | 41 (44.6) | 48 (35.3) | 75 (46.9) | 9 (28.1) | 51 (41.8) | 63 (44.4) |
| live culture | 121 (40.9) | 82 (48.2) | 39 (31) | 46 (34.1) | 40 (41.7) | 35 (53.8) | 41 (46.6) | 32 (39) | 27 (37.5) | 21 (38.9) | 30 (40.5) | 52 (40) | 39 (42.4) | 47 (34.6) | 74 (46.3) | 11 (34.4) | 39 (32) | 71 (50) |
| probiotic content of live cells | 119 (40.2) | 72 (42.4) | 47 (37.3) | 48 (35.6) | 40 (41.7) | 31 (47.7) | 41 (46.6) | 29 (35.4) | 32 (44.4) | 17 (31.5) | 28 (37.8) | 47 (36.2) | 44 (47.8) | 47 (34.6) | 72 (45) | 9 (28.1) | 54 (44.3) | 56 (39.4) |
| added sugar | 113 (38.2) | 71 (41.8) | 42 (33.3) | 54 (40) | 33 (34.4) | 26 (40) | 34 (38.6) | 26 (31.7) | 29 (40.3) | 24 (44.4) | 30 (40.5) | 50 (38.5) | 33 (35.9) | 43 (31.6) | 70 (43.8) | 12 (37.5) | 38 (31.1) | 63 (44.4) |
| protein content | 108 (36.5) | 54 (31.8) * | 54 (42.9) * | 49 (36.3) | 38 (39.6) | 21 (32.3) | 32 (36.4) | 31 (37.8) | 26 (36.1) | 19 (35.2) | 23 (31.1) | 42 (32.3) | 43 (46.7) | 40 (29.4) | 68 (42.5) | 10 (31.3) * | 59 (48.4) * | 39 (27.5) * |
| fat content | 63 (21.3) | 28 (16.5) * | 35 (27.8) * | 20 (14.8) * | 30 (31.3) * | 13 (20) * | 21 (23.9) | 15 (18.3) | 15 (20.8) | 12 (22.2) | 12 (16.2) | 27 (20.8) | 24 (26.1) | 22 (16.2) | 41 (25.6) | 8 (25) | 26 (21.3) | 29 (20.4) |
| none above | 18 (6.1) | 10 (5.9) | 8 (6.3) | 12 (8.9) | 2 (2.1) | 4 (6.2) | 2 (2.3) | 6 (7.3) | 4 (5.6) | 6 (11.1) | 9 (12.2) | 7 (5.4) | 2 (2.2) | 13 (9.6) | 5 (3.1) | 6 (18.8) | 4 (3.3) | 8 (5.6) |
| others | 2 (0.7) | 2 (1.2) | 0 (0) | 1 (0.7) | 1 (1) | 0 (0) | 2 (2.3) | 0 (0) | 0 (0) | 0 (0) | 2 (2.7) | 0 (0) | 0 (0) | 0 (0) | 2 (1.3) | 0 (0) | 0 (0) | 2 (1.4) |
* Indicates Chi-square significance at p ≤ 0.05.
Table 5.
Kombucha ingredient list.
| Total | Gender | Generation | Region | Education | Income | Stage-of-Change | ||||||||||||
|---|---|---|---|---|---|---|---|---|---|---|---|---|---|---|---|---|---|---|
| Total (n = 296) | Female (n = 170) | Male (n = 126) | Millennials (n = 135) | Gen X (n = 96) | Boomers (n = 65) | West (n = 88) | South (n = 82) | Northeast (n = 72) | Midwest (n = 54) | Some College (n = 74) | College Degree (n = 130) | Graduate School (n=92) | Income Low (n = 136) | Income High (n = 160) | Pre-Action (n = 32) | Action (n = 122) | Maint-enance (n = 142) | |
| n (%) | n (%) | n (%) | n (%) | n (%) | n (%) | n (%) | n (%) | n (%) | n (%) | n (%) | n (%) | n (%) | n (%) | n (%) | n (%) | n (%) | n (%) | |
| Ingredient | ||||||||||||||||||
| organic or natural | 166 (56.1) | 97 (57.1) | 69 (54.8) | 58 (43) | 62 (64.6) | 46 (70.8) | 53 (60.2) | 45 (54.9) | 41 (56.9) | 27 (50) | 37 (50) | 72 (55.4) | 57 (62) | 62 (45.6) | 104 (65) | 16 (50) | 60 (49.2) | 90 (63.4) |
| natural flavoring | 139 (47) | 75 (44.1) | 64 (50.8) | 55 (40.7) | 50 (52.1) | 34 (52.3) | 44 (50) | 32 (39) | 36 (50) | 27 (50) | 36 (48.6) | 56 (43.1) | 47 (51.1) | 51 (37.5) | 88 (55) | 13 (40.6) | 51 (41.8) | 75 (52.8) |
| kombucha content | 136 (45.9) | 68 (40) | 68 (54) | 53 (39.3) | 55 (57.3) | 28 (43.1) | 43 (48.9) | 34 (41.5) | 36 (50) | 23 (42.6) | 35 (47.3) | 51 (39.2) | 50 (54.3) | 57 (41.9) | 79 (49.4) | 14 (43.8) | 58 (47.5) | 64 (45.1) |
| type of tea | 119 (40.2) | 73 (42.9) | 46 (36.5) | 49 (36.3) | 38 (39.6) | 32 (49.2) | 39 (44.3) | 25 (30.5) | 30 (41.7) | 25 (46.3) | 34 (45.9) | 51 (39.2) | 34 (37) | 54 (39.7) | 65 (40.6) | 13 (40.6) | 38 (31.1) | 68 (47.9) |
| live culture | 111 (37.5) | 73 (42.9) | 38 (30.2) | 43 (31.9) | 38 (39.6) | 30 (46.2) | 31 (35.2) | 31 (37.8) | 27 (37.5) | 22 (40.7) | 29 (39.2) | 46 (35.4) | 36 (39.1) | 46 (33.8) | 65 (40.6) | 14 (43.8) | 33 (27) | 64 (45.1) |
| natural coloring | 106 (35.8) | 61 (35.9) | 45 (35.7) | 41 (30.4) | 44 (45.8) | 21 (32.3) | 37 (42) | 26 (31.7) | 20 (27.8) | 23 (42.6) | 31 (41.9) | 41 (31.5) | 34 (37) | 38 (27.9) | 68 (42.5) | 11 (34.4) | 47 (38.5) | 48 (33.8) |
| artificial sweetener | 92 (31.1) | 58 (34.1) | 34 (27) | 40 (29.6) | 28 (29.2) | 24 (36.9) | 29 (33) | 27 (32.9) | 19 (26.4) | 17 (31.5) | 26 (35.1) | 35 (26.9) | 31 (33.7) | 40 (29.4) | 52 (32.5) | 12 (37.5) | 32 (26.2) | 48 (33.8) |
| artificial coloring | 89 (30.1) | 50 (29.4) | 39 (31) | 33 (24.4) | 33 (34.4) | 23 (35.4) | 31 (35.2) | 23 (28) | 19 (26.4) | 16 (29.6) | 17 (23) | 40 (30.8) | 32 (34.8) | 35 (25.7) | 54 (33.8) | 7 (21.9) | 33 (27) | 49 (34.5) |
| artificial flavoring | 87 (29.4) | 51 (30) | 36 (28.6) | 36 (26.7) | 30 (31.3) | 21 (32.3) | 27 (30.7) | 26 (31.7) | 22 (30.6) | 12 (22.2) | 22 (29.7) | 37 (28.5) | 28 (30.4) | 36 (26.5) | 51 (31.9) | 3 (9.4) | 35 (28.7) | 49 (34.5) |
| type of water | 69 (23.3) | 39 (22.9) | 30 (23.8) | 28 (20.7) | 26 (27.1) | 15 (23.1) | 20 (22.7) | 15 (18.3) | 17 (23.6) | 17 (31.5) | 16 (21.6) | 31 (23.8) | 22 (23.9) | 32 (23.5) | 37 (23.1) | 6 (18.8) | 29 (23.8) | 34 (23.9) |
| none above | 20 (6.8) | 14 (8.2) | 6 (4.8) | 11 (8.1) | 3 (3.1) | 6 (9.2) | 6 (6.8) | 8 (9.8) | 3 (4.2) | 3 (5.6) | 6 (8.1) | 11 (8.5) | 3 (3.3) | 11 (8.1) | 9 (5.6) | 4 (12.5) | 2 (1.6) | 14 (9.9) |
| others | 4 (1.4) | 3 (1.8) | 1 (0.8) | 1 (0.7) | 1 (1) | 2 (3.1) | 2 (2.3) | 0 (0) | 1 (1.4) | 1 (1.9) | 2 (2.7) | 2 (1.5) | 0 (0) | 1 (0.7) | 3 (1.9) | 0 (0) | 1 (0.8) | 3 (2.1) |
Publisher’s Note: MDPI stays neutral with regard to jurisdictional claims in published maps and institutional affiliations. |
© 2022 by the authors. Licensee MDPI, Basel, Switzerland. This article is an open access article distributed under the terms and conditions of the Creative Commons Attribution (CC BY) license (https://creativecommons.org/licenses/by/4.0/).
Share and Cite
MDPI and ACS Style
Kim, J.; Bhattarai, U.; Adhikari, K. The Healthy Eater’s Idea and Related Behavior of a Healthy Diet—A Case Study with Kombucha Drinkers. Beverages 2022, 8, 25. https://0-doi-org.brum.beds.ac.uk/10.3390/beverages8020025
AMA Style
Kim J, Bhattarai U, Adhikari K. The Healthy Eater’s Idea and Related Behavior of a Healthy Diet—A Case Study with Kombucha Drinkers. Beverages. 2022; 8(2):25. https://0-doi-org.brum.beds.ac.uk/10.3390/beverages8020025
Chicago/Turabian StyleKim, Juyoung, Uttam Bhattarai, and Koushik Adhikari. 2022. "The Healthy Eater’s Idea and Related Behavior of a Healthy Diet—A Case Study with Kombucha Drinkers" Beverages 8, no. 2: 25. https://0-doi-org.brum.beds.ac.uk/10.3390/beverages8020025
Note that from the first issue of 2016, this journal uses article numbers instead of page numbers. See further details here.