Article

Systolic Blood Pressure Response to Exercise in Endurance Athletes in Relation to Oxygen Uptake, Work Rate and Normative Values

1
Department of Clinical Physiology in Linkoping, and Department of Health, Medicine and Caring Sciences, Linkoping University, 58183 Linkoping, Sweden
2
Department of Respiratory Medicine, Allergology and Palliative Medicine, Lund University, 22185 Lund, Sweden
*
Author to whom correspondence should be addressed.
J. Cardiovasc. Dev. Dis. 2022, 9(7), 227; https://0-doi-org.brum.beds.ac.uk/10.3390/jcdd9070227
Submission received: 14 June 2022 / Revised: 10 July 2022 / Accepted: 13 July 2022 / Published: 15 July 2022
(This article belongs to the Special Issue Cardiovascular Disease in Athletes)

Abstract

:
Work rate has a direct impact on the systolic blood pressure (SBP) during aerobic exercise, which may be challenging in the evaluation of the SBP response in athletes reaching high work rates. We aimed to investigate the exercise SBP response in endurance athletes in relation to oxygen uptake (VO2), work rate and to recent reference equations for exercise SBP in the general population. Endurance athletes with a left-ventricular end-diastolic diameter above the reference one performed a maximal bicycle cardiopulmonary exercise test. The increase in SBP during exercise was divided by the increase in VO2 (SBP/VO2 slope) and in Watts, respectively (SBP/W slope). The maximum SBP (SBPmax) and the SBP/W slope were compared to the predicted values. In total, 27 athletes (59% men) were included; mean age, 40 ± 10 years; mean VO2max, 50 ± 5 mL/kg/min. The mean SBP/VO2 slope was 29.8 ± 10.2 mm Hg/L/min, and the mean SBP/W slope was 0.27 ± 0.08 mm Hg/W. Compared to the predicted normative values, athletes had, on average, a 12.2 ± 17.6 mm Hg higher SBPmax and a 0.12 ± 0.08 mm Hg/W less steep SBP/W slope (p < 0.01 and p < 0.001, respectively). In conclusion, the higher SBPmax values and the less steep SBP/W slope highlight the importance of considering work rate when interpreting the SBP response in endurance athletes and suggest a need for specific normative values in athletes to help clinicians distinguish physiologically high maximal blood pressure from a pathological blood pressure response.

1. Introduction

An exaggerated blood pressure response to exercise has been defined in guidelines as a maximum systolic blood pressure (SBPmax) of at least 210 mm Hg in men or 190 mm Hg in women [1,2]. However, these thresholds fail to account not only for age, but also for the relation between work rate and SBP, which is physiologically important as the mean arterial pressure (MAP) is estimated as the product of cardiac output (CO) and the total peripheral resistance. Thus, a high work rate typically yields a high SBP through increased CO [3], which, in turn, is closely related to high oxygen uptake (VO2) [4]. This makes interpretation of the SBP response to exercise particularly challenging in athletes, who often reach work rates far exceeding those of the general population and, therefore, may be expected to present with a higher SBPmax. Although peak exercise blood pressure above a preset threshold both in the general population [5] and in athletes [6] is associated with an increased risk of future hypertension, the impact of exercise capacity on blood pressure response and subsequent cardiovascular risk in athletes is scarcely studied.
Indexing the increase in SBP to the increase in work rate has gained recent attention as a way of accounting for the effect of work rate on the SBPmax [7,8]. A reference equation for the SBP/W slope for the general population was recently published [9]. Furthermore, for the increase in SBP in relation to the increase in metabolic equivalents of task (MET), the SBP/MET slope, upper limits have been suggested [7]. In addition, a few recent studies have investigated the SBP/W and the SBP/MET slopes in young athletes engaged in team sports [10,11]. There is, however, a lack of studies specifically dedicated to endurance athletes, who through their enhanced aerobic capacity can reach the highest VO2 values and, thus, may be expected to reach even higher SBPmax values. Evaluation of the SBP increase in relation to the direct measurement of VO2 has also been suggested in athletes, providing the SBP/VO2 slope [12].
The primary aim of this study was to characterize the SBP response to exercise in male and female endurance athletes, including the SBP/VO2 and the SBP/W slopes, and to compare the SBPmax and the SBP/W slope to the values predicted by recent reference equations [9].

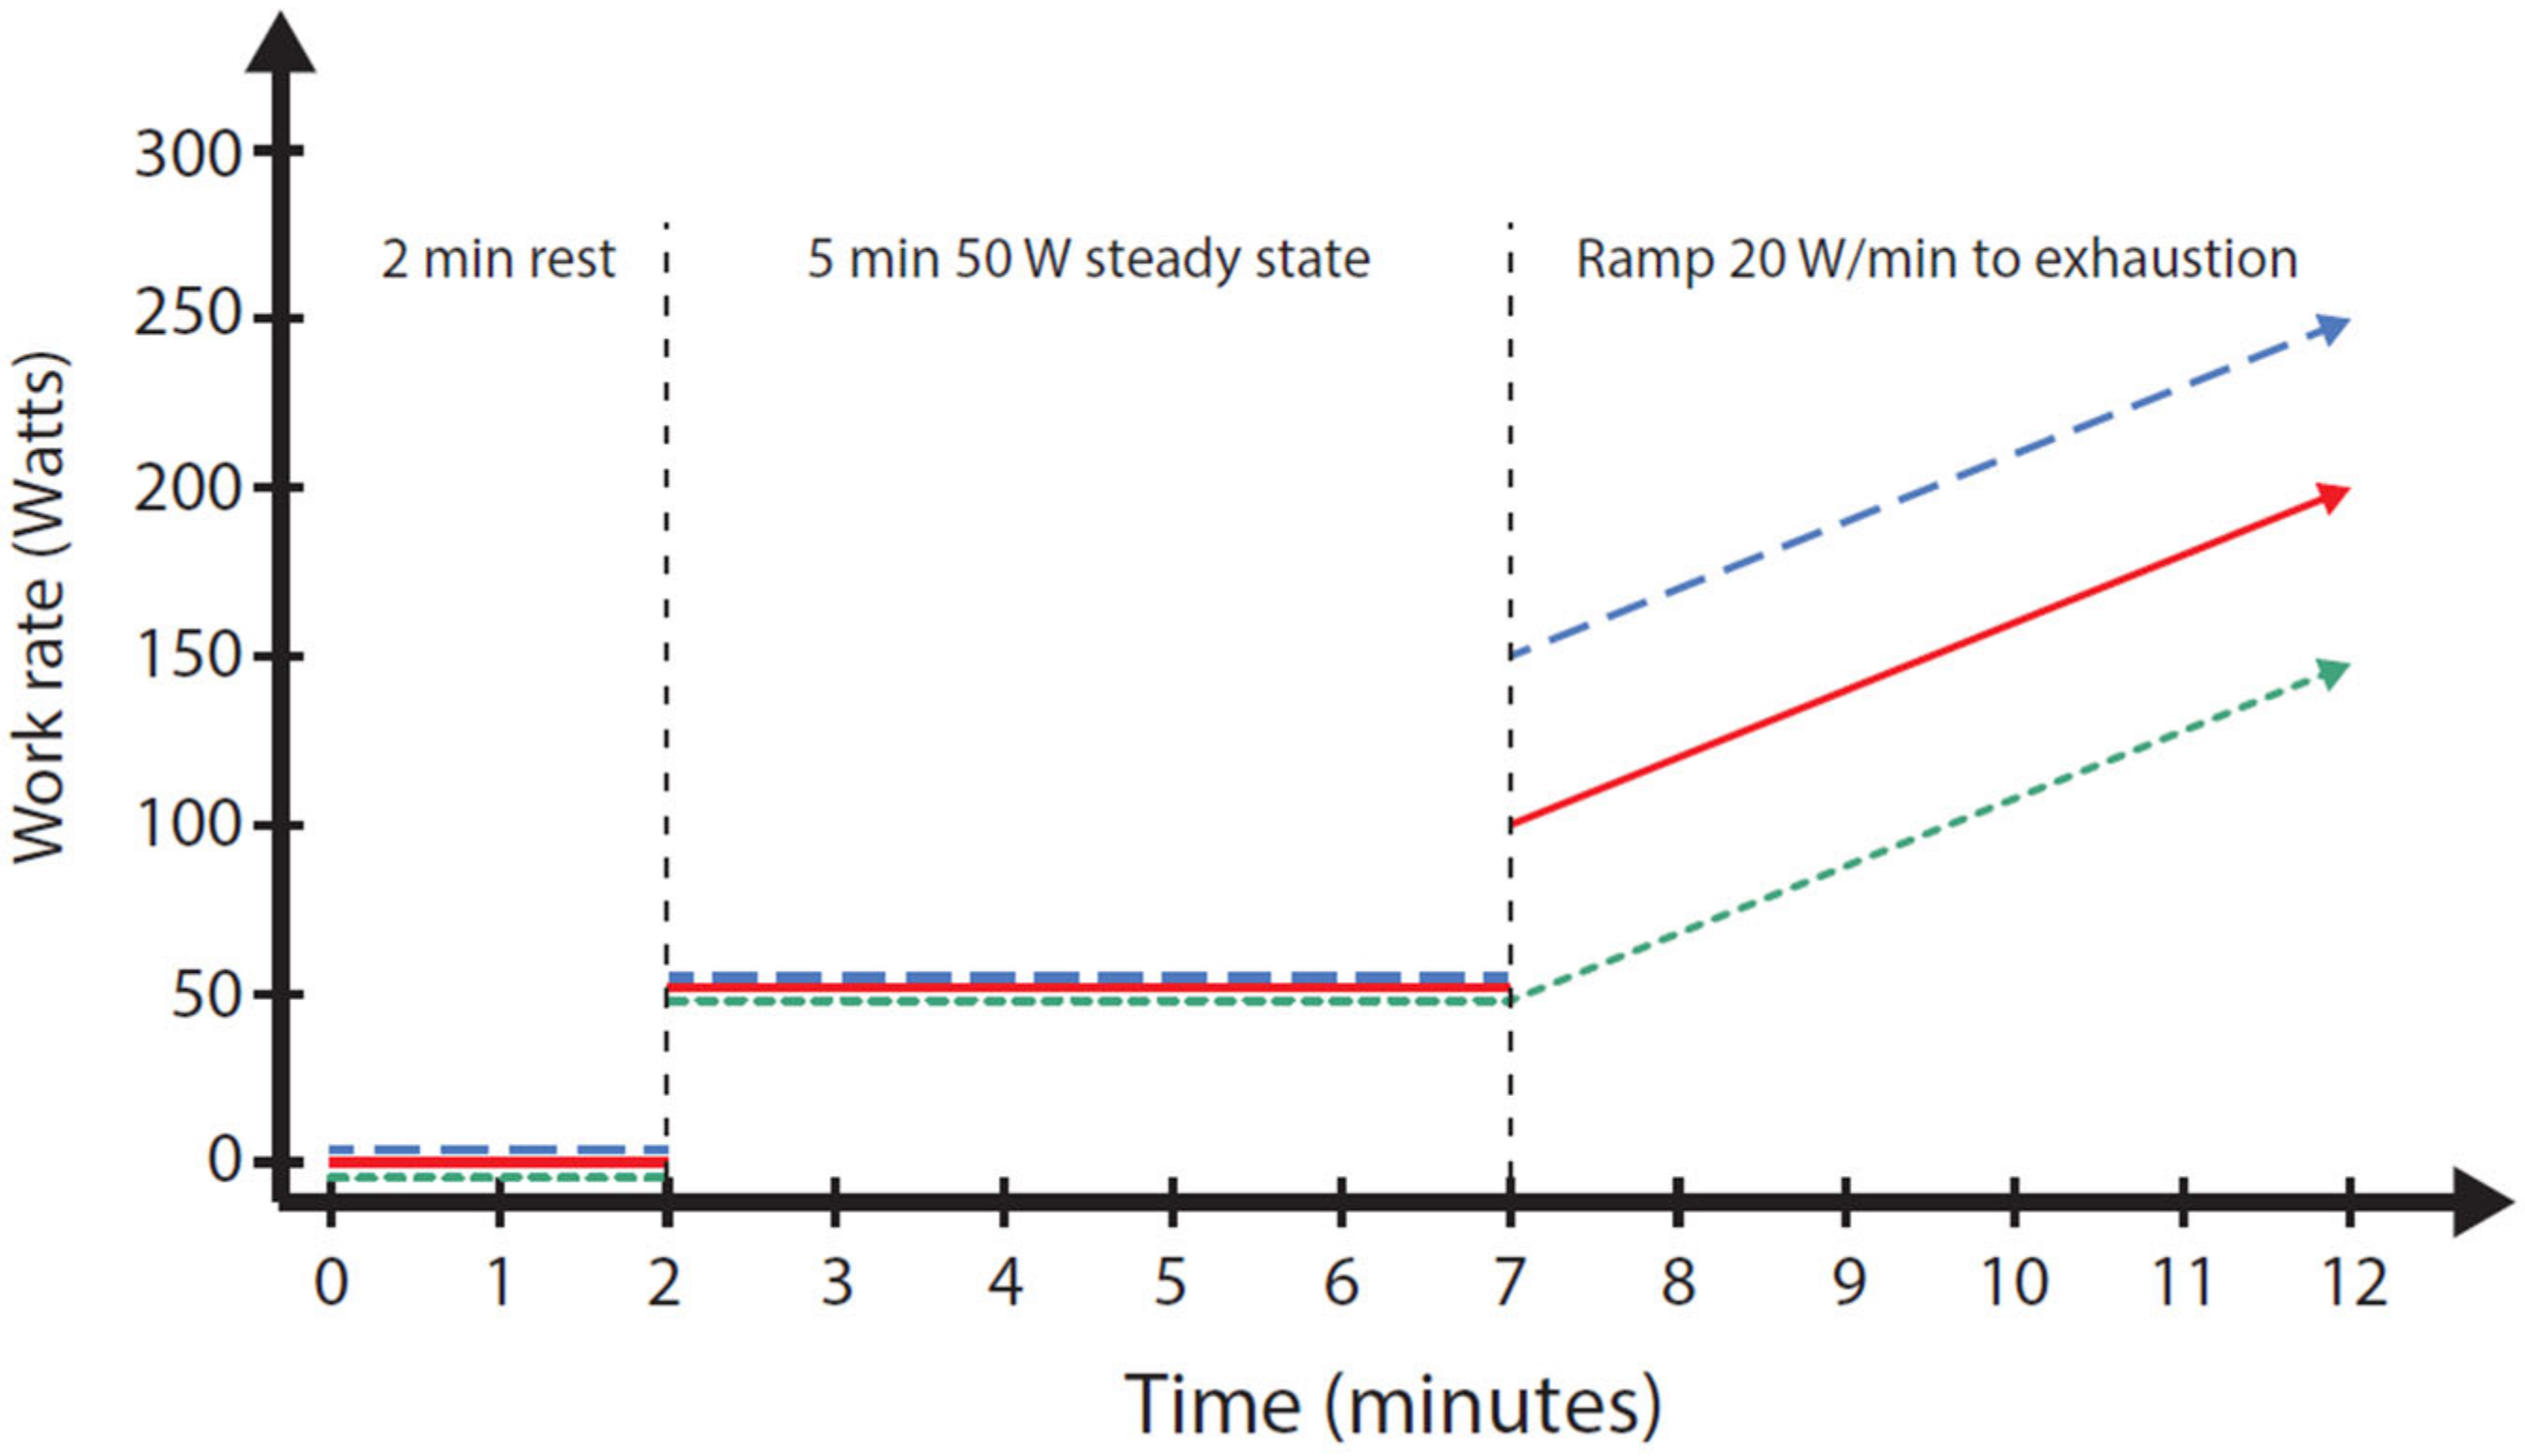
2. Materials and Methods

In this explorative cross-sectional study, data were collected at the Department of Clinical Physiology at Linköping University Hospital, Linköping, Sweden, between January 2020 and February 2021.
Endurance athletes were recruited through a general advertisement to undergo a brief screening echocardiographic examination (Vivid E95 cardiac ultrasound, GE Healthcare, Chicago, IL, USA) for eligibility. Athletes were considered for inclusion if they had (a) a left-ventricular end-diastolic diameter measured in the parasternal long-axis view above the body size-indexed age- and sex specific upper limit of normal [13], (b) no cardiac pathology (absence of structural heart disease and normal systolic left ventricular function [14]), (c) no prior cardiovascular disease and (d) no prior cardiotoxic chemotherapy. The rationale for studying athletes with a large left ventricle was to assure that only subjects with a sufficient dose of endurance exercise to elicit left ventricular adaptations were included [15,16,17].
The participants were instructed to refrain from strenuous exercise at least 24 h prior to the cardiopulmonary exercise test (CPET) and from caffeine two hours prior to the test. Maximal CPET was performed on an electronically braked cycle ergometer (eBike Comfort, Ergoline GmbH, Bitz, Germany) using an individualized ramp protocol aiming for a total ramp phase of 8–12 min. Two minutes of rest sitting on the ergometer was followed by five minutes of warmup at 50 W. The work rate then increased instantly to 50 W, 100 W or 150 W depending on the subject’s expected maximal work capacity, followed by a continuous increase by 20 W/min (Appendix A Figure A1) until as near the maximal exertion as possible, aiming for a plateau in VO2 and/or a respiratory exchange ratio (RER) > 1.1. VO2max was defined as the mean of the two highest consecutive 10 s averages at the end of exercise.
Ventilation and gas exchange parameters (VO2 and carbon dioxide elimination (VCO2)) were measured breath-by-breath throughout the test (Vyntus CPX, Carefusion GmbH, Hoechberg, Germany). Continuous ECG recordings and heart rate monitoring were made from a few minutes before the start of the exercise until the last blood pressure measurement ten minutes after the test (CardioSoft version 6.73, GE Medical Systems, Milwaukee, WI, USA). The participants were asked to rate their level of perceived exertion (Borg RPE scale) and dyspnea (Borg CR10 scale) every second minute during the test.
SBP and diastolic blood pressure (DBP) were measured in the supine position before the start of the test. During incremental exercise, SBP was measured every second minute, and also specifically at the end of the 5 min warmup (50 W), at 200 W and at peak exercise. If no SBP measurement was made during the last two minutes before test termination, the SBPmax was considered as missing. For each measurement during exercise, the subjects were asked to relax and extend the right arm while SBP was measured using a manual sphygmomanometer and a Doppler probe placed over the radial artery.
The maximal work rate (Wmax) and VO2max were compared to the predicted reference values [18,19]. MET was calculated as VO2 (mL/kg/min)/3.5 [20].
Three different measurements of the work rate-indexed SBP response during exercise were calculated. First, the SBP/W slope was calculated as the difference in SBP between the first and the last SBP measurement during exercise divided by the increment in W between these measurements [9]. Second, using the same rationale, the SBP/VO2 slope was calculated by dividing the increment in SBP by the difference in VO2, i.e., with data from the timepoints for the first and the last SBP measurement during exercise. Third, the SBP/MET slope was calculated using two different methods: (a) by using the same datapoints as for the SBP/VO2 slope (above) and (b) by replacing the first SBP measure during exercise with SBP at rest, in the sitting position, and using one MET as oxygen uptake at rest to allow for comparison with previous studies [10,11,21]. Predicted values for the SBPmax and the SBP/W slope were calculated using the formulas provided by Hedman et al. [9].
All data are presented as the means ± standard deviation (SD) or as the median and interquartile range (IQR) based on the distribution. Distribution of data was evaluated by the Shapiro–Wilk test. Paired-samples t-test was used to compare subjects’ actual versus predicted SBPmax and SBP/W slope values. Men and women were compared with the independent-samples t-test and the Mann–Whitney U-test, depending on the distribution of data. Correlations between the variables were explored using the Pearson r. Statistical analyses were performed using SPSS statistics software version 27.0 (IBM Corp., Armonk, NY, USA). Two-sided statistical significance was set at p < 0.05 in all the analyses.

3. Results

3.1. Cohort Characteristics

A total of 27 subjects (16 men) were included (Table 1). There were no current smokers, but three subjects reported previous smoking (all > 15 years ago), seven subjects reported use of any medication (anti-asthmatic drugs, n = 4; other non-cardiovascular drugs, n = 3).
The male athletes reached higher absolute work rate and VO2max, whereas body weight-indexed oxygen uptake (mL/kg/min) did not differ significantly between the men and the women. Female athletes achieved a higher % of the predicted work rate and a higher % of the predicted VO2max than the men.

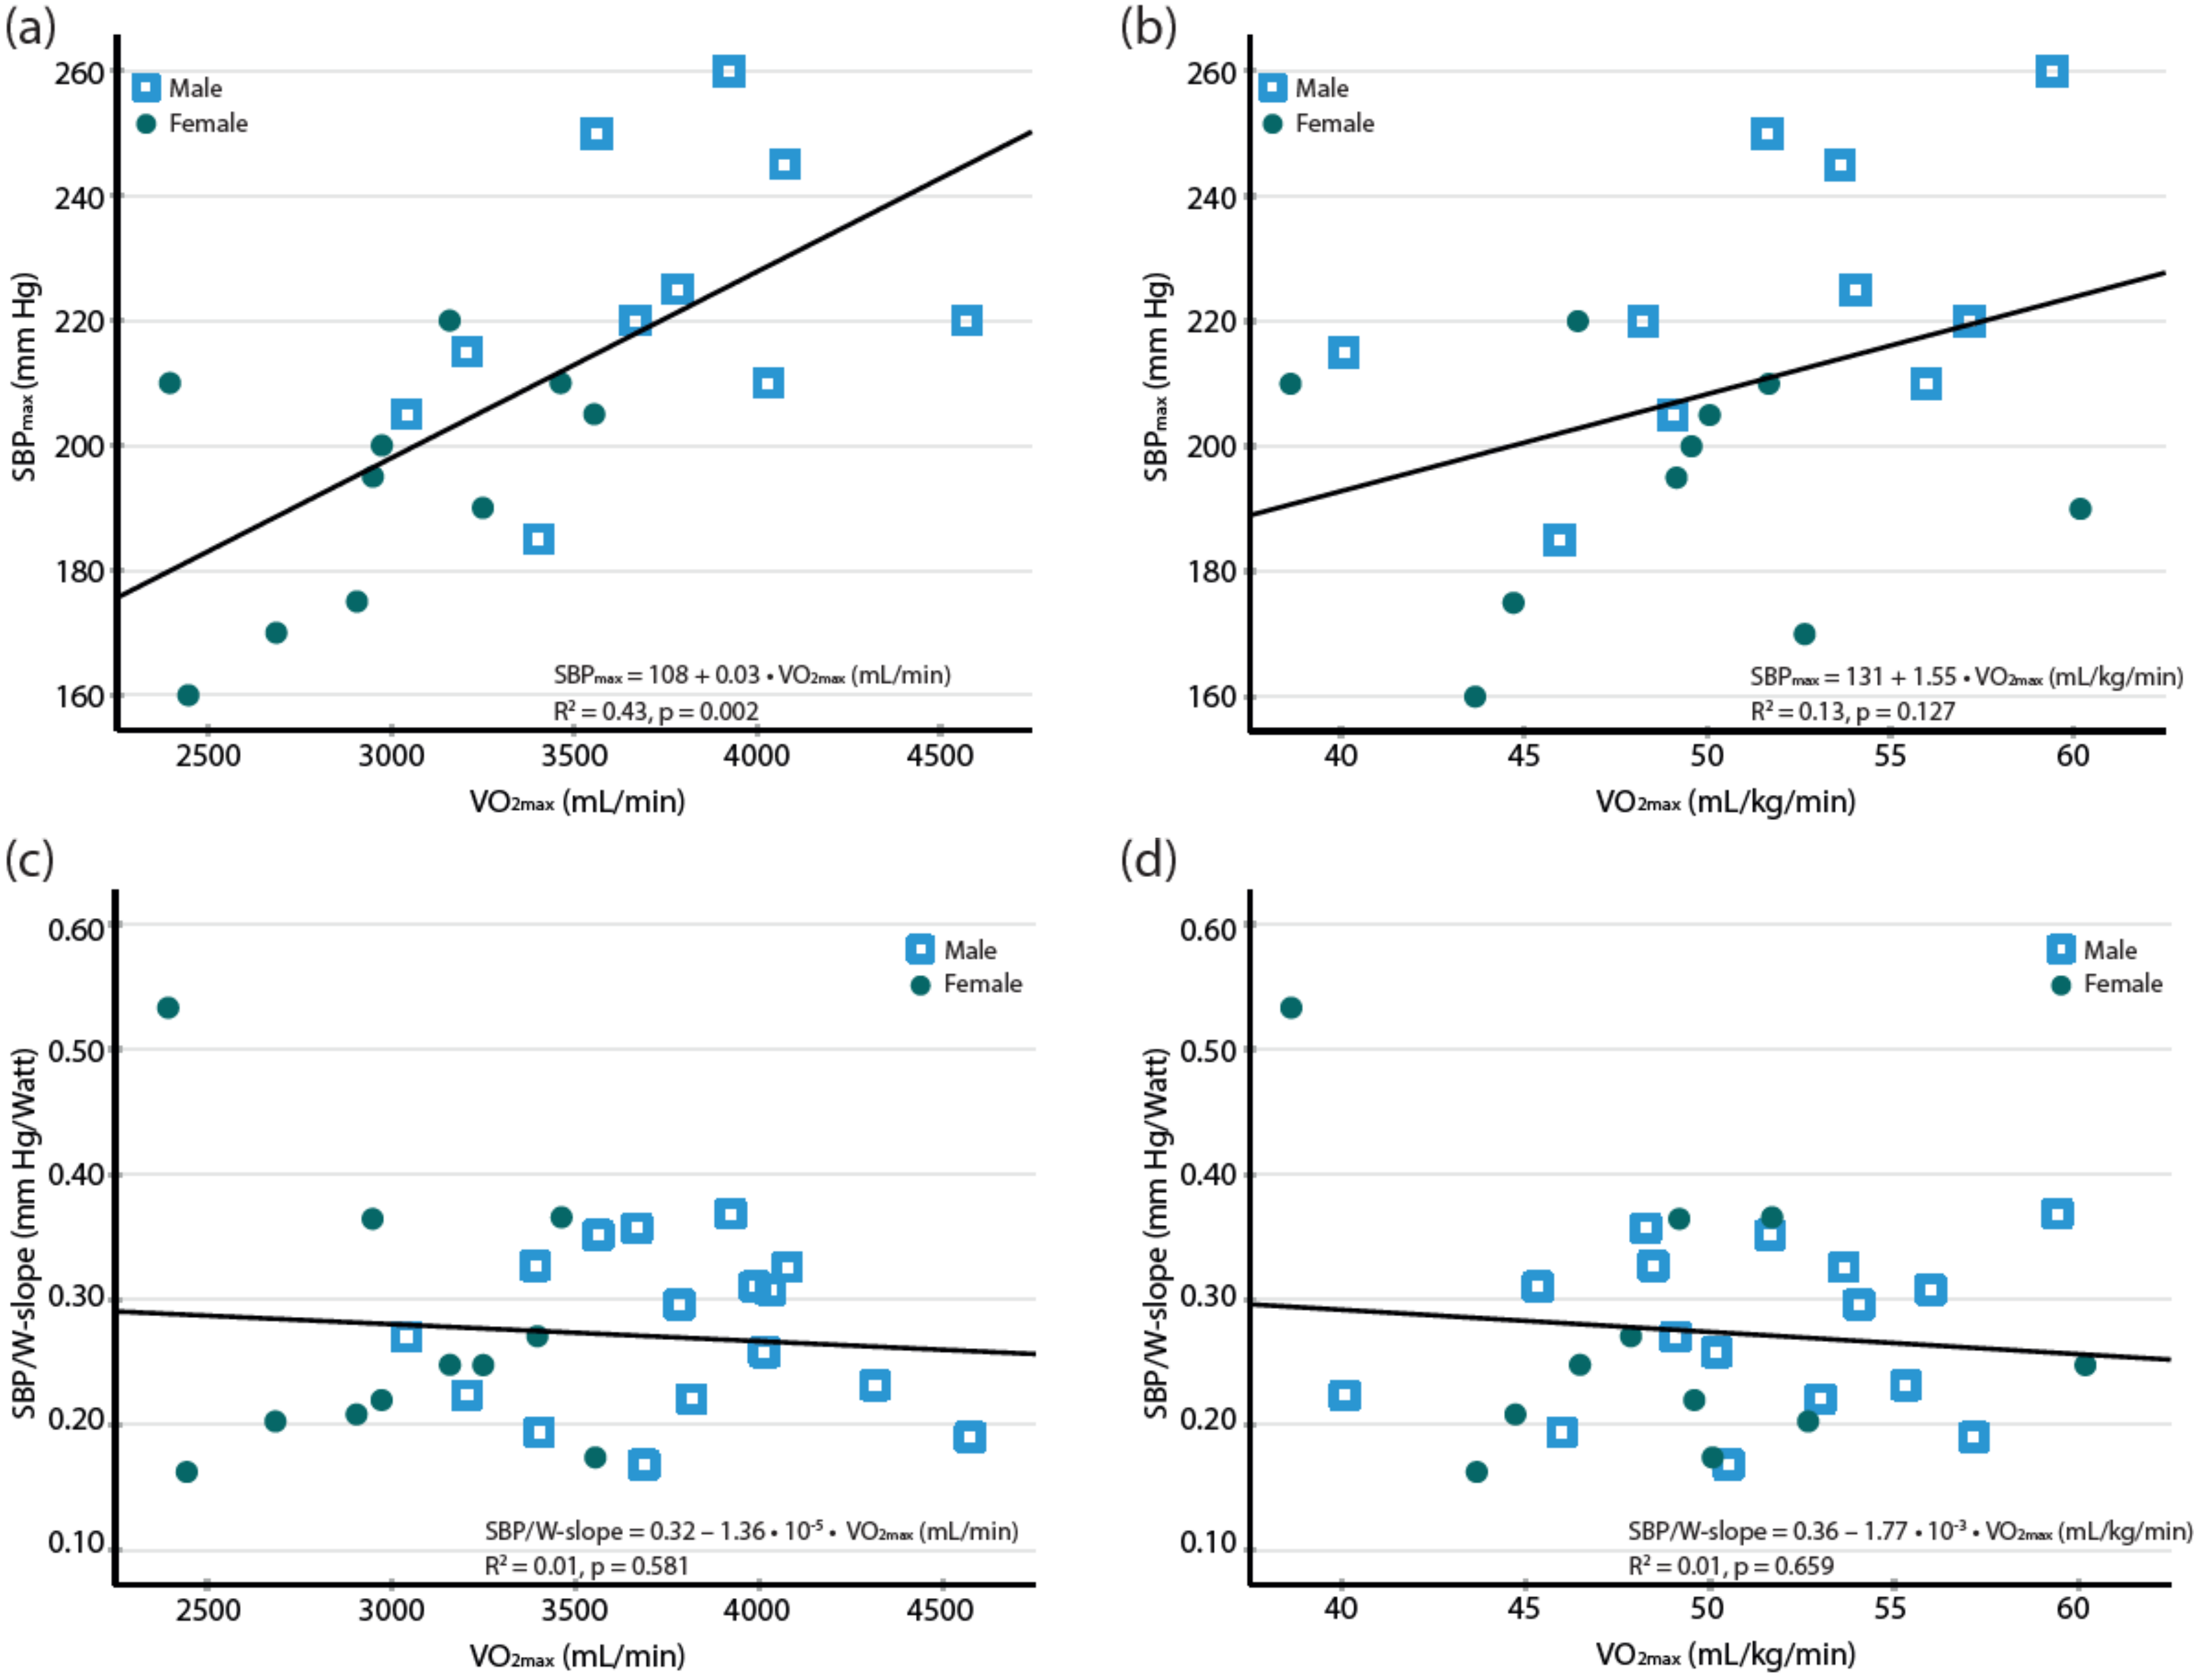
3.2. Blood Pressure Response to Exercise and Correlation to the Maximal Oxygen Uptake

An SBP measurement during the last two minutes of exercise (SBPmax) was missing in six men and one woman, and they were excluded from analyses regarding the SBPmax (but were included in analyses of the slopes). The men reached a higher absolute SBPmax than women, while there were no differences at fixed work rates (50 and 200 W). The mean SBP/W slope was 0.27 ± 0.08 mm Hg/W, and the mean SBP/VO2 slope was 29.8 ± 10.2 mm Hg/L/min, similar between the men and the women (Table 2).
Absolute VO2max (mL/min) was correlated to the SBPmax (Figure 1) but not to any of the SBP measures indexed to work rate (SBP/W slope) or to VO2 (SBP/VO2 slope and SBP/MET slope) during exercise (Table 3). Body weight-indexed VO2max (mL/kg/min) was not correlated to neither SBPmax nor to any of the SBP measures indexed to work rate or VO2 (Figure 1, Table 3).
As seen in Figure 1, one female athlete was an outlier in regards of the SBP/VO2 slope, the SBP/MET slope and the SBP/W slope. Detailed examination of echocardiography and CPET revealed no abnormalities. The outlier had only minor effects on the mean and median values of the SBP measures (Appendix A Table A1).

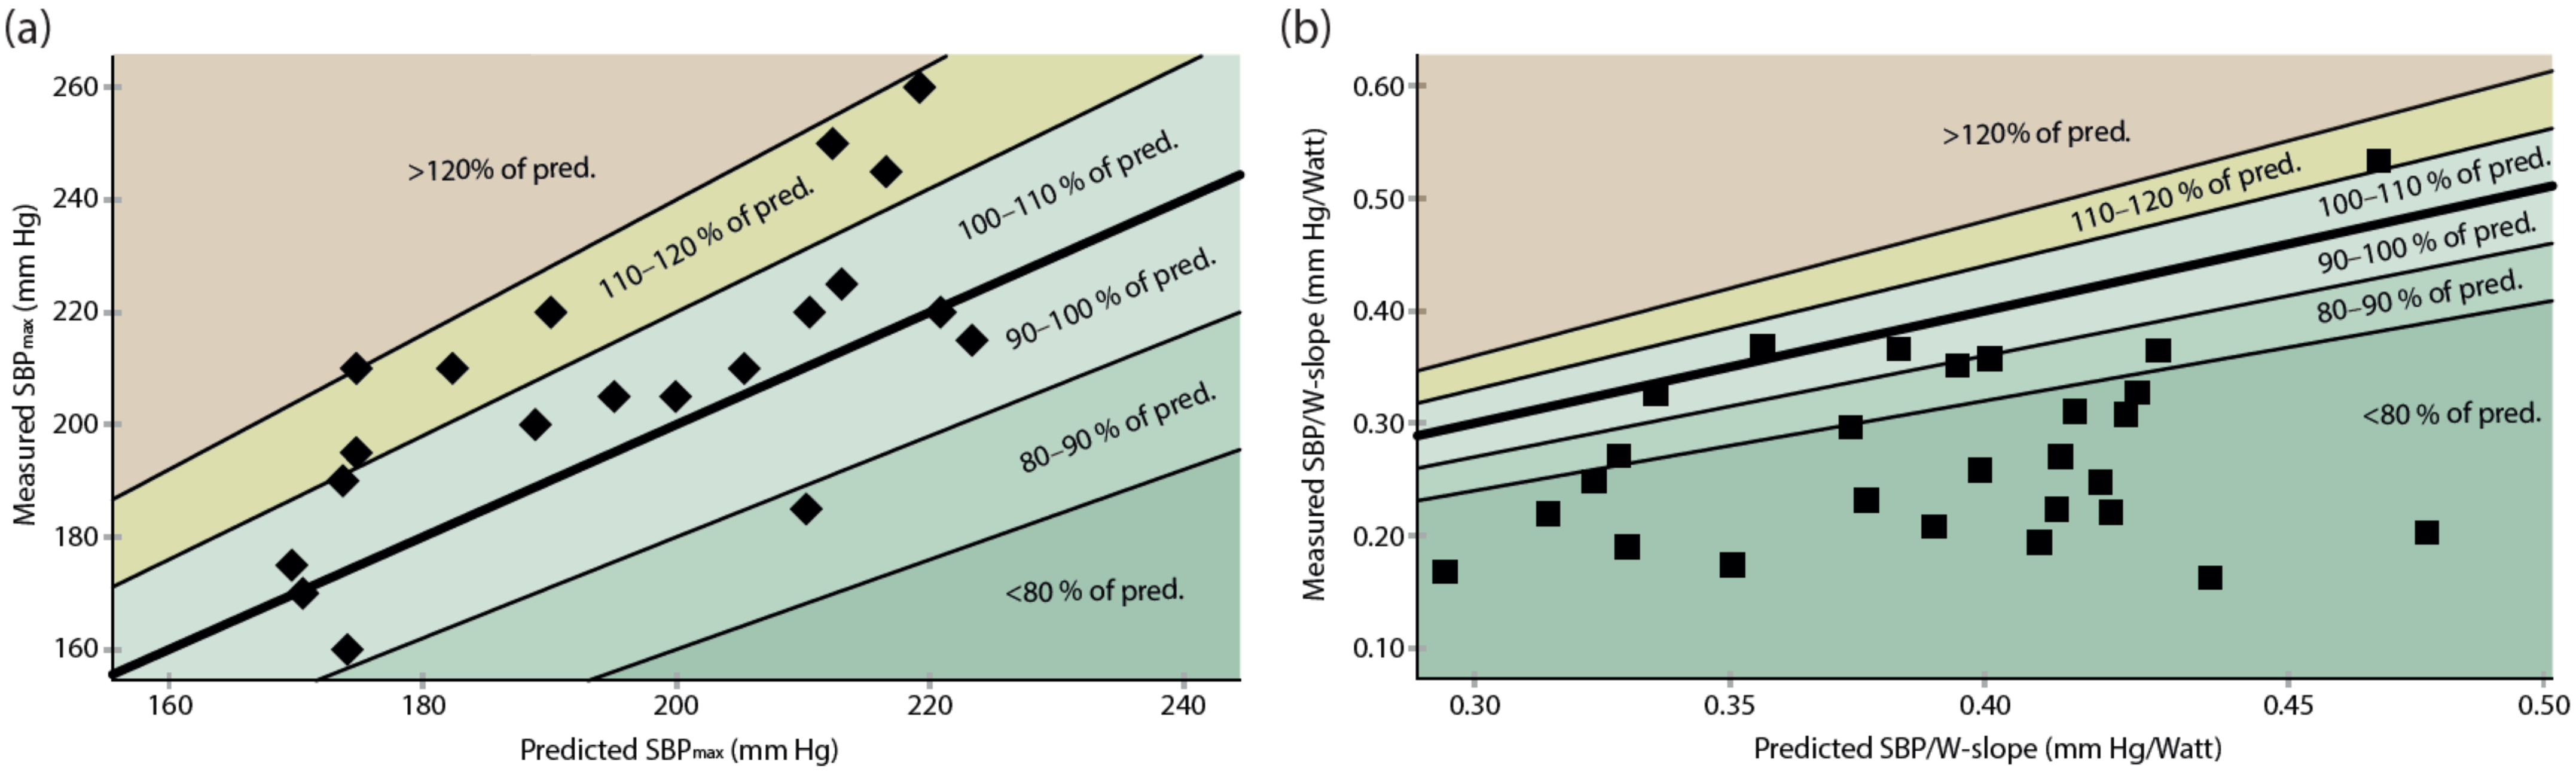
3.3. Comparison with the Suggested Thresholds and Reference Equations

In 21 out of the 27 athletes (78%), the peak systolic blood pressure was exaggerated according to the fixed thresholds suggested in the current guidelines (210 mm Hg in men and 190 mm Hg in women) [1], and the mean SBPmax in both male and female athletes exceeded these sex-specific thresholds (Table 2).
In the athletes, the SBPmax was significantly higher than predicted by the reference equation for the general population (mean difference, 12.2 ± 17.6 mm Hg; 95% confidence interval (CI), 4.0–20.5) (Figure 2). In the female athletes, the mean SBPmax was higher than predicted by the reference equation (mean difference, 14.1 ± 15.0 mm Hg; 95% CI, 3.3–24.9). The mean difference in the measured minus predicted SBPmax in the men was 10.4 ± 20.6 mm Hg (95% Cim −4.3–25.1).
In contrast, the mean value of the SBP/W slope was lower than predicted by the reference equation (mean difference, −0.12 ± 0.08 mm Hg/W; 95% CI, −0.08–−0.15), significantly so also when the men and the women were analyzed separately (in the men, mean difference, −0.11 ± 0.07 mm Hg/W, 95% CI, −0.15–−0.08; in the women, −0.12 ± 0.11 mm Hg/W, 95% CI, −0.19 – −0.05) (Figure 2).

4. Discussion

We showed that in endurance athletes achieving a high work rate (Wmax) and with a high aerobic capacity (VO2max), the SBPmax was higher than predicted using a recent reference equation for the general population [9]. In contrast, the work rate-indexed SBP response (SBP/W slope) was lower in athletes than predicted. Although the SBPmax was higher in male than in female athletes, when work rate was considered (SBP/W slope), there was no difference in the SBP response to exercise between male and female athletes. This and the fact that 78% of the athletes exceeded the suggested thresholds for an exaggerated blood pressure response to exercise [2] underscore the importance of considering work rate in evaluation of exercise SBP in athletes as well as of considering specific reference equations when interpreting the SBP response in athletes.
During pre-participation evaluation of athletes, resting SBP has been found to exceed the threshold for hypertension (140 mm Hg) in about 3–8% of examined athletes [22,23], recognizing a need to account for hypertension in the athletic population as well. Although athletes often undergo exercise testing during their career, the SBP response to exercise in athletes has not gained attention until recently [6], and data on the work rate-indexed SBP blood pressure response in athletes are scarce [11,12,21]. Ultimately, better understanding of the blood pressure physiology in athletes could guide physicians in discriminating a pathological blood pressure response, possibly implying an increased risk of hypertension [24] or other cardiovascular disease, from a physiologically high exercise SBP.
In the present study, the absolute VO2max (mL/min) was significantly correlated to the SBPmax, as previously shown [12], which supports that a high SBPmax during exercise in athletes can reflect a high fitness level [25] and be related to the increased CO during high work rates. However, we found no significant correlations between the weight-adjusted maximal oxygen uptake and the SBP/VO2 slope. One possible reason might be that we only studied relatively fit subjects within a narrow span of the body weight indexed VO2max, and it is possible that with a greater span of fitness level, correlations would be present. Neither did we find any significant correlations between the VO2max (mL/min or mL/kg/min) and the SBP/W slope.
Comparison across previous studies on the work rate indexed SBP response in athletes is somewhat limited by the use of different exercise test protocols. Our cycle ergometry test protocol included a rapid increase from the warmup at 50 W to either 100 W or 150 W just before starting the continuous work rate increment for most participants. This attempt to optimize the total exercise time may have influenced the SBP measurements for some subjects, especially those with a relatively low maximal work rate. Further, cycling ergometry has been shown to elicit higher SBP recordings compared to treadmill testing [26], at least in men [12], which limits comparisons across studies employing different testing modalities. However, a few meaningful comparisons can be made.
We found lower SBP/W slope values than previously reported in a sample of 95 professional male German handball players [11]. Although they were younger, the maximal work rate of the handball players was similar to that of the male athletes in the present study. Their SBPmax was lower (mean, 200 mm Hg), but they had a higher SBP/W slope of 0.35 mm Hg/W compared to what was found in the present study (Table 4). A higher SBPmax in our study sample was expected considering population-based data of increasing SBPmax with increasing age [9], whereas the lower SBP/W slope found in the present study was somewhat unexpected based on the fact that the SBP/W slope also increases with age, at least in the general population [9]. Additional factors may also have influenced the different SBP/W slopes, such as different exercise protocols and the fact that different training regimes used by endurance athletes compared to athletes in team sports may affect the blood pressure response to exercise. Future studies may reveal if and how the work rate indexed SBP response to exercise differs between different sports disciplines. Of note, in the same study by Bauer et al., the SBP at 200 W was measured, with markedly lower mean values than those of the male endurance athletes included in the present study (Table 4).
We found no significant difference in the SBP/VO2 slope between the male and female endurance athletes, as opposed to Petek et al. who found a significantly higher SBP/VO2 slope in female athletes [12]. The absent sex difference in the SBP/VO2 slope in our sample of athletes might have been affected by the female athletes having a relatively higher level of fitness as compared to our male athletes (VO2max, 169% vs. 146% of the predicted values, p < 0.001). However, the difference in the mean age between the men and the women in our sample might also have somewhat limited the comparison to previous studies (Table 4).
A key finding was that the majority of athletes reached SBP values exceeding the proposed upper limits for normal peak SBP. Although sometimes neglected in clinical practice, work rate has a direct impact on exercise SBP, which challenges the clinical interpretation of a high peak SBP as pathological or physiological. Since high SBPmax has been associated with an increased risk of developing hypertension at rest in the general population [24,27] as well as in young athletes [6], it is plausible that blood pressure slope values, taking into account work rate and fitness, may be a better predictor of the future risk of hypertension in this group. This, however, remains to be evaluated.
Another implication of the present findings is that the SBP/VO2 slope provides a novel, precise way of indexing the SBP response to work rate and could provide a valuable tool in further studies investigating the SBP response to exercise. The SBP/VO2 slope has been only scarcely studied in athletes previously, and normative values are lacking. In our sample of endurance athletes, the mean SBP/VO2 slope was 30 mm Hg/L/min, which is slightly higher than the values recently reported by Petek et al. [12] (Table 4). The slope calculated from low work rate in our study, compared to that from sitting rest used by Petek et al., may have contributed to the difference. In addition, as we found a correlation between the absolute VO2 max (mL/min) and the SBPmax, the higher fitness among the athletes in our study sample suggests a need for additional studies of athletes at different fitness levels to better understand the physiology of SBP response in relation to VO2.
The strength of the present study is a contribution to the relatively novel field of exercise SBP in athletes, in particular in relation to work rate and VO2. The limitation is the relatively small sample size. Although we believe our results give a framework for the range of SBP measures expected in athletes, they cannot be used as reference values. Second, all the included subjects were well-trained endurance athletes of middle age. Although this complements previously published data in younger athletes of other sport disciplines [10,21], our results should not be extrapolated to athletes of all ages and all sports. Third, our CPET protocol included an instant increase in work rate at the start of the ramp protocol in order to reduce the total work time for athletes while allowing a standardized measure at 50 W for all subjects. This rapid increase in work rate may theoretically have influenced the results for some of the participants, especially for those reaching a relatively low maximal work rate.

5. Conclusions

Endurance athletes of middle age had higher SBPmax values, the majority exceeding the proposed upper limits for normal peak SBP, but a lower SBP/W slope than predicted using reference equations for the general population. The SPBmax correlated to the absolute VO2max, but there was no correlation between the VO2max (mL/kg/min or mL/min) and the measurements of the work rate-indexed blood pressure response to exercise. Our results indicate that different reference equations than in the general population might be needed for the SBP response in athletes to assist in discrimination between physiologically high and pathologically high systolic blood pressure responses. Considering the small sample size, this needs to be confirmed in larger studies as well as in athletes of varying age.

Author Contributions

Conceptualization, A.C., C.-J.C., M.E. and K.H.; methodology, A.C. and K.H.; formal analysis, A.A., G.E. and A.C.; investigation, A.C. and K.H.; resources, C.-J.C. and A.C.; data curation, A.A. and G.E.; writing—original draft preparation, G.E. and A.C.; writing—review and editing, A.C., A.A., G.E., C.-J.C., M.E. and K.H.; visualization, A.C. and K.H.; supervision, K.H.; project administration, A.C.; funding acquisition, C.-J.C. and A.C. All authors have read and agreed to the published version of the manuscript.

Funding

This research was funded by The Swedish Research Council for Sport Science, grant numbers 2017-0017 and 2018-0187, and The Swedish Heart Lung Foundation, grant number 20160677.

Institutional Review Board Statement

The study was conducted in accordance with the Declaration of Helsinki and approved by the Swedish Ethical Review Authority (Dnr: 2017-67-31).

Informed Consent Statement

Informed consent was obtained from all the subjects involved in the study.

Data Availability Statement

Data available on reasonable request.

Acknowledgments

We are grateful to the personnel at the Department of Clinical Physiology, especially Carl Werbelow and Andreas Bussman, for assisting the recruitment of study subjects and for executing cardiopulmonary exercise tests. We would also like to acknowledge Emerita Eva Nylander and Meriam Aneq for their support and sharing of knowledge.

Conflicts of Interest

The authors declare no conflict of interest.

Appendix A

Figure A1. Illustration of the three different exercise protocols used during the incremental bicycle ergometer cardiopulmonary exercise test in athletes. After five minutes of the steady state at 50 Watts, the ramp phase commenced at either 50 Watts (green line), 100 Watts (red line) or 150 Watts (blue line) and continued at 20 Watts/min until exhaustion.
Jcdd 09 00227 g0a1
Table A1. One female SBP outlier was identified. This table presents the effect on the data when the outlier was excluded.
Outlier IncludedOutlier Excluded
SBP/VO2 slope in all athletes, mm Hg/L/min30.0 ± 10.228.4 ± 6.9
SBP/VO2 slope in female athletes, mm Hg/L/min30.3 ± 14.526.5 ± 7.7
SBP/W slope in all athletes, mm Hg0.27 ± 0.080.26 ± 0.07
SBP/W slope in female athletes, mm Hg0.27 ± 0.110.25 ± 0.07
SBP: systolic blood pressure; VO2: oxygen uptake; W: Watt.

References

  1. Fletcher, G.F.; Ades, P.A.; Kligfield, P.; Arena, R.; Balady, G.J.; Bittner, V.A.; Coke, L.A.; Fleg, J.L.; Forman, D.E.; Gerber, T.C.; et al. Exercise standards for testing and training: A scientific statement from the American Heart Association. Circulation 2013, 128, 873–934. [Google Scholar] [CrossRef] [PubMed]
  2. Liguori, G. American College of Sports Medicine: Guidelines for Exercise Testing and Prescription, 11th ed.; Lippincott Williams: Philadelphia, PA, USA, 2021. [Google Scholar]
  3. Bevegård, S.; Freyschuss, U.; Strandell, T. Circulatory adaptation to arm and leg exercise in supine and sitting position. J. Appl. Physiol. 1966, 21, 37–46. [Google Scholar] [CrossRef] [PubMed]
  4. Astrand, P.O.; Cuddy, T.E.; Saltin, B.; Stenberg, J. Cardiac Output during Submaximal and Maximal Work. J. Appl. Physiol. 1964, 19, 268–274. [Google Scholar] [CrossRef]
  5. Zafrir, B.; Aker, A.; Asaf, Y.; Saliba, W. Blood pressure response during treadmill exercise testing and the risk for future cardiovascular events and new-onset hypertension. J. Hypertens. 2022, 40, 143–152. [Google Scholar] [CrossRef] [PubMed]
  6. Caselli, S.; Serdoz, A.; Mango, F.; Lemme, E.; Vaquer Segui, A.; Milan, A.; Attenhofer Jost, C.; Schmied, C.; Spataro, A.; Pelliccia, A. High blood pressure response to exercise predicts future development of hypertension in young athletes. Eur. Heart J. 2019, 40, 62–68. [Google Scholar] [CrossRef] [Green Version]
  7. Hedman, K.; Cauwenberghs, N.; Christle, J.W.; Kuznetsova, T.; Haddad, F.; Myers, J. Workload-indexed blood pressure response is superior to peak systolic blood pressure in predicting all-cause mortality. Eur. J. Prev. Cardiol. 2020, 27, 978–987. [Google Scholar] [CrossRef] [PubMed] [Green Version]
  8. Currie, K.D.; Floras, J.S.; La Gerche, A.; Goodman, J.M. Exercise Blood Pressure Guidelines: Time to Re-evaluate What is Normal and Exaggerated? Sports Med. 2018, 48, 1763–1771. [Google Scholar] [CrossRef] [PubMed]
  9. Hedman, K.; Lindow, T.; Elmberg, V.; Brudin, L.; Ekstrom, M. Age- and gender-specific upper limits and reference equations for workload-indexed systolic blood pressure response during bicycle ergometry. Eur. J. Prev. Cardiol. 2020, 28, 1360–1369. [Google Scholar] [CrossRef] [Green Version]
  10. Bauer, P.; Kraushaar, L.; Dorr, O.; Nef, H.; Hamm, C.W.; Most, A. Sex differences in workload-indexed blood pressure response and vascular function among professional athletes and their utility for clinical exercise testing. Eur. J. Appl. Physiol. 2021, 121, 1859–1869. [Google Scholar] [CrossRef]
  11. Bauer, P.; Kraushaar, L.; Hoelscher, S.; Weber, R.; Akdogan, E.; Keranov, S.; Dorr, O.; Nef, H.; Hamm, C.W.; Most, A. Blood Pressure Response and Vascular Function of Professional Athletes and Controls. Sports Med. Int. Open 2021, 5, E45–E52. [Google Scholar] [CrossRef]
  12. Petek, B.J.; Gustus, S.K.; Churchill, T.W.; Guseh, J.S.; Loomer, G.; VanAtta, C.; Baggish, A.L.; Wasfy, M.M. Sex-Based Differences in Peak Exercise Blood Pressure Indexed to Oxygen Consumption Among Competitive Athletes. Clin. Ther. 2021, 44, 11–22.e3. [Google Scholar] [CrossRef] [PubMed]
  13. Henry, W.L.; Gardin, J.M.; Ware, J.H. Echocardiographic measurements in normal subjects from infancy to old age. Circulation 1980, 62, 1054–1061. [Google Scholar] [CrossRef] [PubMed] [Green Version]
  14. Lang, R.M.; Badano, L.P.; Mor-Avi, V.; Afilalo, J.; Armstrong, A.; Ernande, L.; Flachskampf, F.A.; Foster, E.; Goldstein, S.A.; Kuznetsova, T.; et al. Recommendations for cardiac chamber quantification by echocardiography in adults: An update from the American Society of Echocardiography and the European Association of Cardiovascular Imaging. Eur. Heart J. Cardiovasc. Imaging 2015, 16, 233–270. [Google Scholar] [CrossRef] [PubMed]
  15. Vanoverschelde, J.J.; Essamri, B.; Vanbutsele, R.; d’Hondt, A.; Cosyns, J.R.; Detry, J.R.; Melin, J.A. Contribution of left ventricular diastolic function to exercise capacity in normal subjects. J. Appl. Physiol. 1993, 74, 2225–2233. [Google Scholar] [CrossRef] [PubMed]
  16. Hedman, K.; Tamas, E.; Henriksson, J.; Bjarnegard, N.; Brudin, L.; Nylander, E. Female athlete’s heart: Systolic and diastolic function related to circulatory dimensions. Scand. J. Med. Sci. Sports 2015, 25, 372–381. [Google Scholar] [CrossRef]
  17. Granfeldt, H.; Nylander, E. Use of vectorcardiography in determination of the left ventricular muscle mass. Clin. Physiol. 1987, 7, 209–216. [Google Scholar] [CrossRef]
  18. Brudin, L.; Jorfeldt, L.; Pahlm, O. Comparison of two commonly used reference materials for exercise bicycle tests with a Swedish clinical database of patients with normal outcome. Clin. Physiol. Funct. Imaging 2014, 34, 297–307. [Google Scholar] [CrossRef]
  19. Glaser, S.; Koch, B.; Ittermann, T.; Schaper, C.; Dorr, M.; Felix, S.B.; Volzke, H.; Ewert, R.; Hansen, J.E. Influence of age, sex, body size, smoking, and beta blockade on key gas exchange exercise parameters in an adult population. Eur. J. Cardiovasc. Prev. Rehabil. 2010, 17, 469–476. [Google Scholar] [CrossRef]
  20. Jetté, M.; Sidney, K.; Blümchen, G. Metabolic equivalents (METS) in exercise testing, exercise prescription, and evaluation of functional capacity. Clin. Cardiol. 1990, 13, 555–565. [Google Scholar] [CrossRef]
  21. Bauer, P.; Kraushaar, L.; Dorr, O.; Nef, H.; Hamm, C.W.; Most, A. Workload-indexed blood pressure response to a maximum exercise test among professional indoor athletes. Eur. J. Prev. Cardiol. 2020, 28, 1487–1494. [Google Scholar] [CrossRef]
  22. Hedman, K.; Moneghetti, K.J.; Christle, J.W.; Bagherzadeh, S.P.; Amsallem, M.; Ashley, E.; Froelicher, V.; Haddad, F. Blood pressure in athletic preparticipation evaluation and the implication for cardiac remodelling. Heart 2019, 105, 1223–1230. [Google Scholar] [CrossRef] [PubMed]
  23. Caselli, S.; Vaquer Sequi, A.; Lemme, E.; Quattrini, F.; Milan, A.; D’Ascenzi, F.; Spataro, A.; Pelliccia, A. Prevalence and Management of Systemic Hypertension in Athletes. Am. J. Cardiol. 2017, 119, 1616–1622. [Google Scholar] [CrossRef] [PubMed]
  24. Berger, A.; Grossman, E.; Katz, M.; Kivity, S.; Klempfner, R.; Segev, S.; Goldenberg, I.; Sidi, Y.; Maor, E. Exercise blood pressure and the risk for future hypertension among normotensive middle-aged adults. J. Am. Heart Assoc. 2015, 4, e001710. [Google Scholar] [CrossRef] [Green Version]
  25. Caselli, S.; Vaquer Segui, A.; Quattrini, F.; Di Gacinto, B.; Milan, A.; Assorgi, R.; Verdile, L.; Spataro, A.; Pelliccia, A. Upper normal values of blood pressure response to exercise in Olympic athletes. Am. Heart J. 2016, 177, 120–128. [Google Scholar] [CrossRef]
  26. Kim, Y.J.; Chun, H.; Kim, C.H. Exaggerated response of systolic blood pressure to cycle ergometer. Ann. Rehabil. Med. 2013, 37, 364–372. [Google Scholar] [CrossRef] [PubMed]
  27. Miyai, N.; Arita, M.; Morioka, I.; Miyashita, K.; Nishio, I.; Takeda, S. Exercise BP response in subjects with high-normal BP: Exaggerated blood pressure response to exercise and risk of future hypertension in subjects with high-normal blood pressure. J. Am. Coll. Cardiol. 2000, 36, 1626–1631. [Google Scholar] [CrossRef] [Green Version]
Figure 1. Relation between the maximal oxygen uptake (VO2max) and blood pressure response (SBP) to exercise in endurance athletes described as (a) VO2max (mL/min) and SBPmax, (b) VO2max (mL/kg/min) and SBPmax, (c) VO2max (mL/min) and SBP/W slope, (d) VO2max (mL/kg/min) and SBP/W slope.
Jcdd 09 00227 g001
Figure 2. Measured exercise blood pressure in the athletes compared to the predicted values from the reference equation. Each black square represents the observation from an individual athlete. Reference line represents a correlation of 1.0. (a) Maximal systolic exercise blood pressure (SBPmax) versus predicted SBPmax (n = 20). (b) Measured SBP/W slope versus predicted SBP/W slope (n = 27).
Jcdd 09 00227 g002
Table 1. Subject characteristics and cardiopulmonary exercise test data.
All SubjectsMenWomenp
(n = 27)(n = 16)(n = 11)
Demographics
Age (years)40 ± 1045 ± 1033 ± 60.002
Weight (kg)69 ± 974 ± 662 ± 7<0.001
Height (cm)176 ± 8180 ± 7170 ± 5<0.001
BMI (kg/m2)22 ± 223 ± 122 ± 20.045
Cardiopulmonary exercise test
VO2max (L/min)3.5 ± 0.53.9 ± 0.43.0 ± 0.4<0.001
VO2max (mL/kg/min)50 ± 551 ± 549 ± 60.23
VO2max (% of predicted)155 ± 19146 ± 13169 ± 17<0.001
METmax14 ± 215 ± 114 ± 20.23
RPEmax (Borg RPE)19 (2)19 (2)17 (2)0.09
Dyspneamax (Borg CR10)8 (2)9 (1)7 (2)0.034
HRmax (beats/min)175 ± 10175 ± 12175 ± 90.89
HRmax (% of age-predicted)97 ± 6100 ± 694 ± 40.008
Wmax315 ± 58349 ± 42266 ± 37<0.001
Wmax (% of predicted)154 ± 19146 ± 17166 ± 160.004
Data presented as the means ± standard deviation except for RPEmax and Dyspneamax, which are presented as the medians (interquartile range). p-value for comparison between the men and the women. BMI: body mass index; RPE: rating of perceived exertion; CR10: category ratio; HR: heart rate; W: Watt; VO2: oxygen uptake; MET: metabolic equivalents of task; max: highest value during the test.
Table 2. Blood pressure data.
All subjectsMenWomenp
(n = 27)(n = 16)(n = 11)
At rest, before the test
SBPlying (mm Hg)124 ± 12128 ± 10118 ± 110.022
DBPlying (mm Hg)75 ± 875 ± 774 ± 8 0.68
SBPsitting (mm Hg)125 ± 14130 ± 11118 ± 130.025
During exercise
SBPmax (mm Hg) 1209 ± 26224 ± 23 194 ± 20 0.005
SBPpeak (mm Hg)211 ± 24 223 ± 20 193 ± 19<0.001
SBP200 W (mm Hg)188 ± 18190 ± 17184 ± 200.35
SBP50 W (mm Hg)145 ± 15148 ± 15140 ± 160.16
Indexed to exercise intensity or work rate
SBP/VO2 slope (mm Hg/L/min)29.8 ± 10.229.5 ± 6.430.3 ± 14.50.85
SBP/MET slope (mm Hg/MET) 27.2 ± 2.47.6 ± 1.66.6 ± 3.30.30
SBP/MET slope (mm Hg/MET) 36.8 ± 1.37.2 ± 1.06.3 ± 1.60.070
SBP/W slope (mm Hg/W)0.27 ± 0.080.28 ± 0.060.27 ± 0.110.94
Data presented as the means ± standard deviation. p-value for comparison between the men and the women. 1 Data regarding the SBPmax include only the subjects with valid measurements within 2 min before the end of exercise (n = 20, 10 men and 10 women) 2 Calculated from the steady state at 50 W to the last SBP measurement during exercise. 3 Calculated from resting SBP (MET = 1) to last the SBP measurement during exercise. Data for one woman were missing regarding resting SBP and DBP measured in the supine position. SBP: systolic blood pressure; DBP: diastolic blood pressure; VO2: oxygen uptake; MET: metabolic equivalents of task; W: Watt; SBP50 W: SBP measured at 50 W; SBP200 W: SBP measured at 200 W; SBPmax: SBP within 2 min before the end of exercise; SBPpeak: highest measured SBP during exercise.
Table 3. Correlation between exercise systolic blood pressure (SBP) measures and the maximal oxygen uptake (VO2max) expressed as both the absolute value (mL/min) and the body weight-indexed (mL/kg/min) value.
VO2max (mL/min)VO2max (mL/kg/min)
SBPmax 1, r (p)0.654 (0.002)0.353 (0.13)
SBP/VO2 slope, r (p)−0.205 (0.31)−0.258 (0.19)
SBP/MET slope 2, r (p)0.066 (0.75)−0.266 (0.18)
SBP/MET slope 3, r (p)0.140 (0.49)−0.290 (0.14)
SBP/W slope, r (p)−0.089 (0.66)−0.111 (0.58)
SBP at 50 W, r (p)0.156 (0.44)0.005 (0.98)
SBP at 200 W, r (p)0.048 (0.81)−0.050 (0.81)
1 Calculated for subjects with SBP measurements within the last 2 min of exercise, n = 20. 2 Calculated from the steady state at 50 W to the last SBP measurement during exercise. 3 Calculated from resting SBP (MET = 1) to the last SBP measurement during exercise.
Table 4. Comparison of subject characteristics and bicycle cardiopulmonary exercise test results in the current and previous studies on the systolic blood pressure response to exercise in athletes.
Current StudyBauer et al. Petek et al.
[11][10][12]
Male endurance athletesFemale endurance athletesMale handball playersMale handball playersFemale football playersMale athletesFemale athletes
Age (years)45 ± 1033 ± 726 ± 522 ± 221 ± 238 ± 1634 ± 15
Height (cm)179 ± 7170 ± 6189 ± 7189 ± 7167 ± 5NANA
Weight (kg)73.7 ± 6.462.9 ± 6.991.5 ± 10.790.9 ± 12.360.8 ± 7.7NANA
BMI (kg/m2)22.9 ± 1.421.8 ± 1.825.7 ± 225.5 ± 2.421.7 ± 1.9NANA
Before the test, at rest
SBPsitting (mm Hg)130 ± 12120 ± 14123 ± 10125 ± 10120 ± 11121 ± 9110 ± 10
At peak exercise
Wmax344 ± 39269 ± 39339 ± 64342 ± 72190 ± 32344 ± 72211 ± 48
VO2max (mL/kg/min)51 ± 549 ± 6NANANA46 ± 1037 ± 8
HRmax (beats/min)174 ± 12176 ± 9179 ± 10179 ± 12184 ± 8175 ± 16175 ± 15
HRmax (% predicted)100 ± 694 ± 394 ± 5NANANANA
SBP response to exercise
SBPmax (mm Hg)224 ± 24 194 ± 20 200 ± 20202 ± 20177 ± 15186 ± 24161 ± 15
SBP/W slope (mm Hg/W)0.28 ± 0.060.27 ± 0.110.34 ± 0.130.34 ± 0.120.53 ± 0.190.20 ± 0.060.25 ± 0.08
SBP200 W (mm Hg)191 ± 17184 ± 22169 ± 18NANANANA
SBP/VO2 slope (mm Hg/L/min)30 ± 630 ± 15NANANA21 ± 726 ± 7
Data presented as the means ± standard deviation. BMI: body mass index; SBP: systolic blood pressure; RPE: rating of perceived exertion; HR: heart rate; W: Watt; sitting: sitting on a bicycle before exercise; max: highest value during the test; 200 W: measured at 200 W.
Publisher’s Note: MDPI stays neutral with regard to jurisdictional claims in published maps and institutional affiliations.

