Influence of Fluidic Control in a Staged Lean Jet Engine Burner on Combustor Performance †
by
Seiji Yoshida
1,*, 
Christoph Hassa
2, 
Takeshi Yamamoto
1,
Johannes Heinze
2 and
Michael Schroll
2 1
Aeronautical Technology Directorate, Japan Aerospace Exploration Agency (JAXA), Tokyo 182-8522, Japan
2
Institute of Propulsion Technology, German Aerospace Center (DLR), 51147 Cologne, Germany
*
Author to whom correspondence should be addressed.
†
This paper is a modified version of our paper “Effects of Fluidic Control of Air-Flow Distribution on Staged Lean Jet Engine Burner” published at ASME Turbo Expo 2016: Turbomachinery Technical Conference and Exposition, Seoul, South Korea, 13–17 June, 2016.
Fluids 2019, 4(4), 188; https://0-doi-org.brum.beds.ac.uk/10.3390/fluids4040188
Submission received: 8 July 2019
/
Revised: 8 October 2019
/
Accepted: 14 October 2019
/
Published: 1 November 2019
(This article belongs to the Special Issue Turbomachinery Flow Analysis)
Abstract
:To improve the turn-down ratio of a lean combustor, which has the greatest potential for reducing NOx emissions from jet engines, fuel staging is commonly employed. To further extend the stable operation range, air staging with a fluidic element is also considered. The influence of fluidic control on combustion was analyzed to better understand fluidic element-burner interactions. The pressure loss of each fluidic element was determined by measuring the pressure at the element exits. The effect of fluidic control on the atomization, fuel distribution, and flow field was investigated using optical, noninvasive techniques. The combustion performance of the burner with the fluidic element was evaluated using exhaust gas analyses. The pressure losses of the swirlers and fuel mixers were varied depending on the bleed air from the fluidic element. Under the idle condition, the reduction of pressure loss in the pilot fuel mixer resulted in inferior atomization due to the reduced gas velocity around the fuel film, which had a positive effect on lean blowout. Under the cruise condition and the staged mode, the reduction of the pilot air flow increased the equivalence ratio of the lean pilot stage and resulted in higher combustion efficiency.
1. Introduction
Lean premixed combustion is currently the best technique for reducing NOx emissions from jet engines. However, its inherently narrow range of stable combustion is a key problem, with a large propensity for combustion oscillations at the limits of this stability range [1]. For small engines of regional aircraft, lower combustor temperatures during cruise conditions exacerbate this problem [2]. To obtain a lean combustor with the necessary turn-down ratio for gas turbine operation, fuel staging is used as a standard solution. At lower load conditions, only a pilot stage operates with a diffusion flame for stable combustion. At higher load conditions, a main stage operating in premixed mode yields low-NOx combustion, while the pilot stage remains in operation to guarantee stable flame holding of the main stage. As the size of the pilot burner must be limited to prevent excessive NOx formation, a single staging point might not be sufficient; instead, circumferential staging of burner groups in the annular combustor or additional fueling devices may be required [3].
For some lean burning industrial gas turbines, adjustment of the air-flow distribution in the combustor is also used along with fuel staging. One method of changing the air-flow rate is to use a bypass valve mounted on the combustor transition piece [4]. Approaches with variable geometry have been attempted in the early phases of lean aero engine combustor development [5]; however, these have been rejected due to unsatisfactory control and durability concerns for mechanical devices operating under high pressure-high temperature air flow. In order to achieve air-flow control in a jet engine combustor, the control device must be able to withstand a harsh environment. In addition, it must be highly reliable, compact, and lightweight. Considering these requirements, fluidic elements, which were intensively developed in the 1960s and 1970s for use in signal processing [6], have been utilized as air-flow control devices for jet engine combustors. For example, some methods were proposed which varied the air-flow proportions of primary-air, secondary-air, and dilution-air [7,8,9,10], as well as methods which adjusted the effective open area of the burner [11,12]. In the majority of these cited studies, only air staging was used to augment the operating range. However, to achieve stable lean combustion over the entire operating range, the relative change in combustor primary zone air–fuel ratio (AFR) must mirror the turn-down ratio. Hence, a major part of the burner near-field flow must be diverted. In a gas turbine, it is highly desirable to maintain an almost constant effective area of the combustor; therefore, most of these studies utilize fluidic elements that enlarge the air flow at one part and reduce it at the other, leading to double the number of necessary fluidic elements.
Recognizing that the operating range in a lean burn combustor is not achievable without the combined effect of fuel staging and extension of lean blowout by diffusion burning, the Japan Aerospace Exploration Agency (JAXA) has been investigating fuel and air staging with a fluidic element. To make it economically attractive, a balance must be reached between the additional cost and operational disadvantages of a fluidic element and the operational disadvantages of circumferential staging of burners or the additional costs of another fueling device. Compared with earlier approaches, a fluidic element requires much lower control because the underlying fuel staged lean burner already fulfills the requirements of safe operation, but the burner requires a larger operating margin for NOx emission and lean blow out to fulfill emission goals [13].
Therefore, attention should be paid to the regulation side of aero engines, where emissions are determined by the landing and take-off emission cycles of the International Civil Aviation Organization (ICAO). Emissions for taxi/ground idle, take-off, climb, and approach modes are measured and summarized using weighting factors derived from standard dwell times at these operating points [14]. Additionally, operability requirements should be considered. Hence, it is not enough to demonstrate safe operation and low emissions at full load; different emission requirements must also be satisfied over the entire load range. To better understand the requirements of the fluidic element, they are discussed here briefly in order of ascending load.
First, the required lean stability range of the combustor should be fulfilled with an AFR that is considerably higher than that during the ICAO idle mode. At this point, the pilot stage AFR must not exceed the lean blowout (LBO) limit of the diffusion flame. Together with the required low pilot NOx emissions, this limits the relative amount of pilot air flow with a fixed geometry burner. Moreover, there is the clear advantage of a shift of combustion air away from the pilot. When the pilot size fulfils these conditions, the pilot stage runs rich in the ICAO idle mode. Hence, a fuel staged burner with only the pilot fueled is a rich-lean burner without an explicit quenching zone. Although NOx emissions are low at low zonal temperatures, they should be optimized due to the long dwell time in the ICAO cycle. A shift of air away from the pilot could help to achieve better rich-lean staging with a shorter dwell time of the mixture around stoichiometry if the other criteria such as combustion efficiency are fulfilled. The longest part of the flight, cruise mode, remains unregulated; however, depending on the length of the flight, it can produce a significant or dominant proportion of the overall emissions. Therefore, the promise of lean combustion cannot be delivered if fuel staged operation is not achieved during this flight mode. Combustion efficiency is important for airlines but difficult to achieve, especially for smaller aircraft with lower combustor exit temperatures in cruise mode. When it is necessary to run the pilot only during the last cruise phase, soot can be a problem for a very rich pilot burner. In both cases, shifting air can help, especially around the fuel staging point. During the climb-out and take-off modes, both stages can run lean. Because a larger part of the overall emissions will be generated from the pilot burner fuel, shifting air can again help to reduce NOx emissions.
Instead of proposing a fully-fledged design integrating burner design and fluidics, JAXA initiated a feasibility study to demonstrate the effect of a fluidic element on the performance of their burner. To that effect, a fluidic element was joined to the inlet of a burner scaled from the already largely optimized [15] lean staged JAXA burner; proof of concept has already been provided in a previous study [16]. However, a prototype fluidic element and a complicated burner interacting over the load cycle will almost certainly not yield optimum results. Hence, a more detailed analysis of the influence of fluidics is required to better understand fluidic element-burner interactions and suggest necessary advances. Therefore, this study reports a collaboration between the German Aerospace Center (DLR) and JAXA that aimed to investigate the influence of fluidic control on combustion. First, the fluidic-element pressure loss was determined by measuring the pressures at the exit of the fluidic element [16]. The pressure drops across the fuel mixers and the nozzle exit section were also estimated. Next, an investigation with noninvasive techniques under representative conditions was conducted [17], including particle image velocimetry (PIV), chemiluminescence measurements, kerosene planar laser induced fluorescence (kerosene-PLIF), and planar laser induce fluorescence on the hydroxyl radical (OH-PLIF) in the center axis plane of the combustion chamber in a single sector combustor. After that, exhaust gas analyses and soot concentration measurements were conducted [16]. In the following sections, the fluidic element and burner are presented, the specific methods and experimental devices are described, and the experimental results are characterized in order of ascending load. Finally, the general conclusions and directions for future work are presented.
2. Burner with Fluidic Element
The burner used in this study has one fluidic element with an annular flow channel, which is attached at the entrance of an air-blast lean staged burner. This fluidic element is illustrated in Figure 1. It comprises one inlet channel and two outlet channels for primary flow, and two control flow channels which are connected to both sides of the inlet channel, where the inlet and two outlets are connected. The primary flow comes into the fluidic element through the inlet. A small amount of air bleeding from one side of the control flow channels deflects the primary flow and varies the air-flow split between the two outlets.
Typically, in order to control the flow in a fluidic element, fluid is injected into it. However, this is not a practical approach in a jet engine combustor, because another air source, at a higher pressure than the combustor, would be necessary. In contrast, controlling the fluidic element with bleeding can be easily accomplished by connecting the bleed flow passage to a position at a lower pressure than the combustor, because the combustor is at the highest pressure in the jet engine. This is, however, a loss of air mass flow to the core engine, which, along with the additional weight of the control devices outside the hot flow path, ultimately affects the efficiency balance of the whole engine.
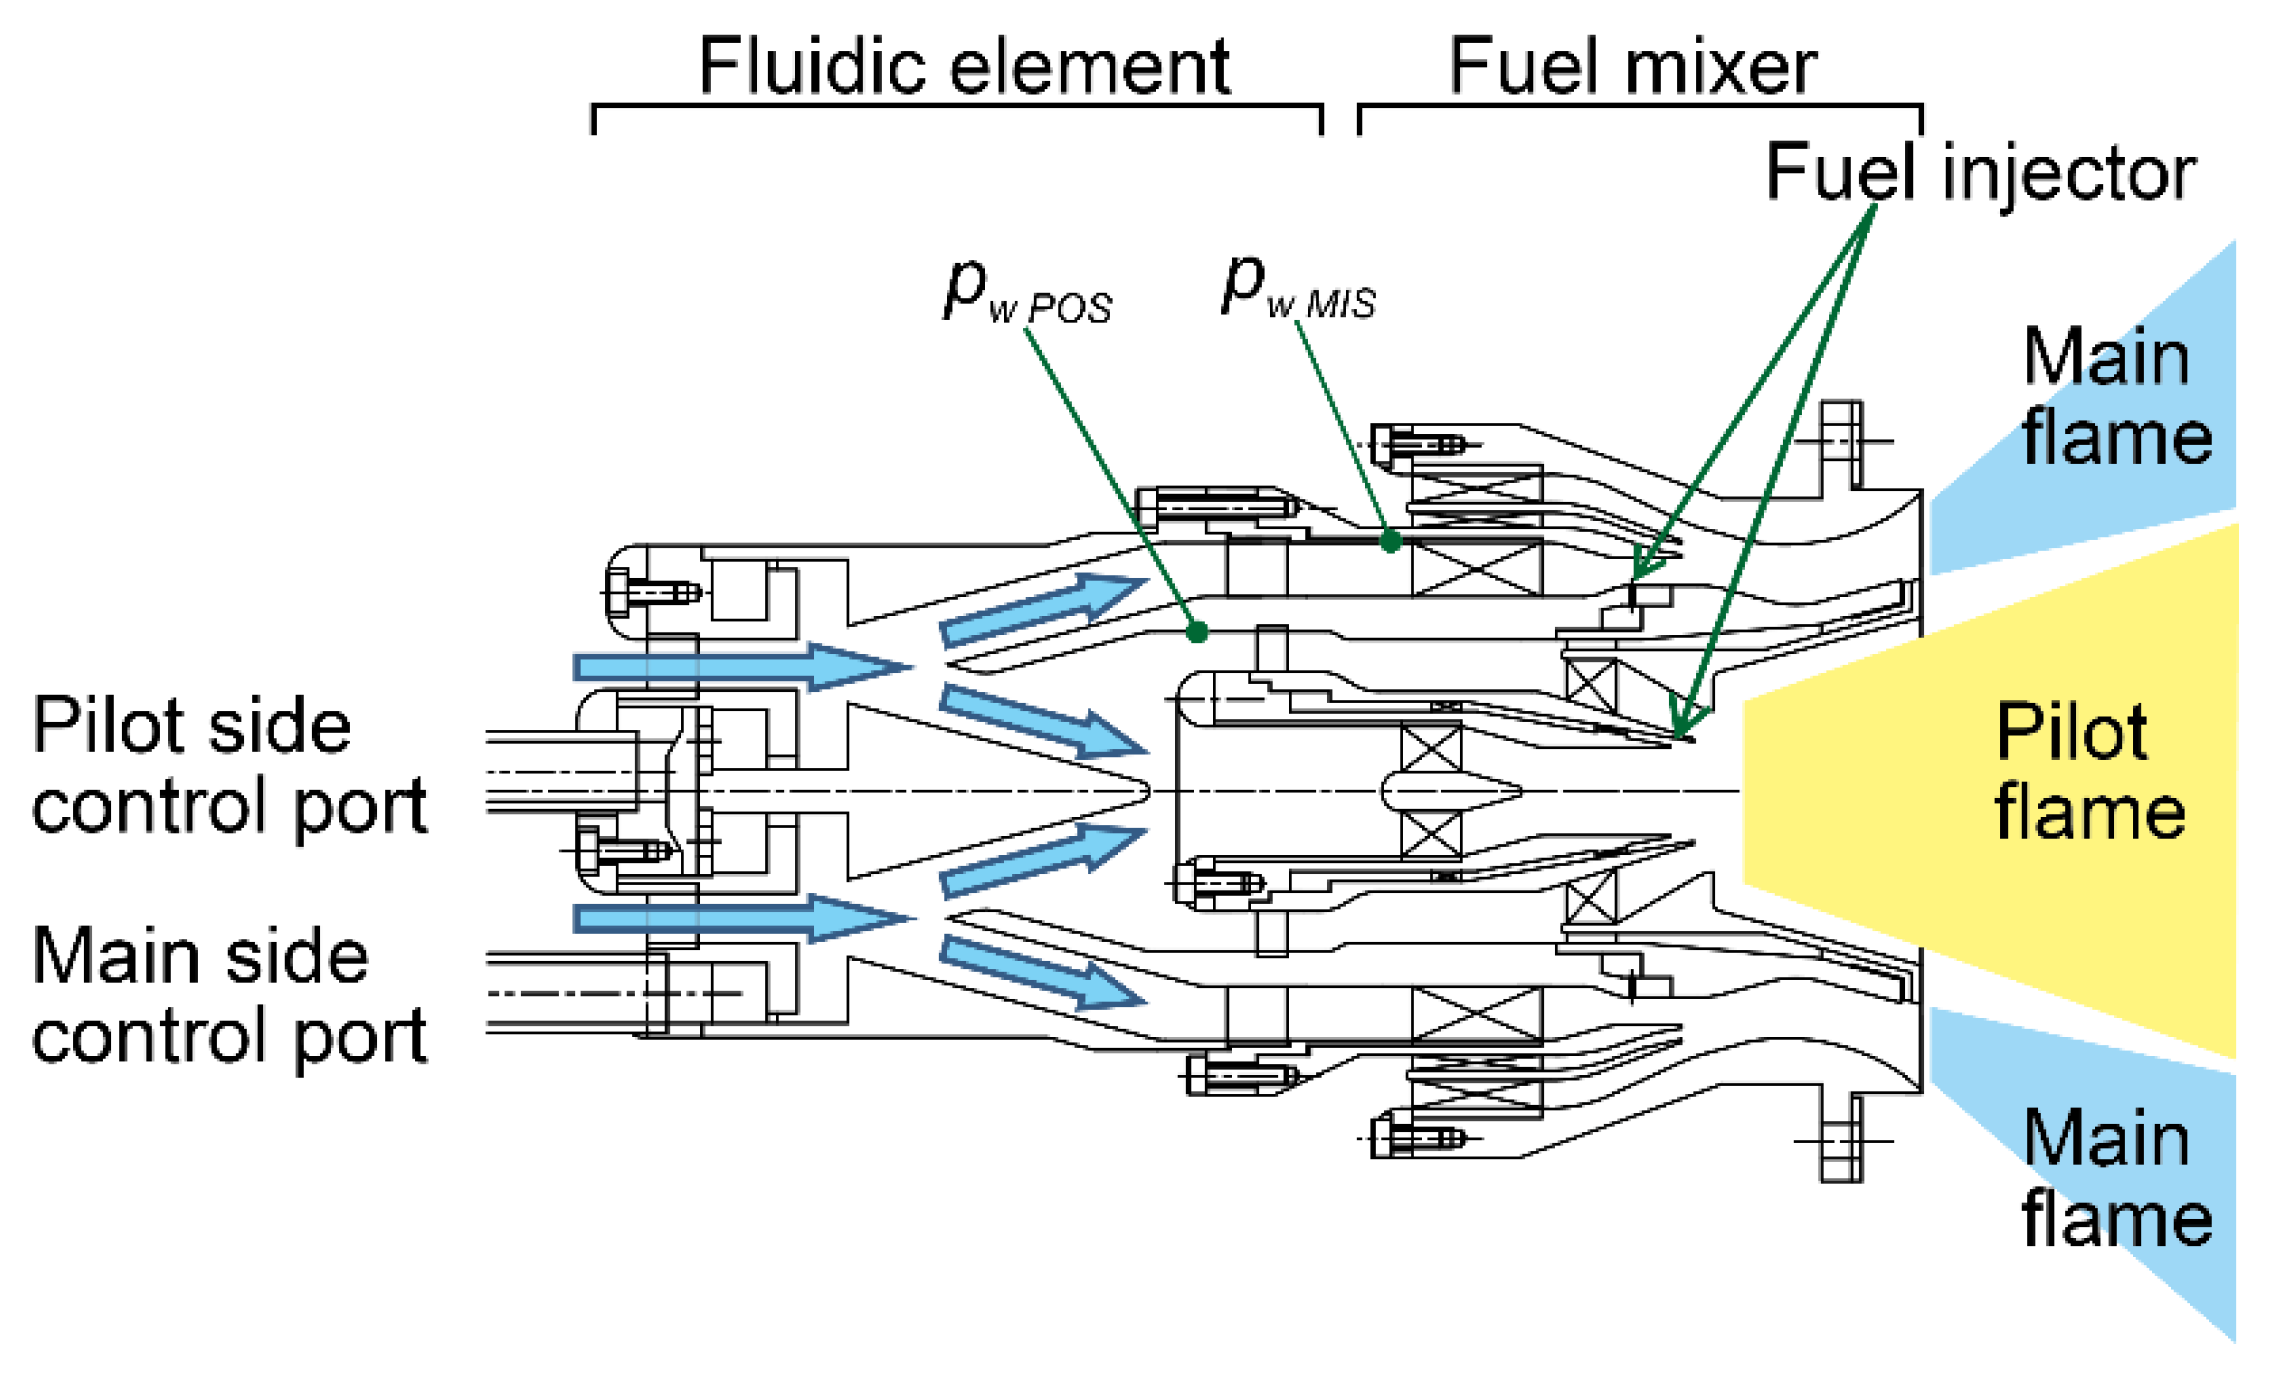
Figure 2 is a cross-sectional diagram of the burner. The burner design is based on a similar burner developed as part of the JAXA TechClean project [15] and comprises an external main burner and an internal pilot burner, which are co-axially located. The pilot burner has two counter-rotating swirlers and the pilot fuel is injected by a pre-filmer between these swirlers. The main burner has three swirlers, where the main inner swirler (MIS) and outer swirlers are in co-rotation with the pilot outer swirler (POS). The main middle swirler is in counter-rotation to the MIS and outer swirlers. The main fuel is injected by simple jets in the inner swirler cross flow and re-atomized by a splash plate. The burner’s exit diameter is 60 mm. The fluidic element is mounted at the burner entrance. One fluidic-element outlet is connected to the pilot mixer and the other is connected to the MIS. Thus, the air-flow split ratio of the pilot and main mixers can be varied. Inevitably, this also varies the swirl number of the burner. A small amount of air bleeding through the inner control channel, designated case P in the following description, bends the jet in the fluidic element inward and increases the pilot air-flow rate. Conversely, a small amount of air bleeding through the outer control channel, case M, shifts a certain amount of air from the pilot mixer to the main mixer. Case N indicates neutral and no bleeding.
3. Experimental Facility and Measurement Techniques
3.1. Air-Distribution Measurement under Atmospheric Pressure
The fluidic-element pressure loss in the burner and the pressure losses of the swirler and nozzle exit sections were evaluated using the pressures on the walls, pw, of the fluidic-element inner and outer exits. To measure pw, pressure-sensing holes were drilled into the walls at the fluidic-element exits; their positions are illustrated in Figure 2, upstream of the MIS and POS. The measurements of pw were conducted in the “atmospheric primary zone” (APZ), an atmospheric combustor test cell at DLR. Its experimental arrangement is illustrated in Figure 3. The burner with the fluidic element was installed in a cylindrical plenum (length: 200 mm; inner diameter: 130 mm), which was mounted on a vertical overhead test structure. Air was supplied to top of the plenum. The static pressures in the plenum, p0, and combustion chamber, ptc, were measured using pressure transducers. It was assumed that the measured static pressures were equal to the total pressures because the cross-section of the plenum and the combustion chamber area were large; consequently, the air-flow velocities in them were slow. In order to control the air split, a small amount of the air in the fluidic element was bled. The bled air was absorbed into a suction system, which was at a pressure of approximately 10 kPa below atmospheric pressure. The pressure differentials between the pressure-sensing holes and the combustion chamber, Δpw, were measured using differential pressure transducers. In order to evaluate swirl number, Sn, the air-flow torque was measured using a swirl meter, which was mounted downstream of the burner exit. Sn was calculated from the torque, air-mass flow rate (m), and air density.
The total pressures were calculated from the measured pw by making some assumptions. The first assumption is that the m values can be calculated using
Here, the suffix i indicates the flow path from MIS to POS. mi is the air-mass flow rate. Δpi is the total pressure difference between the total pressures upstream of the swirler, pti, and the total pressure in the combustion chamber, ptc. The effective open areas of each flow path, Aei, are listed in Table 1. They were estimated from an atmospheric isothermal test, which was carry out without the fluidic element. It should be noted that addition of the consecutively measured effective areas means that these areas are always larger than the effective area of the integral burner because the interaction of air streams at the burner inlet causes losses at the inlet, which are not as strong in the case of a singularly open swirler channel. Hence, the flow resistances of the swirler and nozzle exit section are reflected in these results.
Next, it was assumed that the measured pwi was equal to the static pressure of the air flow, and pti was calculated using the cross-sectional average flow speed, ci, where
The ci values were calculated from the volume flow rate, Qi, and the geometric open area, Agi, of the flow path according to
The Agi terms are the cross-sectional areas where the pressure-sensing holes were located, and their values are listed in Table 1. The maximum Δpi in the test was around 3.0 kPa, and the maximum ci was estimated to around 22 m/s. Its Mach number was around 0.07. In this range, the incompressible flow assumption was made. With Equations (1)–(3), all unknown values could be eliminated to derive the following equation:
Hence, Δpi could be obtained from the measured pwi.
3.2. Single Sector Combustor for Optical Measurement under High Pressure Condition
Optical measurements were conducted in the combustion chamber under high pressure conditions in the single sector combustor (SSC) at DLR [18]. The setup of the combustion chamber, plenum chamber, and burner are shown in Figure 4. The liner width, depth, and length are 100 mm, 100 mm, and 264 mm, respectively. Three of the side walls of the combustion chamber are glass; thus, they provide optical access from three directions to the inside of the combustor. A hydrogen torch for ignition is mounted on the remaining side wall. Electrically preheated air is supplied to the plenum chamber upstream of the combustor, where the burner is mounted, through critical nozzles. Twenty two percent of the preheated air is branched off for the inner cooling film of the quartz windows. Air at normal temperature cools the outside of the windows and feeds the film cooling of the secondary zone. The remainder of that stream bypasses the liner and is ejected together with the combustion air through a fixed critical nozzle at the combustor outlet. The combustor pressure is controlled by the mass flow of the bypassing cooling air. In this study, the combustor was placed on a 3-D traverse with 0.1 mm steps. The maximum preheated and non-preheated air-flow values were 1 kg/s at 850 K and 2 kg/s, respectively.
3.3. Optical Measurement Techniques
The measurement techniques used in this study are summarized in Table 2. PIV and other spectroscopic measurements were performed separately using a different optical setup.
3.3.1. Particle Image Velocimetry (PIV)
To investigate highly luminous flames, a PIV setup with two cameras was employed, as described in detail previously [19]. This system avoids overexposure of the second picture which can typically occur with a standard PIV setup. This is caused by part of the flame luminescence penetrating the bandpass filter of the camera, which is centered around the wavelength of the laser, and becoming incorporated into the image during its extended exposure time, caused by the interline-transfer charge coupled device (CCD) sensor. By exposing each sensor separately for periods of time in the sub-microsecond range, saturation due to flame luminosity can be sufficiently reduced.
A double pulse Nd:YAG laser (Quantel) with a pulse energy of 120 mJ per pulse, 5 ns pulse duration, 532 nm output wavelength, and 15 Hz maximum frequency was used to illuminate the necessary tracer particles for PIV within a parallel light sheet approximately 1 mm thick in the beam waist and 50 mm high, which was formed by a combination of two spherical and two cylindrical lenses (f.sph = −50; f.sph = +100; f.cyl = −25; f.cyl = +200). The particles consisted of porous silica spheres (SiO2, 0.5–1.5 µm size range) which were dispersed using a fluidized bed seeding device and were added to the flow in the upstream plenum of the single sector combustor. The particle images were recorded by two PCO.1600 cameras (PCO, Kehlheim, Germany) (1200 by 1600 pixels, pixel size 7.4 by 7.4 µm2, 14 bit, fps 30 Hz in single image mode) in combination with a medium format lens Mamiya 120 mm/f#2.8, and a laser line filter (532 nm, +/−3 nm FWHM, Quantum Design, Darmstadt, Germany) in front. Recording was done with a reduced resolution of 1600 by 992 pixels, maximum laser frequency of 15 Hz, a pulse interval of 8 µs, and an exposure time of 1 µs.
Time averaged mean velocities were calculated from 1000 instantaneous flow field images. To obtain velocity maps the collected image pairs were processed with the PIV software PIVview2C which implants a state-of-the-art multi-grid interrogation algorithm into an initial sampling window of 128 by 128 pixels and final window size of 64 by 64 pixels on a sampling grid of 32 by 32 pixels. With a magnification factor of 33.66 pixel/mm the final vector matrix is roughly about 1 by 1 mm. During evaluation, the averaged background image was subtracted, over-exposed areas such as the windows were masked and minor filter settings were used (normalized median, maximum displacement, maximum displacement difference, and dynamic mean). Outliers caused by these filters were re-evaluated with larger samples or lower order peaks to attempt to achieve a complete velocity vector field.
3.3.2. Spectroscopic Methods
The following methods were used in this study:
- Mie-scattering spray visualization
- PLIF of kerosene for qualitative imaging of the liquid and gaseous fuel
- PLIF of OH radicals for qualitative imaging of the high temperature regions
- OH* chemiluminescence imaging of the reaction zones
To observe two of these quantities simultaneously, a two-intensified charge coupled device (ICCD) camera system was set up. It was equipped with dichroitic mirrors and different wavelength band pass filters mounted in a filter wheel to enable fast and exchangeable spectral filtering.
For the measurements of liquid fuel distributions by planar Mie scattering, only a small portion (ca. 0.5% or 1 mJ) of the green laser pulses from the Nd:YAG Laser (Spectra Physics GCR 190–10 Hz, Spectra Physics, Santa Clara, CA, USA)) are required. To avoid overexposure of the Mie images, the sensitivity of ICCD camera 1 (PCO Dicam Pro, S20 photocathode, P46, 1280 by 1024 pixels with two by two binning, equipped with a UV lens) had to be further reduced by three orders of magnitude compared to the laser induced fluorescence (LIF) and chemiluminescence measurements. The Mie images were corrected for the intensity distribution within the laser light sheet and the laser extinction of the laser light sheet (LLS) in the spray [20]. Therefore, the ratio of the out-to incoming LLS were able to be spatially resolved in the reference cells by camera three. These reference cells were filled with fluorescing dye solution to measure both the energy distribution over the LLS as well as the extinction and absorption across the combustor.
For the planar-laser-induced fluorescence of aromatic hydrocarbons (AH or kerosene-PLIF) measurement a frequency-doubled dye laser (LAS LDL2051) with a wavelength pulse energy of approximately 15 mJ at 284 nm was used. The excited fuel aromatics indicate the placement and convection of gaseous fuel. To enable fast switching to OH-LIF at 283.923 nm, and to avoid spectral interference of OH-LIF, the exciting AH laser frequency was tuned to 283.81 nm, which is a gap between OH absorption lines [21]. Additionally, the AH-PLIF signal was spectrally filtered at 354 ± 15 nm and captured by the ICCD camera 1, equipped with a 100 mm UV lens at f/2.8 (Cerco). The incoming laser light with the short wavelength of 284 nm was absorbed gradually and the intensity degraded along the path length. Therefore, the measured UV laser absorption was used to correct the AH-PLIF images for local laser intensity reduced by the UV absorbing fuel [20]. More information about the setup and fluorescent species are mentioned in [20,22,23].
The radiation of the electronically excited OH radical (OH* chemiluminescence) is used as a marker for the reaction zone in space and time. It is captured by camera two (PCO Dicam Pro, S20 photocathode, P46, 1280 by 1024 pixels with two by two binning) with a spectral filter centered at 317 nm ± 10 nm and a 100 mm UV lens (Cerco, f/2.8, Sodern, Limeil-Brevannes, France)).
The detected chemiluminescence on each pixel of the camera chip corresponds to the respective line-of-sight integral over the depth of the combustor primary zone. With the assumption of rotational symmetry in the burner flow field, the chemiluminescence distribution in the central plane can be reconstructed using a simple onion peeling method. This means planar center cut images of the distribution of the chemiluminescence were generated allowing for easier analysis together with the light sheet images. At a working distance of 80 cm, the assumption of a telecentric view was only partially fulfilled. The limited depth of field of the 100 mm UV lens with an aperture ratio f/2.8 causes blurring but no intensity loss of the chemiluminescence signal on the de-convoluted images.
For Mie-scattering, kerosene LIF, and OH-LIF, 100 instantaneous measurements were carried out with a sampling rate of 10 Hz and the time averaged distributions were calculated. During OH concentration measurement, the kerosene LIF signal interferes with the OH-LIF signal. To eliminate this interference, kerosene LIF was detected simultaneously by another camera with a different wavelength band pass filter. Measurements of the chemiluminescence of OH* generate line of sight images. Abel deconvolution was applied to the average of 100 OH* images by assuming axial symmetry of the reaction zone. The laser-induced fluorescence of kerosene predominantly shows the naturally occurring aromatic molecules of the kerosene in their liquid as well as in the gaseous state. Therefore, in addition to fuel distribution, this also shows that the lower boundary of pyrolysis is associated with the destruction of aromatics. The OH concentration in chemical equilibrium on the lean side of stoichiometry is proportional to the temperature [20]. The conversion of OH concentration to temperature could not be performed here due to partially rich mixtures and an overly high intensity of soot luminosity; nevertheless, the signal can be used as an indicator of high temperature zones. Further details of these methods are described by Heinze et al. [20]. Measurements of the flow field, heat release, fuel distribution, and reaction zone in the left half of the central plane of the combustor are presented between the burner outlet and X/D ~ 1. The results are only presented for the switched cases because the neutral case is similar to case M.
3.4. High-Pressure, High-Temperature Combustion Test Facility for Exhaust Gas Analysis under High Pressure Conditions
In order to investigate the fluidic control burner performance, combustion tests for exhaust gas analysis were conducted at the high-pressure and high-temperature combustion test facility at JAXA. A schematic of the experimental set-up is shown in Figure 5. A burner with a fluidic element was mounted on a combustion chamber and placed in high-pressure casing. The height, depth, and length of the combustion chamber were 85 mm, 85 mm, and 150 mm, respectively.
Compressed and electrically preheated air flowed into the combustion chamber through the burner and cooling air holes on the combustion chamber liner, in accordance with their effective open areas, Ae. The Ae of the burner was 52% of the entire combustor. The remaining 48% of air was used as cooling air for the combustion-chamber liner. The Ae of the burner was measured in atmospheric and iso-thermal conditions and slightly changed depending on the bleed air-flow rate. Since the change in Ae was small during the combustion test, the Ae for the no-bleed condition was used for all test conditions. Kerosene fuel was employed for combustion test.
The exhaust gas was sampled for gas analysis at the combustor exit through nine sampling holes placed at equal intervals on a bar-type water-cooled probe. CO, CO2, HC, NOx, and O2 concentrations were determine using a gas analyzer (MEXA-7100D, HORIBA, Kyoto, Japan).
The interior of the combustion chamber was able to be observed visually through glass windows mounted on the side walls of the combustion chamber and high-pressure casing. Direct images of the flame were recorded using a video camera.
The combustion efficiency was calculated from the carbon concentration of the gas analysis results using the following equation:
Here, Hfuel is the net heating value of the fuel (= 42.76 MJ/kg), HCO is the heating value of CO (= 10.10 MJ/kg), MHC is the molecular mass of hydrocarbon (regarded as CH2 = 14.03 g/mol), MCO is the molecular mass of carbon monoxide (= 28.01 g/mol), and [HC], [CO], and [CO2] are the volume concentrations of hydrocarbon, CO, and CO2 in the exhaust sample, respectively.
4. Test Program
Two operating conditions were chosen for optical measurements and exhaust gas analysis under high pressure conditions: Idling at 7% maximum take-off thrust and cruising of a small jet engine with a thrust of approximately 4 tons. Under the idle condition, which was chosen as one of the unstaged conditions, the combustor inlet pressure and temperature were 470 kPa and 503 K, respectively. The burner AFR was equal to 47. The burner air flow rate was calculated using the burner Ae, which was then used with the fuel flow rate to calculate the burner AFR. The burner Δp was 4% of the inlet pressure. The fuel was fed to the pilot stage only. In the exhaust gas analysis test, the air-flow condition was fixed to the idling point and the AFR was varied from 45 to lean blowout (LBO), in order to investigate the effects of AFR on combustion characteristics. For the optical measurements, the AFR was fixed.
The maximum cruise (MCR) point was chosen as one of the staged conditions. At the MCR for the intended jet engine, the combustor inlet pressure and temperature were 1128 kPa and 756 K, respectively. The burner Δp was 4% of the inlet pressure. The burner AFR was equal to 22. In this test, a scaled MCR was used in the optical measurements, with a reduced inlet pressure set to 700 kPa, due to a temporary derating of the infrastructure of the test bed. Therefore, in the exhaust gas analysis test, the inlet pressure was also reduced and set identical to that of the optical measurement. However, in the optical measurement test, 23% of the fuel went to the pilot, which differed from the exhaust gas analysis test because the pilot fuel had to be increased to enhance combustion stability. This was due to the difference in the combustion chambers used in the optical measurement test and the gas analysis test. That is, the single sector at DLR has a greater sector width, height, and length and an additional third window, which needs a higher cooling flow.
In the gas analysis test, to determine an effective fuel staging strategy during cruising, two fueling modes were investigated: Staged and unstaged. In the staged mode, both the pilot and the main fuel were fed, with the pilot fuel set to 10% of the total fuel amount. In the unstaged mode, only the pilot fuel was fed. To facilitate the comparison between gas analysis and optical tests, more than one fuel split would have been desirable; however, because of time constraints, the air-flow condition was fixed and the fuel-flow rate and fueling mode were varied.
In the combustion tests, the pilot and main side-control ports for the fluidic element on the burner were either open or closed according to the state of the shut-off valves placed outside the high-pressure casing. Three operation points of the air-flow split (case P, case N, and case M) were tested. Opening the pilot side control port (case P) increased the pilot air flow. Opening the main side control port (case M) reduced the pilot air flow. When both the pilot and main side control ports were closed (case N), there was no bleed, and the air-flow split was in a neutral position. The amounts of bleed air were 4.2% and 4.9% of the burner air for the idle and cruise conditions, respectively.
5. Air-Distribution Measurement
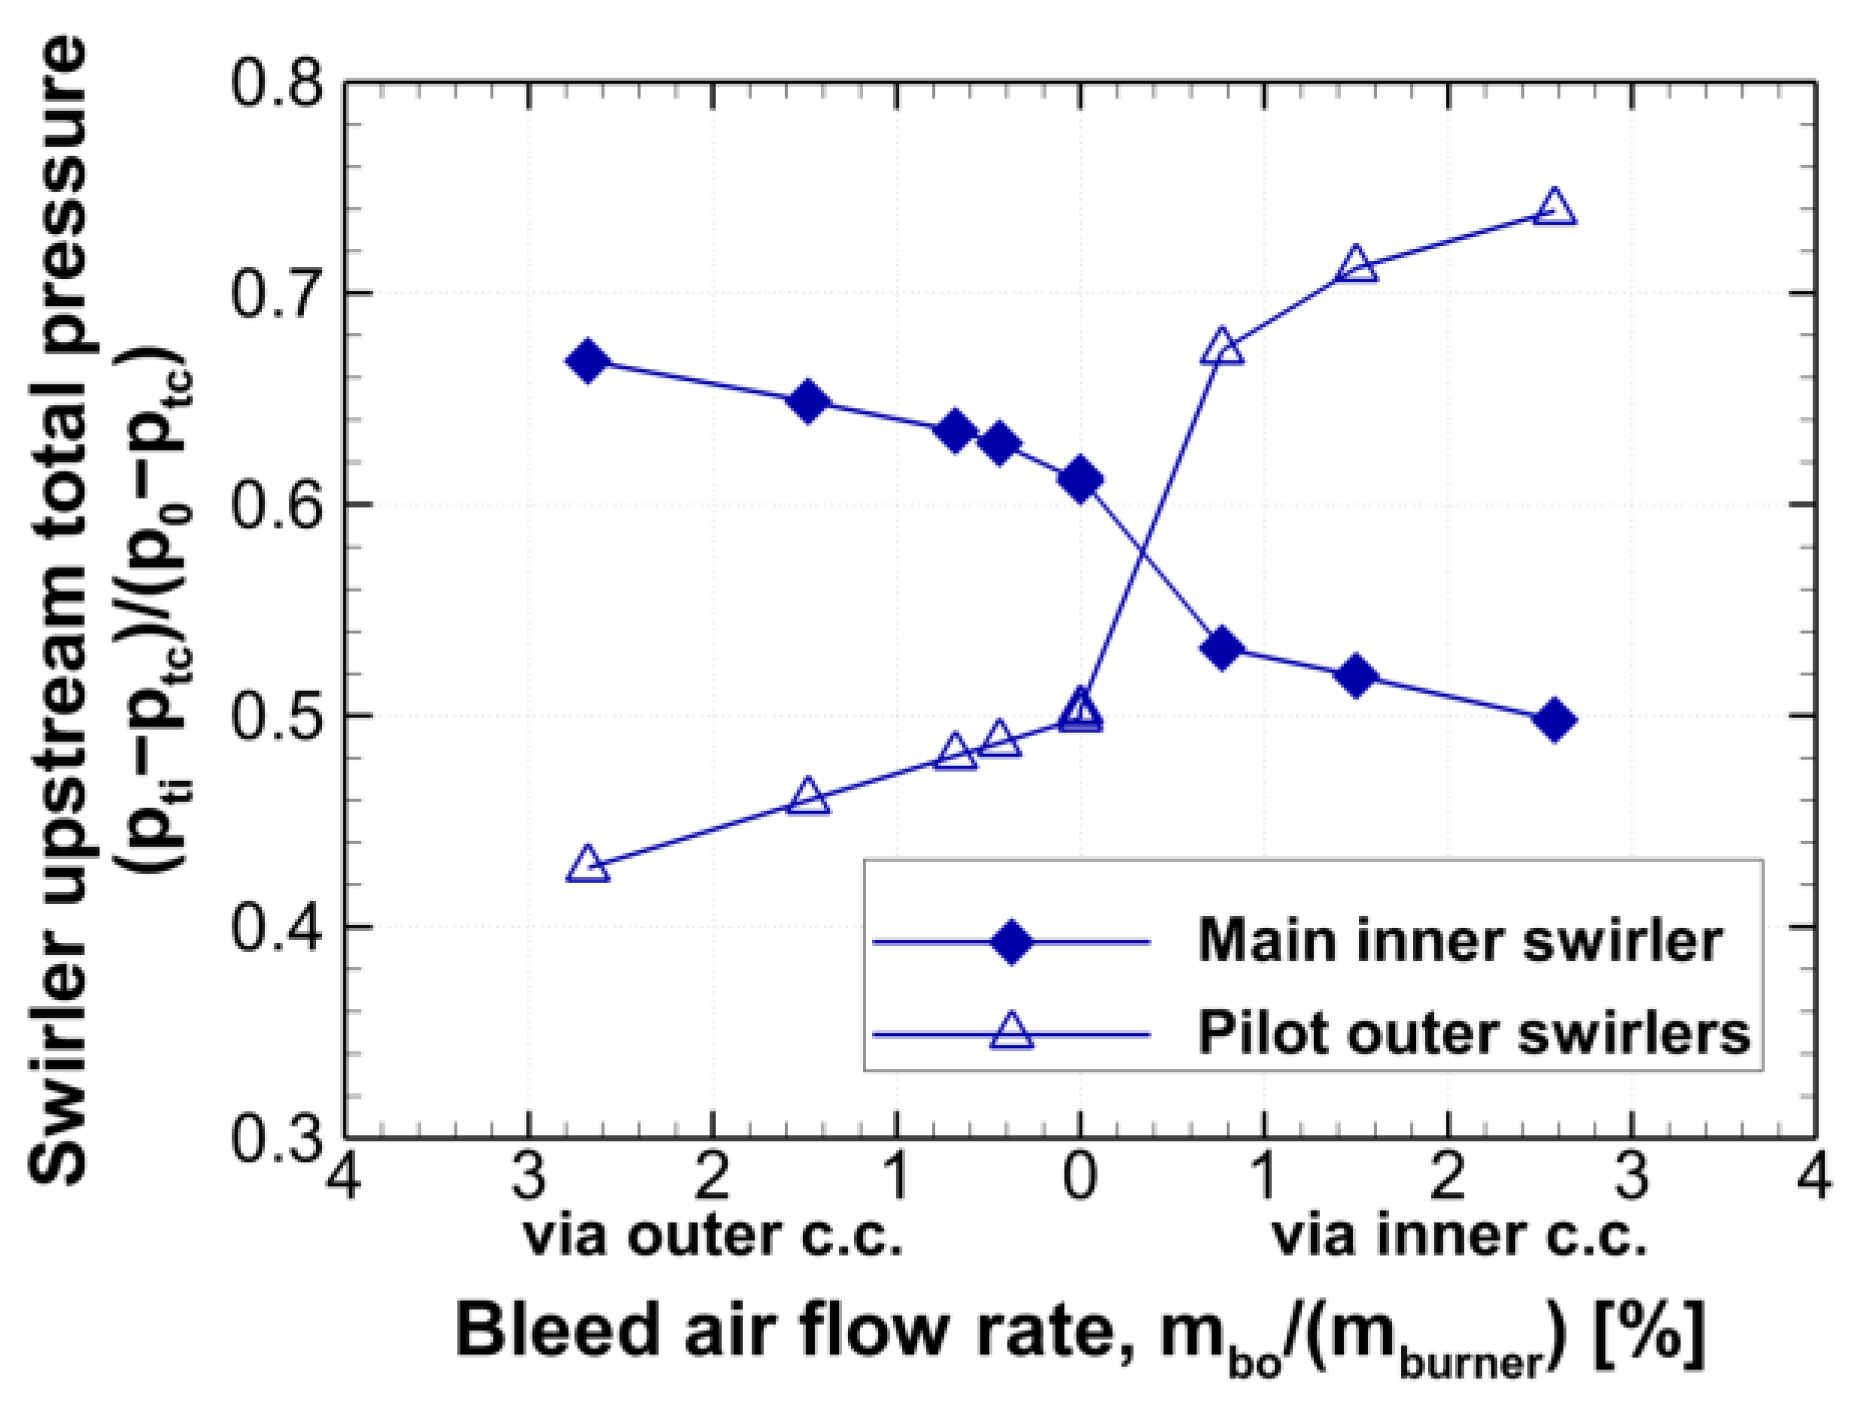
Figure 6 shows the relationship between the ratio of the bleed air-flow rate, mbo, to the total burner air-flow rate, mburner, and Δpi as a ratio to the total pressure drop in the burner, including the fluidic element measured at atmospheric conditions. It should be noted that the ∆pi measured as described in 3.1 represents an approximative value because the effective areas in Table 1 measured without the fluidic element will change slightly once the fluidic element is attached. In the left half of the figure, the bleed air passes through the inner control channel and in the right half it passes through the outer control channel. At the center, there was no bleed and, under this condition (neutral position), Δpi were 50% and 62% for the POS and MIS, respectively. With increasing bleed air through the inner control channel, Δpi for the POS increased and for the MIS decreased. Conversely, with increasing bleed air through the outer control channel, Δpi for the POS decreased and for the MIS increased. The maximum flow rate of the bleed air in this test was 2.6% of the total burner air-flow rate. Consequently, Δpi for the POS changed from 43% to 74% of the total burner pressure drop, including the fluidic element, whereas Δpi for the MIS changed from 50% to 67% according to mbo. This behavior is similar to that of a fluidic amplifier, and the characteristics depend on its geometry [24]. Many studies have been published about planar fluidic amplifiers. More detailed investigation into the characteristics of annular amplifiers, as used in this study, is required to improve their air shift ability and determine the ultimate potential of the technology.
The pilot mixer and MIS air-flow rates depend on their pressure loss. mi was obtained by substituting Δpi into Equation (1). The pilot air-flow rate was 14.5% of mburner in the neutral position and varied from 12.9% to 17.1% depending on the bleed air from the fluidic element. In addition, the air-flow speed in the pilot mixer varied depending on the pilot air-flow rate. In comparison with the nonfluidic burner from which the current burner was derived, the pilot air was reduced because the fluidic element reduces the effective areas of the pilot air streams but not that of the main outer stream (Figure 2). Sn also varied according to the air-flow split. The relationship between the pilot air-flow rate and the burner Sn is shown in Figure 7. The pilot-mixer and MIS rotation directions were identical, but the pilot-mixer swirl intensity was weaker than that of the MIS. As a result, the total burner Sn decreased with increased pilot air. For a vortex valve, adjusting the Sn changes its air-flow rate [12]. In this test, a significant change in mburner with swirl intensity was not observed.
In the gas analysis measurements, the pw values at the fluidic element exits were measured using the same pressure-sensing holes employed in the atmospheric pressure test, and the flow splits were calculated for every test condition. The ratios of the pilot air-flow rate to mburner are listed in Table 3 for each case.
6. Fire Tests
6.1. Idle Condition Results
Figure 8 shows the combustion efficiency obtained under idle conditions. The lower horizontal axis is the burner AFR and the upper horizontal axis indicates air ratio as another way to express fuel concentration. The air ratio is the ratio of the actual burner AFR and the stoichiometric burner AFR, which is the reciprocal of the equivalence ratio. The stoichiometric burner AFR is assumed to be 14.9. When burner air flow is in the neutral position (case N), the ratio of the pilot air-flow rate is 13.9%, from Table 3; thus, the burner AFR of 107 (= 14.9/13.9%) corresponds to the stoichiometry of the pilot stage. According to the lean end of the curves, a significant lean stability extension is observed when the pilot air is successively reduced; therefore, the pilot mixture is enriched. The burner AFR of LBO values are 140, 240, and 300 for cases P, N, and M, respectively. These are considerably higher than those of the respective pilot mass flows. As the reduction of mass flow is also linked to a reduction of pressure loss (Figure 6), LBO is additionally improved in accordance with commonly used LBO correlations [25]. With lower pressure loss, both the velocity and turbulence are decreased, both of which increase the residence time of the mixture in the near stoichiometric regime most suitable for ignition. If the LBO of case M is taken as the characteristic value for steady state LBO of the combustor, it would allow resizing of the burner to a larger pilot flow. When the pilot stage is under fuel-rich conditions; for example, at the nominal pilot AFR of 47, the increased pilot air flow yields higher combustion efficiency because the local equivalence ratio is closer to that of the stoichiometric mixture.
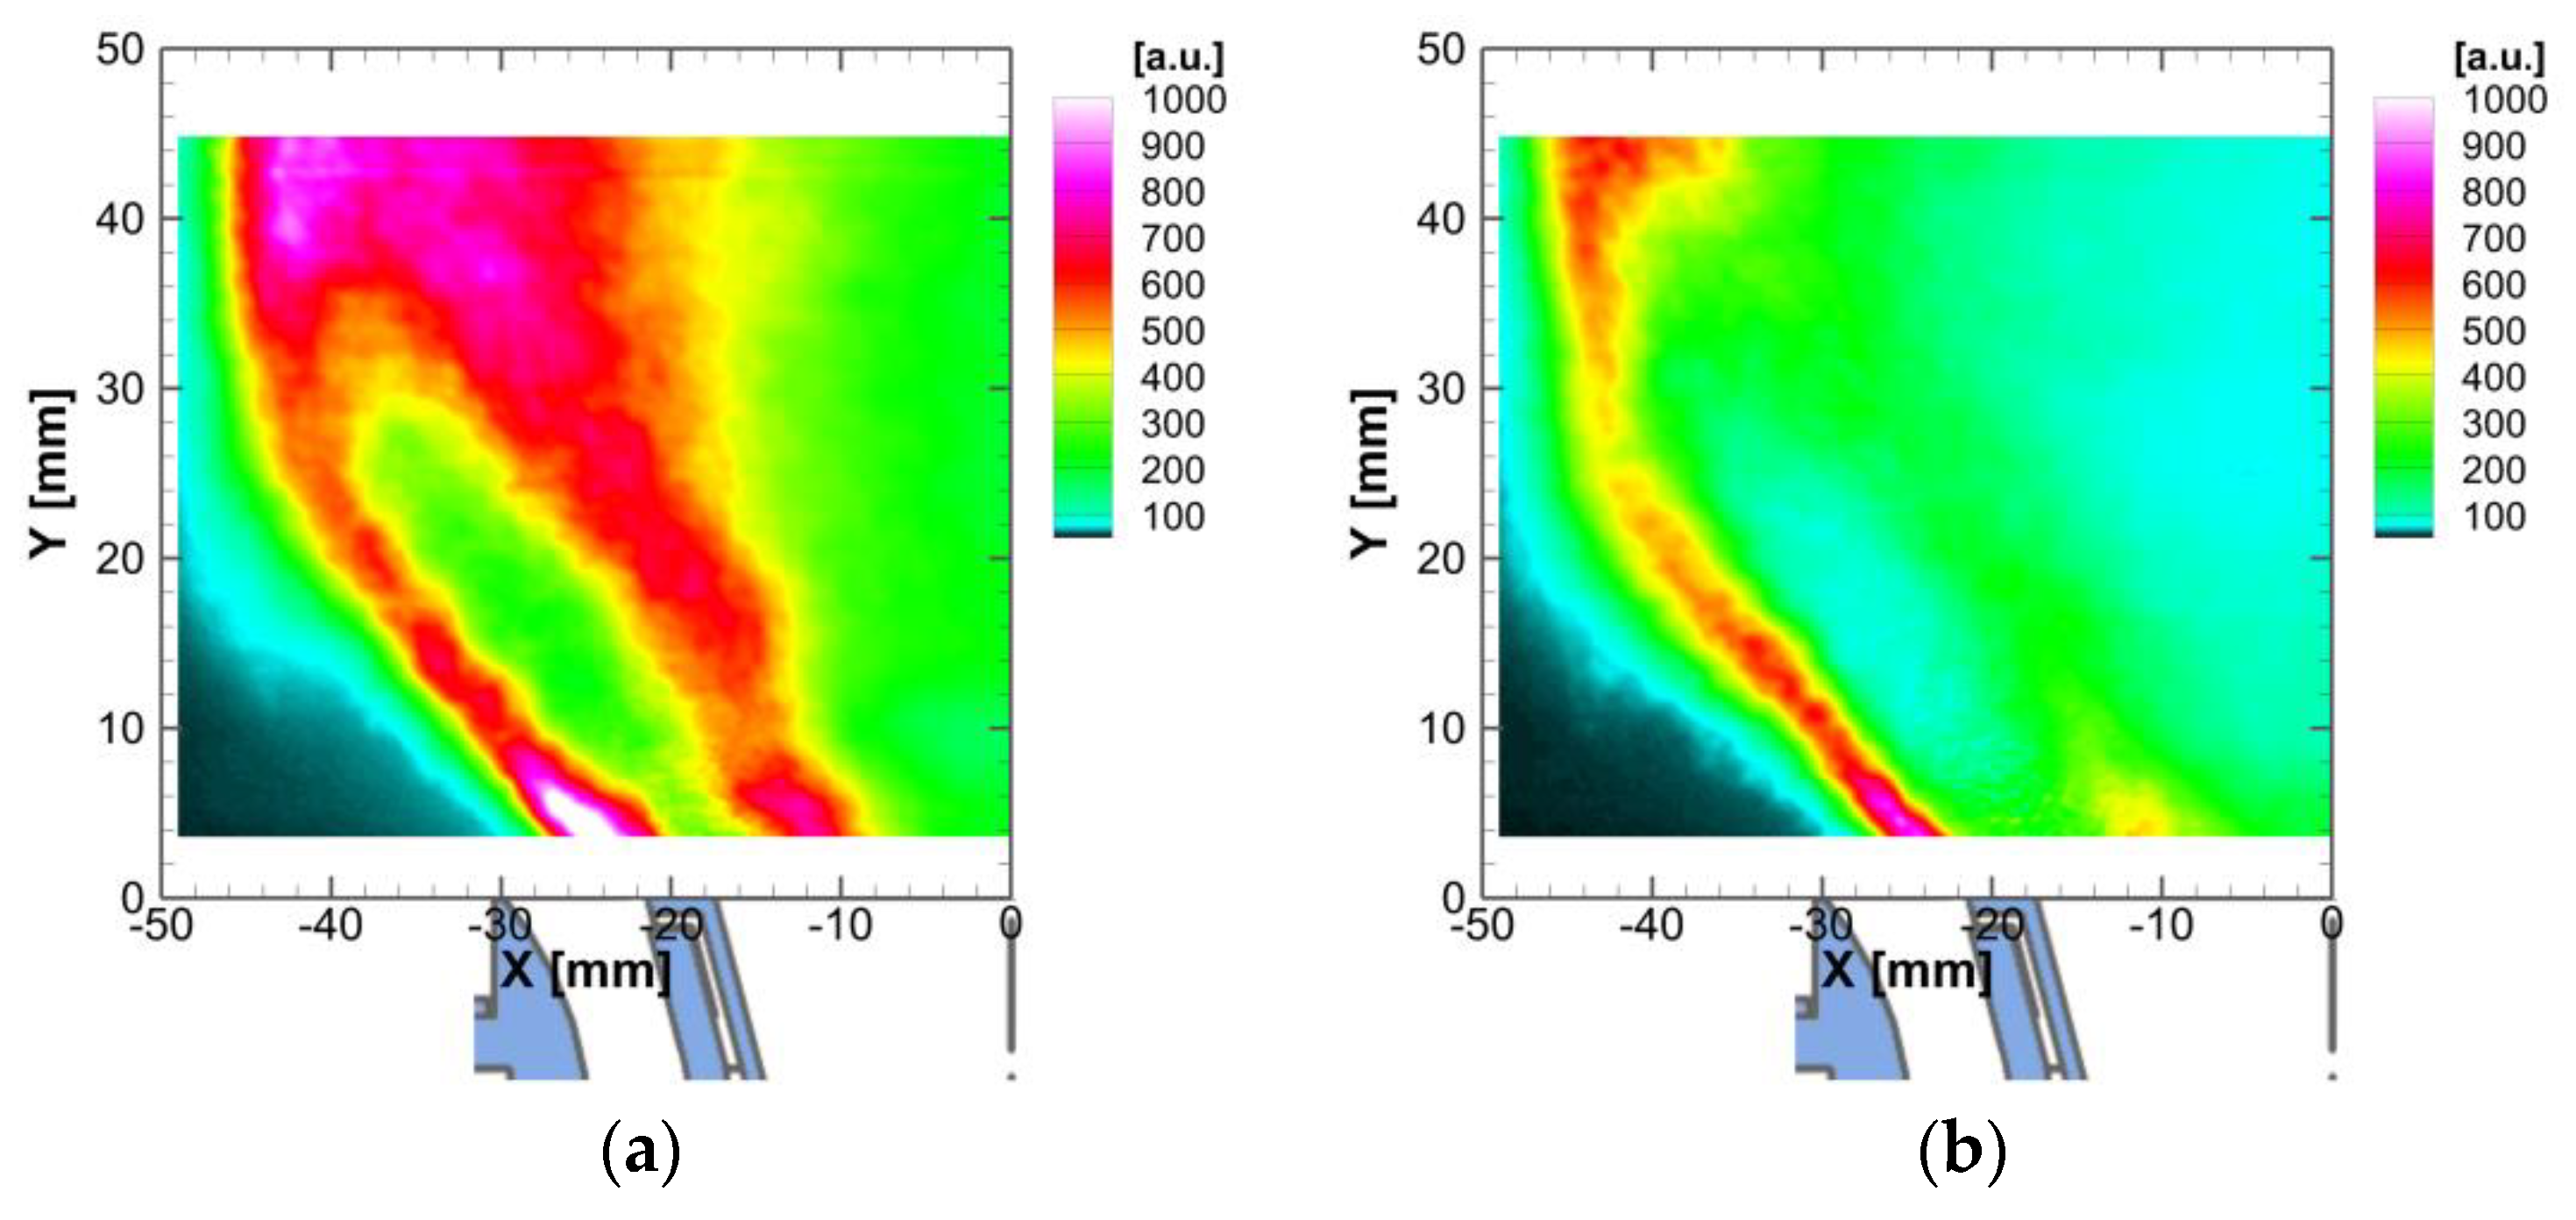
The deconvoluted OH* chemiluminescence under idle conditions is displayed for cases P and M in Figure 9, which indicates that the combustion reaction zones and intensities are approximately proportional to the heat release rate. The intensities near the centerline in Figure 9 are artefacts of the deconvolution algorithm. Although only the pilot is fueled, two reaction zones can be seen in both images. For the rich pilot, case M, most of the reaction with the pilot air occurs in the recess of the burner (Figure 2) and only the remainder is observed near the lower boundary of the measurement at x > −20 mm. The excess fuel is transported by turbulent diffusion to the main flow and oxidized there. The amount of air switched to the pilot generates more heat, which leads to faster ignition and more intense reaction of the fuel entering the main flow. Consequently, the intensity of reaction decreases earlier in case P. The combustor used for the gas analysis is much shorter than that used for the optical measurement. Therefore, it can be concluded that the axial shift in heat release closer to the burner leads indeed to better efficiency of case P.
The air-flow split ratio also affects soot formation. Figure 10 shows the volumetric soot concentrations. Below an AFR of 50, soot forms in all three cases. However, under the nominal condition, the concentration is an order of magnitude lower for case P than for case M. Case M also exhibits soot production for the entire tested AFR range, even at the condition where the pilot is stoichiometric. As the optical test case is limited to the nominal condition, there can be no direct explanation. However, according to the Mie scattering images shown in Figure 11, an extended range of particle scattering from the pilot occurs for case M, represented as bright spots caused by large particles remaining visible even after the averaging procedure in the mean image. The kerosene fluorescence of case M (Figure 12) has an even higher graininess above Y = 20, which indicates greater inhomogeneity of the mixture. Because the kerosene fluorescence overlaps with the OH* chemiluminescence, a comparatively large amount of single droplet burning can be inferred. This is due to the large droplets produced due to the reduced gas velocity around the fuel film during atomization. For spherical flames around the droplets, there should be enough time for soot production during the residence time in the cloud shown in Figure 11b. Hence, remaining soot production is possible even for lean pilot AFRs.
The enhanced lean stability with lower pressure loss in this burner also supports the hypothesis that inhomogeneity enhances lean stability, not only in premixed, but also in diffusion flames, because a higher volume is near stoichiometric. In this case, this additional volume would be produced by the stoichiometric zones of spherical flames around single droplets with lower particle Reynolds numbers.
As mentioned in the introduction, NOx can be a concern even in idle mode, so the NOx emission results are shown in Figure 13. It is clear that NOx emissions increase with high combustion efficiency. However, for a burner AFR of less than 50, NOx emissions remain virtually constant, even when the air-flow split is adjusted, whereas the combustion efficiency and soot emission vary significantly. Furthermore, Figure 14 shows the OH-LIF images for idle conditions. Two separate high temperature zones are observed inside and outside the pilot jet during expansion, as well as a single zone where those two zones merge, generating wall parallel flow. A major difference can be discerned in the way that the main reaction in the merged part of the flow is initiated. In case M, the merged flow is only triggered by the efflux of the outside reaction zone. In contrast, in case P, the inner shell contributes at least as much as the outer shell or more. Under the nominal condition, the larger volume of the hot zone in case P does not lead to higher NOx for two reasons. First, the volume is shifted partly to the zone downstream of the image in case M, albeit with a smaller residence time. Second, the rich AFR for the inner shell of heat release from the pilot lacks oxygen to produce thermal NOx, thereby fulfilling the prerequisite of NOx reduction by rich-lean staging.
Interestingly, the characteristics of the curves in Figure 13 resemble those of fixed geometry partially premixed combustors with ascending mixture homogeneity from M to P [2]. For unstaged combustors, the maximum of those curves would be at stoichiometry. For the JAXA combustor, the maxima exhibit a shift in the rich direction from where the stoichiometric condition of the pilot would be, which in the case of premixing combustion would show the amount of air entrained by the pilot before heat release. Figure 15, which shows the velocity field at idle, visualizes air entrainment, which arises in two ways: By recirculation to the pilot carrying a higher relative amount of main air and by turbulent transport directly after separation between the pilot and main burners and before further heat release. Because the pilot flame is more on the diffusion side and the recirculation zone is rather wide, the first route is the more efficient one. Figure 15 indicates that the influence of the fluidic shift on the overall flow field is small, with the peak of the pilot velocity at X > −20 mm, Y = 4 mm being diffused at approximately y = 20 mm.
On the lean side of the maxima in Figure 12, the lower overall peak temperatures lead to less NOx; however, the curve for case M is almost flat. Similar to the soot results, heterogeneous combustion with single droplet burning in the stoichiometric range may be one reason for the remaining NOx production at the lean end.
6.2. Scaled Cruise Condition Results
Figure 16 shows the combustion efficiency results, where unfilled symbols indicate the staged-mode results and solid symbols indicate the unstaged mode results. In the unstaged mode, the pilot stage was fuel rich. In this condition, excessive fuel reduces the combustion efficiency, whereas increased pilot air flow results in improved combustion efficiency. This is similar to the behavior under the idle condition. For the staged mode, the combustion efficiency decreases with increased AFR. In this mode, the local AFRs of the pilot and main stages are lean. In the lean pilot case, reduction of the pilot air flow results in a pilot stage equivalence ratio that is closer to the stoichiometric equivalence ratio than in the enlarged pilot case and an increased pilot stage temperature. This leads to more intense combustion in the main stage and increases the combustion efficiency. With reduced AFR, the difference in combustion efficiencies becomes small and, at an AFR of 20, these values are virtually identical. Consequently, for the 10% fuel flow setting to the pilot, a combination of reduced pilot air flow for the staged mode and increased pilot air flow for the unstaged mode yields optimal performance in terms of combustion efficiency.
The optical tests were conducted with a higher fuel split to the pilot, which results in a pilot AFR that is close to stoichiometry for the three cases. However, according to Figure 17, due to entrainment, the heat release occurs at leaner conditions; thus, the pilot is lean for case P and near stoichiometric for case M. The deconvoluted OH* chemiluminescence under fuel staged cruise conditions is shown in Figure 17. Differences in the heat release between case P and M are not as clear as those in the idle condition. However, for both the pilot and main burner, the peak intensity is higher in case M. This is intuitive for the pilot burner due to its near stoichiometric mixture. With the same reasoning, the opposite should be true for the main burner in case M; however, this is not the case. This is because more intense piloting leads to higher heat release early in the main flame. However, according to Figure 16, a saturation effect with respect to air staging appears at AFR 20 for the lower pilot fuel split.
These findings are further supported by the OH-LIF distributions of the high temperature zones in Figure 18. As for the deconvoluted OH*, the differences between case P and M are not as great under cruise conditions. There is no separate maximum in the pilot burner but a higher OH intensity in the main burner. In general, the OH peak intensity is higher in case M, although the global mean AFR of the main flow is leaner. The OH intensity for the overall lean main stream at the side near the laser entry, which is less affected by absorption, results in the intensity being linked to temperature; i.e., the peak temperatures in case M are higher than those in case P. More efficient piloting leads to earlier reaction of the main fuel. According to the progression of main fuel stream mixing before the lifted main flame, an earlier heat release also leads to locally richer combustion and both effects lead to higher temperatures (Figure 18). This overcompensates for the global effect of the shift of air to the main burner by the fluidic valve. With respect to staging, it can extend the staged operation with an enriched pilot, even with taking fuel from the main burner.
Figure 19 shows the soot concentration in the exhaust gas. In the fuel staged mode, virtually no soot is expelled. Note that, in this fueling mode, both the pilot and main stages were operated with lean AFR at their respective swirler outlets. In the unstaged mode, at an AFR of 27 or less, a large amount of soot is produced. Compared with the idle condition seen in Figure 10, soot production is shifted in the rich direction to AFR 30 despite the higher pressure and preheating temperature, which for gaseous fuels normally leads to higher soot production. The trend of lower soot production with higher preheating has often been seen with liquid fuels [26]; here, the temperature rise outweighs the pressure effect. The effect of higher preheating with constant pressure loss on the liquid phase is an improved atomization with higher velocity and lower surface tension leading to faster vaporization. Because better atomization is beneficial, the higher pilot velocity of case P is again beneficial, similar to that under idle conditions, except for the richest point. As pilot burning is predominantly hidden in the recess, no easy explanation can be offered for this observation. These results indicate that soot emission in the unstaged mode above an AFR of 31 can be reduced by increasing the pilot air flow with the fluidic valve. Conversely, at an AFR of 27 or less, a large amount of soot is produced, even with increased pilot air flow, which requires the fueling mode to be switched to the staged mode in order to reduce soot emissions. However, the staged-mode combustion efficiency at an AFR of 25 is poor, even when the pilot air flow is reduced. Consequently, a gap exists between the AFRs of the fueling mode switch-over point in terms of combustion efficiency and soot emission. This indicates that it is possible to improve the combustor performance by adjusting the air-flow split control; however, this optimization is not perfect.
Figure 20 shows the NOx emission indexes of staged and unstaged modes for cruise conditions. For the staged mode, reduced pilot air flow leads to higher NOx emissions. Thus, high combustion efficiency results in high NOx emissions. However, unlike the combustion efficiency, the difference in NOx emissions between the air-flow split ratios increases with decreasing AFR. In the unstaged mode, more NOx is produced with a reduced pilot air flow. This means that the combustion efficiency is higher for increased pilot air flow; however, the emissions are lower than those under reduced pilot air flow conditions. Nevertheless, above AFR 30, there is no penalty in combustion efficiency for case P.
Finally, Figure 21 shows actual images of the flame for cases P and M at an AFR of 22.5 in staged mode. The main flames do not appear to be different, which further indicates saturation of the piloting in form of equal flame lifts at this point. In case M, a sooting pilot flame can be seen outside the pilot recess, which is not observed in case P. However, according to the gas analysis, all soot is burned at the combustor outlet. The reaction of the pilot stage is completed in the pilot recess in case P. The jet speed from the pilot mixer is slower in case M, but the pilot flame length is wider.
7. Discussion and Conclusions
First, the results from different load points are discussed and conclusions are drawn on the current design. Then, future research directions are suggested. The results indicate that the fluidic element consumes some part of the pressure loss of the burner and thus reduces the pressure loss of the fuel mixer. With the outer main swirler not being throttled, it also reduces the relative amount of pilot air of the burner upscaled from the TechClean burner. Therefore, an increase of the LBO value can be expected. As the distribution of LBO values in the different positions is greater than that of the relative variation in air flow, with case M showing a greater difference than case N, the enhancement of steady state LBO by reducing the pressure loss is, in contrast to other operating points, a nonlinear positive effect. This could be more systematically exploited by, for example, allowing more bleed in the critical operating point. A more straightforward conclusion is that the pilot air for case N could be resized to approximately 20% without loss of stability.
Having enlarged the pilot, the additional benefit of switching to case P would likely increase the combustion efficiency to above 99% without soot. As it is closer to stoichiometry, switching between P and N, or merely reducing the bleed, can help enlarge the rather small window between soot development and high NOx emissions under sub ICAO-idle conditions. At the 30% load point, which was not investigated here due to program limitations, the combination of a larger pilot and air switching would offer the potential to curb smoke emissions to a level acceptable for the ICAO cycle.
Under the nominal cruise condition, the performance was adequate when switching to case P. The problem with respect to a typical flight mission is the extension of staged operation to higher AFRs. Here, a combined approach of switching pilot fuel and air could be beneficial. The optical analysis showed that the dominant control on combustor performance is changes to the degree of piloting with the effect of varying flame lift of the main burner, which in turn influences the degree of premixing and stability. However, the sharp drop of staged efficiency from AFR 20 to 22 for all positions shows that the limitation of efficiency is specific to the pairing of the combustor and burner with a high dependence on the mean combustion temperature. Typically for lean combustors, some efficiency is lost by wall quenching and more combustor volume might be required to satisfy the criterion. On take-off, the switch can again be used to limit NOx emissions with results similar to those of AFR 20 in cruise mode.
The results for case M exhibit deficits in fuel preparation and small-scale mixing, which are undesirable outside of the near LBO range. This is one of the disadvantages of this technology. Flow variability is balanced against mixing energy. The air-flow speed at the fuel injection point affects the atomization performance [23] and slower air speed leads to increasing drop sizes. The lower velocity level at the combustor entrance will also lower the amount of turbulent energy for mixing fuel and air during and after fuel vaporization. According to the pressure loss measurements for the swirler under atmospheric conditions, a 50% increase would be required to achieve a commonly accepted minimum. Thus, either the overall pressure loss is increased to the detriment of engine efficiency or the fluidic valve needs to gain efficiency. As mentioned, design rules for realistic switches are lacking; therefore, in order to integrate the fluidic valve and burner, further investigations are required at a lower technology readiness level. Because it is always the pilot making the change in the flow field, a fluidic valve that takes less main air could also be considered.
Another drawback of this technology is the necessity for the bleed air to control the air flow. Because the bleed is extracted behind the compressor, the compressor consumes additional power to compress additional air for the bleed. One way around this involves using bi-stable switches, leading to a higher development costs. Another way to mitigate this drawback is the effective use of bleed air. For example, the bleed air could be used to cool the turbine blades. In this case, the pressure drop of the bleed air flow passage must be considered, because if the pressure drop is too high, the bleed air cannot be used for turbine blade cooling. Reducing the amount of required bleed air could also effectively solve this limitation. This would reduce not only the additional power for the compressor but also the pressure drop of the bleed air flow passage.
Author Contributions
Investigation, S.Y., J.H. and M.S.; Writing—Original Draft Preparation, S.Y. and C.H.; Writing—Review & Editing, S.Y. and C.H.; Supervision, C.H. and T.Y.
Funding
This research received no external funding.
Acknowledgments
The authors would like to acknowledge the support of Kazuo Shimodaira, ex-senior researcher of JAXA, during the gas analysis tests.
Conflicts of Interest
The authors declare no conflict of interest.
References
- Smith, K.O.; Blust, J. Combustion instabilities in industrial gas turbines: Solar turbines’ experience. In Combustion Instabilities in Gas Turbine Engines; Lieuwen, T.C., Yang, V., Eds.; American Institute of Aeronautics and Astronautics: Reston, VA, USA, 2005; pp. 29–41. [Google Scholar]
- Hassa, C. Partially premixed and premixed aero engine combustors. In Gas Turbine Emissions; Lieuwen, T.C., Yang, V., Eds.; Cambridge University Press: New York, NY, USA, 2013; pp. 237–289. [Google Scholar]
- Yamamoto, T.; Shimodaira, K.; Yoshida, S.; Kurosawa, Y. Emission reduction of fuel staged aircraft engine combustor using an additional premixed fuel nozzle. In Proceedings of the ASME Turbo Expo 2012: Turbine Technical Conference and Exposition (GT 2012-68590), Copenhagen, Denmark, 11–15 June 2012. [Google Scholar]
- Aoyama, K.; Mandai, S. Development of a dry low NOx combustor for a 120-MW gas turbine. J. Eng. Gas Turbines Power 1984, 106, 795–800. [Google Scholar] [CrossRef]
- Fiorentino, A.J.; Greene, W.; Kim, J.C.; Mularz, E.J. Variable Geometry, Lean, Premixed, Prevaporized Fuel Combustor Conceptual Design Study. In Proceedings of the ASME 1980 International Gas Turbine Conference and Products Show (GT 1980-16), New Orleans, LA, USA, 10–13 March 1980. [Google Scholar]
- Foster, K.; Parker, G.A. Fluidics: Components and Circuits; Wiley-Interscience: London, UK, 1970. [Google Scholar]
- Gerrard, A.J. Combustion Chambers for Gas Turbine Engines. U.S. Patent US3593518A, 20 July 1971. [Google Scholar]
- Adkins, R.C. Control of Airflow in Combustion Chambers by Variable RRate Diffuser. UK Patent GB1581531A, 17 December 1980. [Google Scholar]
- Tilston, J.R.; Austin, J. Combustor Flow Controller for Gas Turbine. U.S. Patent US6389798B1, 21 May 2002. [Google Scholar]
- Tseng, R.R.; Zupanc, F.J. Gas Turbine Engine Combustor with Fluidic Control of Swirlers. U.S. Patent Application US2015/0040572A1, 12 February 2015. [Google Scholar]
- Sun, F.; Lin, R.S.; Haas, M.; Brogan, T. Air flow control by fluidic diverter for low NOx jet engine combustion. In Proceedings of the 1st Flow Control Conference (AIAA 2002–2945), St. Louis, MO, USA, 24–26 June 2002. [Google Scholar]
- Brundish, K.D.; Wilson, C.W. Improved combustion mixture control using a novel fuel injector. In Proceedings of the ASME Turbo Expo 2001: Power for Land, Sea, and Air (2001-GT-0046), New Orleans, LA, USA, 4–7 June 2001. [Google Scholar]
- Yoshida, S.; Yamamoto, T.; Kurosawa, Y.; Shimodaira, K. Air flow control on high pressure combustion test by fluidic diverter for air blast fuel nozzle. In Proceedings of the Asian Joint Conference on Propulsion and Power 2010 (AJCPP2010-120), Miyazaki, Japan, 4–6 March 2010; pp. 446–451. [Google Scholar]
- International Civil Aviation Organization. International Standards and Recommended Practices Annex 16 Environmental Protection Volume 2 Aircraft Engine Emissions, 3rd ed.; International Civil Aviation Organization: Montréal, QC, Canada, 2008. [Google Scholar]
- Yamamoto, T.; Shimodaira, K.; Kurosawa, K.; Mastuura, K.; Iino, J.; Yoshida, S. Research and development of staging fuel nozzle for aeroengine. In Proceedings of the ASME Turbo Expo 2009: Power for Land, Sea, and Air (GT2009-59852), Orlando, FL, USA, 8–12 June 2009. [Google Scholar]
- Yoshida, S.; Schneider, D.; Hassa, C. Effects of Fluidic Control of Air-Flow Distribution on Staged Lean Jet Engine Burner. In Proceedings of the ASME Turbo Expo 2016: Turbomachinery Technical Conference and Exposition (GT2016-57453), Seoul, Korea, 13–17 June 2016. [Google Scholar]
- Hassa, C.; Yoshida, S.; Schneider, D.; Lange, L. Evaluation of the influence of fluidic control on air flow distribution and fuel split variation of a staged lean jet engine burner at idle and cruise condition. In Proceedings of the 22nd ISABE Conference (ISABE-2015-20204), Phoenix, AZ, USA, 25–30 October 2015. [Google Scholar]
- DLR Institute of Propulsion Technology. Available online: https://www.dlr.de/at/en/desktopdefault.aspx/tabid-1508/2441_read-3807/ (accessed on 24 February 2019).
- Schroll, M.; Klinner, J.; Lange, L.; Willert, C. Particle image velocimetry of highly luminescent, pressurized combustion flows of aero engine combustors. In Proceedings of the 10th International Symposium on particle image velocimetry (A112), Delft, The Netherlands, 2–4 July 2013. [Google Scholar]
- Heinze, J.; Meier, U.; Behrendt, T.; Willert, C.; Geigle, K.P.; Lammel, O.; Lückerath, R. PLIF thermometry based on measurements of absolute concentrations of the OH radical. Z. Phys. Chem. 2011, 225, 1315–1341. [Google Scholar] [CrossRef]
- Atakan, B.; Heinze, J.; Meier, U. OH Laser-induced Fluorescence at High Pressures: Spectroscopic and Two-dimensional Measurements Exciting the A–X (1,0) Transition. Appl. Phys. B Lasers Opt. 1997, 64, 585–591. [Google Scholar] [CrossRef]
- Grisch, F.; Orain, M.; Jourdanneau, E.; Guin, C. Simultaneous Equivalence Ratio and Flame Structure Measurements in Multipoint Injectors Using PLIF. In Proceedings of the 44th AIAA/ASME/SAE/ASEE Joint Propulsion Conference & Exhibit (AIAA 2008-4868), Hartford, CT, USA, 21–23 July 2008. [Google Scholar]
- Orain, M.; Baranger, P.; Ledier, C.; Apeloig, J.; Grisch, F. Fluorescence spectroscopy of kerosene vapour at high temperatures and pressures: Potential for gas turbines measurements. Appl. Phys. B 2014, 116, 729–745. [Google Scholar] [CrossRef]
- Kirshner, J.M.; Katz, S. Design Theory of Fluidic Components; Academic Press: New York, NY, USA, 1957. [Google Scholar]
- Lefebvre, A.H.; Ballal, D.R. Fuel injection In Gas Turbine Combustion: Alternative Fuels and Emissions, 3rd ed.; CRC Press: Boca Raton, FL, USA, 2010. [Google Scholar]
- Meier, U.; Hassa, C.; Geigle, K.P.; Lammel, O.; Kutne, P. Parametric Study of Soot Formation in an Aeroengine Model Combustor at Elevated Pressures by Laser-Induced Incandescence, Effect of the Fuel Phase. In Proceedings of the First CEAS European Air and Space Conference, Berlin, Germany, 10–13 September 2007; pp. 407–417. [Google Scholar]
Figure 1.
Schematic of the fluidic element used in this study. (Copyright by ASME—“Effects of Fluidic Control of Air-Flow Distribution on Staged Lean Jet Engine Burner,” by Yoshida, Schneider, Hassa, Paper No: GT2016-57453).
Figure 1.
Schematic of the fluidic element used in this study. (Copyright by ASME—“Effects of Fluidic Control of Air-Flow Distribution on Staged Lean Jet Engine Burner,” by Yoshida, Schneider, Hassa, Paper No: GT2016-57453).

Figure 2.
Lean staged burner with the fluidic element. (Copyright by ASME—“Effects of Fluidic Control of Air-Flow Distribution on Staged Lean Jet Engine Burner,” by Yoshida, Schneider, Hassa, Paper No: GT2016-57453).
Figure 2.
Lean staged burner with the fluidic element. (Copyright by ASME—“Effects of Fluidic Control of Air-Flow Distribution on Staged Lean Jet Engine Burner,” by Yoshida, Schneider, Hassa, Paper No: GT2016-57453).

Figure 3.
Experimental arrangement used for air-distribution measurement. (Copyright by ASME—“Effects of Fluidic Control of Air-Flow Distribution on Staged Lean Jet Engine Burner,” by Yoshida, Schneider, Hassa, Paper No: GT2016-57453).
Figure 3.
Experimental arrangement used for air-distribution measurement. (Copyright by ASME—“Effects of Fluidic Control of Air-Flow Distribution on Staged Lean Jet Engine Burner,” by Yoshida, Schneider, Hassa, Paper No: GT2016-57453).

Figure 4.
Schematic of the single sector combustor used for optical measurements.

Figure 5.
Experimental arrangement used for exhaust gas analysis. (Copyright by ASME—“Effects of Fluidic Control of Air-Flow Distribution on Staged Lean Jet Engine Burner,” by Yoshida, Schneider, Hassa, Paper No: GT2016-57453).
Figure 5.
Experimental arrangement used for exhaust gas analysis. (Copyright by ASME—“Effects of Fluidic Control of Air-Flow Distribution on Staged Lean Jet Engine Burner,” by Yoshida, Schneider, Hassa, Paper No: GT2016-57453).

Figure 6.
Swirler pressure loss in the burner containing the fluidic element. (Copyright by ASME—“Effects of Fluidic Control of Air-Flow Distribution on Staged Lean Jet Engine Burner,” by Yoshida, Schneider, Hassa, Paper No: GT2016-57453).
Figure 6.
Swirler pressure loss in the burner containing the fluidic element. (Copyright by ASME—“Effects of Fluidic Control of Air-Flow Distribution on Staged Lean Jet Engine Burner,” by Yoshida, Schneider, Hassa, Paper No: GT2016-57453).

Figure 7.
Relationship between burner swirl number and pilot air-flow rate. (Copyright by ASME—“Effects of Fluidic Control of Air-Flow Distribution on Staged Lean Jet Engine Burner,” by Yoshida, Schneider, Hassa, Paper No: GT2016-57453).
Figure 7.
Relationship between burner swirl number and pilot air-flow rate. (Copyright by ASME—“Effects of Fluidic Control of Air-Flow Distribution on Staged Lean Jet Engine Burner,” by Yoshida, Schneider, Hassa, Paper No: GT2016-57453).

Figure 8.
Combustion efficiency under idling conditions. (Copyright by ASME—“Effects of Fluidic Control of Air-Flow Distribution on Staged Lean Jet Engine Burner,” by Yoshida, Schneider, Hassa, Paper No: GT2016-57453).
Figure 8.
Combustion efficiency under idling conditions. (Copyright by ASME—“Effects of Fluidic Control of Air-Flow Distribution on Staged Lean Jet Engine Burner,” by Yoshida, Schneider, Hassa, Paper No: GT2016-57453).

Figure 9.
Deconvoluted OH* distribution under idle conditions: (a) case P and (b) case M. (Illustration of the burner exit section is superimposed beneath the horizontal axis).
Figure 9.
Deconvoluted OH* distribution under idle conditions: (a) case P and (b) case M. (Illustration of the burner exit section is superimposed beneath the horizontal axis).

Figure 10.
Soot concentration under idling conditions. (Copyright by ASME—“Effects of Fluidic Control of Air-Flow Distribution on Staged Lean Jet Engine Burner,” by Yoshida, Schneider, Hassa, Paper No: GT2016-57453).
Figure 10.
Soot concentration under idling conditions. (Copyright by ASME—“Effects of Fluidic Control of Air-Flow Distribution on Staged Lean Jet Engine Burner,” by Yoshida, Schneider, Hassa, Paper No: GT2016-57453).

Figure 11.
Distributions of Mie-scattering under idle conditions: (a) case P and (b) case M. (Illustration of the burner exit section is superimposed beneath the horizontal axis).
Figure 11.
Distributions of Mie-scattering under idle conditions: (a) case P and (b) case M. (Illustration of the burner exit section is superimposed beneath the horizontal axis).

Figure 12.
Distributions of kerosene fluorescence at idle condition: (a) case P; (b) case M. (Illustration of the burner exit section is superimposed beneath the horizontal axis).
Figure 12.
Distributions of kerosene fluorescence at idle condition: (a) case P; (b) case M. (Illustration of the burner exit section is superimposed beneath the horizontal axis).

Figure 13.
NOx emission index under idling conditions. (Copyright by ASME—“Effects of Fluidic Control of Air-Flow Distribution on Staged Lean Jet Engine Burner,” by Yoshida, Schneider, Hassa, Paper No: GT2016-57453).
Figure 13.
NOx emission index under idling conditions. (Copyright by ASME—“Effects of Fluidic Control of Air-Flow Distribution on Staged Lean Jet Engine Burner,” by Yoshida, Schneider, Hassa, Paper No: GT2016-57453).

Figure 14.
OH-LIF distribution under idle conditions: (a) case P and (b) case M. (Illustration of the burner exit section is superimposed beneath the horizontal axis).
Figure 14.
OH-LIF distribution under idle conditions: (a) case P and (b) case M. (Illustration of the burner exit section is superimposed beneath the horizontal axis).

Figure 15.
Velocity field under idle condition: (a) case P and (b) case M. (Illustration of the burner exit section is superimposed beneath the horizontal axis).
Figure 15.
Velocity field under idle condition: (a) case P and (b) case M. (Illustration of the burner exit section is superimposed beneath the horizontal axis).

Figure 16.
Combustion efficiency under cruising conditions. (Copyright by ASME—“Effects of Fluidic Control of Air-Flow Distribution on Staged Lean Jet Engine Burner,” by Yoshida, Schneider, Hassa, Paper No: GT2016-57453).
Figure 16.
Combustion efficiency under cruising conditions. (Copyright by ASME—“Effects of Fluidic Control of Air-Flow Distribution on Staged Lean Jet Engine Burner,” by Yoshida, Schneider, Hassa, Paper No: GT2016-57453).

Figure 17.
Deconvoluted OH* distribution under cruise conditions: (a) case P and (b) case M. (Illustration of the burner exit section is superimposed beneath the horizontal axis).
Figure 17.
Deconvoluted OH* distribution under cruise conditions: (a) case P and (b) case M. (Illustration of the burner exit section is superimposed beneath the horizontal axis).

Figure 18.
OH-LIF distribution under cruise conditions: (a) case P and (b) case M. (Illustration of the burner exit section is superimposed beneath the horizontal axis).
Figure 18.
OH-LIF distribution under cruise conditions: (a) case P and (b) case M. (Illustration of the burner exit section is superimposed beneath the horizontal axis).

Figure 19.
Soot concentration under cruising conditions. (Copyright by ASME—“Effects of Fluidic Control of Air-Flow Distribution on Staged Lean Jet Engine Burner,” by Yoshida, Schneider, Hassa, Paper No: GT2016-57453).
Figure 19.
Soot concentration under cruising conditions. (Copyright by ASME—“Effects of Fluidic Control of Air-Flow Distribution on Staged Lean Jet Engine Burner,” by Yoshida, Schneider, Hassa, Paper No: GT2016-57453).

Figure 20.
NOx emission index under cruising conditions. (Copyright by ASME—“Effects of Fluidic Control of Air-Flow Distribution on Staged Lean Jet Engine Burner,” by Yoshida, Schneider, Hassa, Paper No: GT2016-57453).
Figure 20.
NOx emission index under cruising conditions. (Copyright by ASME—“Effects of Fluidic Control of Air-Flow Distribution on Staged Lean Jet Engine Burner,” by Yoshida, Schneider, Hassa, Paper No: GT2016-57453).

Figure 21.
Actual images of the flame under cruising conditions and in staged mode: (a) case P and (b) case M.
Figure 21.
Actual images of the flame under cruising conditions and in staged mode: (a) case P and (b) case M.


Table 1.
Swirler effective and geometric open areas (mm2). (Copyright by ASME—“Effects of Fluidic Control of Air-Flow Distribution on Staged Lean Jet Engine Burner,” by Yoshida, Schneider, Hassa, Paper No: GT2016-57453).
Table 1.
Swirler effective and geometric open areas (mm2). (Copyright by ASME—“Effects of Fluidic Control of Air-Flow Distribution on Staged Lean Jet Engine Burner,” by Yoshida, Schneider, Hassa, Paper No: GT2016-57453).
| MOMS | MIS | POS | PIS | |
|---|---|---|---|---|
| Effective open area | 300 | 261 | 95 | 26 |
| Geometric open area | 789 | 753 | 352 | 120 |
MOMS: Main outer and main middle swirler; MIS: Main inner swirler; POS: Pilot outer swirler; PIS: Pilot inner swirler.
Table 2.
Summary of applied optical techniques.
| Measured Quantities | Measurement Techniques | Laser Wavelength | Captured Wavelength |
|---|---|---|---|
| Flow field | PIV | 532 nm | 532 ± 3 nm |
| Fuel distribution, liquid phase | Mie-scattering | 532 nm | 532 ± 3 nm |
| Fuel distribution, gaseous and liquid | Laser-induced fluorescence of kerosene | 284 nm | 354 ± 15 nm |
| OH concentration | Laser-induced fluorescence of OH | 284 nm | 317 ± 10 nm |
| Heat release | OH* chemiluminescence | 317 ± 10 nm |
Table 3.
Pilot air-flow rate relative to burner air-flow rate in the combustion tests. (Copyright by ASME—“Effects of Fluidic Control of Air-Flow Distribution on Staged Lean Jet Engine Burner,” by Yoshida, Schneider, Hassa, Paper No: GT2016-57453).
Table 3.
Pilot air-flow rate relative to burner air-flow rate in the combustion tests. (Copyright by ASME—“Effects of Fluidic Control of Air-Flow Distribution on Staged Lean Jet Engine Burner,” by Yoshida, Schneider, Hassa, Paper No: GT2016-57453).
| Case | Idle | MCR |
|---|---|---|
| P | 17.0% | 17.1% |
| N | 13.9% | 14.2% |
| M | 11.6% | 11.6% |
© 2019 by the authors. Licensee MDPI, Basel, Switzerland. This article is an open access article distributed under the terms and conditions of the Creative Commons Attribution (CC BY) license (http://creativecommons.org/licenses/by/4.0/).
Share and Cite
MDPI and ACS Style
Yoshida, S.; Hassa, C.; Yamamoto, T.; Heinze, J.; Schroll, M. Influence of Fluidic Control in a Staged Lean Jet Engine Burner on Combustor Performance. Fluids 2019, 4, 188. https://0-doi-org.brum.beds.ac.uk/10.3390/fluids4040188
AMA Style
Yoshida S, Hassa C, Yamamoto T, Heinze J, Schroll M. Influence of Fluidic Control in a Staged Lean Jet Engine Burner on Combustor Performance. Fluids. 2019; 4(4):188. https://0-doi-org.brum.beds.ac.uk/10.3390/fluids4040188
Chicago/Turabian StyleYoshida, Seiji, Christoph Hassa, Takeshi Yamamoto, Johannes Heinze, and Michael Schroll. 2019. "Influence of Fluidic Control in a Staged Lean Jet Engine Burner on Combustor Performance" Fluids 4, no. 4: 188. https://0-doi-org.brum.beds.ac.uk/10.3390/fluids4040188