Influence of Wind Buffers on the Aero-Thermal Performance of Skygardens


Department of Architecture and Built Environment, University of Nottingham, University Park, Nottingham NG7 2RD, UK
*
Authors to whom correspondence should be addressed.
Fluids 2020, 5(3), 160; https://0-doi-org.brum.beds.ac.uk/10.3390/fluids5030160
Submission received: 17 August 2020
/
Revised: 11 September 2020
/
Accepted: 15 September 2020
/
Published: 18 September 2020
(This article belongs to the Special Issue Recent Advances in Fluid Mechanics: Feature Papers)
Abstract
:Many high-rise buildings have semi-enclosed landscaped spaces, which act as design elements to improve the social and environmental aspects of the building. Designs such as skygardens are open to outdoor airflow and allow occupants to observe the city skyline from a height. Due to their often high location, they are subjected to strong wind speeds and extreme environmental conditions. The current study investigates the effects of three common wind buffers (railing, hedges, and trees) located at a height of 92 m on the performance of a skygarden, in terms of occupants’ wind comfort. Computational fluid dynamics (CFD) simulations were carried out using the realisable k-epsilon method, where the vegetation was modelled as a porous zone with cooling capacity. The computational modelling of the high-rise building and vegetation were validated using previous works. The quality class (QC) of the Lawson comfort criteria was used for the evaluation of the wind comfort across the skygarden. The results indicate that, although the three wind buffers offer varying levels of wind reduction in the skygarden, the overall wind conditions generated are suitable for occupancy. Furthermore, vegetation is also able to offer slight temperature reductions in its wake. The right combination and dimension of these elements can greatly assist in generating aero-thermal comfort across skygardens.

1. Introduction and Literature Review
Rapid urbanisation, along with the transformation of the built environment results in the intensification of the urban heat island (UHI) effect [1] and consequently an increase in global energy demand [2,3]. High-rise buildings and skyscrapers are one of the products of such a transformation, which have emerged as a result of urban growth and development [4]. The number of high-rise buildings is projected to increase, growing with the increasing demand for office spaces and housing within cities [5]. This increasing urbanisation also results in an imbalance between the indoor and outdoor space, which can affect the occupants’ well-being. Hence, novel concepts and approaches for the sustainable design and planning of urban spaces [6] are increasingly being explored by researchers to allow buildings and cities to cope with future challenges, such as the increasing building energy demand and a shortage of green spaces [7,8].
The presence of green spaces can improve the quality of life in urban areas by influencing the health and well-being of the local populations [9]. Green spaces are large spatial areas of vegetation which can improve the local thermal conditions by enabling shading and evaporative cooling to lower air temperatures [10,11]. It also acts as a filter which reduces pollutants, dust, and other harmful particles within highly polluted dense city areas to improve outdoor air quality. Vegetation, including trees, hedges, and green walls located along open roads and street canyons, can provide aid as a barrier between traffic emissions and adjacent areas [12].
Vegetation has been increasingly used in various aspects of cities to provide extensive benefits towards local and global energy balances [13]. The use of vegetation in and around buildings can be an effective strategy to enhance the thermal comfort and energy performance of buildings [14]. Aflaki et al. [15] highlighted that the presence of vegetation could decrease local air temperature and aid in the mitigation of the UHI effect. Hirano et al. [16] and Gomes et al. [17] suggested that urban vegetation and vertical greenery can also aid in the reduction of global CO2 emissions.
Previous works have shown that various forms of vegetation provide benefits towards occupants’ aero-thermal comfort conditions [18,19,20] and can enable people to stay in outdoor areas for an extended duration, while also improving outdoor air quality. Kang et al. [18] used numerical modelling to evaluate the wind flow around trees and its effect on pedestrian’s wind comfort in urban areas. Meanwhile, Lin et al. [19] performed a thermal comfort assessment of urban parks under various climatic conditions using field tests and observations. They investigated the influence of thermal conditions on the thermal perception of visitors in an outdoor urban space.
Solutions such as the addition of semi-outdoor spaces within and around buildings are explored in the literature. This includes balconies, rooftop gardens, courtyards, and semi-outdoor interbuilding communal spaces [21]. Montazeri et al. [22] performed a wind comfort analysis on balconies of high-rise buildings, which suggests that the balcony parapet can significantly improve wind comfort. The implementation of a new façade concept showed its ability to control wind flow in semi-outdoor spaces.
Another example of a semi-outdoor green space which is incorporated into the design of high-rise buildings is a skygarden or skycourt. Skygardens or “courtyards in the sky” have been increasingly utilised within densely populated areas, such as in Singapore and Hong Kong. They are semi-outdoor spaces consisting of various forms of vegetation integrated within the intermediate levels of a high-rise building [23]. The Bosco Verticale in Milan [24] and the Park Royal Collection Pickering in Singapore [25] are examples of buildings with skygardens. Skygardens can provide additional space for occupants residing inside, or in the proximity of, a building. It is designed for mixed-use purposes and as a transitional, social, and environmental space benefitting the occupants and the inhabitants [26]. Greenery can be added to the horizontal and vertical surfaces of the skygarden. Hence, it can also be an effective solution to reduce the UHI effect in densely built urban areas which have limited space for private and public green spaces on the ground [27].
However, despite the advantages of skygardens detailed above, the number of skygarden-integrated buildings remains relatively low [28]. Furthermore, limited studies exist which evaluate the wind and thermal comfort conditions in skygardens. Previous works by Tien and Calautit [29] and Mohammadi and Calautit [30] used Computational Fluid Dynamics (CFD) modelling to understand the influence of the design of the skygarden on the wind and thermal comfort.
Literature Gap and Novelty
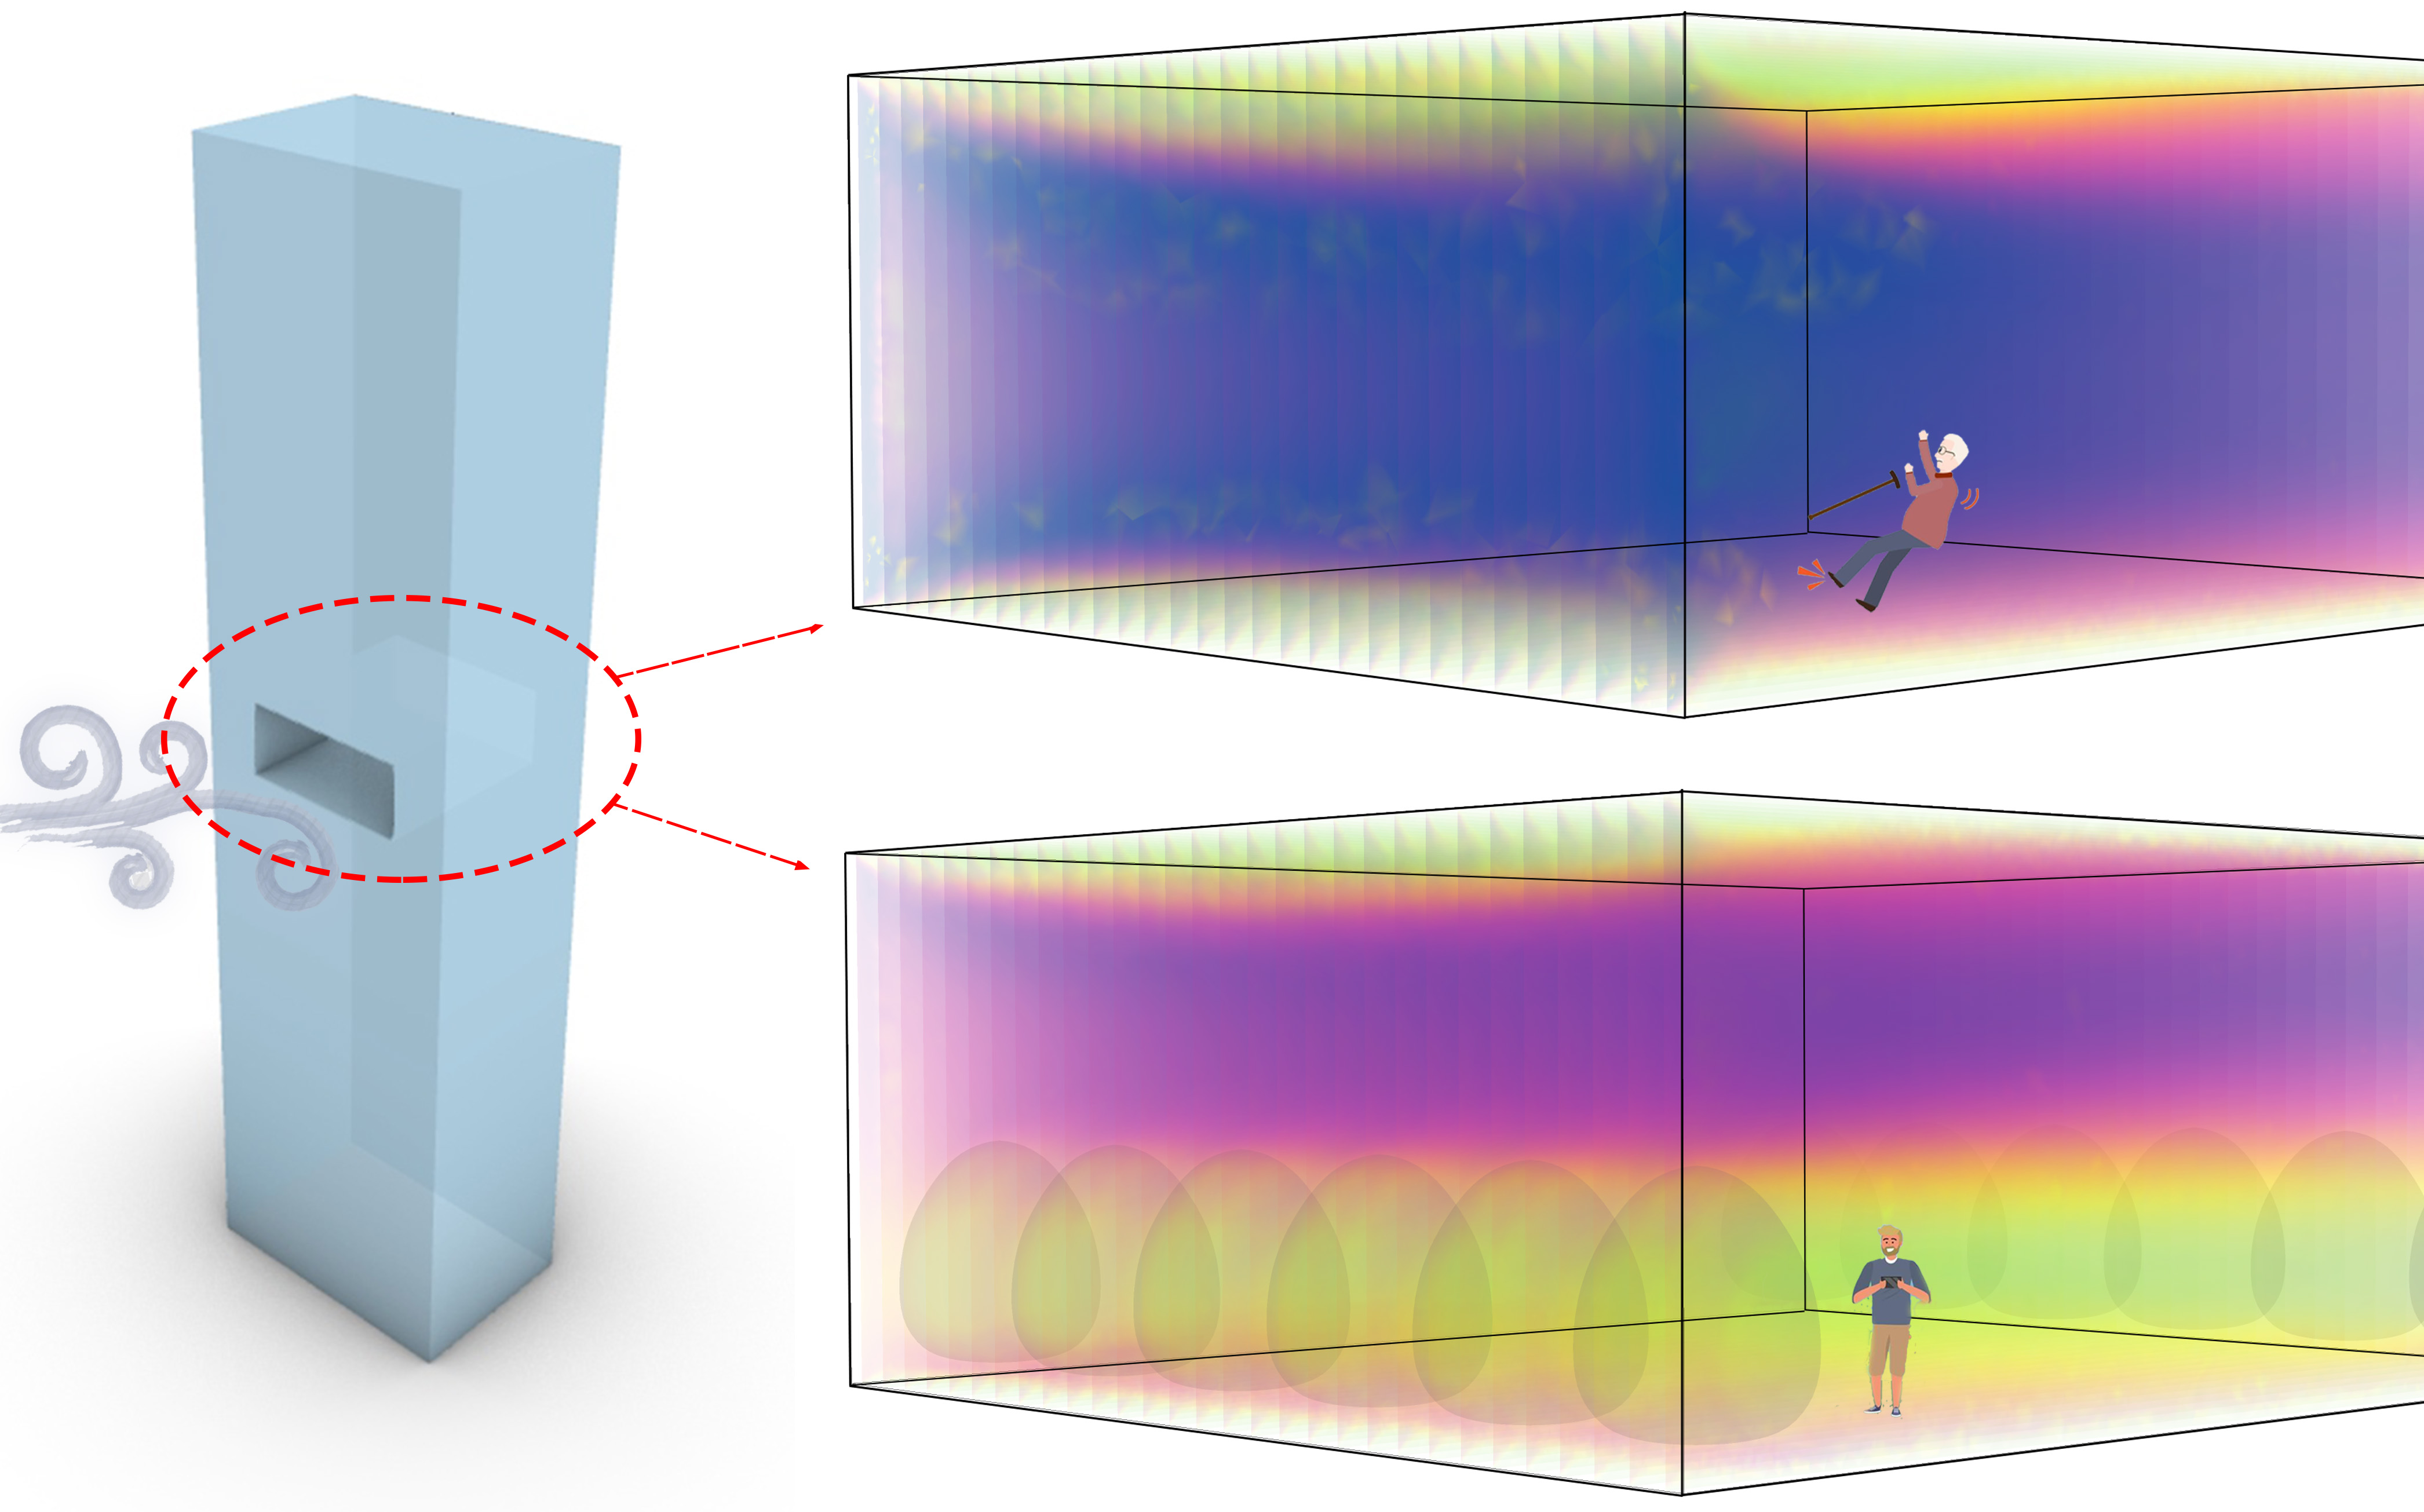
The study of Tien and Calautit [29] evaluated the aerothermal conditions and characteristics of wind flow around skygardens at intermediate levels of a high-rise building. The work highlighted the importance of the geometry and shape of the skygarden, which can have a significant influence on wind comfort. The work also showed that the airflow distribution in the skygarden can lead to variations in the thermal comfort levels and could potentially create uncomfortable and even dangerous conditions for occupants. Mohammadi and Calautit [30] evaluated the attenuation and cooling effect of vegetation in skygardens. The authors highlighted the positive influence of the addition of vegetation on the conditions in the skygarden and suggested that future studies should focus on other elements apart from trees which could modify the airflow (as shown in Figure 1). The addition of/combination with other attenuating elements can provide better control of the wind flow, especially in locations with very strong winds. Furthermore, the influence of the integration of different types of attenuating elements on the wind distribution and thermal conditions should be evaluated.
To address the research gaps, this study will build on the previous works to investigate the impact of different types of wind-attenuating elements such as hedges, railings, and plants, which are typically present in skygardens, on the aero-thermal comfort characteristics of the semi-outdoor space. The present study uses one of the cases, identified previously, to analyse the attenuation effect of vegetation in skygardens. A benchmark high-rise building model was developed and validated with the experimental data of the Commonwealth Advisory Aeronautical Council (CAARC) standard tall building model [31]. Various wind barrier configurations will be incorporated across the boundary regions of the skygarden model.
2. Method
The present work will employ numerical modelling to assess the effect of vegetation configurations on the wind and thermal conditions within a skygarden. The evapotranspiration cooling effect of the vegetation will be considered for the assessment of the thermal conditions. The numerical investigation will use the CFD software FLUENT (Ansys® Academic Research Fluent, Release 18.1, Canonsburg, PA, USA).
2.1. CFD Governing Equation
In the present study, the Reynolds averaged Navier–Stokes (RANS) equation approach, and the k-ε equations are applied, which are common and well established in the field of urban flow simulations. The simulation was conducted at steady state and with a three-dimensional computational domain. The semi-implicit method for a pressure-linked equations segregated pressure-based algorithm solver is employed [32]. The Reynolds averaged Navier-Stokes (RANS) equation is implemented using the realisable k-ε turbulence model, following the study conducted by Gromke et al. [33]. The Boussinesq approximation is employed to account for thermal effects and buoyancy. The governing equations for continuity, mean strain rate tensor, turbulence kinetic energy (k), dissipation rate (ε), turbulent viscosity, and energy are used (not shown here, but fully available in the FLUENT theory guide).
To account for the vegetation cooling effect, the present study adopted a simplified approach based on the works of Rahman et al. [34] and Gromke et al. [35] and a volumetric cooling potential of 350 W/m3 per LAD was assigned as a source term in the energy equation. Leaf Area Density, or LAD, is defined as the leaf area per unit volume of the vegetation. While the actual shape of the vegetation can vary from species to species and can be quite spatially complex, it was decided to model the geometry following [36] with a constant LAD of 2.3 m2/m3, as shown in Figure 2a. To account for the effect of vegetation on air flow, the Ergun equation was utilised to determine the viscous resistance factor (1/α) and the inertial resistance factor (C2). The FLUENT theory guide provides these formulae as:
where d is the particle diameter and Ø is the void fraction, set to 0.02 m and 0.96, respectively, in the present work.
2.2. Computational Geometry and Domain
For pre-processing, the solid geometry is modelled in CAD and imported into ANSYS for meshing and flow analysis. The present study requires the modelling of separate components that are assembled into an integrated model which can be done in the CAD software. The CAD geometry is imported to ANSYS Design Modeler, which requires further modification to define the computational fluid domain required for the CFD simulations, as shown in Figure 2a. The present work adopts a domain size based on [37]. The upstream and side domain lengths are 5H or five times the height of the building, 920 m. The downstream domain length is 15H, while the total height of the domain is 3H. The building has a height, width, and depth of 184 m, 45.7 m, and 30.8 m, respectively, with the width to depth in the ratio of 3:2. The validation model consists of a rectangular building, without the skygarden.
The present work adopts the hollowed-out configuration of the skygarden, as shown in Figure 2b, characterised by a void going through the depths of the building [26]. Buildings, such as the Abeno Harukas (Osaka) and Post Tower (Bonn), have integrated such skygarden designs. The modelled high-rise building is 46 storeys high, with each storey being 4 m. In total, the height reaches 184 m, and the skygarden covers three storeys, i.e., 12 m. Additionally, the skygarden is placed centrally at 92 m above the ground.
The railing, hedges and trees are placed in the zones of high wind speeds, which are near the edge of the skygarden. Table 1 lists some of studies which have modelled these elements. As observed in previous works [30,38], this arrangement functions as an attenuator or barrier for the oncoming wind. Figure 2b shows an example of the arrangement of trees in the skygarden. The railing is modelled as a thin solid wall with a width of 0.05 m and height of 1.5 m and 2 m, generating a blockage of 13% and 17%. The hedge is modelled as a rectangular-shaped porous fluid volume (air) to set it as a porous medium, detailed in Section 2.1. The hedge has a width of 1.5 m and height of 1.5 m and 2 m, generating a blockage of 13% and 17%. Both the railing and hedge are placed at the edge of the skygarden. An oval-shaped tree with maximum diameter of 2.5 m (small tree) and a 4.5 m diameter (large tree) is used to represent a generic tree shape and is placed 0.5 m above the floor, following the study by [34]. To account for structural and architectural reasons, the trees are placed 2.5 m from the edge and equally spaced out. Table 2 summarises the specifications of the different wind barrier solutions considered in this study. While the hedge and railing are continuous in nature, trees are discretely placed along the skygarden edge, and the maximum number of trees is placed to ensure full coverage. Thus, 12 small trees (c1) and six large trees (c2) are placed at either edge.
Figure 3 shows the seven skygarden models simulated in the present study. Four main configurations were simulated: no wind barriers (reference), glass railing, hedge, and trees. From previous works [29,30], it was observed that wind speeds are higher near the edges of the skygarden and, consequently, the wind barriers are placed along the edges for an effective windbreak. Moreover, in practice, each skygarden is uniquely designed considering the contextual nature of the site, making it difficult to simulate any particular type. Both the windward and leeward edges are lined with wind barriers to account for the dynamic nature of the wind direction. The centre line marked in Figure 3 was used for comparing the values across the different configurations of the skygardens.
2.3. Boundary Conditions
The domain was created as an enclosure which allows for the simulation of airflow around the high-rise building model [51], as shown in Figure 2a. A velocity flow field is generated by setting one side of the enclosure as the velocity inlet and the other side as the pressure outlet.
Following the works of Dagnew [52] and Huang et al. [53], the power-law wind profile was created to account for the wind speed modifications due to presence of urban surroundings, shown in Figure 4 and given by:
where is the calculated wind velocity (m/s) at the desired height z and is the reference wind speed at the height . In this case, the reference height was the height of the building, 184 m, and the reference speed was 12 m/s. is the power-law exponent, which was set to 0.33 to represent towns and cities. Since the region of interest was located high up on the building, a fully turbulent flow was considered with turbulent kinetic energy (k) and a turbulent dissipation rate (ε) set to 0.8 m2/s2 and 1 m2/s3, respectively, at the inlet. The wind speed was modelled at a higher side to investigate the effectiveness of buffer attenuation.
The pressure outlet was set as 0 Pa. The air temperature for the inlet was kept constant at 303 K (30 °C). The boundary condition for the outlet was set to a pressure outlet with 0 pa. Gravity of −9.8 m/s2 was set for the simulation domain to account for buoyancy. Symmetry for top and sidewalls and a no-slip condition for the ground were implemented as a standard roughness model. The simulation was considered converged when the area of interest (skygarden centre line) recorded a constant value.
2.4. Mesh Design
Figure 5 shows the generated computational mesh around the surfaces of the 3D model of the high-rise building and skygarden. Since the FLUENT tool is based on the FVM method, it has a variety of mesh generation flexibilities and the capacity to deal with unstructured and structure mesh in its solver. An unstructured mesh was generated for the domain, except in the area of the building surface, where a structured mesh was generated to allow for the flow fields near the critical areas of interest to be captured in the simulation. Sizing functions were applied in the inner domain. The mesh element size was refined in areas with a high gradient to improve the accuracy of the velocity and temperature field results. The size ensured that every building edge was resolved by at least 10 cells. The 3D mesh consisted of 2.7 million elements.
Grid sensitivity analysis was also carried out to assess the independence of the CFD solution from the mesh size. The set boundary conditions remained fixed throughout the simulation process to ascertain a precise comparison of the results. Various mesh sizes ranging from 3 m to 1 m near the building and skygarden area were generated, and simulated with similar boundary conditions (detailed in the next section).
2.5. Outdoor Comfort Criteria
3. Method Verification and Validation
To verify the benchmark high-rise building model, a grid sensitivity analysis was carried out, and the results were validated with experimental and numerical data from previous studies. For this purpose, the pressure coefficient (Cp) along the front, side, and back face of the building at two-thirds of the height, following Huang et al. [53], was extracted. This enabled comparison with studies which previously employed the CAARC building with similar dimensions.
3.1. Verification of the Base High-Rise Building
A sensitivity analysis was performed to determine the most suitable mesh size and configuration. Table 4 presents the details of the various forms of mesh applied to the base building model. All mesh configurations of the base high-rise building was simulated to verify the benchmark model and select the mesh setup that provided a balance between the mesh size, computational time, rate of convergence, solution quality, and grid independence.
Simulations of the base high-rise building with the k-ε turbulence model were performed using the mesh configurations detailed Table 4. Using the assigned wind velocity profile (Figure 4) and the initial CFD setup conditions, the pressure coefficients along the windward, side, and leeward surfaces at two-thirds (2/3 h) of the building height (123 m above ground) were evaluated. The pressure coefficients were comparable as it showed that mesh configuration and sizes had a high impact on the results of the pressure coefficient (Figure 6).
The pressure coefficient results are also comparable with the results of Huang et al. [53] and Braun and Awruch [55] in the same plot. Comparing the results of the different mesh arrangements, the predicted pressure values from Mesh A were closer to those from the available data. Meanwhile, the pattern of Mesh D is much closer to the available data. On the windward surface, the overall agreement between the present numerical results and previous work is quite good. The present model slightly overpredicted the pressure values on the side and leeward surfaces. This can be attributed to the difference in the experimental test, simulated boundary layer, turbulence model, and characteristics.
3.2. Validation of Vegetation and Trees
The vegetation model was validated against the study by Manickathan et al. [56], where the domain size of the reference case was 35 m in length and 11.5 m in height (Figure 7). Within the 2D domain, vegetation was represented by a 1 m square placed 8.5 m from the inlet and 0.5 m above the ground. Inlet velocity was modelled after Richard and Norris [57], where the von Karman number and roughness height were set to 0.41 and 0.0217 m, respectively. The inlet air temperature was set to 32 °C.
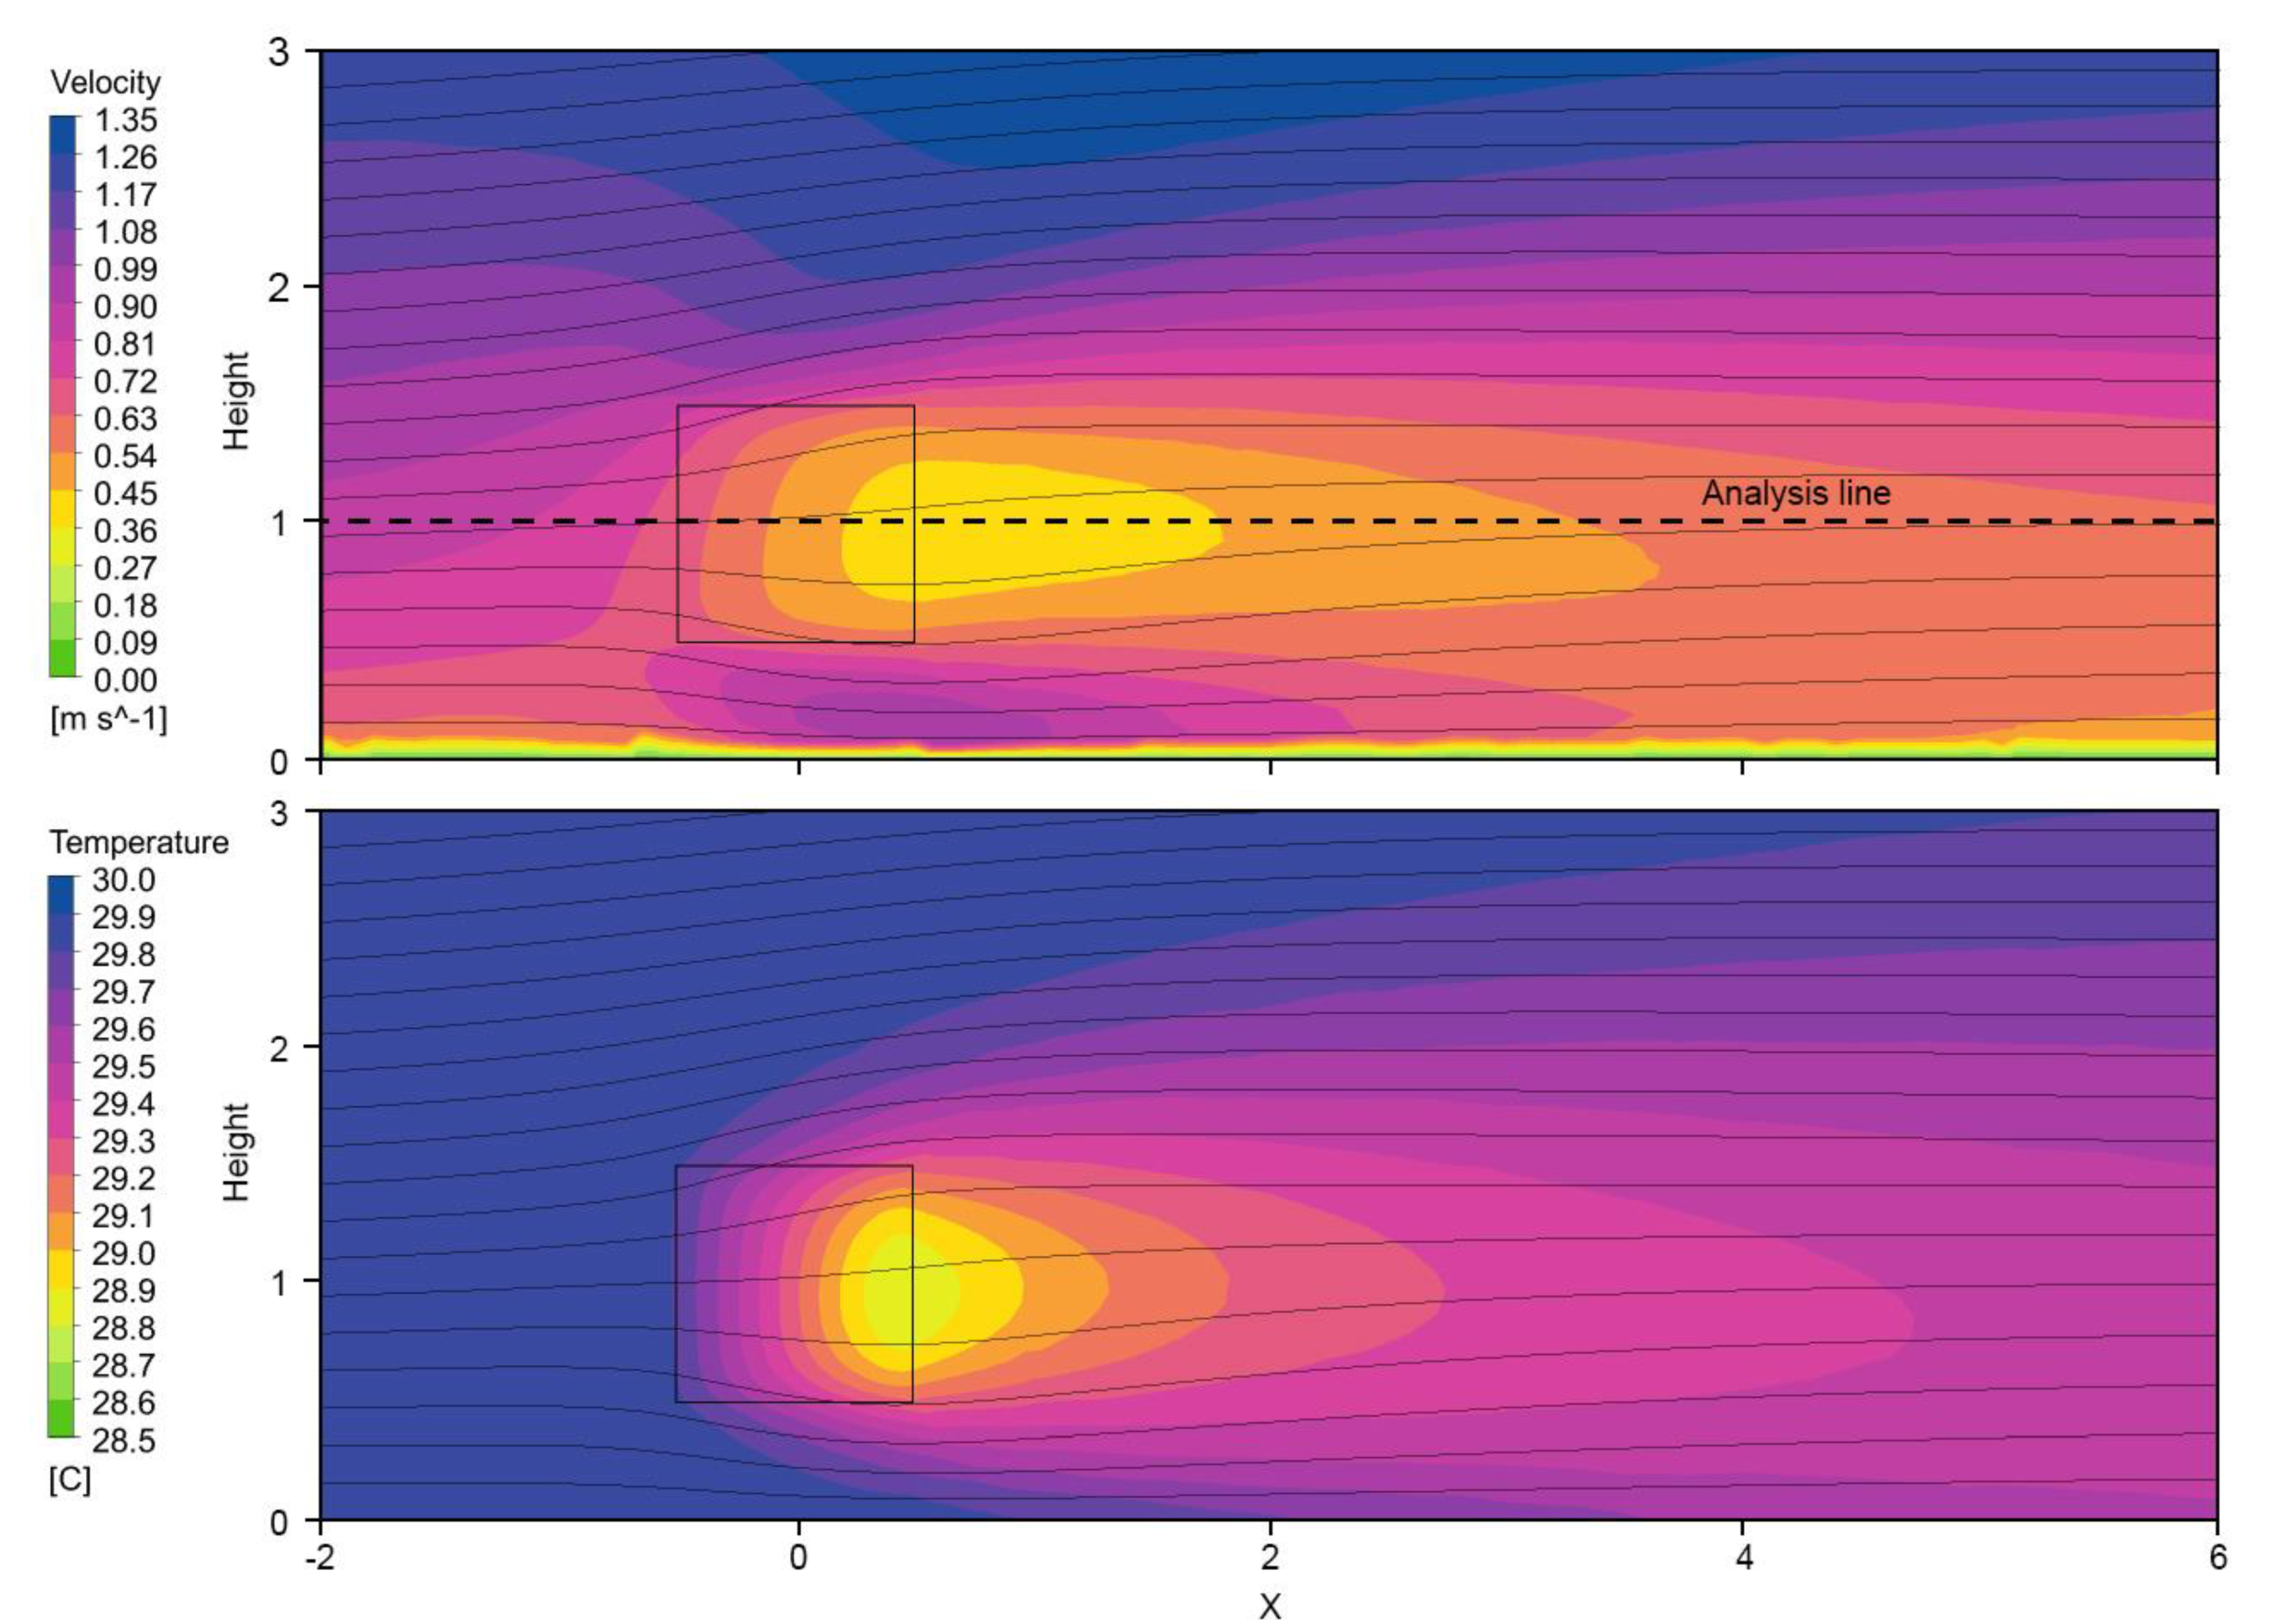
The velocity and temperature distribution of the area around the vegetation (−2 < X < 6; 0 < Height < 3) is shown in Figure 8. The vegetation zone offers resistance to the flow of air, with reduced speeds in the wake of the zone. The velocity distribution is in good agreement with the reference study [55]. A plot of velocity along the analysis line (marked in the figure, which runs through the centre of the vegetation patch) is shown in Figure 9. Vegetation is represented by the green patch, extending from −0.5 to 0.5 on the x-axis. The trend closely follows the numerical model of [55], with a slight underprediction towards the back of the vegetation patch. A deviation of about 0.04 m/s2 is observed towards the far end. The model performs well given the low modelling complexity of the vegetation zone. A temperature drop of about 1 °C is observed in the wake of the vegetation, similar to the decrease estimated by the reference case.
The slight variations in temperature and velocity could be due to the complex approach by Manickathan [55], wherein the authors inserted source/sink terms to account for modifications in air humidity, temperature, momentum, and turbulence. However, in the present case, a simplified vegetation model was adopted here without taking into account the detailed energy fluxes at the leaf surface. Furthermore, the numerical simulation was carried out in ANSYS, as opposed to OpenFOAM, which was utilised for the reference case. Given the objective of the present study to determine the attenuation effect of vegetation in a skygarden and of the observed wind pattern on the building platform, the deviations were considered quite small, and the observed contour was sufficiently accurate for further analysis.
4. Results and Discussion
The location and configuration of the skygarden have a major impact on the local wind speeds within the building [29,30] and the wind speeds are usually higher at the central location of the skygarden. The analysis is carried out at occupants’ chest height, on a plane at a height of 1.4 m. Typically, wind speeds within the skygarden are amplified due to pressure short circuiting, and the air is drawn from around the opening into the void. Recirculation zones are observed in the wake of the building, while airflow, from the skygarden, is seen to move upwards after exiting in the rear (Figure 10).
A closer observation within the skygarden (Figure 11) indicates that wind speeds are highest near the front, in the range of 10 m/s to 13 m/s. Speeds are generally lower along the middle of the skygarden and increase towards the sides. On average, the velocity at the occupants’ level is 12 m/s, which is significantly higher than the human comfort range. Thus, people will always experience discomfort within the skygarden. Even for intense physical activity, like running, such high wind speeds will be a cause of distress.
4.1. Impact of Buffer Elements on Wind Speed
In reality, most skygardens have a parapet or a railing for security purposes which also serves to deflect the wind away from occupants. With the introduction of such buffers, the wind speed is attenuated in the skygarden to create a more conducive environment for occupants. Three cases are simulated here, wherein the buffer elements are erected at the open edge of the skygarden. Case a (1 and 2) are integrated with a solid railing, case b (1 and 2) with 1.5 m thick hedges, and case c (1 and 2) with trees. A comparative analysis of the three elements is discussed below.
From Figure 12, it can be inferred that the wind speeds are generally reduced for all cases when compared with the base case. The buffer elements significantly reduce the wind velocity across the skygardens, as more areas achieve a wind velocity of less than 5 m/s. Specifically, the buffers along the windward side provide a barrier to the direct wind flow. In the case of railings and hedges, it is observed that the larger elements provide better attenuation. The high railing provides the highest attenuation, with an average velocity of about 2 m/s, while the configuration with low-level hedges is the least effective for wind reduction, with an average velocity of about 4.2 m/s. Each configuration has a distinct airflow pattern, specific to the interaction between the buffer elements and wind. Correspondingly, Table 5 presents the average wind speed across the skygarden at occupants’ height for each of the configuration cases. However, in terms of wind comfort, most configurations generate a Lawson quality class (QC) of C and below near the centre of the skygarden (Figure 13). This suggests that although the various elements have varying potential to attenuate the wind speed, they generally create a conducive environment for the skygarden occupants. However, the short railing and hedge are not able to reduce the winds speeds to comfortable levels near the sides.
4.2. Wind Comfort within the Skygarden
In the base configuration, without any buffer element, it was observed that wind speeds are generally of QC-E. In fact, in some places near the front edge, the speeds are dangerously high and unsafe for occupancy. With the addition of a 1.5 m high railing, QCs of A and B are generated near the anterior of the skygarden. This gradually shifts to QC-C near the rear, while some areas on the sides experience QC-D. The QC is further improved by increasing the height of the railing to 2 m. Similarly, the hedges create better QCs near the centre of the skygarden. In the case of a 1.5 m hedge, QC-D is observed near the walls, which is not preferable for sedentary activity. However, it can support activities like running and jogging. In the case of trees, the entire region between the front and rear row is seen to experience a QC of C and below. Alternate bands are created due to the funnelling effect, but on average, the zone is comfortable for occupants.
Table 6 lists the percentage of the skygarden area with a QC of C and below. A higher number indicates a larger area where occupants will be comfortable. It can be observed that the addition of buffer elements significantly improves the wind comfort in the region. Even the worst performing setup, i.e., the 1.5 m hedge configuration, still has 69% of the area within comfort limits. The 2 m railing can achieve comfort criteria for the entire skygarden, followed by a 2 m high hedge and then by the tree configurations.
A sectional view of the skygarden configuration is shown in Figure 14. In the base case, wind speeds are quite high, of the class E, throughout the height of the skygarden, except near the floor and the ceiling. The addition of buffer elements significantly stalls the airflow near the floor, while generally reducing the speed in the entire volume. The height of the element determines the relative height of a calm region which can be discerned for all three configurations. A higher railing generates larger depths of QC-C in the skygarden, compared to the lower railing. A similar pattern is observed for the hedge as well as the trees. This indicates that based on the occupancy and activity envisaged in the skygarden, the height of the buffer element can be determined to ensure sufficient attenuation is achieved. The large trees, due to their sheer size, generate comfortable wind flow in the entire depth and to a significant height for the skygarden. However, there is a slight increase in wind speeds near the floor due to the raised tree crown.
4.3. Impact of Buffer Elements on Air Temperature
Vegetation is known to provide evapotranspirational cooling, which can be harnessed to improve the microclimate of the skygarden. Figure 15 shows the temperature distribution across the skygarden for the hedge and tree configuration. Configurations with railings are not considered for this effect, and the temperature is assumed to be constant, similar to the base case. In the case of the skygarden with hedges, there is slight cooling near the foliage. Reductions ranging from 0.3 °C to 0.5 °C can be seen in the vicinity of the hedges, however, the drop in temperature is negligible towards the rear. In the case of small trees, the reduction in temperature is similar but is spread across the skygarden. The larger trees are, however, able to produce cooling, ranging from 0.5 °C to 1 °C in their wake. Furthermore, the contours are fairly spread out across the depth and occupiable height of the skygarden. The leeward trees can extract more heat from the air and reduce temperatures further by a degree.
The study by Mohammadi and Calautit [30] suggests that increasing the number of trees would produce more cooling in the skygarden. In the current scenario, the total foliage volumes for 2.5 m trees and 5 m trees are 162.26 m3 and 649 m3, respectively. Consequently, the area average temperature reduction in the skygarden for case c2 is about 3.8 times higher than for case c1 (average temperature reductions being 0.35 °C and 0.09 °C, respectively). Overall, the foliage can induce both cooling and attenuation in wind speeds for the comfort of occupants. It also has the potential for blocking solar radiation and improving air quality, although the effects have not been considered in this study.
5. Conclusions
The main aim of the study was to identify the effects of various buffer elements on the general air quality of the skygarden. Such buffers are primarily installed as a security feature in skygardens but can also assist in modifying the airflow. The right combination and dimension of these elements can greatly assist in generating aero-thermal comfort across the skygarden. This is an important indicator of the performance of a skygarden-integrated building design and the achievement of comfortable environments for occupants. A quality class (QC) of C of the Lawson comfort criteria was assumed as the desired maximum condition to enable skygardens to have a suitable wind comfort level for the performance of any type of occupancy activities. The hollowed-out skygarden design, located centrally in the building with no parapet, was found to be dangerous for occupancy as it produced high wind speeds in the region.
The addition of buffer elements, like railings or hedges and trees, greatly stalled the air. However, the aero-thermal quality of air greatly differed in each case. While railings are solid barriers, hedges and trees, modelled as a porous zone, provide momentum sinks for reducing wind speeds. Railings are most effective in deflecting wind flow and generate QC-C at occupant height. Higher railings ensure a better spread of wind for improved comfort quality across the skygarden. Although hedges can stall airflow, their relative performance is lower than railings. Trees, on the other hand, can generate QC-C at a sufficient height and depth of the skygarden. They also provide cooling up to 1 °C, which can be increased depending on the variety of species planted.
While railings are easy to install and maintain, foliage requires careful planning and regular maintenance. Trees can be relatively expensive and pose structural challenges, but can provide added benefits like providing shade, better cooling, fresh air, carbon sinks, and psychological benefits. Further study can investigate the impact towards various tree geometries, volumetric cooling potential and planting location to optimise the design. Other factors like lighting, view factors, solar radiation, pollutants, and noise abatement can also be investigated. These studies have been carried out for roadside vegetation and vertical greenery; however, their impact is relatively unknown in the context of a skygarden. Moreover, skygardens appear in various forms and geometries dictated by building designs across the globe, and further studies could assess the aero-thermal comfort characteristics with these buffer elements for various other shapes and configurations as well varying meteorological conditions.
Author Contributions
Conceptualisation, J.K.C.; methodology, J.K.C., P.W.T., and M.M.; software, M.M.; validation, J.K.C. and M.M.; formal analysis, P.W.T. and M.M.; investigation, M.M.; resources, J.K.C.; data curation, J.K.C.; writing—original draft preparation, P.W.T. and M.M.; writing—review and editing, J.K.C.; visualisation, M.M.; supervision, J.K.C.; project administration, J.K.C. All authors have read and agreed to the published version of the manuscript.
Funding
This research received no external funding.
Conflicts of Interest
The authors declare no conflict of interest.
References
- Heat Island Impacts. EPA United States Environmental Protection Agency. Available online: https://www.epa.gov/heat-islands/heat-island-impacts (accessed on 23 June 2020).
- World Energy Outlook 2018. Available online: https://www.iea.org/reports/world-energy-outlook-2018 (accessed on 23 June 2020).
- Krefis, A.C.; Augustin, M.; Schlünzen, K.H.; Oßenbrügge, J.; Augustin, J. How Does the Urban Environment Affect Health and Well-Being? A Systematic Review. Urban Sci. 2018, 2, 21. [Google Scholar] [CrossRef] [Green Version]
- Cities in Numbers: How Patterns of Urban Growth Change the World. Available online: https://www.theguardian.com/cities/2015/nov/23/cities-in-numbers-how-patterns-of-urban-growth-change-the-world (accessed on 23 June 2020).
- High Demand for High-Rise: Where will the City Put Its New Skyscrapers? Available online: https://0-www-architectsjournal-co-uk.brum.beds.ac.uk/news/high-demand-for-high-rise-where-will-the-city-put-its-new-skyscrapers/8691245.article (accessed on 23 June 2020).
- Akristiniy, V.A.; Boriskina, Y.I. Vertical cities-the new form of high-rise construction evolution. In E3S Web of Conferences; 2018; Volume 33. [Google Scholar] [CrossRef] [Green Version]
- Jim, C.Y.; Chan, M.W.H. Urban greenspace delivery in Hong Kong: Spatial-institutional limitations and solutions. Urban For. Urban Green. 2016, 18, 65–85. [Google Scholar] [CrossRef]
- Lo, A.; Byrne, J.A.; Jim, C.Y. How climate change perception is reshaping attitudes towards the functional benefits of urban trees and green space: Lessons from Hong Kong. Urban For. Urban Green. 2016, 23, 74–83. [Google Scholar] [CrossRef] [Green Version]
- Haaland, C.; van den Bosch, C.K. Challenges and strategies for urban green-space planning in cities undergoing densification: A review. Urban For. Urban Green. 2015, 14, 760–771. [Google Scholar] [CrossRef]
- Moss, J.L.; Doick, K.J.; Smith, S.; Shahrestani, M. Influence of evaporative cooling by urban forests on cooling demand in cities. Urban For. Urban Green. 2019, 37, 65–73. [Google Scholar] [CrossRef] [Green Version]
- Ow, L.F.; Ghosh, S.; Yusof, M.L.M. Growth of Samanea saman: Estimated cooling potential of this tree in an urban environment. Urban For. Urban Green. 2019, 41, 264–271. [Google Scholar] [CrossRef]
- Abhijith, K.V.; Kumar, P.; Gallagher, J.; McNabola, A.; Baldauf, R.; Pilla, F.; Broderick, B.; Di Sabatino, S.; Pulvirenti, B. Air pollution abatement performances of green infrastructure in open road and built-up street canyon environments-A review. Atmos. Environ. 2017, 162, 71–86. [Google Scholar] [CrossRef]
- Wellmann, T.; Schug, F.; Haase, D.; Pflugmacher, D.; van der Linden, S. Green growth? On the relation between population density, land use and vegetation cover fractions in a city using a 30-years Landsat time series. Landsc. Urban Plan. 2020, 202, 103857. [Google Scholar] [CrossRef]
- Malys, L.; Musy, M.; Inard, C. Direct and Indirect Impacts of Vegetation on Building Comfort: A Comparative Study of Lawns, Green Walls and Green Roofs. Energies 2016, 9, 32. [Google Scholar] [CrossRef]
- Aflaki, A.; Mirnezhad, M.; Ghaffarianhoseini, A.; Ghaffarianhoseini, A.; Omrany, H.; Wang, Z.H.; Akbari, H. Urban heat island mitigation strategies: A state-of-the-art review on Kuala Lumpur, Singapore and Hong Kong. Cities 2017, 62, 131–145. [Google Scholar] [CrossRef] [Green Version]
- Hirano, Y.; Ihara, T.; Gomi, K.; Fujita, T. Simulation-Based Evaluation of the Effect of Green Roofs in Office Building Districts on Mitigating the Urban Heat Island Effect and Reducing CO2 Emissions. Sustainability 2019, 11, 2055. [Google Scholar] [CrossRef] [Green Version]
- Gomes, M.G.M.; Silva, C.; Valadas, A.S.; Silva, M. Impact of Vegetation, Substrate, and Irrigation on the Energy Performance of Green Roofs in a Mediterranean Climate. Water 2019, 11, 2016. [Google Scholar] [CrossRef] [Green Version]
- Kang, G.; Kim, J.-J.; Kim, D.-J.; Choi, W.; Park, S.-J. Development of a computational fluid dynamics model with tree drag parameterizations: Application to pedestrian wind comfort in an urban area. Build. Environ. 2017, 124, 209–218. [Google Scholar] [CrossRef]
- Lin, C.-H.; Lin, T.-P.; Hwang, R.-L. Thermal comfort for urban parks in subtropics: Understanding visitor’s perceptions, behavior and attendance. Adv. Meteorol. 2013, 2013. [Google Scholar] [CrossRef]
- Gatto, E.; Buccolieri, R.; Aarrevaara, E.; Ippolito, F.; Emmanuel, R.; Perronace, L.; Santiago, J.L. Impact of Urban Vegetation on Outdoor Thermal Comfort: Comparison between a Mediterranean City (Lecce, Italy) and a Northern European City (Lahti, Finland). Forests 2020, 11, 228. [Google Scholar] [CrossRef] [Green Version]
- Ochodo, C.; Ndetei, D.M.; Moturi, W.N.; Otieno, J.O. External Built Residential Environment Characteristics that Affect Mental Health of Adults. J. Urban Health 2014, 91, 908–927. [Google Scholar] [CrossRef] [Green Version]
- Montazeri, H.; Blocken, B.; Janssen, W.D.; van Hooff, T. CFD analysis of wind comfort on high-rise building balconies: Validation and application. In Proceedings of the 7th International Colloquium on Bluff Body Aerodynamics and Applications (BBAA7), Shanghai, China, 2–6 September 2012; Volume 2012, pp. 1–10. [Google Scholar]
- Tian, Y.; Jim, C.Y. Factors influencing the spatial pattern of sky gardens in the compact city of Hong Kong. Landsc. Urban Plan. 2011, 101, 299–309. [Google Scholar] [CrossRef]
- Giacomello, E.; Valagussa, M. Vertical Greenery: Evaluating the High-Rise Vegetation of the Bosco Verticale, Milan; Council on Tall Buildings and Urban Habitat: Chicago, IL, USA, 2015; Available online: https://store.ctbuh.org/index.php?controller=attachment&id_attachment=32 (accessed on 23 June 2020).
- Terrapin Bright Green. ParkRoyal on Pickering Hotel and Spa. 2017. Available online: https://www.terrapinbrightgreen.com/wp-content/uploads/2015/11/Parkroyal_Case-Study.pdf (accessed on 23 June 2020).
- Pomeroy, J. The Skycourt and Skygarden, Greening the Urban Habitat, 1st ed.; Routledge: Abingdon, UK, 2014; ISBN 978-0-415-63698-8. [Google Scholar]
- WHO—World Health Organization. Health and Sustainable Development: Urban Green Spaces 2020. Available online: https://www.who.int/sustainable-development/cities/health-risks/urban-green-space/en// (accessed on 23 June 2020).
- Tian, Y.; Jim, C.Y.; Tao, Y. Challenges and Strategies for Greening the Compact City of Hong Kong. J. Urban Plan. Dev. 2012, 138, 101–109. [Google Scholar] [CrossRef]
- Tien, P.W.; Calautit, J.K. Numerical analysis of the wind and thermal comfort in courtyards “skycourts” in high rise buildings. J. Build. Eng. 2019, 24, 100735. [Google Scholar] [CrossRef]
- Mohammadi, M.; Calautit, J.K. Numerical investigation of the wind and thermal conditions in sky gardens in high-rise buildings. Energies 2019, 12, 1380. [Google Scholar] [CrossRef] [Green Version]
- Melbourne, W.H. Comparison of measurements on the CAARC standard tall building model in simulated model wind flows. J. Wind Eng. Ind. Aerodyn. 1980, 6, 73–88. [Google Scholar] [CrossRef]
- Kichah, A.; Bournet, P.-E.; Migeon, C.; Boulard, T. Measurement and CFD simulation of microclimate characteristics and transpiration of an Impatiens pot plant crop in a greenhouse. Biosyst. Eng. 2012, 112, 22–34. [Google Scholar] [CrossRef]
- Gromke, C.; Blocken, B.; Janssen, W.; Merema, B.; van Hooff, T.; Timmermans, H. CFD analysis of transpirational cooling by vegetation: Case study for specific meteorological conditions during a heat wave in Arnhem, Netherlands. Build. Environ. 2015, 83, 11–26. [Google Scholar] [CrossRef]
- Rahman, M.A.; Smith, J.G.; Stringer, P.; Ennos, A.R. Effect of rooting conditions on the growth and cooling ability of Pyrus calleryana. Urban. For. Urban. Green. 2011, 10, 185–192. [Google Scholar] [CrossRef]
- Gromke, C.; Ruck, B. Pollutant Concentrations in Street Canyons of Different Aspect Ratio with Avenues of Trees for Various Wind Directions. Bound. Layer Meteorol. 2012, 144, 41–64. [Google Scholar] [CrossRef] [Green Version]
- Bitog, J.P.; Lee, I.-B.; Hwang, H.-S.; Shin, M.-H.; Hong, S.-W.; Seo, I.-H.; Mostafa, E.; Pang, Z. A wind tunnel study on aerodynamic porosity and windbreak drag. For. Sci. Technol. 2011, 7, 8–16. [Google Scholar] [CrossRef]
- Tominaga, Y.; Mochida, A.; Murakami, S.; Sawaki, S. Comparison of various revised k-ε models and LES applied to flow around a high-rise building model with 1:1:2 shape placed within the surface boundary layer. J. Wind Eng. Ind. Aerodyn. 2008, 96, 389–411. [Google Scholar] [CrossRef]
- Gromke, C.; Jamarkattel, N.; Ruck, B. Influence of roadside hedgerows on air quality in urban street canyons. Atmos. Environ. 2016, 139, 75–86. [Google Scholar] [CrossRef]
- British Standards Institution. BS 6180:2011 Barriers in and about Buildings-Code of Practice; British Standards Institution: London, UK, 2011; p. 46. [Google Scholar]
- Li, X.B.; Lu, Q.C.; Lu, S.J.; He, H.D.; Peng, Z.R.; Gao, Y.; Wang, Z.Y. The impacts of roadside vegetation barriers on the dispersion of gaseous traffic pollution in urban street canyons. Urban. For. Urban. Green. 2016, 17, 80–91. [Google Scholar] [CrossRef]
- Vos, P.E.J.; Maiheu, B.; Vankerkom, J.; Janssen, S. Improving local air quality in cities: To tree or not to tree? Environ. Pollut. 2013, 183, 113–122. [Google Scholar] [CrossRef]
- Wania, A.; Bruse, M.; Blond, N.; Weber, C. Analysing the influence of different street vegetation on traffic-induced particle dispersion using microscale simulations. J. Environ. Manage. 2012, 94, 91–101. [Google Scholar] [CrossRef] [PubMed]
- Morakinyo, T.E.; Lam, Y.F. Simulation study of dispersion and removal of particulate matter from traffic by road-side vegetation barrier. Environ. Sci. Pollut. Res. 2016, 23, 6709–6722. [Google Scholar] [CrossRef] [PubMed]
- Tiwary, A.; Morvan, H.P.; Colls, J.J. Modelling the size-dependent collection efficiency of hedgerows for ambient aerosols. J. Aerosol. Sci. 2006, 37, 990–1015. [Google Scholar] [CrossRef]
- Tiwary, A.; Reff, A.; Colls, J.J. Collection of ambient particulate matter by porous vegetation barriers: Sampling and characterization methods. J. Aerosol. Sci. 2008, 39, 40–47. [Google Scholar] [CrossRef]
- Morakinyo, T.E.; Lam, Y.F.; Hao, S. Evaluating the role of green infrastructures on near-road pollutant dispersion and removal: Modelling and measurement. J. Environ. Manag. 2016, 182, 595–605. [Google Scholar] [CrossRef]
- Al-Dabbous, A.N.; Kumar, P. The influence of roadside vegetation barriers on airborne nanoparticles and pedestrians exposure under varying wind conditions. Atmos. Environ. 2014, 90, 113–124. [Google Scholar] [CrossRef] [Green Version]
- Lin, M.Y.; Hagler, G.; Baldauf, R.; Isakov, V.; Lin, H.Y.; Khlystov, A. The effects of vegetation barriers on near-road ultrafine particle number and carbon monoxide concentrations. Sci. Total Environ. 2016, 553, 372–379. [Google Scholar] [CrossRef]
- Hagler, G.S.; Lin, M.Y.; Khlystov, A.; Baldauf, R.W.; Isakov, V.; Faircloth, J.; Jackson, L.E. Field investigation of roadside vegetative and structural barrier impact on near-road ultrafine particle concentrations under a variety of wind conditions. Sci. Total Environ. 2012, 419, 7–15. [Google Scholar] [CrossRef]
- Tong, Z.; Baldauf, R.W.; Isakov, V.; Deshmukh, P.; Zhang, K.M. Roadside vegetation barrier designs to mitigate near-road air pollution impacts. Sci. Total Environ. 2016, 541, 920–927. [Google Scholar] [CrossRef]
- Franke, J. Recommendations of the COST action C14 on the use of CFD in predicting pedestrian wind environment. In Proceedings of the Fourth International Symposium on Computational Wind Engineering (CWE2006), Yokohama, Japan, 16–19 July 2006. [Google Scholar]
- Dagnew, A.K.; Bitsuamalk, G.T.; Merrick, R. Computational evaluation of wind pressures on tall buildings. In Proceedings of the 11th Americas Conference on Wind Engineering, San Juan, Puerto Rico, 20–26 June 2009. [Google Scholar]
- Huang, S.; Li, Q.S.; Xu, S. Numerical evaluation of wind effects on a tall steel building by CFD. J. Constr. Steel. Res. 2007, 63, 612–627. [Google Scholar] [CrossRef]
- Lawson, T.V. The wind content of the built environment. J. Wind Eng. Ind. Aerodyn. 1978, 3, 93–105. [Google Scholar] [CrossRef]
- Braun, A.L.; Awruch, A.M. Aerodynamic and aeroelastic analyses on the CAARC standard tall building model using numerical simulation. Comput. Struct. 2009, 87, 564–581. [Google Scholar] [CrossRef]
- Manickathan, L.; Defraeye, T.; Allegrini, J.; Derome, D.; Carmeliet, J. Parametric study of the influence of environmental factors and tree properties on the transpirative cooling effect of trees. Agric. For. Meteorol. 2018, 248, 259–274. [Google Scholar] [CrossRef] [Green Version]
- Richards, P.J.; Norris, S.E. Appropriate boundary conditions for computational wind engineering models revisited. J. Wind Eng. Ind. Aerodyn. 2011, 99, 257–266. [Google Scholar] [CrossRef]
Figure 1.
Wind barrier elements used in skygarden design; (a) railing or windscreen, (b) hedge, and (c) small and (d) large trees.
Figure 1.
Wind barrier elements used in skygarden design; (a) railing or windscreen, (b) hedge, and (c) small and (d) large trees.

Figure 2.
(a) Example of the computational domain and boundary conditions (large trees); (b) skygarden model and schematic showing dimensions.
Figure 2.
(a) Example of the computational domain and boundary conditions (large trees); (b) skygarden model and schematic showing dimensions.

Figure 3.
Arrangements within the skygarden model, with the centre line marked on the reference plane; (a) base skygarden configuration, skygarden with (b1) 1.5 m glass railing, (b2) 2 m glass railing, (c1) 1.5 m hedge, (c2) 2 m hedge, (d1) trees of height 2.5 m, and (d2) trees of height 4.5 m.
Figure 3.
Arrangements within the skygarden model, with the centre line marked on the reference plane; (a) base skygarden configuration, skygarden with (b1) 1.5 m glass railing, (b2) 2 m glass railing, (c1) 1.5 m hedge, (c2) 2 m hedge, (d1) trees of height 2.5 m, and (d2) trees of height 4.5 m.

Figure 4.
Atmospheric boundary layer wind velocity profile.

Figure 5.
Computational mesh around the surfaces of the skygarden model (a) at the building face and (b) along the central plane.
Figure 5.
Computational mesh around the surfaces of the skygarden model (a) at the building face and (b) along the central plane.

Figure 6.
Mesh sensitivity results in terms of pressure coefficient around the windward, side, and leeward surfaces of the benchmark building model at the height of 2/3 h, 123 m above ground using various meshing configurations indicated in Table 4 and compared with the study by Huang et al. [53] and Braun and Awruch [55].

Figure 7.
Simulation domain of the validation model, with the porous vegetation indicated by the green square and centred along the x-axis.
Figure 7.
Simulation domain of the validation model, with the porous vegetation indicated by the green square and centred along the x-axis.

Figure 8.
Contours of velocity and temperature around the vegetation (black square) from the validation model.
Figure 8.
Contours of velocity and temperature around the vegetation (black square) from the validation model.

Figure 9.
Comparison of wind speed along the analysis line, with the vegetation zone indicated by the green patch from −0.5 to 0.5 on the x-axis.
Figure 9.
Comparison of wind speed along the analysis line, with the vegetation zone indicated by the green patch from −0.5 to 0.5 on the x-axis.

Figure 10.
Wind velocity contour around the base skygarden model on (a) a central vertical plane through the centre of the skygarden, (b) a horizontal plane at occupants’ chest height (1.4 m).
Figure 10.
Wind velocity contour around the base skygarden model on (a) a central vertical plane through the centre of the skygarden, (b) a horizontal plane at occupants’ chest height (1.4 m).

Figure 11.
Wind velocity contour in the skygarden at occupants’ height.

Figure 12.
Wind velocity contour in the skygarden captured at 1.4 m above the skygarden plane, corresponding to occupants’ height with (a1) 1.5 m railing, (a2) 2 m railing, (b1) 1.5 m hedge, (b2) 2 m hedge, (c1) 2.5 m trees, and (c2) 5 m trees.
Figure 12.
Wind velocity contour in the skygarden captured at 1.4 m above the skygarden plane, corresponding to occupants’ height with (a1) 1.5 m railing, (a2) 2 m railing, (b1) 1.5 m hedge, (b2) 2 m hedge, (c1) 2.5 m trees, and (c2) 5 m trees.

Figure 13.
Velocity profile along the middle of the skygarden, the grey patch indicates wind speeds of quality class C and below; (a1) railing 1.5 m, (a2) railing 2 m, (b1) hedge 1.5 m, (b2) hedge 2 m, (c1) tree 2.5 m, and (c2) tree 5 m.
Figure 13.
Velocity profile along the middle of the skygarden, the grey patch indicates wind speeds of quality class C and below; (a1) railing 1.5 m, (a2) railing 2 m, (b1) hedge 1.5 m, (b2) hedge 2 m, (c1) tree 2.5 m, and (c2) tree 5 m.

Figure 14.
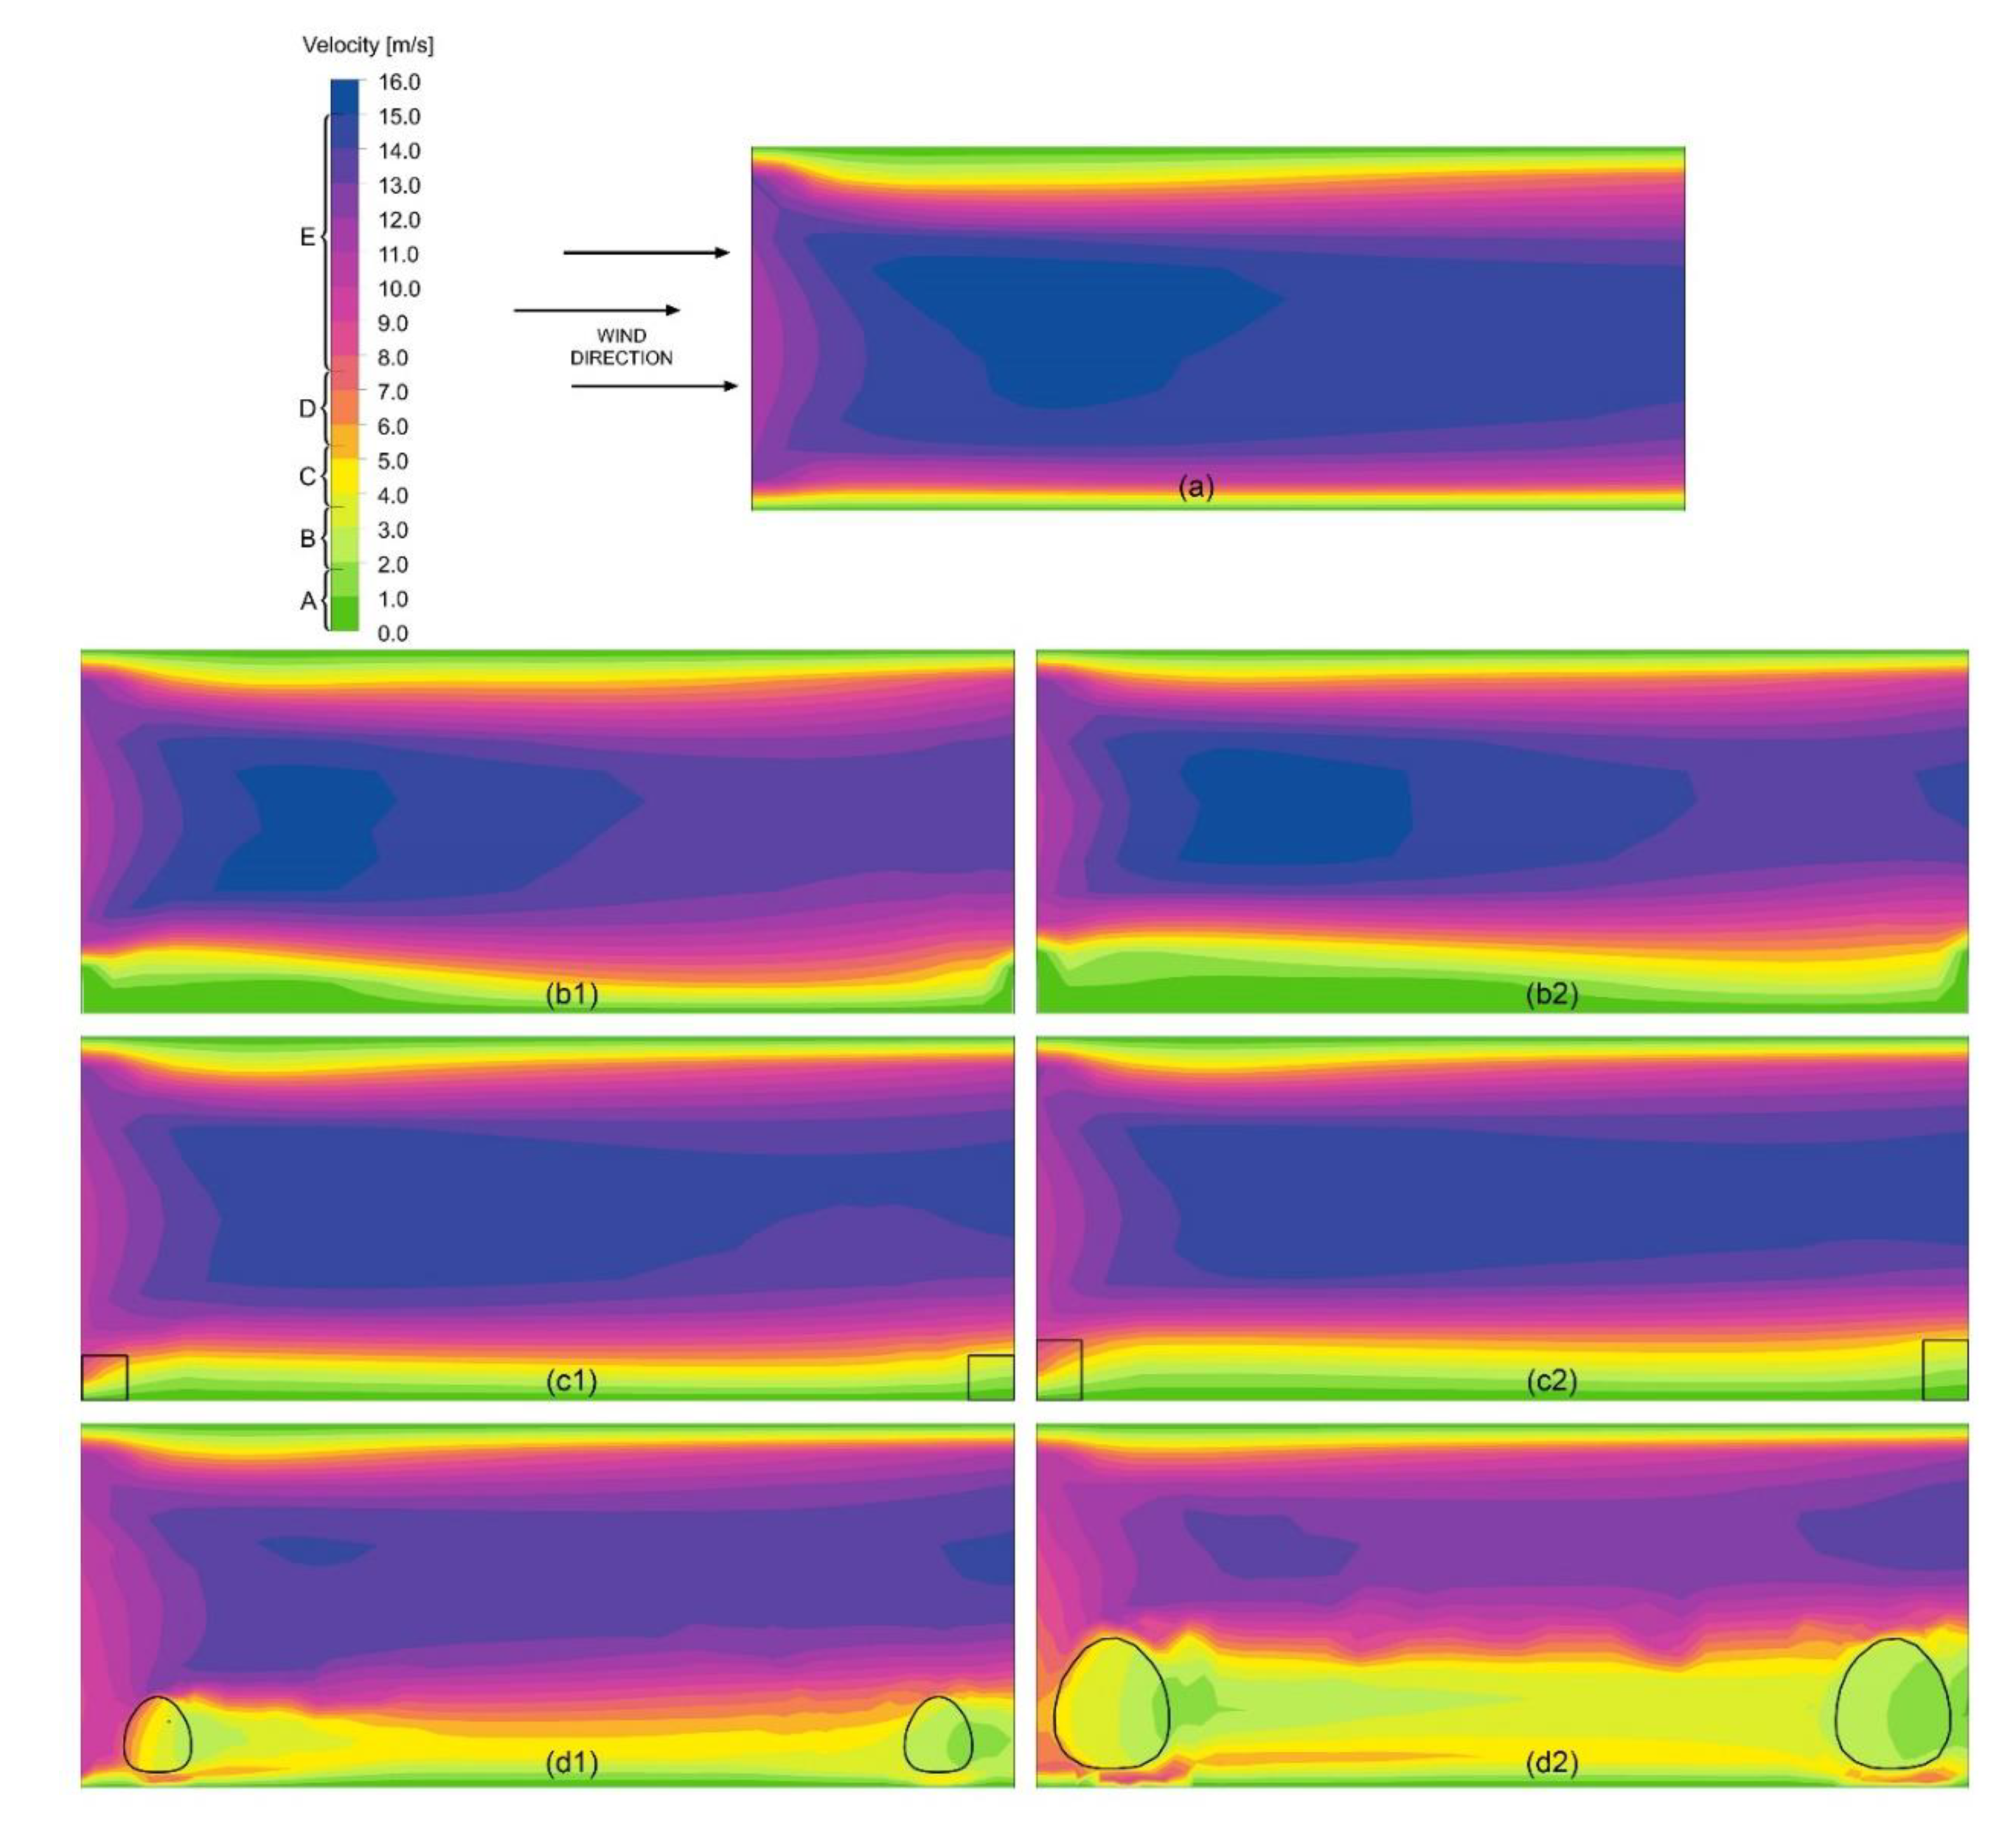
Plot of wind speed in the skygarden along a vertical plane; (a) base configuration without any buffer, (b1) railing 1.5 m, (b2) railing 2 m, (c1) hedge 1.5 m, (c2) hedge 2 m, (d1) tree 2.5 m, and (d2) tree 5 m.
Figure 14.
Plot of wind speed in the skygarden along a vertical plane; (a) base configuration without any buffer, (b1) railing 1.5 m, (b2) railing 2 m, (c1) hedge 1.5 m, (c2) hedge 2 m, (d1) tree 2.5 m, and (d2) tree 5 m.

Figure 15.
Temperature profile along the (1) horizontal and (2) vertical plane of the skygarden; (a) hedge 1.5 m, (b) hedge 2 m, (c) tree 2.5 m, and (d) tree 5 m.
Figure 15.
Temperature profile along the (1) horizontal and (2) vertical plane of the skygarden; (a) hedge 1.5 m, (b) hedge 2 m, (c) tree 2.5 m, and (d) tree 5 m.


Table 1.
Studies which modelled railings, hedges, and trees.
| Type | Dimension | Reference | |
|---|---|---|---|
| Height (m) | Width (m) | ||
| Railing | 1.2 m | - | [22] |
| 1.1 m (minimum) | - | [39] | |
| ~2 m | - | Typical skygarden baluster height (e.g., 20 Fenchurch Street, Marina Bay Sands, etc.) | |
| Hedge | 1.5 m, 2.5 m | 1.5 m | [38] |
| 0.5~4 m | 1.5 m | [40] | |
| 1~4 m | 1 m | [41] | |
| 1.5 m | - | [42] | |
| Trees (Small) | 1.5~4 m | 1~7.5 m | [43] |
| 1.7 m~2.4 m | 1.6~3.2 m | [44] | |
| 2.2 m | 1.6 m | [45] | |
| 2~4 m | 1~2 m | [46] | |
| Trees (Large) | 3.4 m | 2.2 m | [47] |
| 4~8 m | 2~6 m | [48] | |
| 6.1–7.2 m | 3.6–4.5 m | [49] | |
| 6 m, 9 m | 6, 12, 18 m | [50] | |
Table 2.
Specifications of the railing, hedges, and trees incorporated into the skygarden model (present study).
Table 2.
Specifications of the railing, hedges, and trees incorporated into the skygarden model (present study).
| Configuration | Element Type | Element Width (m) | Element Height (m) | Center-to-Center Tree Distance (m) | Blockage Ratio |
|---|---|---|---|---|---|
| a1 | Railing | 0.050 | 1.5 | - | 13% |
| a2 | Railing | 0.050 | 2.0 | - | 17% |
| b1 | Hedge | 1.5 | 1.5 | - | 13% |
| b2 | Hedge | 1.5 | 2.0 | - | 17% |
| c1 | Trees | 2.5 | 2.5 | 2.3 | 16% |
| c2 | Trees | 4.5 | 5.0 | 4.6 | 33% |
Table 3.
Wind speed classification based on pedestrian comfort after Lawson [54].
Table 3.
Wind speed classification based on pedestrian comfort after Lawson [54].
| Threshold of Wind Speed | Quality Class | Original Description | Reference Activity |
|---|---|---|---|
| U > 1.8 m/s | A | Covered area | Sitting long |
| U > 3.6 m/s | B | Pedestrians standing around | Sitting short |
| U > 5.3 m/s | C | Pedestrian walkthrough | Strolling |
| U > 7.6 m/s | D | Roads and car parks | Walking fast |
| U > 15 m/s | E | Dangerous | Unacceptable |
Table 4.
Mesh setup for verification.
| Mesh Config. | Mesh Settings | Number of | |
|---|---|---|---|
| Building Vicinity Sizing | Nodes | Elements | |
| A | 0.25 m | 667,228 | 2,603,555 |
| B | 0.2 m | 552,357 | 2,466,524 |
| C | 0.1 m | 1,049,698 | 3,029,468 |
| D | 0.1 m | 697,824 | 2,714,337 |
Table 5.
Average wind speed in the skygarden at occupants’ height, (base) base configuration, (a1) 1.5 m railing, (a2) 2 m railing, (b1) 1.5 m hedge, (b2) 2 m hedge, (c1) 2.5 m trees, and (c2) 5 m trees.
Table 5.
Average wind speed in the skygarden at occupants’ height, (base) base configuration, (a1) 1.5 m railing, (a2) 2 m railing, (b1) 1.5 m hedge, (b2) 2 m hedge, (c1) 2.5 m trees, and (c2) 5 m trees.
| Case | Base | A1 | A2 | B1 | B2 | C1 | C2 |
|---|---|---|---|---|---|---|---|
| Average wind speeds (m/s) | 11.99 | 4.07 | 2.24 | 4.20 | 2.91 | 3.93 | 4.00 |
Table 6.
Percentage area of skygarden within quality class of C; (a1) railing 1.5 m, (a2) railing 2 m, (b1) hedge 1.5 m, (b2) hedge 2 m, (c1) tree 2.5 m, and (c2) tree 5 m.
Table 6.
Percentage area of skygarden within quality class of C; (a1) railing 1.5 m, (a2) railing 2 m, (b1) hedge 1.5 m, (b2) hedge 2 m, (c1) tree 2.5 m, and (c2) tree 5 m.
| Case | Base | A1 | A2 | B1 | B2 | C1 | C2 |
|---|---|---|---|---|---|---|---|
| Percentage area of skygarden with Quality Class of C or below | 3.68% | 71.84% | 98.60% | 69.02% | 96.01% | 93.10% | 91.09% |
© 2020 by the authors. Licensee MDPI, Basel, Switzerland. This article is an open access article distributed under the terms and conditions of the Creative Commons Attribution (CC BY) license (http://creativecommons.org/licenses/by/4.0/).
Share and Cite
MDPI and ACS Style
Mohammadi, M.; Tien, P.W.; Kaiser Calautit, J. Influence of Wind Buffers on the Aero-Thermal Performance of Skygardens. Fluids 2020, 5, 160. https://0-doi-org.brum.beds.ac.uk/10.3390/fluids5030160
AMA Style
Mohammadi M, Tien PW, Kaiser Calautit J. Influence of Wind Buffers on the Aero-Thermal Performance of Skygardens. Fluids. 2020; 5(3):160. https://0-doi-org.brum.beds.ac.uk/10.3390/fluids5030160
Chicago/Turabian StyleMohammadi, Murtaza, Paige Wenbin Tien, and John Kaiser Calautit. 2020. "Influence of Wind Buffers on the Aero-Thermal Performance of Skygardens" Fluids 5, no. 3: 160. https://0-doi-org.brum.beds.ac.uk/10.3390/fluids5030160