Article

CFD Simulation Study on the Performance of a Modified Ram Air Turbine (RAT) for Power Generation in Aircrafts

by
Magedi Moh M. Saad
1,
Sofian Mohd
2,*,
Mohd Fadhli Zulkafli
2,
Nor Afzanizam Samiran
3 and
Djamal Hissein Didane
4
1
Department of Aeronautical Engineering, Engineering Academy Tajoura, Tripoli 13275, Libya
2
Department of Aeronautical Engineering, Universiti Tun Hussein Onn Malaysia, Parit Raja 86400, Malaysia
3
Department of Mechanical Engineering Technology, Universiti Tun Hussein Onn Malaysia, Pagoh Higher Education Hub, Pagoh, Muar 84600, Malaysia
4
Center for Energy and Industrial Environment Studies, Universiti Tun Hussein Onn Malaysia, Parit Raja 86400, Malaysia
*
Author to whom correspondence should be addressed.
Submission received: 9 September 2021 / Revised: 14 October 2021 / Accepted: 19 October 2021 / Published: 1 November 2021
(This article belongs to the Special Issue Wind and Wave Renewable Energy Systems, Volume II)

Abstract

:
The present paper aims to study the possibility of dispensing an auxiliary power unit (APU) in an aircraft powered by fossil fuels to reduce air pollution. It particularly seeks to evaluate the amount of power generated by the ram air turbine (RAT) using the novel counter-rotating technique while characterizing its optimum axial distance. The ram air turbine (RAT), which is already equipped in aircrafts, was enhanced to generate the amount of energy produced by the APU. The approach was implemented by a CRRAT system. Six airfoil profiles were tested based on 2D models and the best airfoil was chosen for implantation on the RAT and CRRAT systems. The performance of the conventional single-rotor RAT and CRRAT were analyzed using FLUENT software based on 3D models. The adopted numerical scheme was the Navier–Stokes equation with k–ω SST turbulence modeling. The dynamic mesh and user-defined function (UDF) were used to revolve the rotor turbine via wind. The results indicated that the FX63-137 airfoil profile showed a higher performance in terms of the lift-to-drag ratio compared to the other airfoils. The optimum axial distance between the two rotors was 0.087 m of the rotor diameter and the efficiency of the new CRRAT increased to almost 45% compared to the single-rotor RAT.

1. Introduction

Fuel combustion in transportation typically produces the emission of pollutants that cause damage to human health, agriculture, and sensitive ecosystems, as well as contribute to global climate change [1]. The ram air turbine (RAT) is identified as one of the potential technologies that are applicable to reduce the dependency on conventional fossil fuel combustion systems in aircrafts. RAT is a small wind turbine that converts wind energy into electrical energy to operate devices in aircrafts. The conventional system for energy generation in aircrafts, such as the auxiliary power unit (APU) which consumes non-renewable fossil fuels, is detrimental to the environment [2].
The auxiliary power unit (APU) is a small gas turbine engine that makes the aircraft independent of ground power supplies. APU works to support the electrical and air conditioning systems during the main engine shut down, provides pneumatic power for the main engine during start-up, enhances the electrical margin, and mitigates the working engine’s load during flight. The APU unit somehow contributes to several drawbacks of the aircraft system. It is exposed to immediate thermal damage when the performance of the stator component is gradually degraded. The stator in APU is a component that accelerates APU rotational speed to provide sufficient compressed air for self-sustaining operation. Thus, the damage of APU results in unnecessary economic losses and operational safety issues. APU is also identified as an undesirable device in serving power [3]. It was found that eliminating an APU offers a reduction in the weight of an aircraft body, resulting in increased performance and fuel saving [4]. Hence, aircrafts without APU provide economic and ecological benefits.
The RAT concept is one of the potential alternative devices that are applicable to replace the APU system. RAT can be used to generate wind energy during landing operation for the super-charging process of the high-capacity battery. The stored energy is available for future take-off and landing operations. However, the existing conventional RAT in aircrafts produces energy for emergency events only, such as engines failure. Hence, a large backup of power is required for more extended endurance flights, which helps in safe landing [5]. RATs are idle under normal circumstances and used during emergency phases, whereas other power systems, such as APUs, are used to power certain amenities in the aircraft, such as air conditioners and lights before the engine is started [6]. RATs are not sufficiently durable for flights at high altitudes and energy by RATs is only sufficient to maintain aircraft operations during emergency phases until the nearest runway is reached for landing [7]. Thus, modification is required to increase the efficiency of RAT in harvesting energy. It was observed that RAT needs to produce energy at 115–120 kVA to be comparable with the APU ability [8].
The counter-rotating ram air turbine (CRRAT) is one of the potential wind turbine systems that can increase the performance of the conventional single-rotating turbine RAT. The studies that applied the counter-rotating implemented multiple design schemes to meet the required performance. This technology involves the employment of multiple-blade air turbines to maximize the overall efficiency. There are many key players influencing the turbine performances, such as the axial distance and blade design (blade’s profile).
Kumar et al. [9] conducted CFD and an experimental analysis for a single-rotor and counter-rotating wind turbine rotor with 2D and 3D models of the Airfoil (NACA 0012 and NACA 4415) using a multi-reference frame. The results suggested that the output power was increased as the axial distance between the rotors was increased. Xuesong et al. [10] also conducted experimental work of wind tunnel testing to investigate the influence of blade pitch angle and axial distance on the performance of the counter-rotating-type horizontal-axis tidal turbine (HATT). The results showed that the increase in blade pitch angles and axial distance increased the performance of a counter-rotating turbine. The counter-rotating rotors exhibited a higher Cp value and tip-speed ratio range as compared to a single rotor system. Lee et al. [11] compared the performance of a counter-rotating system with a two and four-bladed single-rotor system using the vortex method. The results showed that the efficiency of a counter-rotating wind turbine (CRWT) was 30% higher than a single rotor with a half solidity, but 5% less than a single rotor with equal solidity.
Kumar et al. [9] investigated the characteristics of the upwind primary rotor and the downwind secondary rotor of the contra rotor wind turbine to increase the aerodynamic performance by using computational fluid dynamics (CFD). Three-bladed single and three-bladed contra-rotating rotors were compared by using CFD. The thrust computed produced a linearly steep curve 35% higher for CRWT than SRWT for the same wind speed at 10 m/s. Kumar et al. [12] conducted a simulation and experimental study using the commercial software of Fluent 6.2 and wind tunnel testing, respectively, to analyze the performance of CRWT with different diameters as well as power and torque characteristics. The result showed that there is a power increment for CRWT as compared to the single-rotor wind turbine (SRWT).
Lee et al. [13] used a two-bladed rotor of CRWT and the free wake vortex lattice method in this approach to investigate and analyze the interaction between the front and rare rotors, which the inflow velocity assumption was applied to in this study. The maximum power coefficient of the counter-rotating rotor was increased by 12% from that of the single rotor. It was also found that the distance between the rotors controlled the fluctuation of the power coefficients. Pereira et al. [14] studied the performance of micro air turbines. The performance of different turbines was compared based on fluid flow behaviors. The study outcomes stated that a more effective air turbine with counter-rotating could be achieved by increasing the gap (horizontal distance) and using five blades with the right curvature. Jung et al. [15] reported that the double rotor turbine produced a 65% of power output whereas the single rotor is 43% with the same wind speed and rotor diameter. This approach was conducted by changing the separation distance of those rotors to reach the optimum power. The optimum distance was found equal to 50 mm with a Cp value equal to 0.457. Similarly, more recent studies of a vertical axis CRWT performed by Didane et al. [16,17,18,19] indicated that decreasing the axial distance leads to an increase in the overall performance of the two counter-rotating rotors.
From all the previous research, it is envisioned that CRWT can be employed to improve the RAT design in generating energy. It is also observed that the existing designs of RAT systems do not use the counter-rotating technique in extracting energy from the wind, although its advantages are found to be significant. Thus, this study aims to design and critically evaluate the performance of the RAT with the best airfoil blade system, while adopting the counter-rotating technique by using the CFD simulation approach. However, air-driven energy is challenging for aircraft designers. Such technology is impractical for take-off and normal flight operations, as the device is not durable at high wind speed [20]. Thus, the present study focused on the operation of RAT during the landing phase (decelerate phase) of aircrafts and enhanced the power output in the emergency phase to maintain aircraft flight until it reaches the nearest runway for landing. The energy obtained is stored in the aircraft. The drag produced by the RAT extraction is expected to be capable of recharging the batteries instead of being lost.

2. Materials and Methods

This study was performed based on both 2D and 3D CFD simulation methods using the commercial FLUENT ANSYS v15.0. The 2D simulations were conducted on six different airfoils in order to select the airfoil profile that showed the highest performance in terms of the lift-to-drag ratio for implementation on the CRRAT and SRRAT systems, which were designed and simulated based on 3D models afterwards.

2.1. Governing Equations

The Navier–Stokes equations based on the law of conservation of the physical properties of fluid flow were used as the governing equations of the simulation process. The continuity and momentum equations in their conservative form are given in Equations (1) and (2), respectively. For the purpose of solving the governing formulas, the Finite Volume Method and Moving Reference Frame (MRF) technique were used and hence modulated the flow surrounding both the single-rotor wind turbine and counter-rotating wind turbine.
D ρ D t + ρ U i x i = 0
ρ U j t + ρ U i U j x i = P x j τ i j x i + ρ g i
where:
τ i j = μ ( U j x i + U i x j ) + 2 3 δ i j μ U k x k
The properties are as follows: local change of time, ρ U j t ;
  • momentum convection, ρ U i U j x i ;
  • surface force, P x j ;
  • molecular-dependent momentum exchange, τ i j x i ; and
  • mass force, ρ g i .
The two-equation k-ω shear stress transport (SST) turbulence equation was used as the turbulence model. Equation (4) shows the specific turbulent kinetic energy, k, while the specific turbulent frequency, ω, is shown in Equation (5).
( ρ k ) t + ( ρ U i k ) x i = P ˜ k β * ρ k ω + x i [ ( μ + σ k μ t ) k x i ]
( ρ ω ) t + ( ρ U i ω ) x i = α ρ S 2 β ρ k ω 2 + x i [ ( μ + σ ω μ t ) ω x i ] + 2 ( 1 F 1 ) ρ σ ω ,     2 1 ω k x i ω x i
where P ˜ k and F 1 are the rate of the production of turbulent kinetic energy and the blending function, respectively. Meanwhile, μ t is the modified eddy viscosity, while σ k and σ ω are the diffusion constants of the models.

2.2. Model Geometry, Domain, and Mesh Setup of Airfoil

In this section, six airfoils were tested, as shown in Figure 1. The types of airfoils were NACA 63415, S835, S809, FX63-137, FX76-100, and NACA 63-215 [21,22,23,24,25,26]. The details of the airfoil thickness are presented in Table 1. The optimum design of the airfoil was justified based on the maximum value of L/D. Analysis of the lift and drag forces was investigated and compared between those airfoils. Figure 2 shows the geometry and boundary conditions for the simulation of airfoils. The simulation was performed for a two-dimensional domain in which the tip effects were not considered. Reynolds number for the turbine was set at Re = 4 × 10⁶.
The airflow speed and pressure subjected to the airfoil were set at 70 m/s and under atmospheric conditions, respectively. The outflow boundary condition was set at a static pressure of 1 atm. The velocity inlet was set according to the direction of the angle of attack. Various angles of attack were examined for a freestream velocity of U m/s. The formulas of specific inlet conditions used were u = Ucos α and v = Ucos α. The simulation was also set as unsteady-state-type, with ideal gas as a fluid domain, and Standard k-ω SST as a turbulence model [20,24,27,28]. The grid used for the simulations was designed using GAMBIT and is shown in Figure 3. All grids are structured C-Type mesh [29,30,31,32] with a total of 10,723 grid points.

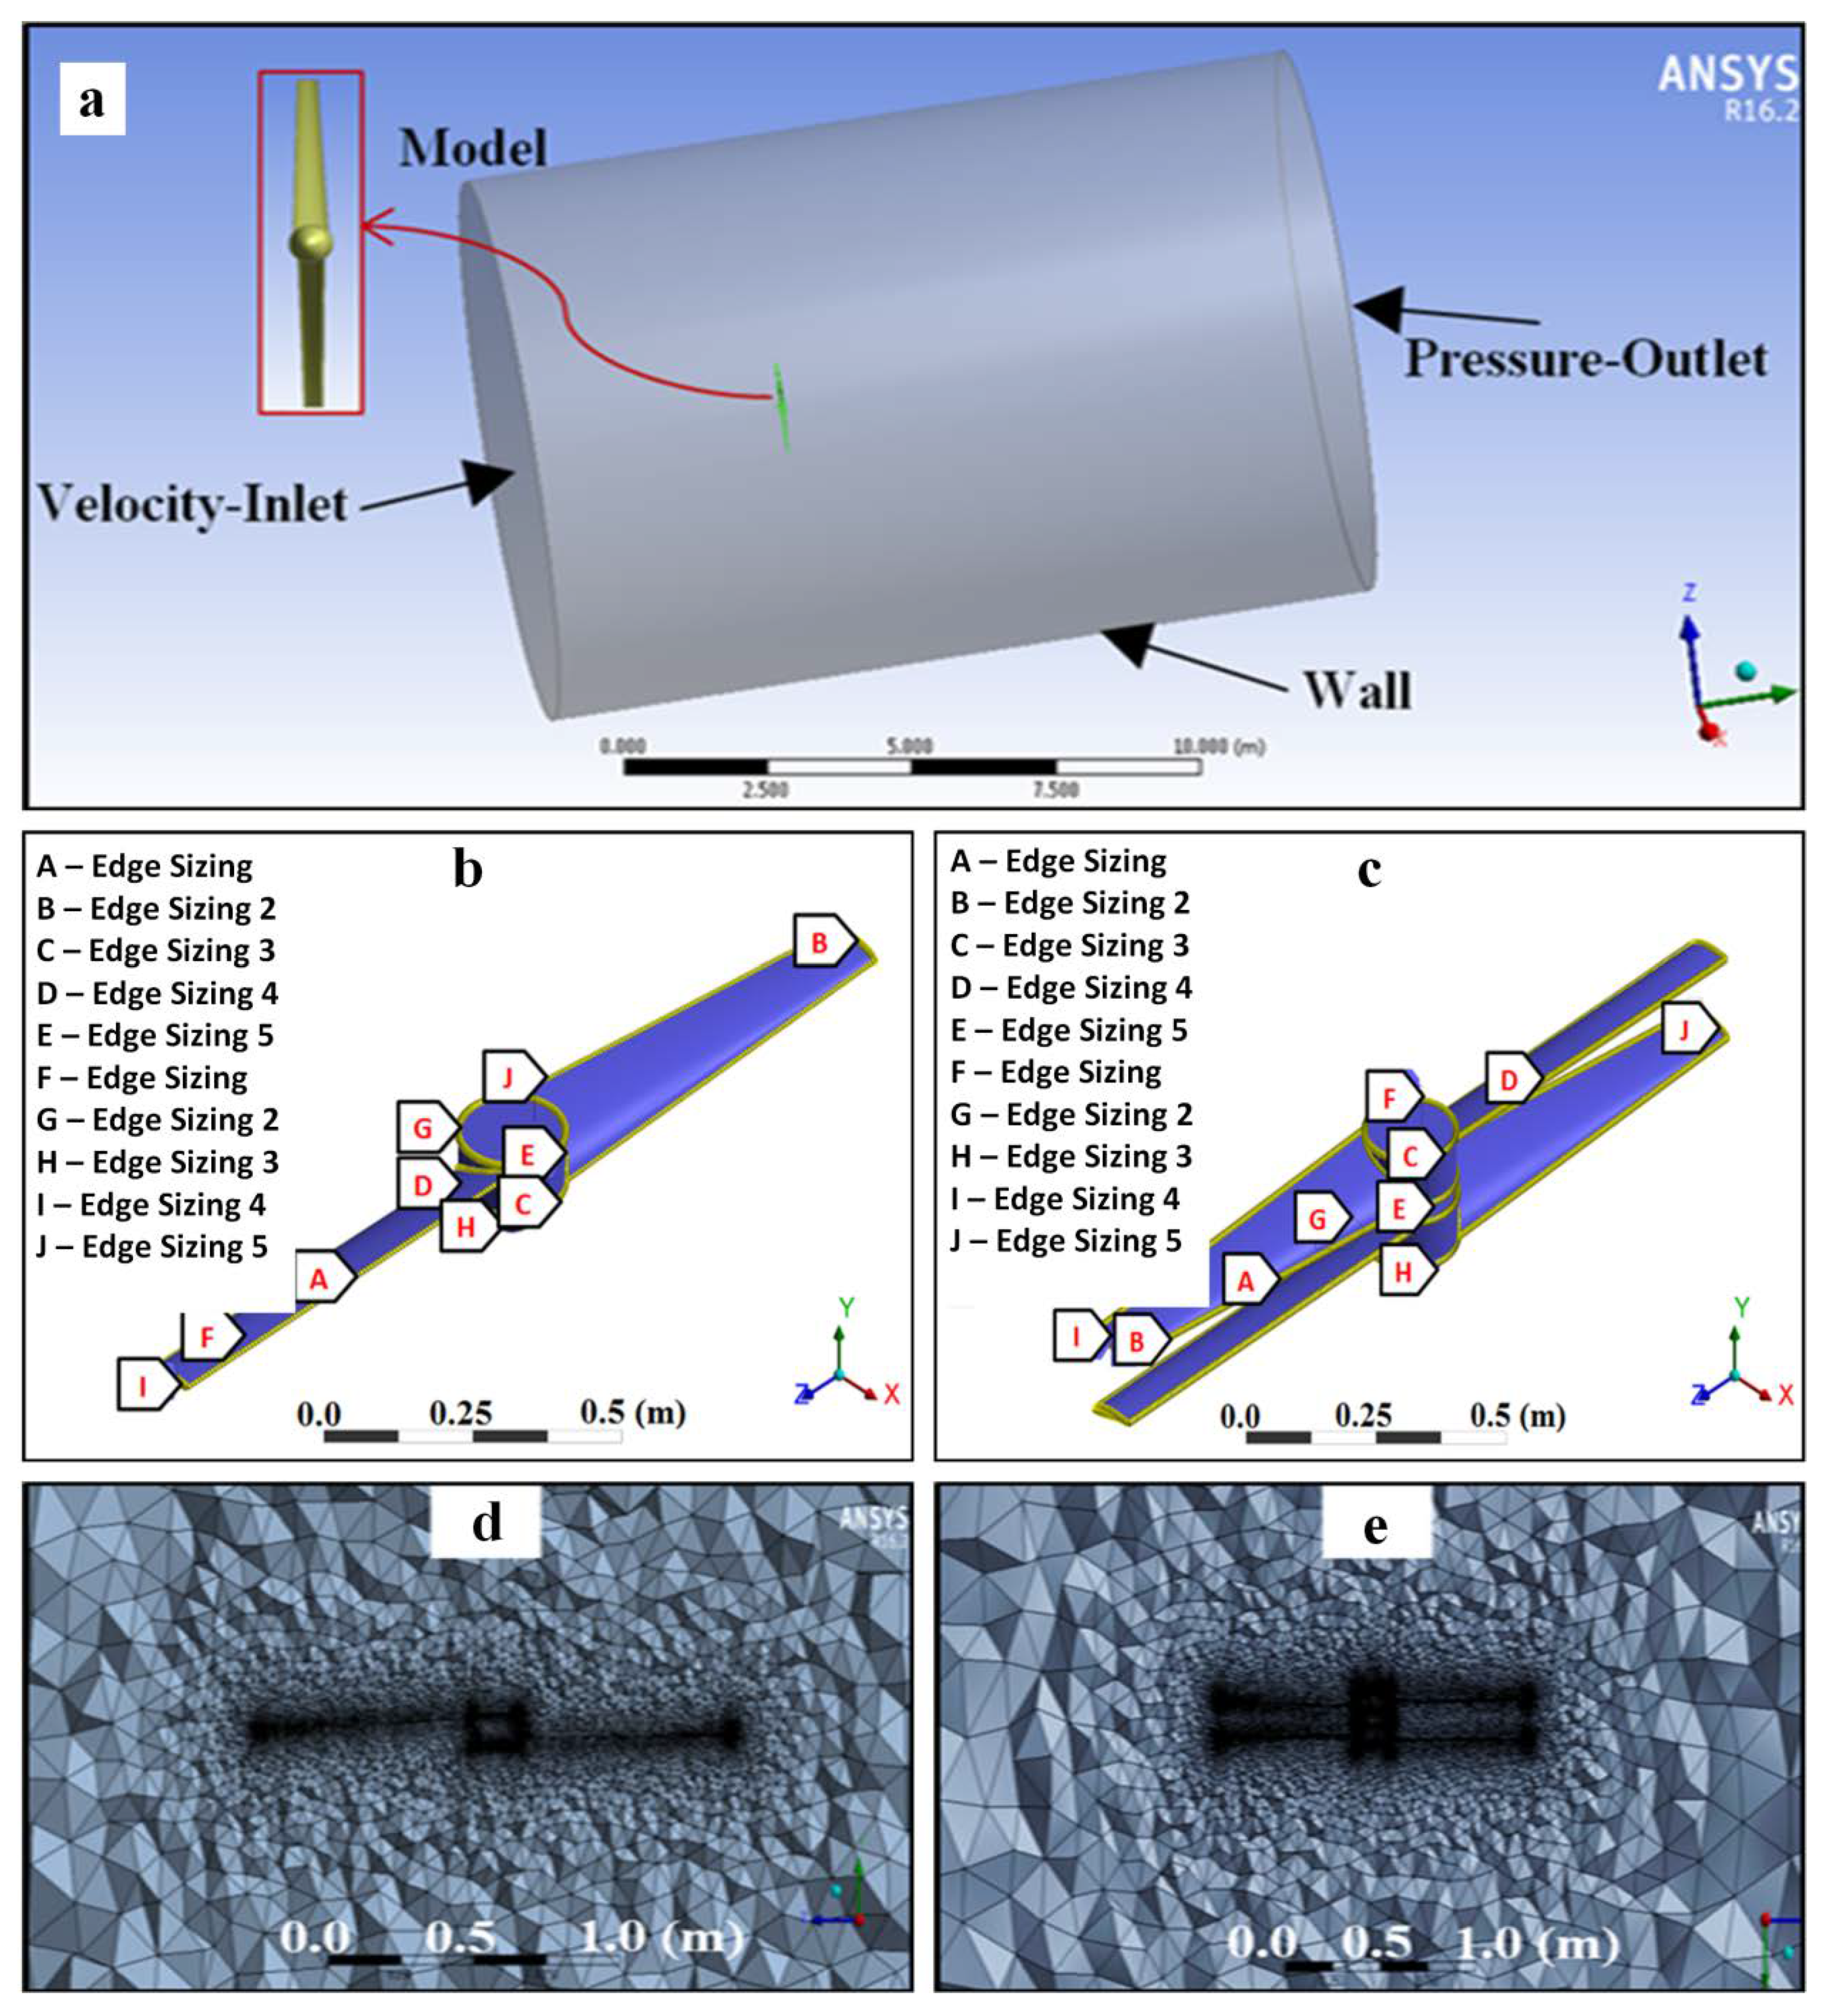
2.3. Domain, Boundary Conditions, and Mesh of the CRRAT and SRRAT System

Figure 4 shows the geometry and boundary conditions for the simulation of the CRRAT and SRRAT systems. The distance of the rotor from the inlet and outlet were estimated at 1 and 2 L/D of the cylinder domain boundary, respectively [29,30,31,32,33,34]. Pressure far-fields were set as the boundary condition at the lateral boundaries. The inlet, outlet, and turbine domain were set as the inlet velocity at 70 m/s, the pressure outlet at 101,325 Pa, and the wall (non-slip wall), respectively. In this case, three-dimensional meshes were implemented. The grid quality was dependent on the degree of skewness and orthogonal quality [33,34,35,36]. Thus, each critical edge position, as in Figure 4b,c, required an appropriate mesh size set-up. High-quality mesh exhibits a skewness value of closer to zero. In this case, the maximum skewness was recorded at less than 0.85. The total number of mesh elements for SRRAT and CRRAT were 2,574,225 and 13,414,878, respectively, and the mesh generated for both models is depicted in Figure 4d,e.

2.4. Solver Setup

The rotation of the rotor was rendered by using dynamic mesh and the User Defined Function (UDF). The physical properties, such as mass properties and the rotational axis of the rotor, were defined in the UDF medium written in C-language. The size of the time step was set at 1 × 10⁻⁵ s. The solver, space, time, and velocity conditions were set as pressure-based, 3D, transient, and absolute conditions, respectively. The fluid properties for the boundary condition were set for an air medium with a density and dynamic viscosity of 1.125 (kg/m3) and 1.789 × 10⁻⁵ (kg/m·s), respectively. The turbulence specification method used the intensity and hydraulic diameter scheme. The adopted numerical scheme was the Navier–Stokes equation with k–ω SST turbulence-modeling.

2.5. Model Validation

The validation of the present work is presented in this section. The results of the lift and drag coefficient of the FX63-137 airfoil for 106 Reynolds numbers that were obtained using FLUENT were compared with the previous experimental results of the wind tunnel test [23], as shown in Figure 5. The FLUENT results showed a good agreement with the experimental results for the lift and drag coefficient. Results of the numerical study proved that the optimized airfoil FX63-137 demonstrated high aerodynamic performance in high wind speeds, which was later adopted for the analysis of both CRRAT and SRRAT.

3. Results and Discussion

The performance analysis for the CRRAT system study is comprised of two parts. The first part embodies the aerodynamic performance analysis on the different shapes of airfoils at different angles of attack. The optimum design and shape of the airfoil in the first part is then implemented in the second part. The second part involves a comparative study between the performances of a CRRAT system with two-bladed co-rotating and counter-rotating rotors and a conventional SRRAT system. The potential of the CRRAT system to be implemented in aircrafts was also evaluated in this section.

3.1. Part 1: Airfoil Analysis

3.1.1. Pressure and Velocity Contour of Airfoil

The normal pressure drag depends upon the viscosity of the air and is related to flow separation. Figure 6 shows the pressure distribution of six airfoils at different angles of attacks, specifically AOA (α = 0, α = 7, 12, and α = −7). At low AOA, the high pressures near the leading edge produced a component of force in the rearward (i.e., drag) direction, while the low pressures above the airfoil body (maximum thickness point) tended to pull the wing section forward, giving a thrust effect. Figure 6 also shows that the pressure was decreased at the leading-edge region as the AOA of the wing section increased, hence increasing the suction effect. This caused the pressure at the lower pressure region to increase when the air moved further downstream. The pressure gradient became more significant as the angle of attack increased.
Figure 7 shows contour plots of the velocity distributions at AOA of α = 0°, α = 7° α = 12°, and α = −7° for Reynolds numbers of 4 × 10⁶, corresponding to an airspeed of U = 70 m/s. The essential features of the flow over an airfoil were visible, indicating that at least qualitatively accurate results emerge, depicting a stagnation point at the leading edge and trailing edge of the airfoil, and at the wake behind the airfoil where fluids must accelerate to match the free stream. By comparing the detailed flow fields of the airfoils, the effect of separation on the airfoils’ boundary layers was analyzed. There is a subtle flow separation in the trailing edge. Beginning with angle α = 12°, the separation became larger and significantly influenced the wing characteristics, increasing the drag force and decreasing the lift force.
It is observable that the pressure on the upper surface is negative, while the velocity on the upper surface is higher than the reference velocity. Whenever there are high-velocity vectors, we have low pressures and vice versa.

3.1.2. Drag Coefficient, Lift Coefficient, and Angle of Attack

This section aims to select the optimum airfoil by the maximum C l / C d ratio of the six airfoils. The FLUENT results shown in Figure 8 indicate that the maximum C l / C d   for FX63-137 was around 110.725 and occurred at the angle of attack of 5°, which is the optimum angle of attack, α FX63-137 also exhibited the maximum C l   of 1.7213, which occurred at the angle of 15°, as shown in Figure 8. In addition, the lift coefficient of FX63-137 at 0° angle of attack was higher (0.923) as compared to the other airfoils, which ranged between 0.18 and 0.35, as shown in Figure 9. The simulation results hence conclude that the airfoil type of FX63-137 was the optimum design in terms of aerodynamic performance in the high Reynolds number flow region. Results of the numerical study proved that the optimized airfoil FX63-137 demonstrated high aerodynamic performance at high wind speeds.

3.2. Part 2: CRRAT and SRRAT Analysis

3.2.1. Effect of Rotor Axial Distance in the CRRAT System

The effect of the axial distance between the front and rear rotor in the CRRAT system was thoroughly studied in this section. The numerical simulation was performed for various setups of axial distances, including 10 cm, 14 cm, and 17 cm. The results showed that the rotor produces drag coefficients of 0.55, 0.58, and 0.57 for the front rotor at the axial distances of 10 cm, 14 cm and 17 cm, respectively. For the rear rotor, the drag coefficients produced were 0.51, 0.56, and 0.55 for the axial distances of 10 cm, 14 cm, and 17 cm, respectively. The analysis results also depicted that the counter-rotating system achieved higher efficiencies of 13.72% and 9.04% for the front and rear rotor, respectively, at an axial distance of 14 cm, as compared to the axial distance of 10 cm and 17 cm, as shown in Figure 10.
Figure 10 also illustrates that the rotational speeds for all cases were reaching steady states at an average time-step of 0.34 s. The speed of the front rotor at axial distances of 10, 14, and 17 cm were 4960.189, 5246.002, and 5016.204 rpm, respectively. The speed for the rear rotor at axial distances of 10, 14, and 17 cm were 4609.219, 5034.083, and 4759.33 rpm, respectively. At an axial distance of 10 cm, the vortices produced from the front rotor blades will affect the rear rotor, as illustrated in Figure 11a. At an axial distance of 17 cm, the vortices produced from the distance between the rotor hubs acted on the rear rotor performance, whereas at an axial distance of 14 cm, no significant effects of the distance between the rotor hubs and the short distance between the rotor blades were observed in Figure 11b,c.

3.2.2. Comparative Performance between CRRAT and SRRAT

The comparison between SRRAT and CRRAT at an optimum axial distance of 14 cm was simulated at the same boundary conditions. As shown in Figure 12, the SRRAT and CRRAT exhibited steady states at the time-step of 0.3 s. At the time-step of 0 s to 0.1 s, the speed of the front rotor was higher and no significant difference in the performance of the rear rotor was observed as compared to the single rotor. The results are consistent with the previous experimental study [37]. For the time-step above, specifically 0.1 s (high rpm), no significant difference of speed for the front rotor was observed as compared to the single rotor. The rear rotor kept increasing as the time-step increased.
The speed of SRRAT was recorded at 5278.428 rpm, whereas the front and rear rotors were 5246.002 rpm and 5034.083 rpm, respectively, as the speed was in a steady-state condition. At time 0 s, the air velocity started to increase between the front and rear rotor due to the blade shape, thus increasing the rotational speed of the front rotor. At low rotational speed, the airflow at the rear rotor was reflected back to the front rotor, which caused the rotational speed to increase. Figure 13a,b shows the flow stream region of the CRRAT at 0.004 and 0.006 s, whereas Figure 13c shows the flow stream region of the SRRAT at 0.004 s. It could also be observed that the maximum velocity occurs at the tip of both the single-rotor (Figure 13c) and dual-rotor CRRAT (Figure 13a,b). Moreover, the existence of the second rotor (Figure 13a,b) has created more turbulence due to the shear stem from the velocity difference and the velocity has both increased and changed direction. Thus, the rotor at the rear, which rotates in the opposite direction to the rotor in front, took advantage of this phenomenon and received increased velocities. However, the effect of vortex shading was more profound for the single-rotor RAT compared to the dual-rotor RAT design.

3.2.3. SRRAT Performance at High Altitudes

The specified magnitude at 10,000 m was set as the aircraft landing altitude, where the air density is equal to 0.4135 kg/m3 (reduced around three times) and viscosity is equal to 1.458 × 10⁻⁵ kg/ms. The maximum speeds were 5278 rpm and 5234.743 rpm at sea level and high altitude, respectively. Figure 14 shows that the time achieved to reach a steady-state for the single rotor at sea level was lower compared to the condition at high altitudes. The power output of the RAT at sea level was 62,361.307 W, as shown in Table 2, whereas the power output at a high altitude decreased to 20,653.069 W. Single rotors at sea level are hence attributed to higher performance as compared to single rotors operating at a high altitude. The total power that can be produced by RAT at sea level and high altitudes is 41507.184W. This proved that the following equation could be applied to the CRRAT system.

4. Conclusions

The present paper investigated the possibility of replacing the auxiliary power unit (APU) by improving the performance of a conventional ram air turbine (RAT) for power generation in aircrafts. The investigation focused on the counter-rotating technique to increase the performance of RAT by CFD analysis. The objectives were achieved successfully and concluding remarks are listed as follows:
(1)
A comparative study of six airfoils has been performed by the 2-D CFD simulation method. The airfoil FX63-137-type showed a higher maximum lift-to-drag ratio at 110.725 as compared to the other airfoils. The aerodynamic characteristic of airfoil FX63-137 was validated at the same Reynolds number by the previous study and the result was in good agreement with experimental results.
(2)
A three-dimension numerical simulation of a counter-rotating ram air turbine (CRRAT) was performed to select the optimum axial distance between the rotors. The optimum axial distance was calculated at 0.087d (14 cm), where the rotor performance increased by 13.72% and 9.04% compared with those at 0.062d (10 cm) and 0.106d (17 cm), respectively.
(3)
From the CFD analysis, the power produced by the single rotor was 62.36 kW (at sea level), whereas the counter-rotating rotor at an optimum axial distance was 113.26 kW (at sea level), and the performance of the RAT increased by almost 45% when the counter-rotating technique was used, as compared to the single-rotor ram air turbine. The counter-rotating system efficiency increased due to the addition of the second rotor (rear rotor) and also due to the simultaneous operation of the two rotors.

Author Contributions

M.M.M.S. was responsible for designing the models, running the simulation, and obtaining the results. M.F.Z. and N.A.S. wrote the paper. D.H.D. was responsible for analyzing the data and for the validation. S.M. reviewed and edited the work, was responsible for acquiring funding, and was the main supervisor of the project. All authors have read and agreed to the published version of the manuscript.

Funding

This research study was funded by Universiti Tun Hussein Onn Malaysia, grant number H772, and the APC was also funded by H772.

Institutional Review Board Statement

Not applicable.

Informed Consent Statement

Not applicable.

Data Availability Statement

Exclude this statement.

Acknowledgments

The authors acknowledge the technical support provided by the Computational Fluid Dynamics (CFD) laboratory at the Faculty of Mechanical and Manufacturing Engineering, Universiti Tun Hussein Onn, Malaysia.

Conflicts of Interest

The authors declare no conflict of interest. The funders had no role in the design of the study; in the collection, analyses, or interpretation of data; in the writing of the manuscript, or in the decision to publish the results.

Nomenclature

Acronyms
APUauxiliary power unit
CFDcomputational fluid dynamics
CRRATcounter-rotating ram air turbine
MRFMoving Reference Frame
SRRATsingle-rotor ram air turbine
SSTshear stress transport
UDFuser-defined function
Greek Letters
αangle of attack (degree)
εturbulence dissipation rate (m2 s−3)
τshear stress (N/m2)
μfluid viscosity (kg/(s.m))
vkinematic viscosity (m2/s)
ωturbulence dissipation rate (s−1)
μfluid viscosity (kg/(s.m))
Latin Letters
CdCd
ClCl
gg
kk
RR
UU

References

  1. Schipper, L. Energy Conservation and the Environment: Conflict or Complement? 1978. Available online: https://www.osti.gov/servlets/purl/6239110 (accessed on 7 June 2021).
  2. Hu, S.; Fruin, S.; Kozawa, K.; Mara, S.; Winer, A.M.; Paulson, S.E. Aircraft emission impacts in a neighborhood adjacent to a general aviation airport in Southern California. Environ. Sci. Technol. 2009, 43, 8039–8045. [Google Scholar] [CrossRef] [PubMed]
  3. Unique (Flughafen Zürich AG), P.O.; Box, CH-8058 Zurich. Fixed Energy Systems for Aircraft at Zurich Airport. Environmental Services and Technical Facility Management [[email protected]]. 2009. Available online: http://www.unique.ch; http://www.obsa.org/Lists/.../353/Fixed_energy_systems_aircraft_Zurich_AirportEN.pdf (accessed on 9 July 2021).
  4. Yuan, W. Second-Generation High-Temperature Superconducting Coils and Their Applications for Energy Storage; Springer Science & Business Media: Berlin, Germany, 2011. [Google Scholar]
  5. Aircraft Ground Energy System Ages. IST-Edelstahl-Anlagenbau AG. Schorenstrasse 54 CH 3645 Thun-Gwatt, Switzerland. 2014. Available online: https://www.airport-suppliers.com/supplier/ist-edelstahl-anlagenbau-ag/ (accessed on 17 August 2021).
  6. Cramoisi, G. Air Crash Investigations: Running Out of Fuel, How Air Transat 236 Managed to Fly 100 Miles without Fuel and Land Safely; Lulu.com: Morrisville, CA, USA, 2010. [Google Scholar]
  7. Weimerskirch, H.; Martin, J.; Clerquin, Y.; Alexandre, P.; Jiraskova, S. Energy saving in flight formation. Nature 2001, 413, 697. [Google Scholar] [CrossRef] [PubMed]
  8. Zolidis, M.J. Emergency airplane RATs. Present. IEEE Rock River Val. Sect. 2006, 6, 1–35. [Google Scholar]
  9. Kumar, P.S.; Bensingh, R.J.; Abraham, A. Computational analysis of 30 kW contra rotor wind turbine. ISRN Renew. Energy 2012, 2012, 939878. [Google Scholar] [CrossRef] [Green Version]
  10. Wei, X.; Huang, B.; Liu, P.; Kanemoto, T.; Wang, L. Experimental investigation into the effects of blade pitch angle and axial distance on the performance of a counter-rotating tidal turbine. Ocean. Eng. 2015, 110, 78–88. [Google Scholar] [CrossRef]
  11. Lee, S.; Kim, H.; Lee, S. Analysis of aerodynamic characteristics on a counter-rotating wind turbine. Curr. Appl. Phys. 2010, 10, S339–S342. [Google Scholar] [CrossRef]
  12. Kumar, P.S.; Abraham, A.; Bensingh, R.J.; Ilangovan, S. Computational and Experimental Analysis of a Counter-Rotating Wind Turbine System; NISCAIR-CSIR: New Delhi, India, 2013. [Google Scholar]
  13. Lee, S.; Son, E.; Lee, S. Velocity interference in the rear rotor of a counter-rotating wind turbine. Renew. Energy 2013, 54, 235–240. [Google Scholar] [CrossRef]
  14. Pereira, J.C.F.; da Silva Chaves Fernandes Pereira, J.M.; Ferreira, R.M.C. Computational Simulation in a Counter-Rotating Horizontal Axis Turbine; LASEF, Mechanical Engineering Department, Instituto Superior Técnico/Technical University of Lisbon: Lisbon, Portugal, 2009. [Google Scholar]
  15. Jung, S.N.; No, T.S.; Ryu, K.W. Aerodynamic performance prediction of a 30 kW counter-rotating wind turbine system. Renew. Energy 2005, 30, 631–644. [Google Scholar] [CrossRef]
  16. Didane, D.H.; Rosly, N.; Zulkafli, M.F.; Shamsudin, S.S. Performance evaluation of a novel vertical axis wind turbine with coaxial contra-rotating concept. Renew. Energy 2018, 115, 353–361. [Google Scholar] [CrossRef]
  17. Didane, D.H.; Rosly, N.; Zulkafli, M.F.; Shamsudin, S.S. Numerical investigation of a novel contra-rotating vertical axis wind turbine. Sustain. Energy Technol. Assess. 2019, 31, 43–53. [Google Scholar] [CrossRef]
  18. Didane, D.H.; Maksud, S.M.; Zulkafli, M.F.; Rosly, N.; Shamsudin, S.S.; Khalid, A. Performance investigation of a small Savonius-Darrius counter-rotating vertical-axis wind turbine. Int. J. Energy Res. 2020, 44, 9309–9316. [Google Scholar] [CrossRef]
  19. Didane, D.H.; Maksud, S.M.; Zulkafli, M.F.; Rosly, N.; Shamsudin, S.S.; Khalid, A. Experimental Study on the Performance of a Savonius-Darrius Counter-Rotating Vertical Axis Wind Turbine. In IOP Conference Series: Earth and Environmental Science; IOP Publishing: Bristol, UK, 2019; Volume 268, p. 012060. [Google Scholar]
  20. Moir, I.; Seabridge, A. Design and Development of Aircraft Systems; John Wiley & Sons: Hoboken, NJ, USA, 2012; Volume 68. [Google Scholar]
  21. Ragheb, M.; Ragheb, A.M. Wind turbines theory-the betz equation and optimal rotor tip speed ratio. In Fundamental and Advanced Topics in Wind Power; InTech: Rijeka, Croatia, 2011. [Google Scholar]
  22. Jamdade, P.G.; Patil, S.V.; Jamdade, S.G. Assessment of Power Coefficient of an Offline Wind Turbine Generator System. Electron. J. Energy Environ. 2013, 1, 41–48. [Google Scholar] [CrossRef] [Green Version]
  23. Gao, X.; Hu, J. Numerical simulation to the effect of rotation on blade boundary layer of horizontal axial wind turbine. In Proceedings of the World Non-Grid-Connected Wind Power and Energy Conference (WNWEC), Nanjing, China, 5–7 November 2010; pp. 1–4. [Google Scholar]
  24. Drumheller, D.P.; D’Antonio, G.C.; Chapman, B.A.; Allison, C.P.; Pierrakos, O. Design of a micro-wind turbine for implementation in low wind speed environments. In Proceedings of the Systems and Information Engineering Design Symposium (SIEDS), Charlottesville, VA, USA, 24–24 April 2015; pp. 125–130. [Google Scholar]
  25. Zhang, C.; Hu, J. The UAE wind turbine performance prediction using wind tunnel airfoil data. In Proceedings of the World Non-Grid-Connected Wind Power and Energy Conference (WNWEC), Nanjing, China, 5–7 November 2010; pp. 1–5. [Google Scholar]
  26. Chaudhary, U.; Nayak, S.K. Micro and small-scale HAWT blades airfoils study through CFD for low wind applications. In Proceedings of the India Conference (INDICON), 2015 Annual IEEE, New Delhi, India, 17–20 December 2015; pp. 1–6. [Google Scholar]
  27. Percis, E.S.; Ramesh, L.; Nalini, A. In Proceedings of the Investigation of Harnessing High Altitude Tethered Rotorcraft Wind Systems. Tiruchengode, India, 27–29 December 2012. [Google Scholar]
  28. Kaminsky, C.; Mokhtar, W. A CFD Study of Wind Turbine Aerodynamics. In Proceedings of the 2012 ASEE North Central Section Conference, Toledo, OH, USA, 24 March 2012. [Google Scholar]
  29. Ceyhan, O. Towards 20MW wind turbine: High Reynolds number effects on rotor design. In Proceedings of the 50th AIAA Aerospace Sciences Meeting including the New Horizons Forum and Aerospace Exposition, Nashville, TN, USA; 2012; p. 1157. [Google Scholar]
  30. Lee, N.J.; Kim, I.C.; Kim, C.G.; Hyun, B.S.; Lee, Y.H. Performance study on a counter-rotating tidal current turbine by CFD and model experimentation. Renew. Energy 2015, 79, 122–126. [Google Scholar] [CrossRef]
  31. Park, S.; Park, S.; Rhee, S.H. Influence of blade deformation and yawed inflow on performance of a horizontal axis tidal stream turbine. Renew. Energy 2016, 92, 321–332. [Google Scholar] [CrossRef]
  32. Digraskar, D.A. Simulations of Flow Over Wind Turbine. Master’s Theses, University of Massachusetts Amherst, Amherst, MA, USA, 2010; pp. 1–84. [Google Scholar]
  33. Manwell, J.F.; McGowan, J.G.; Rogers, A.L. Wind Energy Explained: Theory, Design and Application; John Wiley & Sons: Hoboken, NJ, USA, 2010. [Google Scholar]
  34. Sun, Y.; Zhang, L. Numerical simulation of the unsteady flow and power of horizontal axis wind turbine using sliding mesh. In Proceedings of the Power and Energy Engineering Conference (APPEEC), 2010 Asia-Pacific, Chengdu, China, 28–31 March 2010; pp. 1–3. [Google Scholar]
  35. Qiu, M.; Zhou, Z.; Zhang, J. Three-dimensional flow simulation for horizontal axis wind turbine. In Proceedings of the World Non-Grid-Connected Wind Power and Energy Conference (WNWEC), Nanjing, China, 24–26 September 2009; pp. 1–4. [Google Scholar]
  36. Hartwanger, D.; Horvat, A. 3D modelling of a wind turbine using CFD. In Proceedings of the NAFEMS Conference, The New Forest, UK, 18 June 2008. [Google Scholar]
  37. Kanyako, F.; Janajreh, I. Investigating blade performance of small horizontal axis wind turbine based on blade element momentum theory. In Proceedings of the Applications of Information Technology to Renewable Energy Processes and Systems (IT-DREPS), 2013 1st International Conference & Exhibition, Amman, Jordan, 29–31 May 2013; pp. 85–90. [Google Scholar]
Figure 1. Airfoil geometry.
Fluids 06 00391 g001
Figure 2. Boundary zone for airfoil.
Fluids 06 00391 g002
Figure 3. Mesh around airfoil.
Fluids 06 00391 g003
Figure 4. (a) Boundary condition; geometry with mesh sizing at edge location for (b) SRRAT and (c) CRRAT; and structure of saturated, fine, and coarse mesh for (d) SSRAT and (e) CRRAT.
Fluids 06 00391 g004
Figure 5. The validation results for FX63-137 of FLUENT and the experimental work presented in [34] (a) lift coefficient vs. the angle of attack α° (b) lift coefficient, wherein C l vs. the drag coefficient   C d .
Fluids 06 00391 g005
Figure 6. Pressure contour around airfoils.
Fluids 06 00391 g006
Figure 7. Velocity contour around airfoils.
Fluids 06 00391 g007
Figure 8. The C l / C d coefficient as a function of α° and the lift coefficient as a function of the drag coefficient.
Fluids 06 00391 g008
Figure 9. Lift coefficient at 0° angle of attack.
Fluids 06 00391 g009
Figure 10. Relationships between rpm and time step.
Fluids 06 00391 g010
Figure 11. Velocity streamline at an axial distance of (a) 10 cm, (b) 14 cm, and (c) 17 cm.
Fluids 06 00391 g011
Figure 12. Comparison between SRRAT and CRRAT at an axial distance of 14 cm.
Fluids 06 00391 g012
Figure 13. Velocity streamline (a) at time 0.004 s and at an axial distance of 14 cm, and (b) at time 0.006 s and at an axial distance of 14 cm; (c) single rotor.
Fluids 06 00391 g013
Figure 14. Relationship between rpm and time step.
Fluids 06 00391 g014
Table 1. Thickness and maximum thickness for airfoils.
NACA 63-415FX76-100S835S809FX63-137NACA 63-215
Thickness15%10.07%21.05%21%13.70%10.07%
Max. thickness from leading edge34.90%27.30%30.70%36.40%29.20%27.30%
Table 2. Power of rotor calculation.
RPMIyyωTimeαTorquePower
At sea level5278.40.0674552.50.331674.2112.962,361.3 W
At high altitudes5234.70.0674547.90.98559.137.720,653.7 W
Publisher’s Note: MDPI stays neutral with regard to jurisdictional claims in published maps and institutional affiliations.

