Article

The Effect of Patterned Micro-Structure on the Apparent Contact Angle and Three-Dimensional Contact Line

1
Institute of Aerospace Thermodynamics (ITLR), University of Stuttgart, 70569 Stuttgart, Germany
2
Institute of Microstructure Technology (IMT), Karlsruhe Institute of Technology, 76344 Eggenstein-Leopoldshafen, Germany
*
Author to whom correspondence should be addressed.
Submission received: 26 January 2021 / Revised: 11 February 2021 / Accepted: 13 February 2021 / Published: 23 February 2021
(This article belongs to the Special Issue Experimental Thermodynamics in Droplet Interactions)

Abstract

:
The measurement of the apparent contact angle on structured surfaces is much more difficult to obtain than on smooth surfaces because the pinning of liquid to the roughness has a tremendous influence on the three phase contact line. The results presented here clearly show an apparent contact angle variation along the three phase contact line. Accordingly, not only one value for the apparent contact angle can be provided, but a contact angle distribution or an interval has to be given to characterize the wetting behavior. For measuring the apparent contact angle distribution on regularly structured surfaces, namely micrometric pillars and grooves, an experimental approach is presented and the results are provided. A short introduction into the manufacturing process of such structured surfaces, which is a combination of Direct LASER Writing (DLW) lithography, electroforming and hot embossing shows the high quality standard of the used surfaces.

1. Introduction

For technical applications, the flexible “designing” of wettability is very promising in a large field of applications, for example, in spray painting, spray cooling, gluing or applying hydrophobic coatings to avoid surface contamination. The wettability and thus the solid-liquid interaction can be adjusted by the magnitude of roughness or by adjusting the shape and pattern of roughness features, to list two out of several possibilities. As an outcome, one can get desirable wetting and dewetting behavior [1,2], well defined spreading directions [3,4] or a customized droplet shape for deposited droplets [5,6,7,8]. For impacting droplets, the splashing/non-splashing limit or droplet spreading [9,10,11,12,13], as well as the direction of rebounding droplets, can be modified [14]. The latter effect is achieved using a gradient in wettability obtained by a special roughness pattern [14]. The focus of the following paper shall not be the droplet impacts with high energy but the interaction of gently placed droplets on surfaces with a regular structure and especially how to easily measure the apparent contact angles of such.
The droplet behaviour of gently placed liquid droplets on structured surface patterns is significantly different to the droplet behaviour on smooth surfaces of the same material, which was recently shown by Huang and Gates [5]. Analytically, the equilibrium contact angle θ e on smooth surfaces at a steady three-phase contact line can be calculated by the Young-Equation (1), in which γ represents the free surface energy of the interfaces solid–liquid (index SL), solid–vapor (index SV) and liquid–vapor (index LV) [15].
γ S V γ S L = γ L V cos θ e .
The differences in contact angles between smooth and rough surfaces has already been investigated by Wenzel (1936) [16] as well as by Cassie and Baxter (1944) [17] in the middle of the 20th century. They have introduced a roughness parameter r describing the surface roughness using the quotient of the total area A t o t and the projected area A p r o j
r = A t o t A p r o j ,
or a factor ϕ S relating the wetted area to the total projected surface area. The change of wetted surface in relation to the other surfaces leads to an altering of the respective free surface energies and, therefore, to a change in the equilibrium state defined in Young’s equation (Equation (1)). This circumstance is then reflected in altering contact angles in dependency of the surface roughness. According to Wenzel’s law, the roughness will amplify the existing wetting properties, namely hydrophilicity and hydrophobicity [18], in the case of water. The topographic influence on the surface energies, namely pinning, is not considered in Wenzel’s law. That is why the apparent contact angle of liquids on rough but hydrophilic surfaces might also be higher than the apparent contact angle on the same but smooth surface, although Wenzel’s law is predicting the opposite behavior. According to Gibbs, the advancing contact angle θ at an edge with an angle ξ can be increased in relation to the contact angle θ s m o o t h observed on smooth surfaces until it is exhibiting the critical contact angle θ c r i t [19,20]. From geometric considerations this results into:
θ c r i t = θ s m o o t h + ( π ξ ) .
Consequently, it is questionable whether the found laws of Wenzel [16] and Cassie and Baxter [17] can be well applied [5,19]. For random roughness, generated in usual technical manufacturing procedures or intentionally generated by chemical processes (etching, coating, etc.) or technical treatments (sandblasting, sandpaper, etc.), the known laws might work. But for surfaces with well-defined structured patterns, for example, pillars with a square or round cross section, rhombus, stars or other geometrical formations as in Öner and McCarthy [21], these findings seem to not be applicable anymore due to the previously mentioned liquid pinning to the edges of the geometries. This pinning will lead to a deviation of the overall shape of the deposited droplets from the spherical cap for smooth surfaces as it was described by several authors [3,4,6,7,8,18,21,22,23,24].
Nevertheless, in the literature and for mainly all technical applications, only one contact angle characterizing the wetting behaviour is provided. But already for smooth surfaces, the apparent contact angle can slightly vary in experimental investigations [25]. The explanation for smooth surfaces might be a non-perfectly cleaned surface, inhomogeneities leading to a slight variation of free surface energy or different local metastable equilibrium states [26]. Drelich et al. [27] showed this for smooth surfaces, which had alternating hydrophilic and hydrophobic wetting properties along a line pattern. The effect here was even more pronounced and also showed a pinning behavior to the hydrophilic regions. According to the Young-equation (1), which needs to be valid along the whole three-dimensional contact line, this variation results in a not perfectly round droplet base and consequently in a variation of the apparent contact angle along the contact line. Hence, it is evident to specify, at least for structured surfaces, the apparent contact angle as a function of the azimuth angle or in an interval, since the variations can no longer be neglected compared to smooth surfaces [6,8].
An overview of possible evaluation methods with their advantages and disadvantages can be extracted from Foltyn et al. [28]. Additionally, the process of manufacturing and the evaluation of the reproduction quality is shortly outlined.
For the following experimental investigation of the apparent contact angle along the three-dimensional contact line based on 2D projections of different azimuthal viewing angles, an existing measurement device had to be strongly modified. In the respective part, the experimental setup, the procedure and the evaluation routine will be further described. Finally, the results of the measurements will be discussed.

2. Surface Reproduction

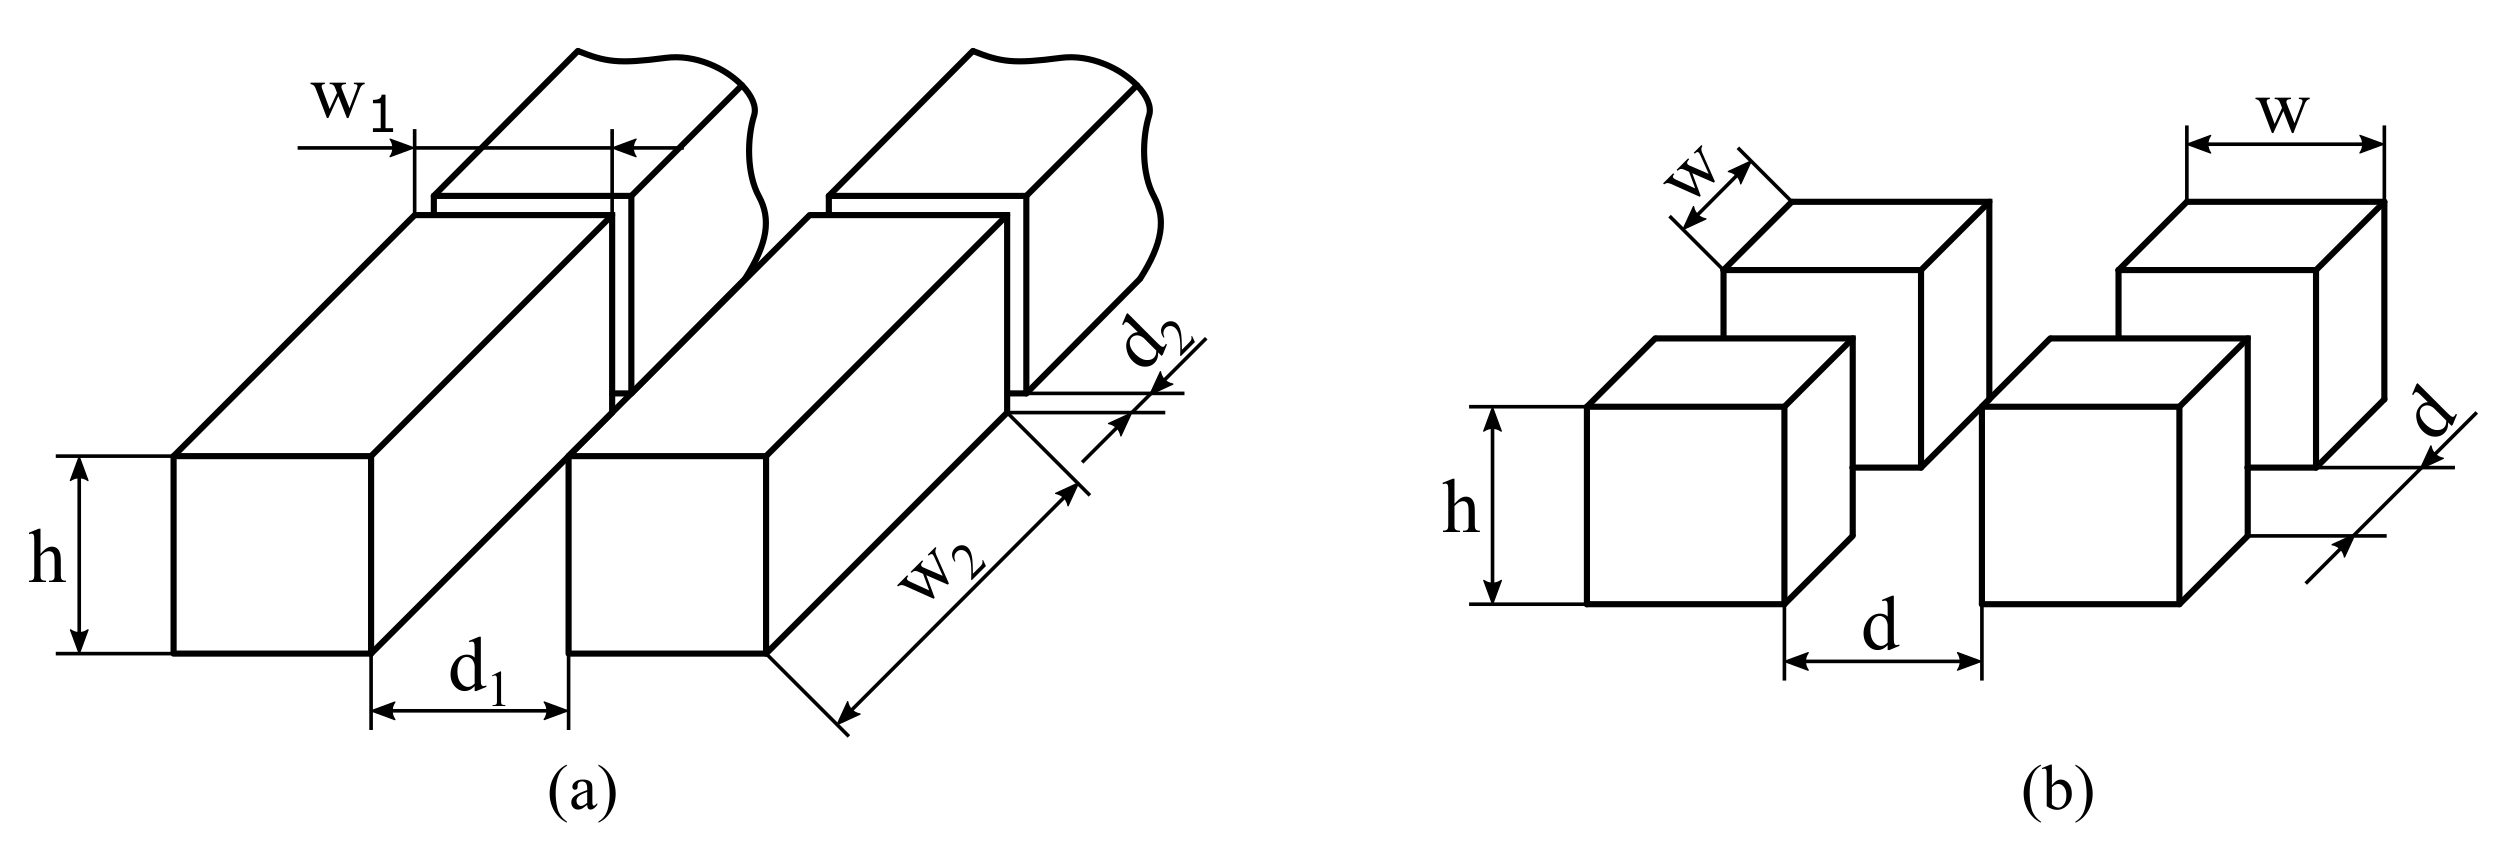
2.1. Structured Surface Pattern

Micro-structured surfaces can be produced with several different fabrication methods. A selection of the manifold available methods are lithographic processes, etching processes, sputtering, additive micro-fabrications, micro-milling, or moulding processes [29]. The fabricated surfaces, used for the investigations in this publication, were not only used for static droplet experiments, in which droplets were just gently placed. Droplet impact experiments were requiring a transparent polymeric material, so that for these surface samples Lexan® (polycarbonate) was used as the material, in order to be able to observe the droplet impact from three different perspectives: a side view, a top view and a bottom view [28]. As patterns, steep grooves and arrays of steep pillars of square cross-section in micrometric dimensions according to Figure 1 and Table 1 have been chosen. The grooves, which are strictly speaking very wide pillars due to fabrication reasons, have a height of h = 20   μ m and an edge length of w 1 = 60   μ m and w 2 = 500   μ m . The distance between each pillar is d 1 = 60   μ m , orthogonal to the direction of the grooves, and d 2 = 15   μ m in the direction of the grooves. The pillars have a uniform height of h = 20   μ m and an edge length w of 60 μ m , 30 μ m and 15 μ m , respectively. For the pillars, the roughness factor r according to Wenzel [16] increases with decreasing edge length, while the solid fraction of the pillars stays constant. What follows is a description of the mould production and the replication of the single surface samples carried out by the KNMF (Karlsruhe Nano and Micro Facility). Since the mould production is very elaborate and expensive, all four surface structure patterns where combined on one mould with a blank space in between. The mould was produced using a combination of Direct LASER Writing (DLW) lithography and electroforming. A more detailed description can be found in Foltyn et al. [28].

2.2. Direct LASER Writing (DLW) Lithography

For the master fabrication a four-inch silicon wafer was used which was coated by an antireflective coating with a thickness of 200 n m and a resist layer of a thickness of 20 μ m . A Heidelberg Instruments DWL66fs with a 10 m m write head at a LASER power of 125 m W allowed the creation of steep structures, depicted in the Scanning Electron Microscopy (SEM) images of Figure 2a,b. By a post-treatment the written structures were prepared for the following electroforming step [28].

2.3. Nickel Electroforming

The nickel electroforming process follows the procedure which is described in the literature [30]. As a first step, the master micro-components are coated with a conductive electroplating seed layer of chromium and gold using a physical vapor deposition (PVD) process. This seed layer is used to guarantee a precise metal deposition along the micro-structures. The silicon substrate with the micro-structured master is then immersed in the galvanic bath with nickel sulfamate electrolytes containing boric acid and the flour tensid FT 248 (Bayer AG, Leverkusen, Germany) ( ϑ = 52   ° C ; pH = 3.4 to 3.6 ) [30]. The electroforming of nickel shims is carried out with the standard parameters for manufacturing mould inserts based on LIGA structures [31]. It starts with a low current density ( 50 A / m 2 ) at the seed layer and continues increasing the current density up to 180   A / m 2 until the metal layer has reached a thickness of 0.5 m m . The final product is a stiff and homogenous metal plate, able to withstand the forces occurring during the moulding process.

2.4. Hot Embossing

The resulting nickel shim, which is produced from a LASER lithographically structured master, can be installed in a hot embossing facility. Basically, the hot embossing system consist of two heating plates which are pressed together with high force [30]. On one side, the produced nickel shim is mounted onto a heating plate. Between the heating plates, a thermoplastic polymer foil is positioned, for our case Lexan® (polycarbonate), to which the shape of the plates is then transferred [32]. The hot embossing technique allows, after the production of the mould and nickel shim, a very stable high-quality reproduction of small series of such surface samples.

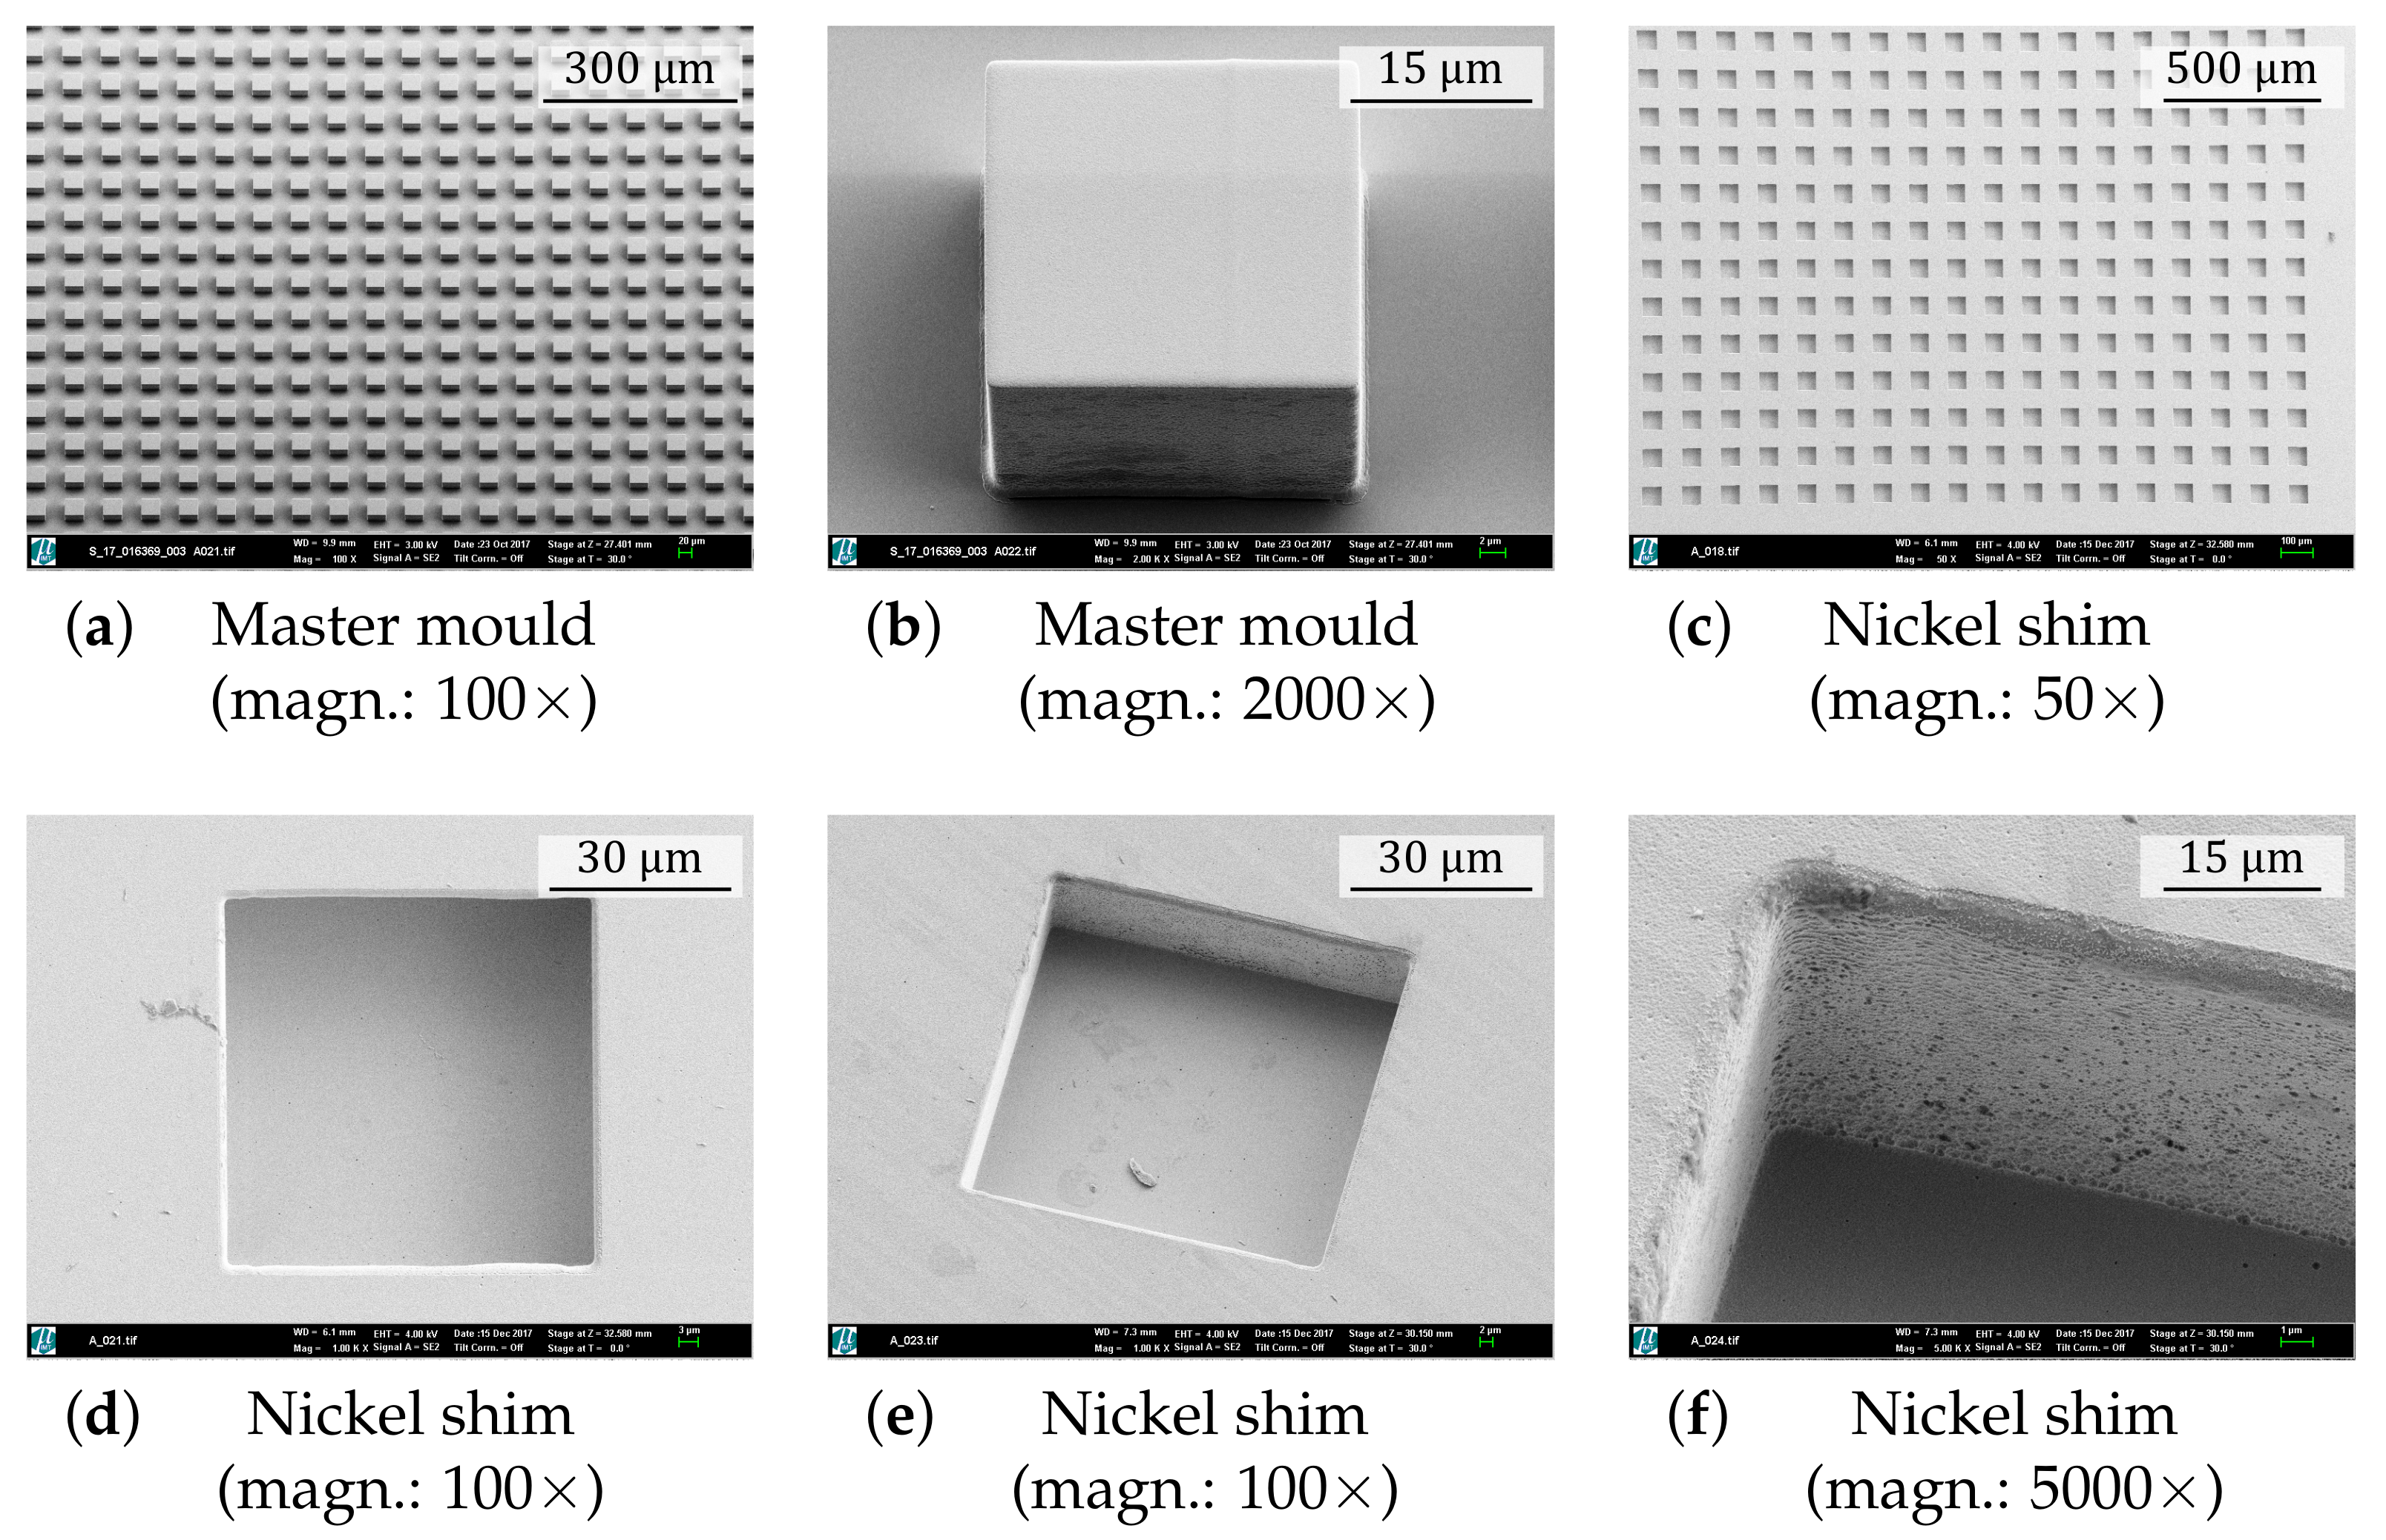
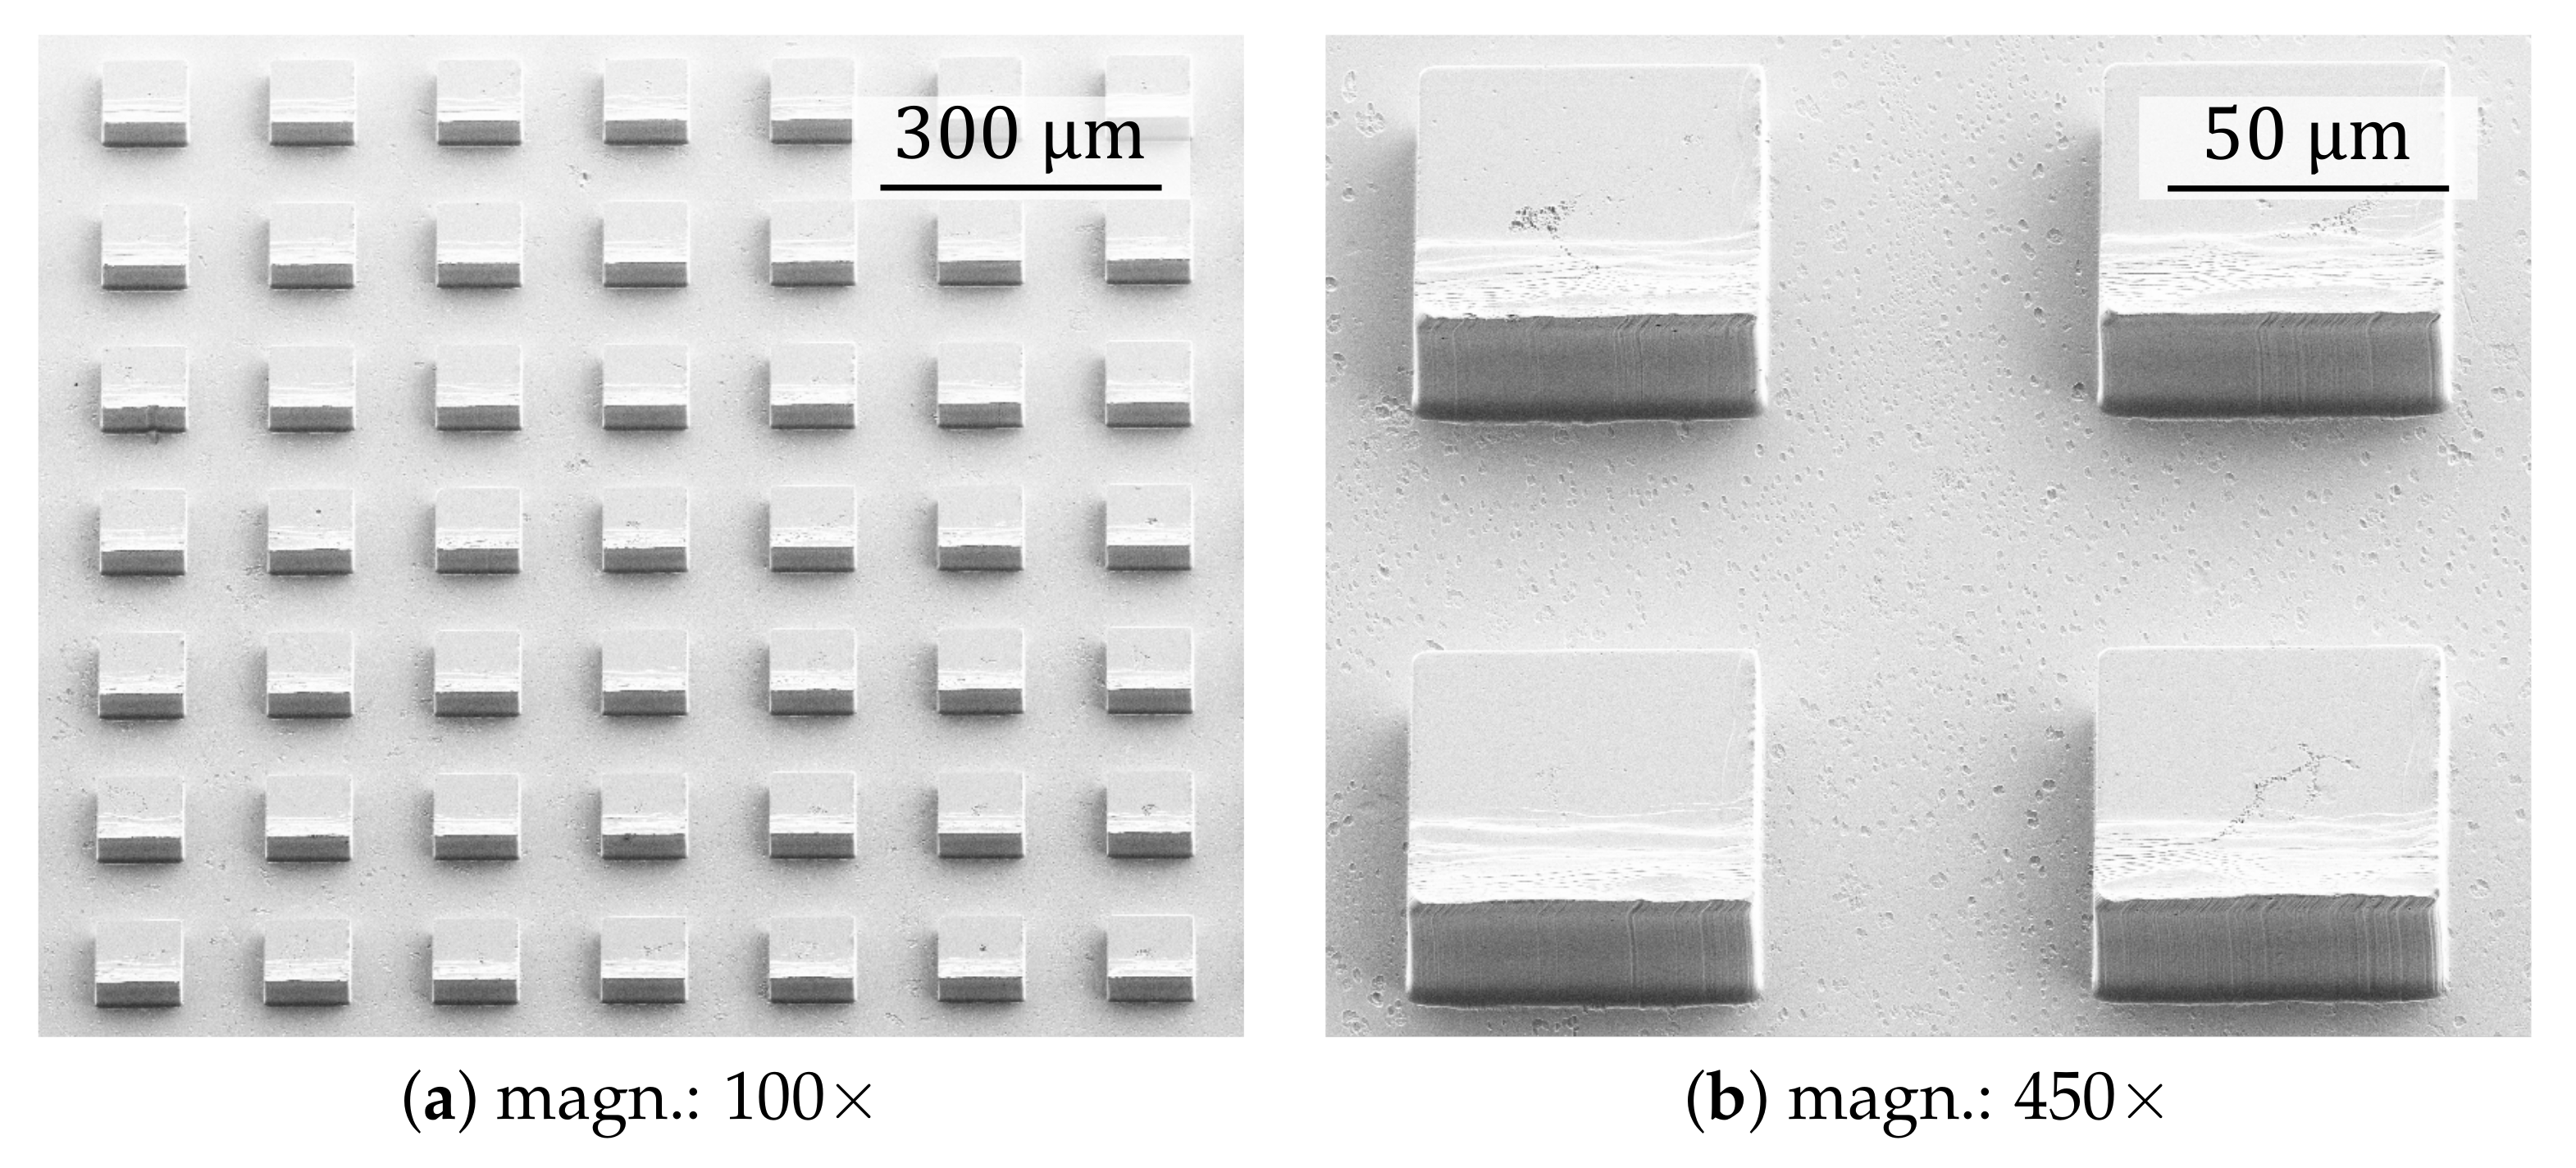
2.5. Reproduction Quality

The nickel electroforming process has shown that micro-structures and even nano-structures can be transferred identically from a master mould into a nickel shim, see Figure 2 and Foltyn et al. [28]. The quality of the nickel mould depends on the quality of the master structure, which shows up after the master has been removed from the nickel. And additionally, the inspection of the final surface samples, reproduced by the hot embossing process, shows that micro-structures can also be transferred identically into a polymer. After the polymer has been removed from the nickel mould in a demoulding step, the reproduction quality shows up. It is, again, depending from the quality of the shim and on the parameters of the polymers and the hot embossing process. Two representative examples showing the good reproduction quality of the polymer samples are depicted in Figure 3. Overall, there are no significant defects from which it needs to be expected that the final outcomes of the solid–liquid interaction was influenced.

3. Experimental Setup

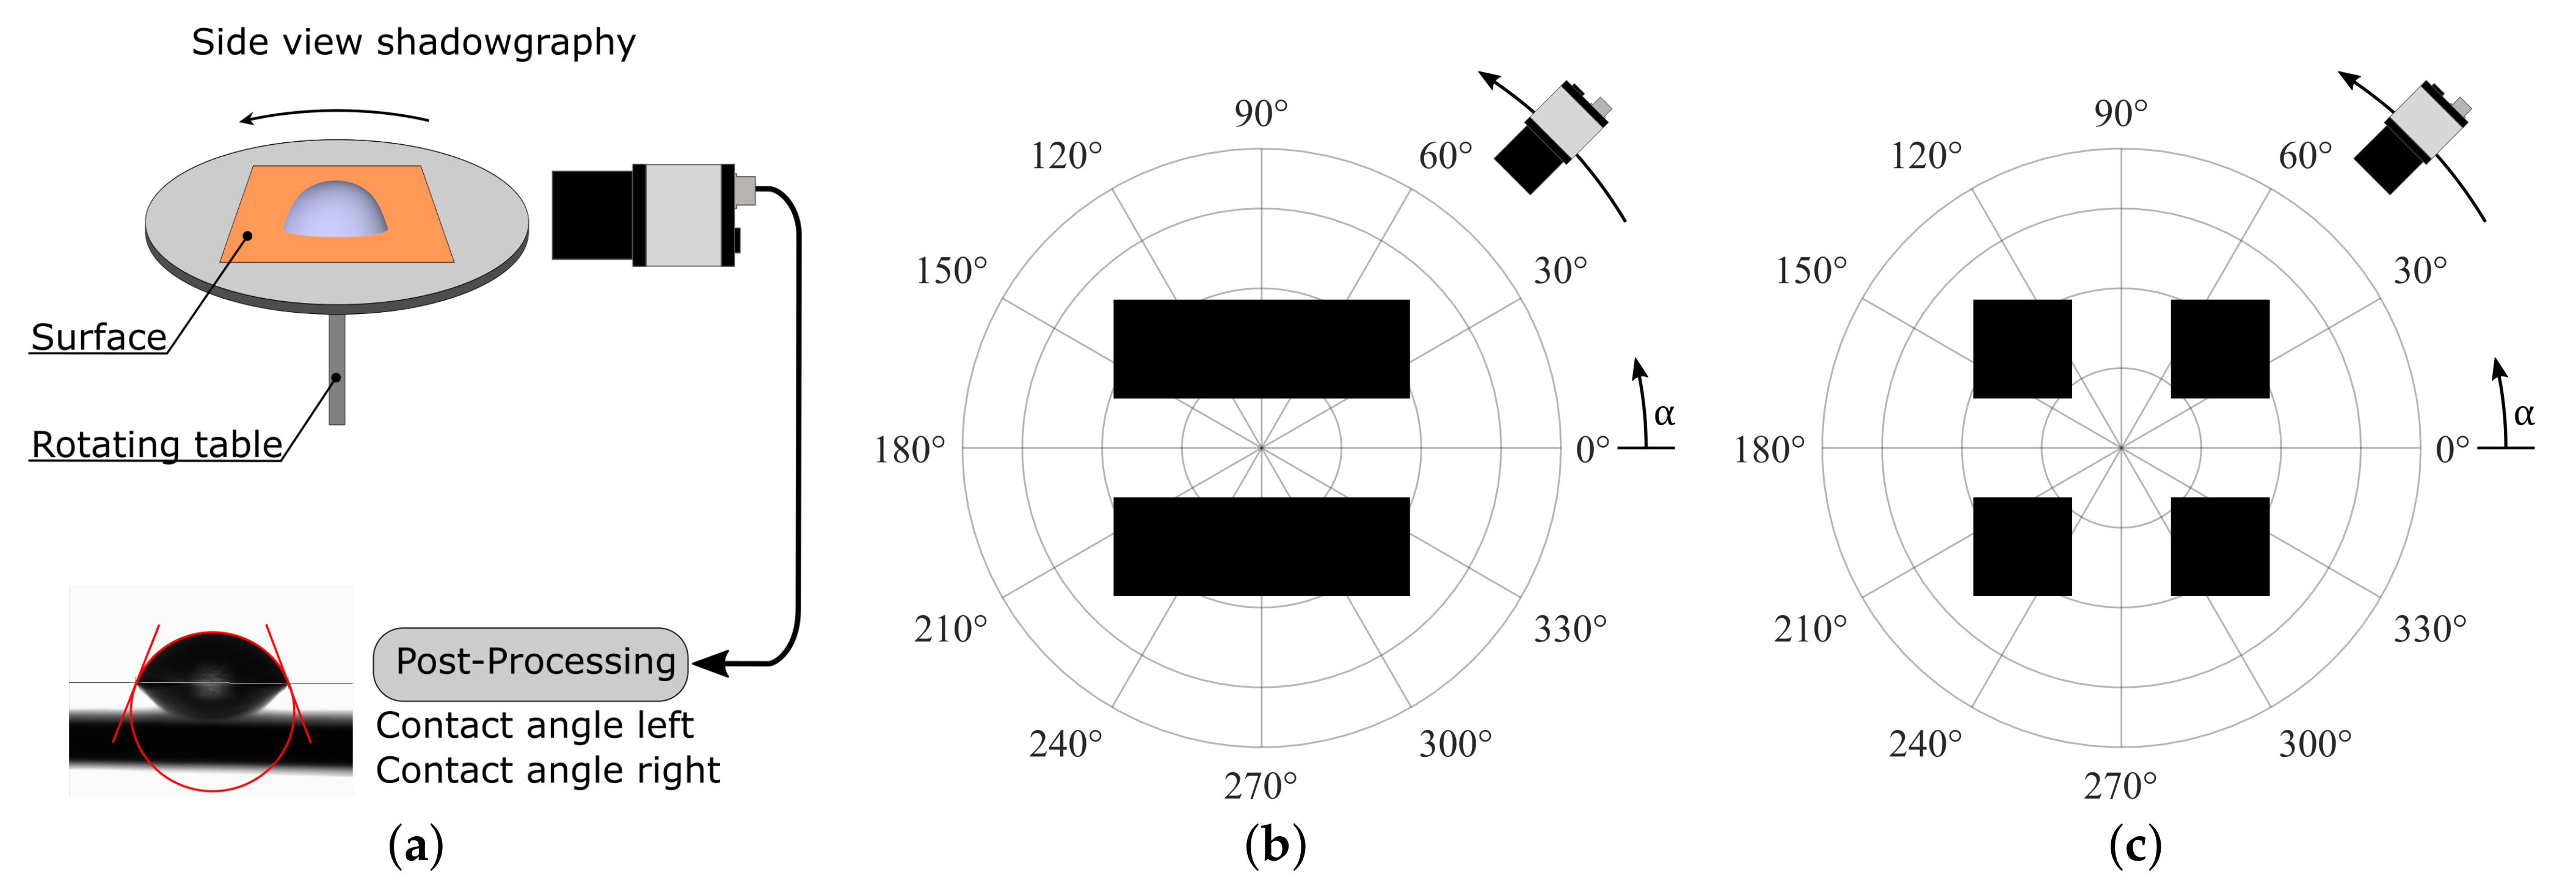
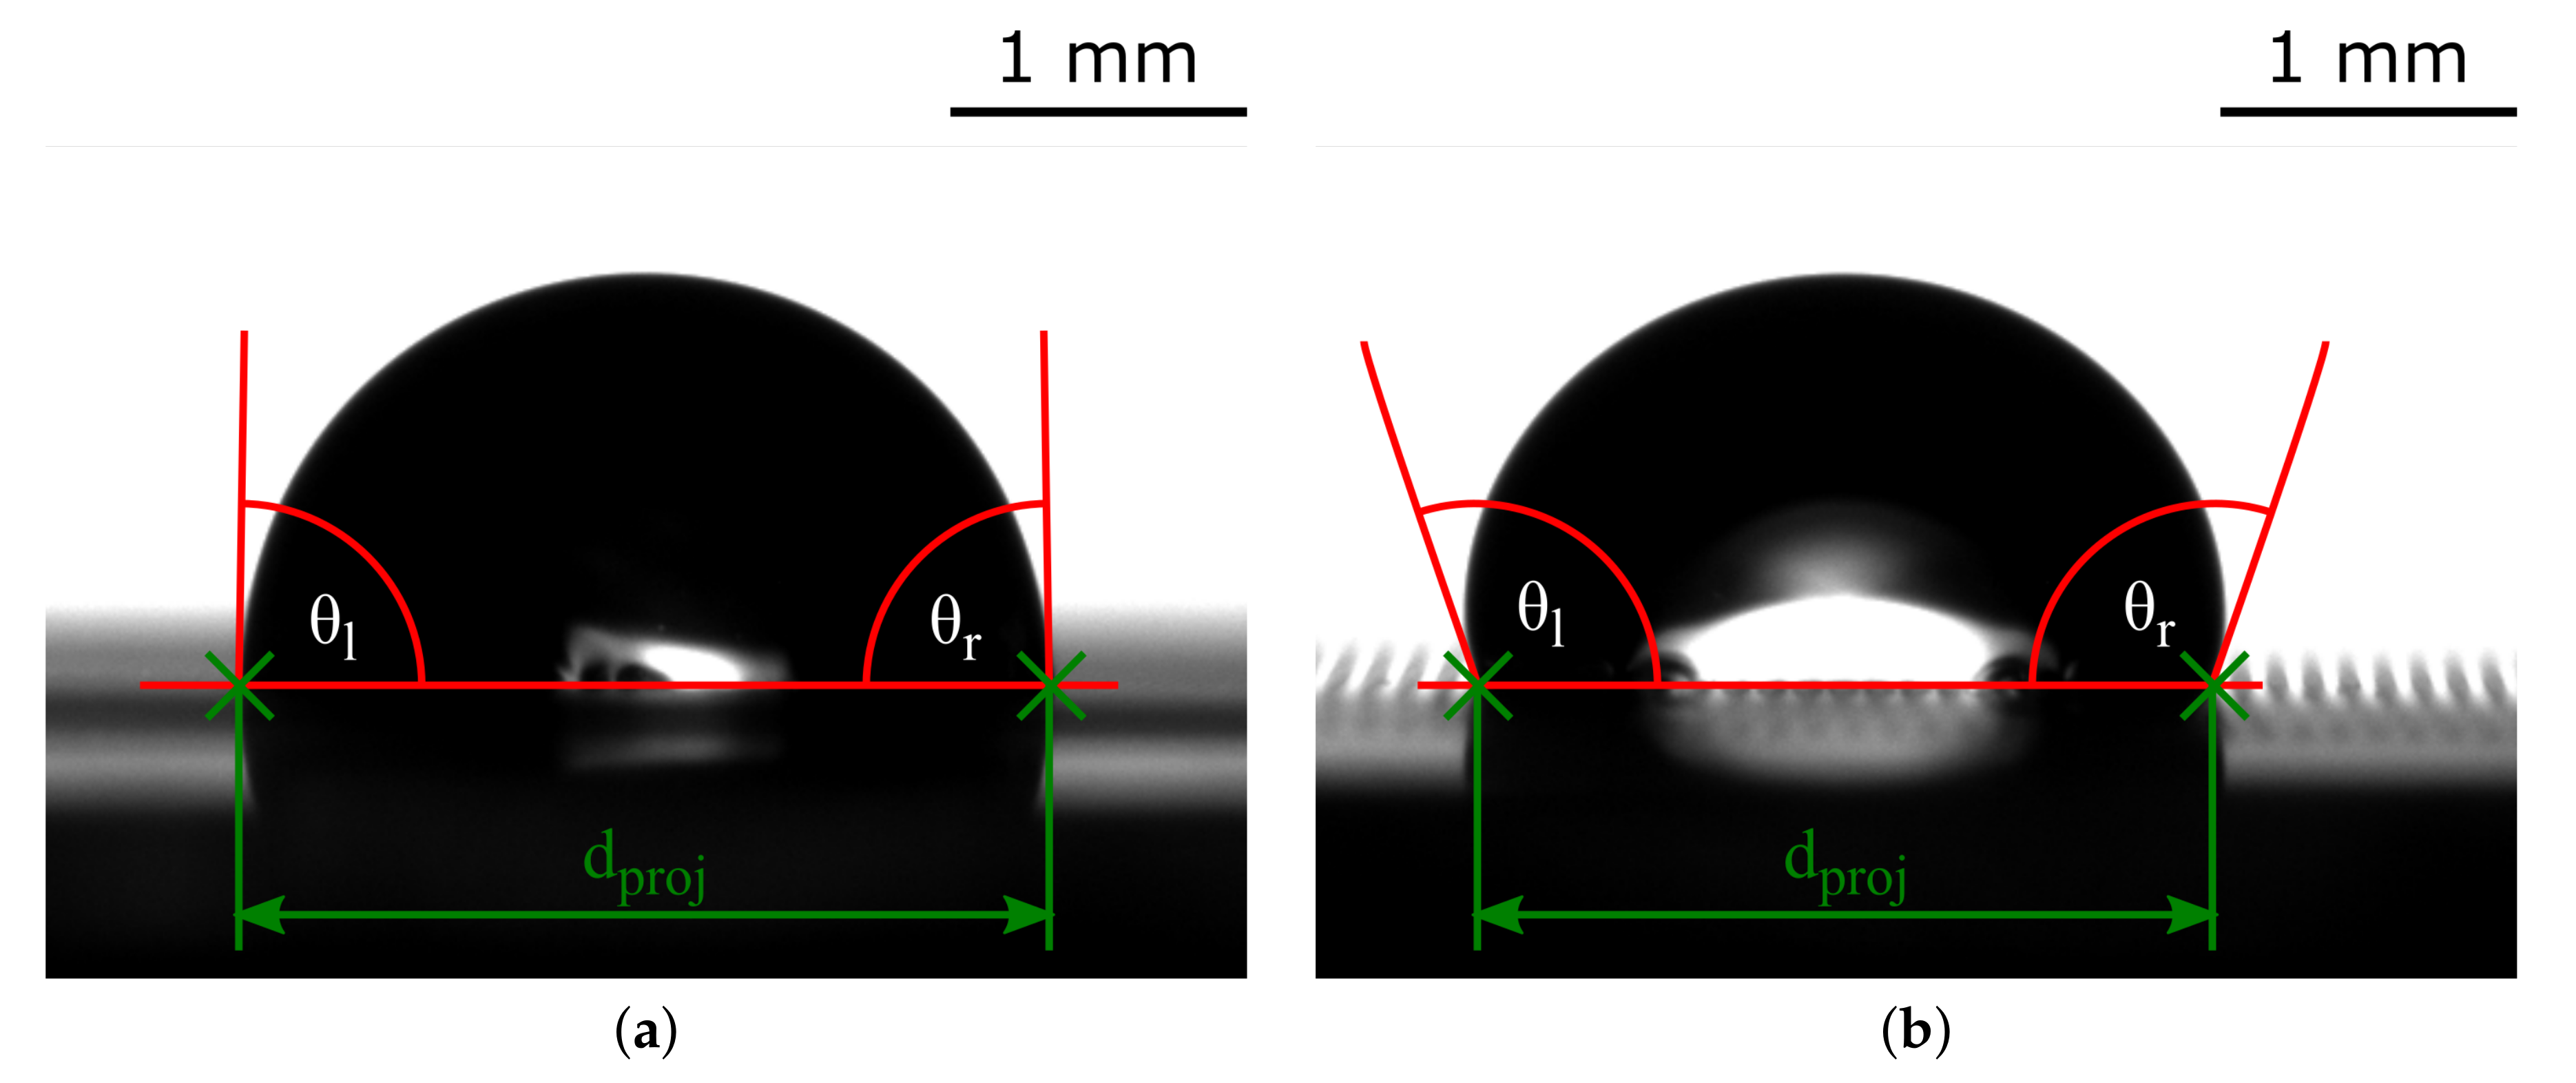
3.1. Measurement Principle

For the measurement of the apparent contact angle distribution θ ( α ) a droplet is deposited on a structured surface sample and turned on a rotating table as shown in Figure 4a. At predefined angle steps shadowgraphs are acquired, comparable to the procedure during the acquisition of projections using micro computed tomography devices. The relative position of the camera to the structure orientation is defined as azimuthal angle α . The azimuthal angle of α = 45 ° corresponds to the diagonal direction with respect to the structure, see Figure 4b,c while the azimuthal angle of α = 0 ° corresponds to an aligned view with respect to the direction of the grooves. For the pillars of square cross-section α = 0 ° and α = 90 ° corresponds always to an aligned view of the structure. As the figure also shows, more angles give an aligned and diagonal view with respect to the structure patterns.
Further, a post-processing routine determines the apparent contact angle θ and the projected distance of the triple points d p r o j assigned to the respective azimuthal angle of observation. Here, the contact angle θ is always considered the arithmetic mean apparent contact angle between the left and right apparent contact angles θ l and θ r . Representative shadowgraphs are shown in Figure 5 in which the measured apparent contact angle θ and the projected distance of the triple points d p r o j are also shown. In the following, a detailed description of the measurement device and the measurement procedure are discussed. The post-processing routine is briefly outlined.

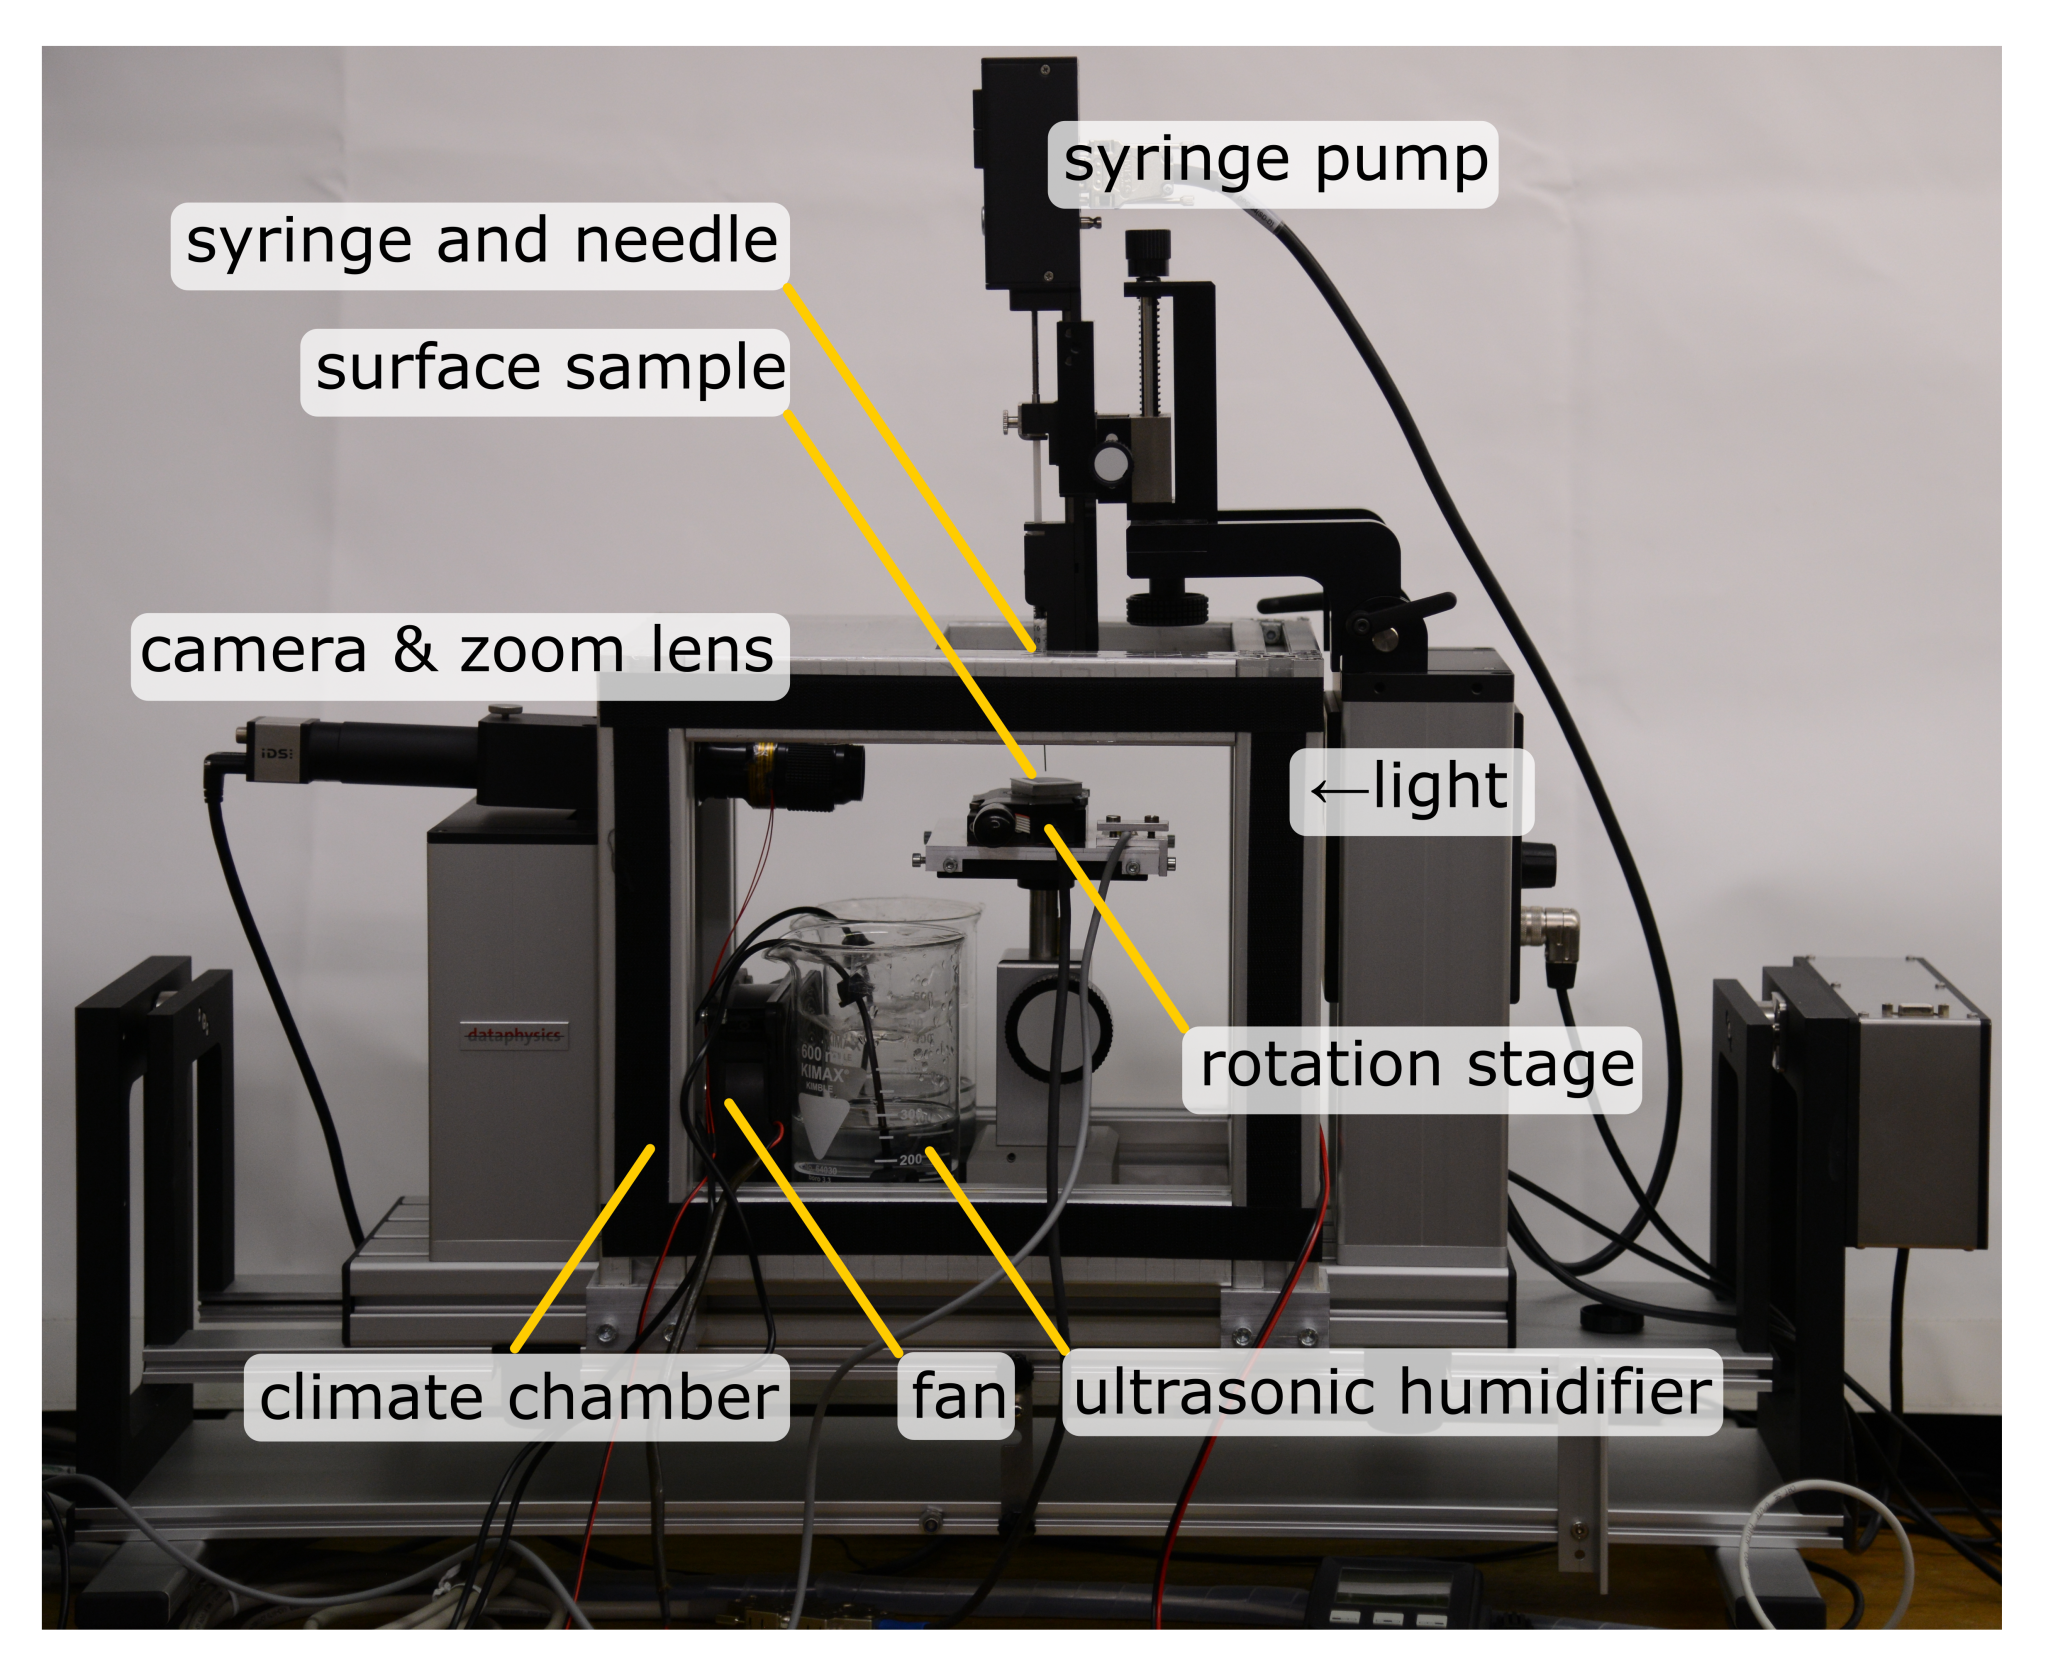
3.2. Contact Angle Measurement Device

The apparent contact angle was measured by the sessile drop method, in which the evaluation of a shadowgraph of the droplet shape provides among other parameters the apparent contact angle and the base diameter. For the conducted measurements the OCA 15EC (DataPhysics Instruments GmbH, Filderstadt, Germany) was used. It is an Optical Contour Analysis and contact angle measurement device (OCA). In order to measure the apparent contact angle over an azimuthal angle range of 0° to 360°, however, several modifications have been necessary, which are further outlined in the following and depicted in Figure 6. Firstly, the rotation stage RS-40 DC controlled by the controller C-884.4DC (both from Physik Instrumente (PI) GmbH & Co. KG, Karlsruhe, Germany) was mounted on the central, height adjustable stage of the OCA. On this stage, the structured surface samples are then placed and turned very precisely. Secondly, a chamber needs to be established, which is keeping the humidity around the droplet atmosphere saturated as much as possible. This limits the droplet evaporation to a minimum keeping the droplet volume and consequently the droplet shape and apparent contact angle distribution approximately constant over time. The chamber was built by using aluminium profiles for a frame. A thin plastic foil was used to cover the bottom, top and the side walls. For the front, a Dual Lock Tape of 3M was used to allow the opening and closing of the chamber. Since the camera and the light were outside of the chamber, optical access needed to be established. The optical access for the magnification lens of the imaging system was realized by a hole inside the foil. The gap between foil and zoom lens was then sealed by tape. First preliminary experiments with the light shining through the foil delivered images with high losses in light intensity and not very sharp droplet contours. Therefore, a glass plate was built inside the aluminium profiles replacing the foil and was sealed by a rubber gasket at the backside, directly in front of the light. The needle from the top was pierced through the foil. Since the needle had an outer diameter of only 1.4 m m , the water losses could be neglected through this hole. Thirdly, heating systems have been installed on all optical elements to avoid the condensation of water inside the chamber leading to optical aberrations. Therefore, the optical zoom lens and the glass plate through which the light is entering the chamber have been heated slightly but constantly during the whole measurement procedure. An influence of the heat flux from these systems on the measurement is insignificant as constant temperature surveillance during the measurements have shown. Fourthly, especially for this purpose, a designed humidity controller was built in order to reduce the mass loss of the droplet to a minimum, see Section 4.3. It runs with an Arduino system, which tracks the temperature and humidity of the chamber with the help of a SHT15 V4 sensor (Sensirion AG, Staefa (ZH), Switzerland) and was placed very closely, only a few centimeters, to the droplet. If the preset humidity threshold was undershot, humidity was generated by liquid reservoirs with ultrasonic humidifiers as they are also used for reptiles. The humidity was then distributed by a small computer fan. The fan was placed inside the chamber in such a manner that it distributes the flow and thus the humidity homogeneously inside the chamber, but does not disturb the droplet’s shape. For all measurements the temperature around the droplet was kept at room temperature which was, according to the monitoring unit, almost constant in the range of 23 C to 24 C . Finally, a C++ routine was developed to control and synchronize the camera and the rotation stage. This routine runs on an ordinary laptop controlling the full setup during the measurements.

3.3. Measurement Procedure

Before the apparent contact angle distribution over 360° could be measured, the axis of the rotation stage and the needle of the syringe pump as well as the starting orientation of the structures needed to be aligned. The starting orientation of the structures was chosen in such a way that the grooves of all structure patterns were at an angle of 45° to the perspective of the camera. The atmosphere in the climate chamber had to be set to the maximum humidity possible, which was, according to the sensors output, at about 95% relative humidity (RH) to 98 %RH after the chamber was sealed. As defined in the sensor’s datasheet, the error of the relative humidity was in between ±4 %RH. For cross-checking the measurements, a TESTO 650 (Testo SE & Co. KGaA, Titisee-Neustadt, Germany) with an accuracy of ±2 %RH at 98 %RH according the calibration protocol has shown a relative humidity of 99.0 %RH and higher. Additionally, visual inspections showed a huge amount of water condensing on the non-heated parts. Therefore, the atmosphere was considered close to saturation in the surroundings of the droplet. Concurrently, all optical parts had to be preheated avoiding condensation on these spots. When the atmosphere was established, a 5 μ L distilled water droplet was placed very gently in the middle of the structured surface by lowering the needle carefully. To make sure that the imbibition process and all pinning processes inside the structure as well as vibrational movements are decayed, the droplet rested in the previously established atmosphere for 10 min. After this time, the droplet was considered stable and the acquisition was started. During the acquisition, the rotation table was moved stepwise with a velocity of 3 / s for an azimuthal angle step of Δ α = 1 ° . After a short relaxation time of 1 s , avoiding an acquisition of droplet movements like wobbling, an image was acquired. In total, 360 images were acquired using the described procedure for each experiment.

3.4. Evaluation Routine for Optical Contour Analysis of Droplet Shadowgraphs

For the angular apparent contact angle determination, the acquired shadowgraphs were analysed individually by a multistep script in MATLAB® R2019a [33] and functions of the Image Processing Toolbox™ [34]. The multistep script was originally designed by Andersen et al. [35]. Modifications were done in the fitting routines using other ellipse fitting routines [36,37] and in other operations which had to be performed due special requirements of the evaluation task.

4. Results and Discussion

4.1. Prediction of Apparent Contact Angles on Smooth Surfaces

The wetting behavior of smooth polycarbonate surfaces was determined by experimental measurements of the OCA to be hydrophilic ( θ e x p 79.8 ° ). Although there are also critical remarks on mathematical models for estimating the wetting behavior of smooth surfaces [38], the used method of Owens, Wendt, Rabel and Kaelble (OWRK-model) [39,40,41] can reliably predict this wetting behavior for our case.
Using this method, the surface free energies of the Young Equation (1) were split into a polar and a dispersive part as follows:
γ i = γ i p + γ i d .
In the OWRK-model, the solid-liquid interfacial energy γ S L can be expressed with the help of Equation (4) by the polar and dispersive contributions of the surface free energies of the liquid and solid [42]:
γ S L = γ S V + γ L V 2 γ S V p γ L V p + γ S V d γ L V d .
Inserting Equation (5) into the Young equation (1) leads to an expression for the prediction of the contact angle θ :
cos ( θ ) = 2 / γ L V γ S V p γ L V p + γ S V d γ L V d 1 .
For water on flat polycarbonate, a contact angle of θ O W R K 79.9 ° can be calculated with the help of Equation (6) using the surface free energies of water [43] γ L V p = 51.00 m N / m −1 and γ L V d = 21.80 m N / m −1 and for polycarbonate the surface free energies are given as [44] γ S V p = 6.5 m N / m −1 and γ S V d = 27.7 m N / m −1.

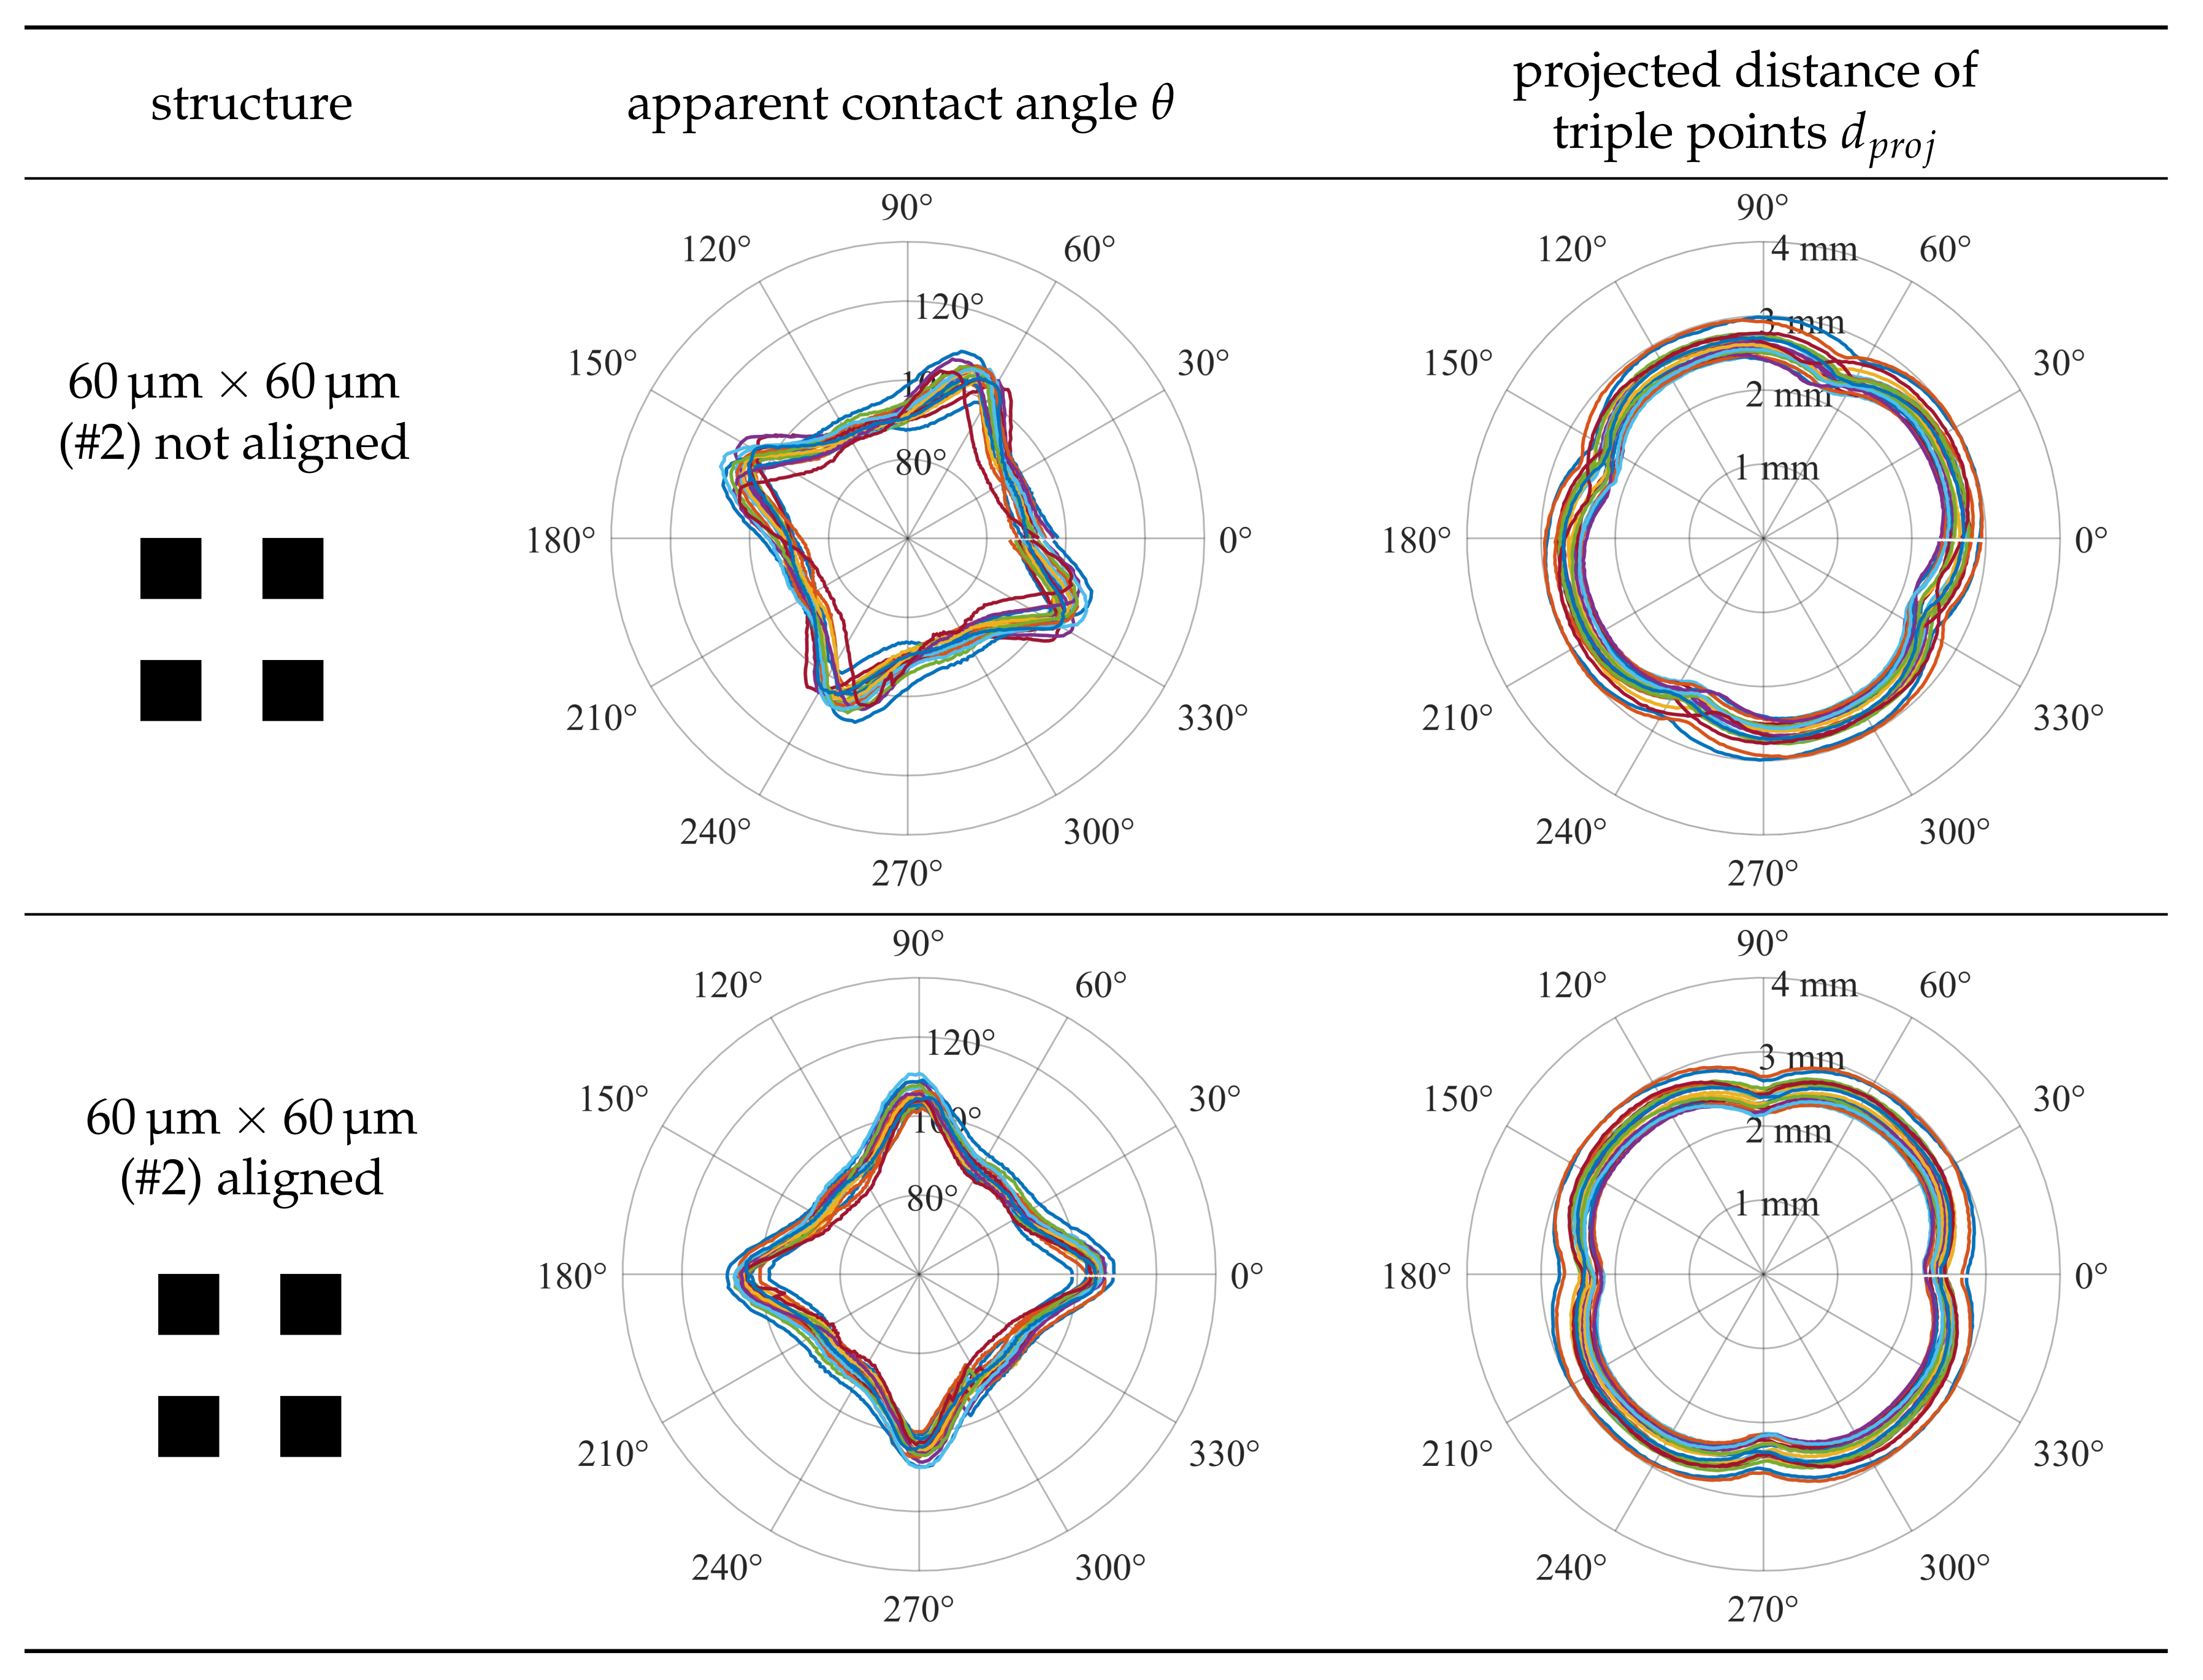
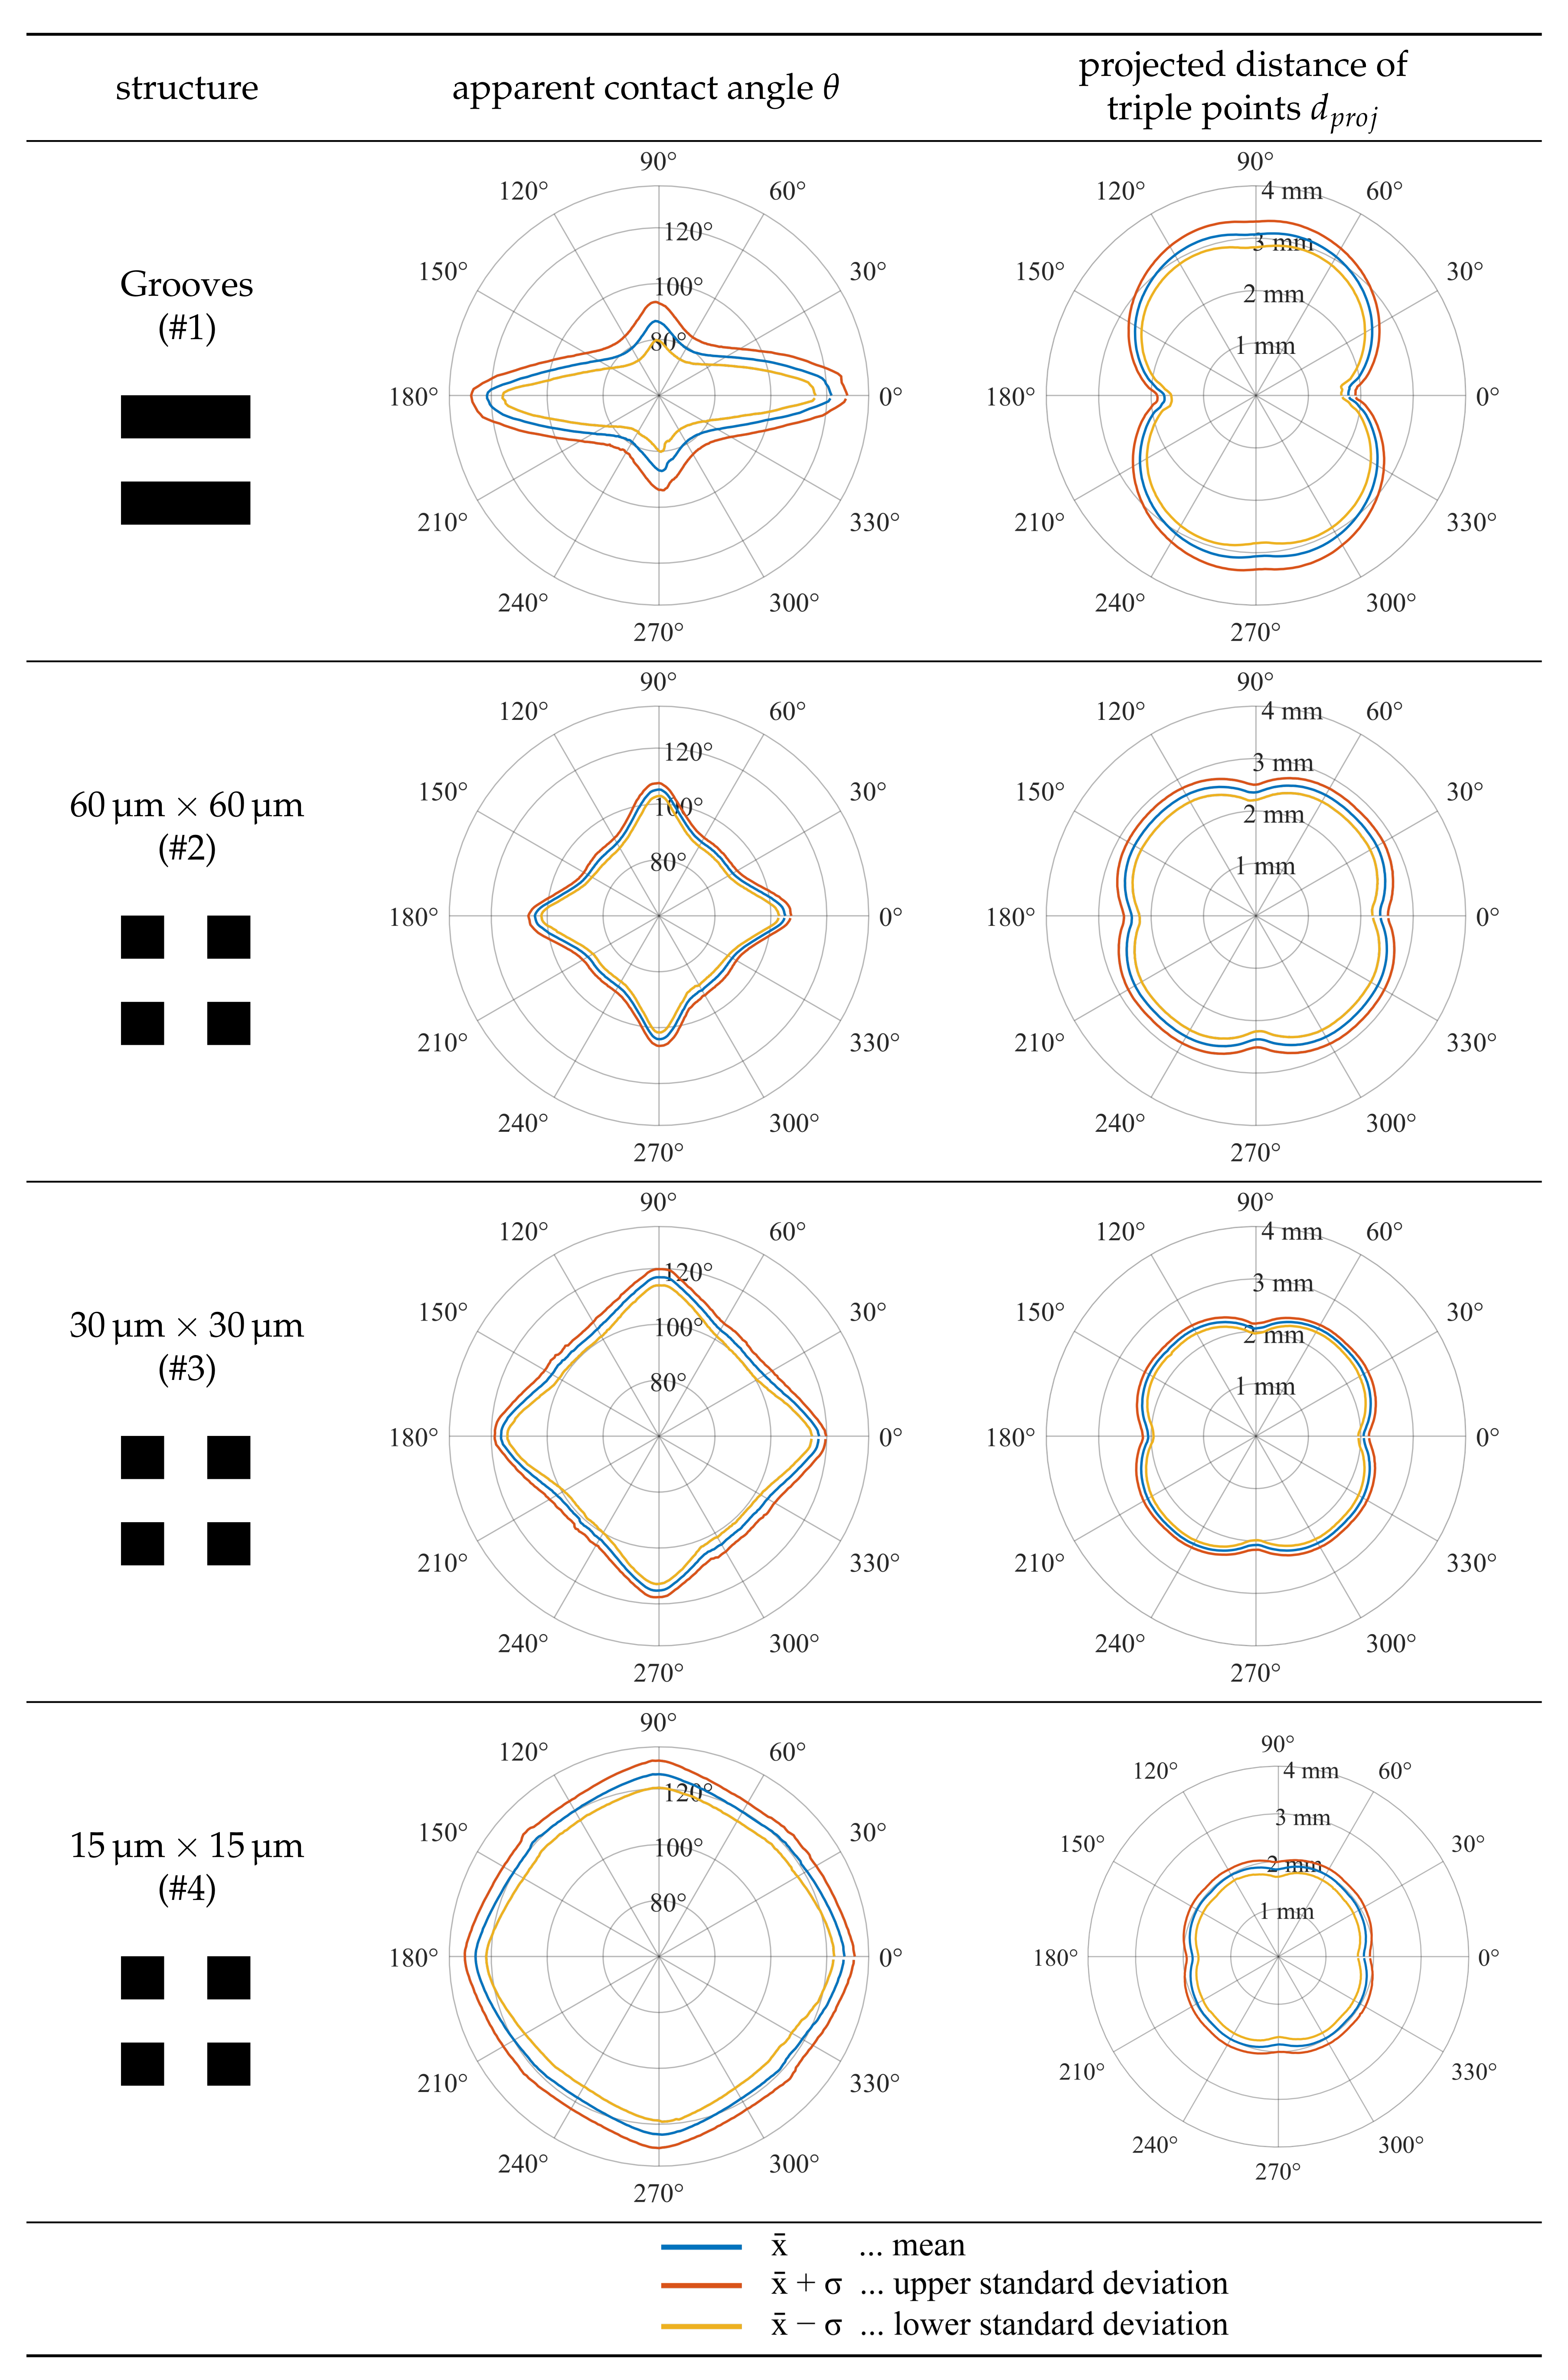
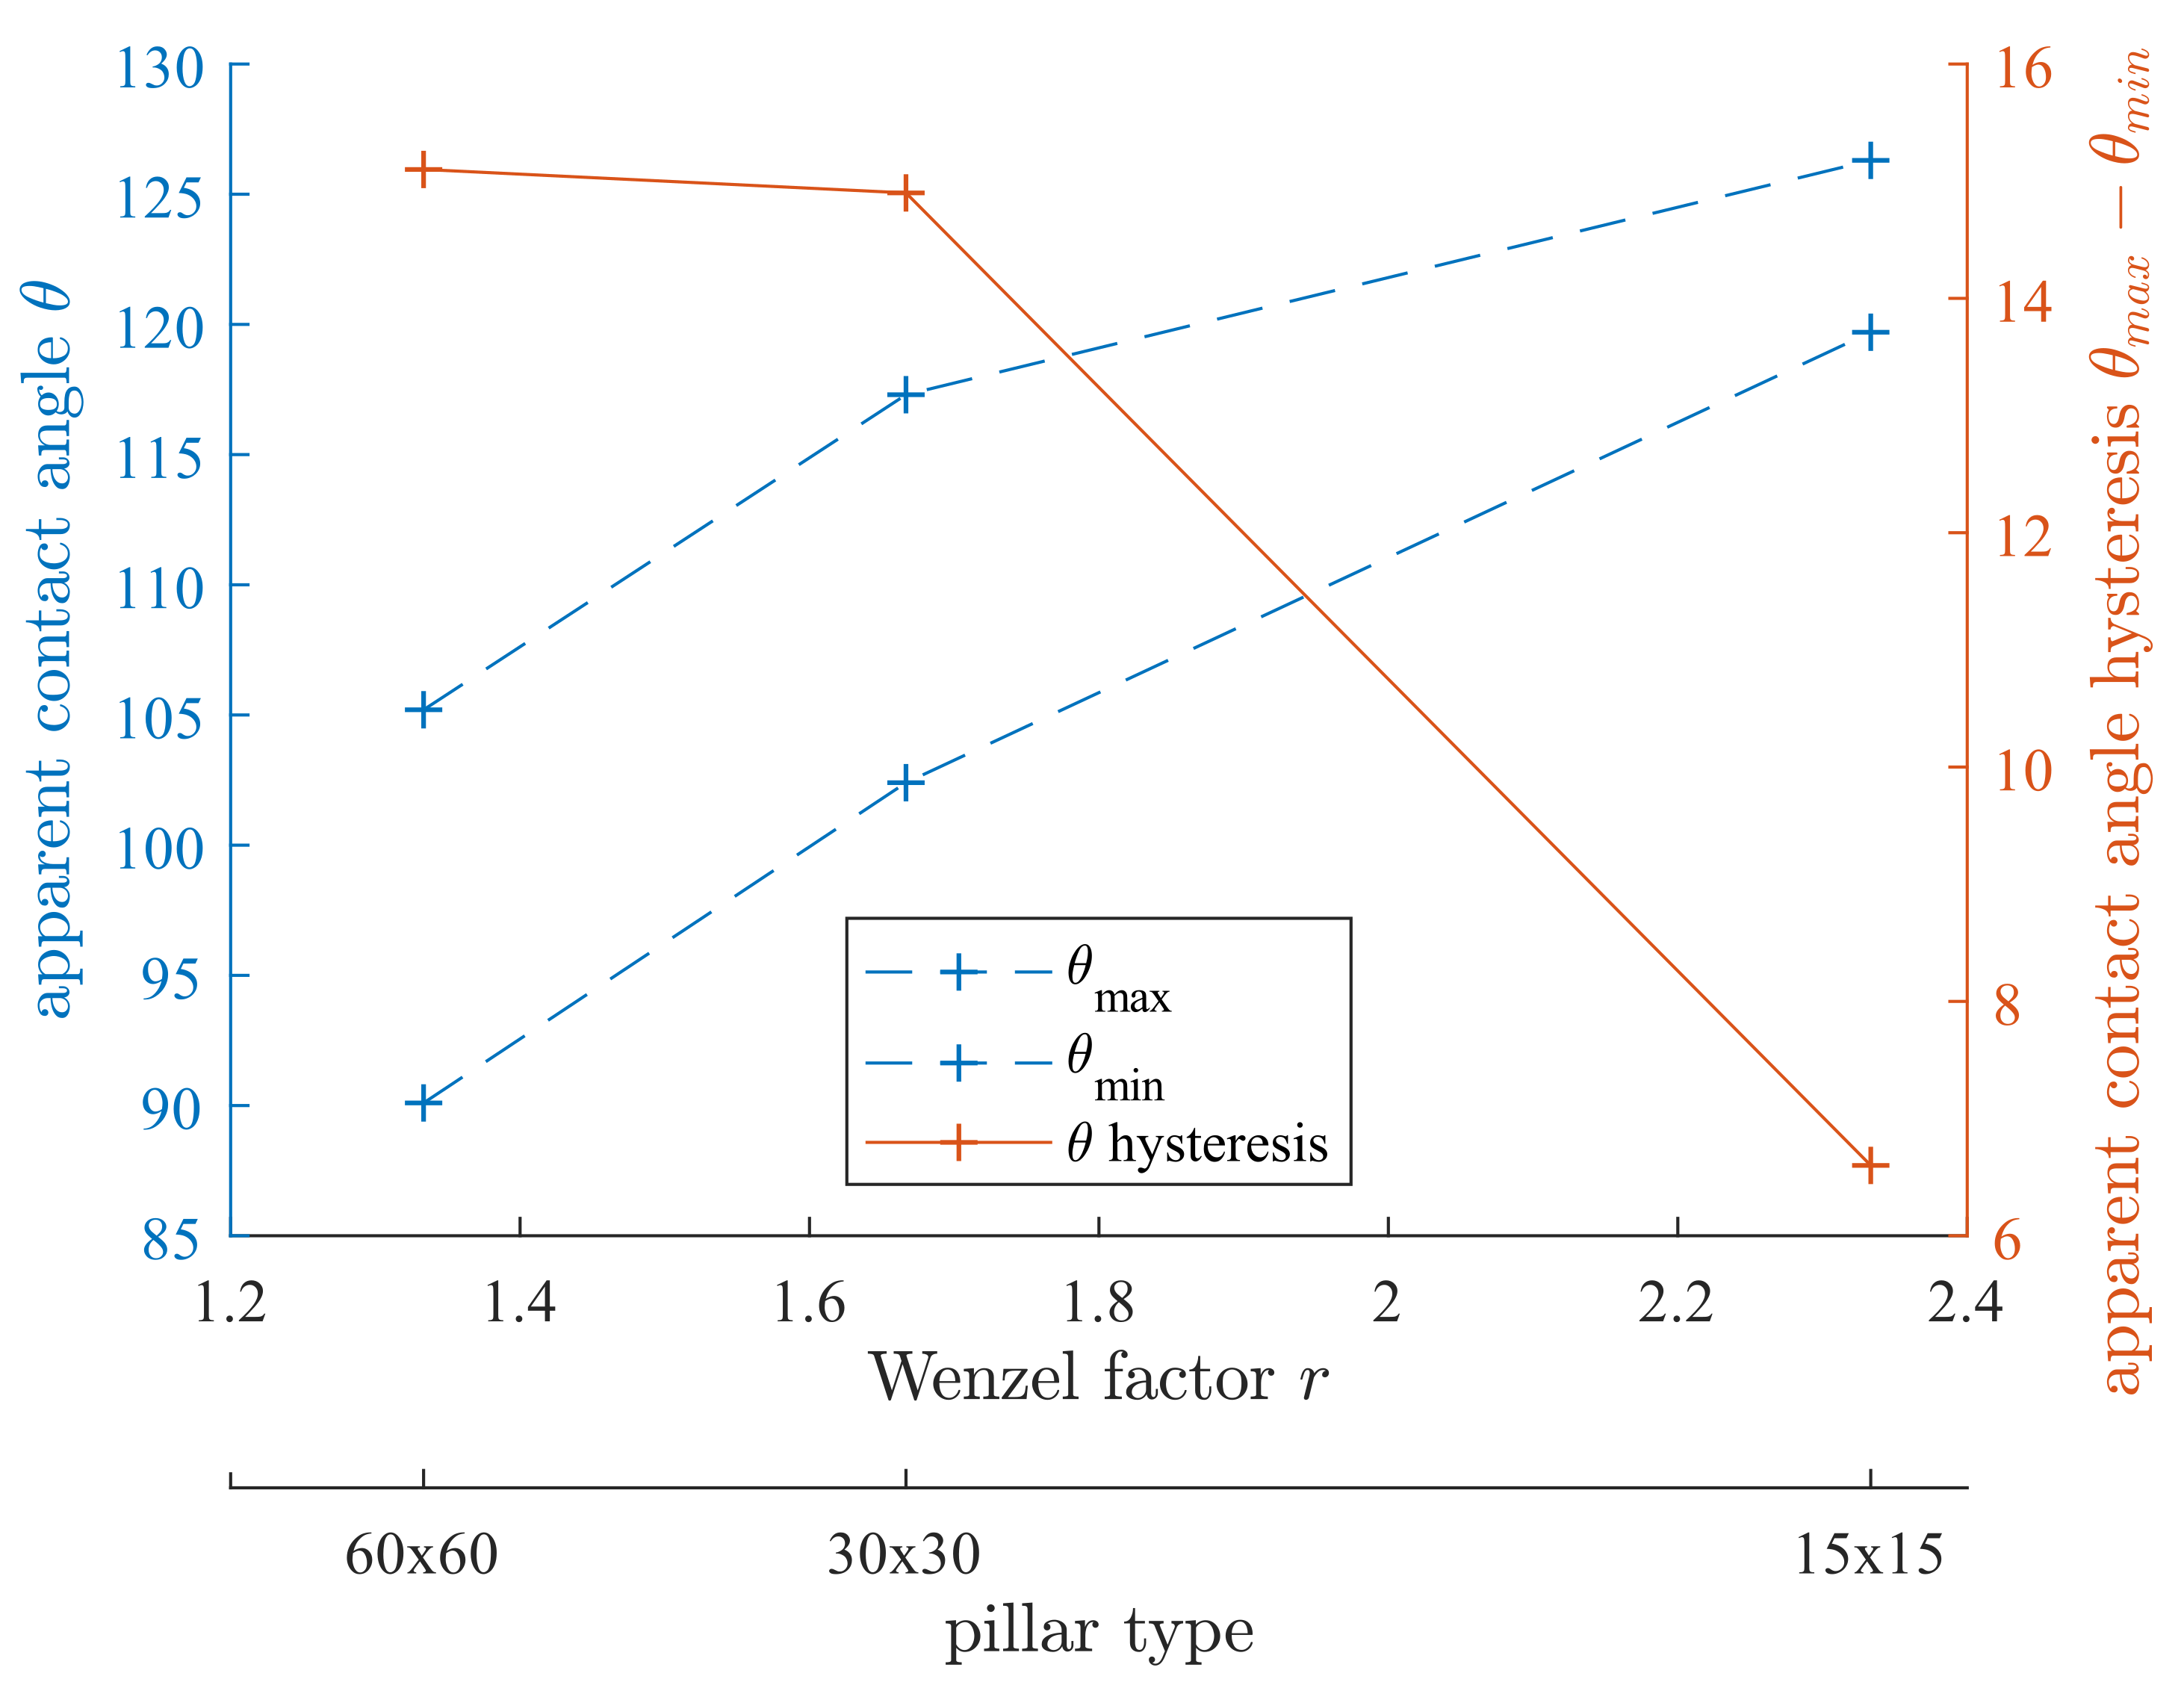
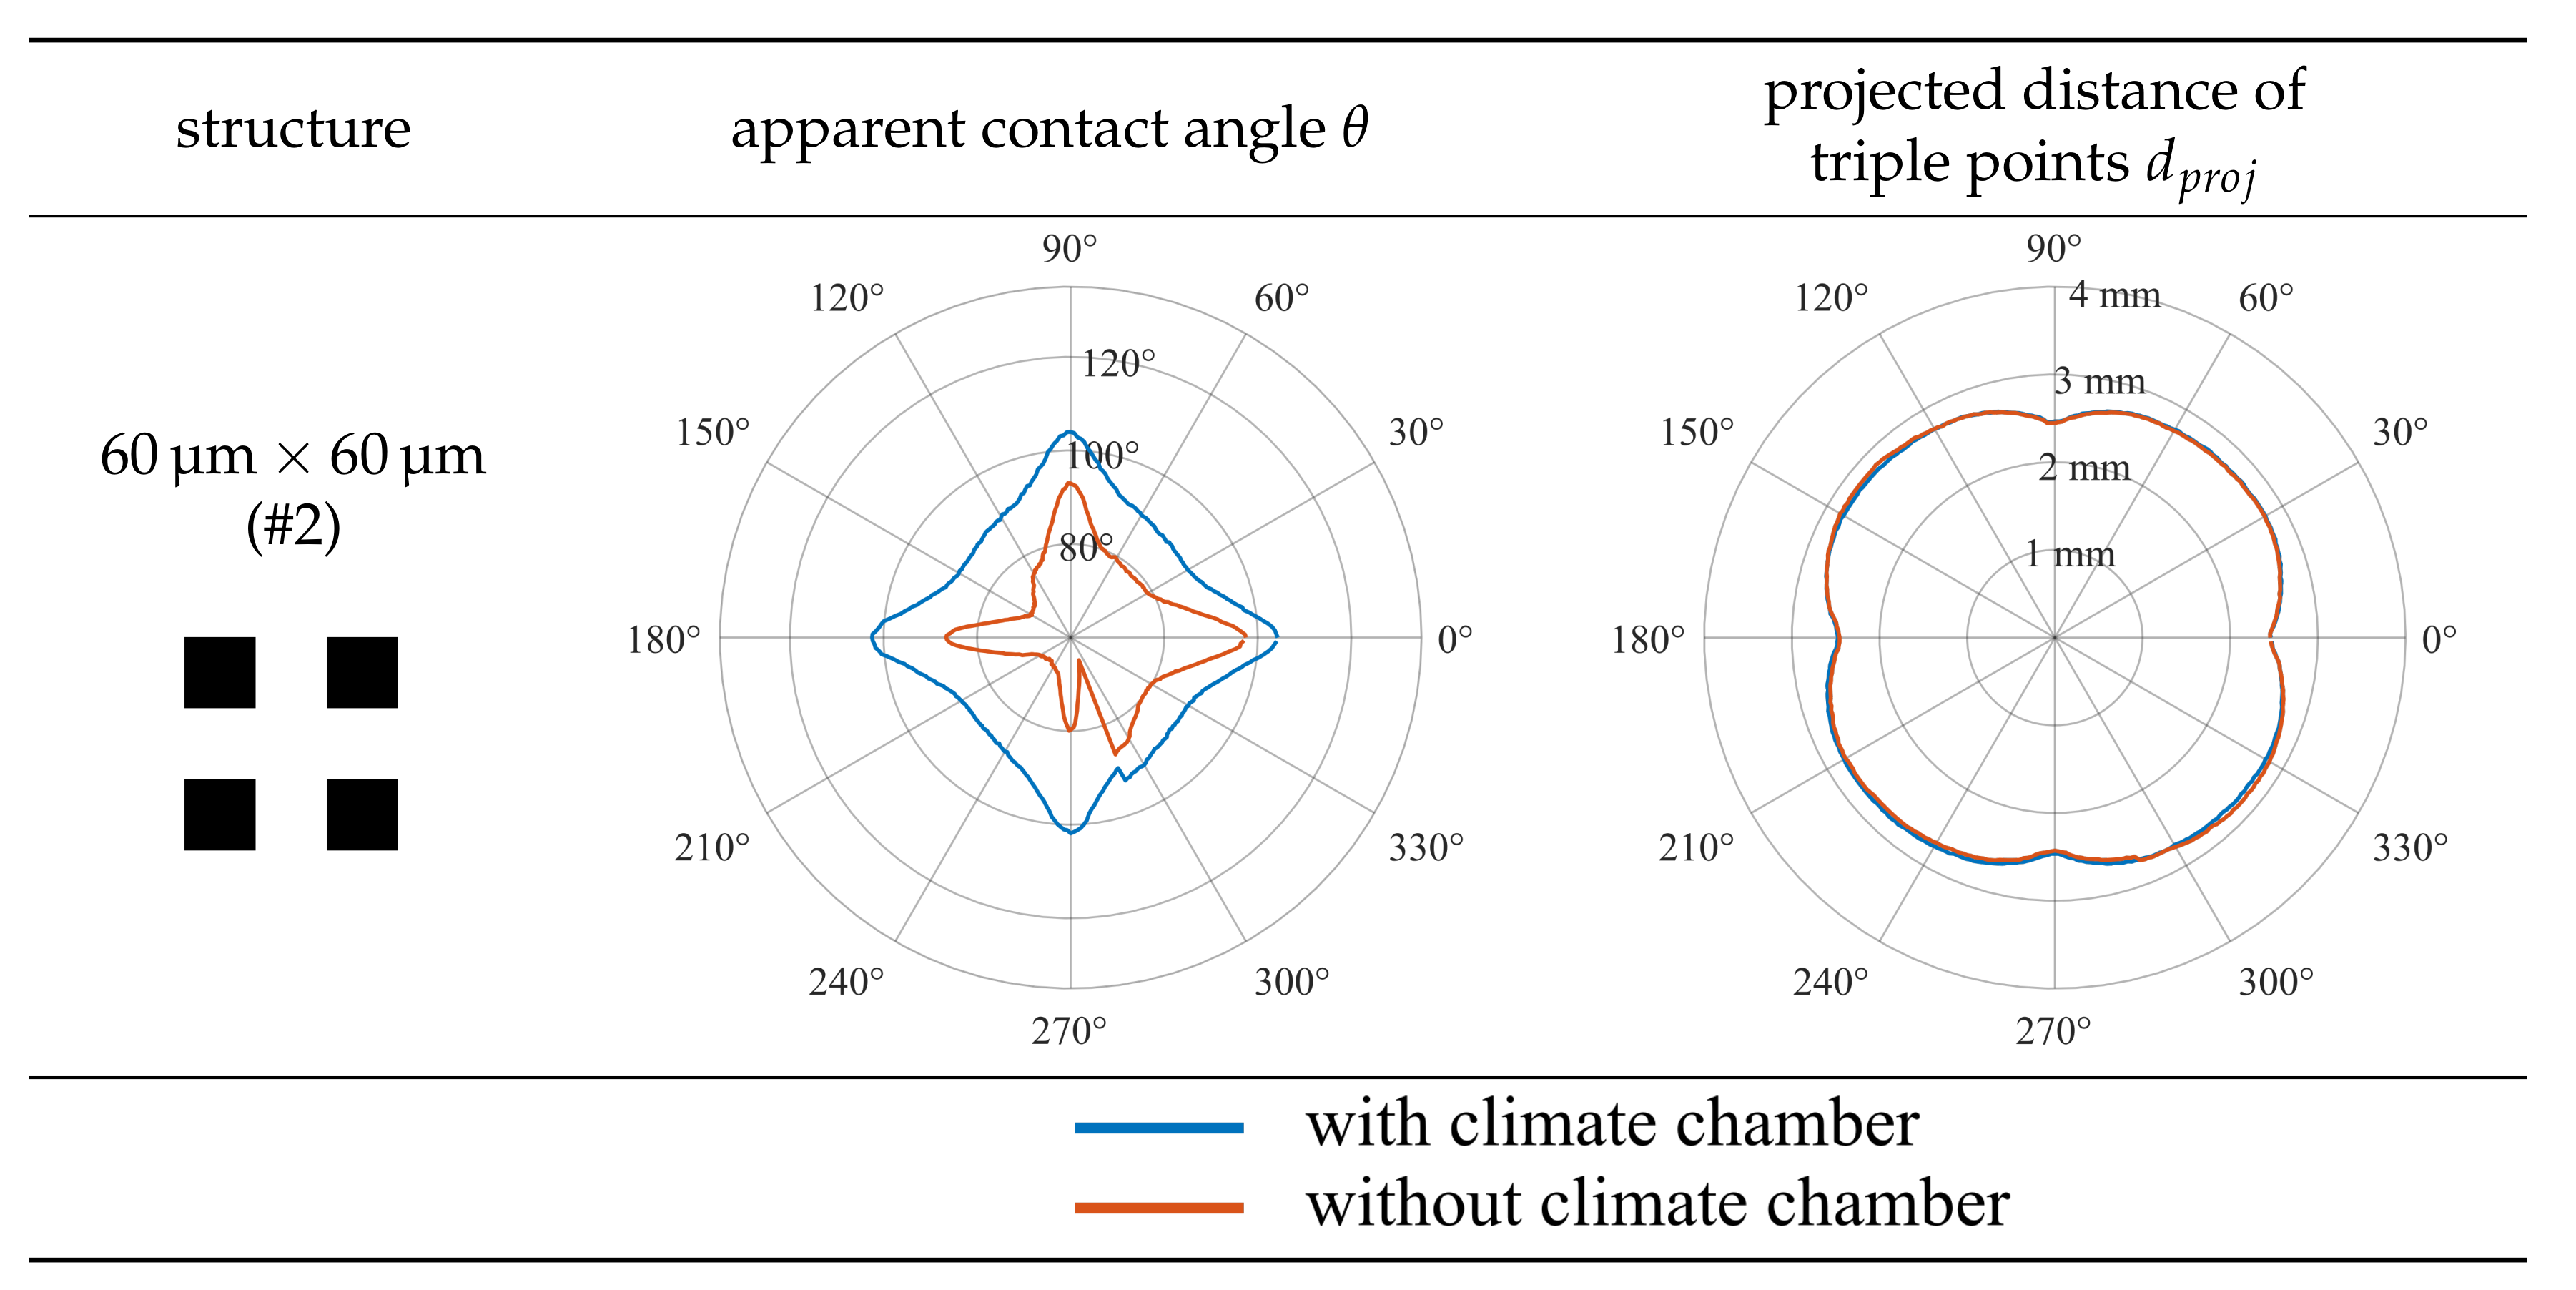
4.2. Results of Apparent Contact Angle Measurements on Structured Surfaces

As already calculated with the OWRK-model, the contact angle on smooth polycarbonate surfaces is θ O W R K 79.9 ° . However, the influence of rough or structured surfaces cannot be captured by this model. Gently deposited droplets on structured surfaces will form a non-circular three-phase contact line which also affects the local apparent contact angles [5]. For this reason, on the basis of the described measurement procedure and the evaluation routine, 22 experiments for each surface structure were conducted, making in total 88 experiments. Hereby, the careful inspection of the single surface structures did not show any deficiencies which might have influenced the droplet shape and consequently the following results. The evaluated single experiments were plotted together for each structure into one single polar graph for the mean apparent contact angle θ and the projected distance between the triple points d p r o j with respect to the respective azimuthal angle. In Figure 7, all 22 experiments for the surface sample type #2 with 60 × 60   μ m 2 sized pillars are depicted. In order to be able to compare the apparent contact angles at the same azimuthal angles with respect to the observation perspective, the gathered values, namely apparent contact angle θ and projected distance of triple points d p r o j , were aligned in such a way that the largest apparent contact angles of the first quadrant coincided at α = 0 . This is equivalent to the fact that all structures had the same orientation at the beginning of the experiments. Since a pre-alignment was performed, the angle shifts of the data during this alignment correction were always very low. A comparison of aligned data and not aligned data can also be found in Figure 7. The maximum rotation offset between the data sets can be estimated to be approximately Δ α 12 ° . For the other structures, comparable results can be determined.
The summary of the results for all surface structure patterns #1 to #4 is depicted in Figure 8, in which the mean values of the local apparent contact angle θ ( α ) and the projected distance of triple points d p r o j ( α ) are shown. The upper and lower limit of the standard deviation is calculated for each single azimuthal angle. The maximum and minimum apparent contact angles θ and the projected distance of the triple points d p r o j are summarized in Table 2. The indicated tolerance of the measured values are corresponding to the standard deviation of all measurements of the respective structure. Figure 9 correlates the results of Table 2 with the Wenzel roughness factor r [16] of the respective surface types. A very low evaporation of the droplet, which lost about 7% of its total mass to the initial state, was unavoidable; however, the results are not very affected, see Figure 10. Nevertheless, the depicted profiles can be assumed to be symmetrical so that only the first quadrant ( 0 ° θ 90 ° ) of the graphs after the alignment of the experimental data are used for the minimum and maximum values of θ and d p r o j in Table 2. The idea behind that procedure is that the influence of the evaporation was smaller for lower azimuthal angles due to an earlier acquisition of the shadowgraphs.
With the help of Table 2 and Figure 8 and Figure 9 several conclusions can be drawn: Firstly, a strong connection between the apparent contact angle θ and the projected distance of the triple points d p r o j can be observed—the larger the apparent contact angle θ , the smaller d p r o j and vice versa. The pinning of liquid to the arrays of pillars and grooves lead to a non-circular, almost squared droplet base. This was also observed, for example, by Raj et al. [24]. In detail, the highest apparent contact angle can be determined at azimuthal angles of α = n · 90 ° with n = 1 ; 2 ; 3 ; , while the lowest apparent contact angle can be determined diagonally to the structure at azimuthal angles of α = 45 ° + n · 90 ° with n = 1 ; 2 ; 3 ; . In contrast to this, the projected distance between the triple points is the longest diagonal to the structure and the shortest looking in the direction of the structure. For the grooves, the situation is slightly different. The highest apparent contact angle can be observed at an azimuthal angle of α = 0 ° and 180°, which is concurrently the direction of the shortest projected distance between the triple points. The liquid spreads mainly in the direction of the grooves leading to the longest d p r o j and the lowest θ for all measurements. In addition to the main behaviour, there is also a small local maximum of the apparent contact angle in the range of θ = 90 ° and θ = 270 ° . This maximum comes from the pinning at the end of the long side of the pillar. The gap of d 2 = 15   μ m here causes the pinning. Consequently, a slight flattening of the d p r o j –profile in this azimuthal area can also be observed. For the grooves, the same behaviour could be seen in principle in Santini et al. [25], who had, however, larger groove dimensions and a different groove geometry. Secondly, additional experimental evaluations using a total internal reflection approach have shown that the droplet is completely impregnating the structure under the droplet base, independently of which structure type (#1–#4) was used. The droplet was, therefore, always in the Wenzel state. This behavior is in correspondence with the following transition condition between Casie-Baxter and Wenzel state [45] in which r is the roughness factor by Wenzel [16], ϕ S the fraction of the wetted solid area introduced by Cassie and Baxter [17] and θ the contact angle on smooth surfaces.
θ > θ c , with cos θ c = 1 ϕ r ϕ .
Using the model of Wenzel, however, will predict for a hydropbilic behavior on smooth surfaces an amplification of such behavior with increasing surface roughness [16,18,45]. Therefore, according the model, contact angles lower than θ 79.9 ° should be expected, but this was not observable. The reasons for this might be that the model does not consider any pinning effects as introduced before with Equation (3) leading to an azimuthal dependency in θ and d p r o j . The found results and the physical behaviour can consequently not be described by this law. Thirdly, it can be seen that the apparent contact angles are increasing with decreasing edge lengths of the respective pillar structures, and thus, increasing Wenzel factor r. For the tiniest pillars (#4) the maximum observed apparent contact angle is about 126° while the maximum apparent contact angle for the largest pillars (#2) is about 105°. The apparent contact angle range for grooves (#1) is between 79° and 122°, which are, due to the non-square cross sections, however, not fully comparable to the pillar structures (#2 to #4). The measurable apparent contact angle hysteresis between the maximum and minimum contact angle of the pillar structures is with approximately 15° almost identical for pillar edge lengths of 60 μ m and 30 μ m , see Figure 9. For the smallest pillars, this hysteresis is with almost 7° significantly smaller. Therefore, it can be assumed that with an increasing Wenzel factor r and, therefore, decreasing edge lengths, the contact angle hysteresis is decreasing and might be not measurable anymore at a certain pillar size. Fourthly, the pinning of the liquid is taking place at very discrete positions of the pillars. The energetically favourable places for liquid pinning are the outer edges of the pillars facing away from the inner drop, as also described in Kalinin et al. [7] and Langbein [22]. If the liquid is advancing over one gap, indicated by d or d 1 and d 2 , respectively, the whole pillar is wetted and again the pinning will occur at the outer edge of the pillars away from the inner drop. This coincides also with the zipping movement described by Courbin et al. [46]. Fifthly, the absolute standard deviation for both, θ and d p r o j , can be considered as almost constant for the presented experiments. Influences on the droplet dimensions and the apparent contact angle are for instance the droplet volume and the deposition process. Further, the standard deviation of d p r o j can be set into relation to the edge lengths as follows: σ ( d p r o j , j ) / w j . This relative relation is clearly tending to be smaller for larger pillar edge lengths in comparison to the smaller edge lengths. For smaller edge lengths the standard deviation exceeds several times the edge length. The reason for this behaviour could be the amount of energy required to pin from one row of pillars to the next one. The grooves (#1) and the largest pillars (#2) have in one direction the same edge length and gap distance of 60 μ m each. When comparing the relative standard deviations of d p r o j for this direction, an agreement of the values can be found. Therefore, the greater the distance, the more energy is required and, due to the discrete pinning, the less likely a scattering of the measurement results. This also coincides with the assumption made above, that with further decreasing pillar edge lengths the apparent contact angle hysteresis is further weakening. In conclusion, the results impressively show the need to measure the apparent contact angle over an azimuthal angle range for regularly micro-structured surfaces. Thereby it is crucial that the measurement range covers at least the symmetry of the structure pattern, that is, a range of 90 for all the available surfaces presented in this work. For isotropic rough surfaces, however, it is also recommendable to multiply measure the contact angle at least on several spots or at different azimuthal angles in order to account for the pinning and apparent contact angle variation on the particular surface.

4.3. Effectiveness of the Climate Chamber and Error in Apparent Contact Angle Measurements

The effectiveness of the climate chamber can be observed in Figure 10 in which experimental results are compared between measurements of a deposited droplet on pillars of a square cross-section with an edge length of 60 μ m (#2) once measured under an atmosphere with a high relative humidity of 99 %RH and once under ambient conditions with approximately 50 %RH, say without an activated climate chamber. The azimuthal angle can be understood not only as the direction of observation but also as a time axis, since higher azimuthal angles have been acquired at a higher droplet age. The start and end of the measurement is located at the azimuthal angle α = 290 ° . An angle of α = 0 ° corresponds to an alignment to one main direction of the structure. For the measurement under a relative humidity of 99 %RH, data line in blue, the difference of the starting and the end apparent contact angle is Δ θ 3 ° . During this measurement, the droplet has lost about 7% of its mass compared to the initial state. For the measurement without activated climate chamber (data line in red) the difference is Δ θ 21.5 ° . Here, the droplet has lost approximately 67% of its initial mass. However, the projected distance between the triple points d p r o j is almost identical. This clearly shows the strong pinning of the droplet to the structure and consequently the direct influence of the droplet volume to the apparent contact angle θ .
In a further investigation we have measured the velocity around the droplet using a hot wire anemometer. A Reynolds number of R e 72 could be determined, which is defined as R e = d p r o j u / ν , using the projected distance between the triple points d p r o j , the measured mean velocity u and the kinematic viscosity ν of the surrounding atmosphere [47]. Equations (8)–(10) have been used for calculating the Sherwood number to S h 6.9 , using the analogy between heat and mass transfer [48]:
S h = 2 + S h l a m 2 + S h t u r b 2
S h l a m = 0.664 R e S c 3
S h t u r b = 0.037 R e 0.8 S c 1 + 2.443 R e 0.1 ( S c 2 / 3 1 ) .
The Sh number is defined as S h = k d p r o j / D and the Schmidt number as S c = ν / D [47]. For the calculation, the characteristic length d p r o j , the diffusion coefficient D and the mass transfer coefficient k are used [48]. The mass transfer coefficient k is defined in Equation (11) and can be transformed to Equation (12) in which it is only dependent on the mass flow m ˙ f l , the difference in the partial density of the transferred species of the boundary layer ρ B L , v a p and the ambiance ρ , v a p as well as on the surface area of the droplet. The droplet is assumed to be a spherical cap with a diameter of d p r o j .
k = n ˙ A A Δ c A
k = m ˙ f l 1 / 2 π d p r o j 2 ρ B L , v a p ρ , v a p .
In the literature it has been shown that the mass transfer decreases linearly with increasing ambient relative humidity [49,50]. This can be understood, since the increasing ambient relative humidity leads to a decreasing partial density difference in Equation (12), which is in fact really small. The calculated mass flow or mass loss of the droplet, respectively, is approximately m ˙ f l 1 , 22 × 10 −10 kg s−1, which is 0.00245% per second in relation to the total droplet mass. This is in very good agreement with the experimentally measured mass loss during the measuring time of approximately 12 to 15 min. Considering also an error of about Δ θ = ± 1 ° [51] for the apparent contact angle measurements, it can be shown that the performed measurements are unaffected by droplet evaporation.

5. Conclusions and Outlook

In conclusion, it could be shown that the reproduction of micro-structured polymeric surfaces with a combination of Direct LASER Writing (DLW) lithography and electroforming is quite complex and effortful. However, it is reasonable if such surfaces should be used and produced in a small series for the presented purpose since the reproduction quality, as shown, is very high. A well working measurement device, and the procedure for performing apparent contact angle measurements using the sessile drop method while varying the azimuthal angle of observation, have been presented in detail. During the measurement, a saturated atmosphere of droplet liquid needs to be maintained in order to avoid a mass transfer, which can significantly influence the obtained results.
The measurements on micro-structured surfaces with grooves and pillars of a square cross-section have shown the pinning of the drop liquid to the individual roughness features. Asymmetric drops with non-circular three-phase contact lines were obtained so that a dependency of the apparent contact angle θ and the projected distance of the triple points d p r o j on the azimuthal angle α was demonstrated. The magnitude of pinning, measurable in the contact angle hysteresis and the asymmetry of the droplet depends here on the used shape of micro-structures and the length scales of the single roughness features. For smaller length scales, the apparent contact angle hysteresis decreases since the roughness isotropy is increasing while the energy needed for pinning from one roughness feature to the next one decreases. As an observable consequence, the droplet has, then, a more circular droplet base and consequently a more uniform apparent contact angle distribution θ ( α ) . Overall, it was found that it is highly recommendable to perform apparent contact angle measurements on structured surfaces, especially regularly structured but also as randomly structured over an azimuthal range covering at least the symmetry of the structure and the deposited droplet. Additionally, an apparent contact angle distribution θ ( α ) , or at least a contact angle interval, should be provided instead of one single value θ .
For further evaluations, the wetting behavior of the surfaces should be manipulated, for example, using plasma polymerization or activation in order to increase and decrease the tendency of wetting. This can then show the sensitivity of the wetting behavior to the pinning behavior and the apparent contact angle distribution.

Author Contributions

P.F. designed the experimental setup for measuring the apparent contact angle, performed the apparent contact angle measurements, analysed and interpreted the results and wrote the main manuscript text. F.R. helped to design the experimental setup for measuring the apparent contact angle, performed the apparent contact angle measurements and performed the evaluation of gathered results. Staff from the KNMF (M.W. and S.H.) have carried out the production and characterization of the micro-structured surfaces and co-wrote the manuscript text. B.W. interpreted the results and co-wrote the main manuscript text. He was also responsible for the administration and funding acquisition. All authors have read and agreed to the published version of the manuscript.

Funding

The authors kindly acknowledge the financial support of this work by the Deutsche Forschungsgemeinschaft (DFG) in the frame of the International Research Training Group “Droplet Interaction Technologies” (GRK2160/1: DROPIT). The mould fabrication and replication was carried out with the support of the Karlsruhe Nano Micro Facility (KNMF proposal 2016-017-016369, www.knmf.kit.edu), a Helmholtz Research Infrastructure at Karlsruhe Institute of Technology (KIT, www.kit.edu).

Conflicts of Interest

The authors declare no conflict of interest. The funders had no role in the design of the study; in the collection, analyses, or interpretation of data; in the writing of the manuscript, or in the decision to publish the results.

References

  1. Hensel, R.; Helbig, R.; Aland, S.; Braun, H.G.; Voigt, A.; Neinhuis, C.; Werner, C. Wetting Resistance at Its Topographical Limit: The Benefit of Mushroom and Serif T Structures. Langmuir 2013, 29, 1100–1112. [Google Scholar] [CrossRef]
  2. Parker, A.R.; Lawrence, C.R. Water capture by a desert beetle. Nature 2001, 414, 33–34. [Google Scholar] [CrossRef]
  3. Bico, J.; Tordeux, C.; Quéré, D. Rough wetting. Europhys. Lett. (EPL) 2001, 55, 214–220. [Google Scholar] [CrossRef] [Green Version]
  4. Courbin, L.; Bird, J.C.; Reyssat, M.; Stone, H.A. Dynamics of wetting: From inertial spreading to viscous imbibition. J. Phys. Condens. Matter 2009, 21, 464127. [Google Scholar] [CrossRef]
  5. Huang, X.; Gates, I. Apparent Contact Angle around the Periphery of a Liquid Drop on Roughened Surfaces. Sci. Rep. 2020, 10, 8220. [Google Scholar] [CrossRef]
  6. Foltyn, P.; Restle, F.; Weigand, B. 360 Evaluation of Projected Contact Angles of Static Droplets on Structured Surfaces; Droplet Impact Phenomena & Spray Investigations (DIPSI): Bergamo, Italy, 2019; pp. 14–17. [Google Scholar] [CrossRef]
  7. Kalinin, Y.V.; Berejnov, V.; Thorne, R.E. Contact Line Pinning by Microfabricated Patterns: Effects of Microscale Topography. Langmuir 2009, 25, 5391–5397. [Google Scholar] [CrossRef] [Green Version]
  8. Morita, M.; Koga, T.; Otsuka, H.; Takahara, A. Macroscopic-Wetting Anisotropy on the Line-Patterned Surface of Fluoroalkylsilane Monolayers. Langmuir 2005, 21, 911–918. [Google Scholar] [CrossRef]
  9. Rioboo, R.; Marengo, M.; Tropea, C. Time evolution of liquid drop impact onto solid, dry surfaces. Exp. Fluids 2002, 33, 112–124. [Google Scholar] [CrossRef]
  10. Josserand, C.; Lemoyne, L.; Troeger, R.; Zaleski, S. Droplet impact on a dry surface: Triggering the splash with a small obstacle. J. Fluid Mech. 2005, 524, 47–56. [Google Scholar] [CrossRef]
  11. Antonini, C.; Amirfazli, A.; Marengo, M. Drop impact and wettability: From hydrophilic to superhydrophobic surfaces. Phys. Fluids 2012, 24, 102104. [Google Scholar] [CrossRef]
  12. Sivakumar, D.; Katagiri, K.; Sato, T.; Nishiyama, H. Spreading behavior of an impacting drop on a structured rough surface. Phys. Fluids 2005, 17, 100608. [Google Scholar] [CrossRef]
  13. Vaikuntanathan, V.; Sivakumar, D. Maximum Spreading of Liquid Drops Impacting on Groove-Textured Surfaces: Effect of Surface Texture. Langmuir 2016, 32, 2399–2409. [Google Scholar] [CrossRef]
  14. Malouin, B.A.; Koratkar, N.A.; Hirsa, A.H.; Wang, Z. Directed rebounding of droplets by microscale surface roughness gradients. Appl. Phys. Lett. 2010, 96, 234103. [Google Scholar] [CrossRef]
  15. De Gennes, P.G. Wetting: Statics and dynamics. Rev. Mod. Phys. 1985, 57, 827–863. [Google Scholar] [CrossRef]
  16. Wenzel, R.N. Resistance of solid surfaces to wetting by water. Ind. Eng. Chem. 1936, 28, 988–994. [Google Scholar] [CrossRef]
  17. Cassie, A.B.D.; Baxter, S. Wettability of porous surfaces. Trans. Faraday Soc. 1944, 40, 546–551. [Google Scholar] [CrossRef]
  18. McHale, G.; Shirtcliffe, N.J.; Aqil, S.; Perry, C.C.; Newton, M.I. Topography Driven Spreading. Phys. Rev. Lett. 2004, 93, 036102. [Google Scholar] [CrossRef] [PubMed]
  19. Extrand, C.W.; Moon, S.I. Contact Angles on Spherical Surfaces. Langmuir 2008, 24, 9470–9473. [Google Scholar] [CrossRef]
  20. Gibbs, J.W.V. The Collected Works of J. Willard Gibbs: 1 Thermodynamics, Reprint ed.; Yale Univ. Press: New Haven, CT, USA, 1957; Volume 1, p. XXVIII. [Google Scholar]
  21. Öner, D.; McCarthy, T.J. Ultrahydrophobic Surfaces. Effects of Topography Length Scales on Wettability. Langmuir 2000, 16, 7777–7782. [Google Scholar] [CrossRef]
  22. Langbein, D. (Ed.) Capillary Surfaces. In Springer Tracts in Modern Physics; Springer: Berlin/Heidelberg, Germany, 2002; Volume 178. [Google Scholar] [CrossRef]
  23. Kim, D.; Pugno, N.M.; Ryu, S. Wetting theory for small droplets on textured solid surfaces. Sci. Rep. 2016, 6, 37813. [Google Scholar] [CrossRef]
  24. Raj, R.; Adera, S.; Enright, R.; Wang, E.N. High-resolution liquid patterns via three-dimensional droplet shape control. Nat. Commun. 2014, 5, 4975. [Google Scholar] [CrossRef] [PubMed] [Green Version]
  25. Santini, M.; Guilizzoni, M.; Fest-Santini, S. X-ray computed microtomography for drop shape analysis and contact angle measurement. J. Colloid Interface Sci. 2013, 409, 204–210. [Google Scholar] [CrossRef]
  26. Marmur, A.; Della Volpe, C.; Siboni, S.; Amirfazli, A.; Drelich, J.W. Contact angles and wettability: Towards common and accurate terminology. Surf. Innov. 2017, 5, 3–8. [Google Scholar] [CrossRef] [Green Version]
  27. Drelich, J.; Wilbur, J.L.; Miller, J.D.; Whitesides, G.M. Contact Angles for Liquid Drops at a Model Heterogeneous Surface Consisting of Alternating and Parallel Hydrophobic/Hydrophilic Strips. Langmuir 1996, 12, 1913–1922. [Google Scholar] [CrossRef]
  28. Foltyn, P.; Guttmann, M.; Schneider, M.; Fest-Santini, S.; Wildenschild, D.; Weigand, B. Fabrication and evaluation methods of micro-structured surfaces for droplet impact experiments. In Droplet Interactions and Spray Processes; Lamanna, G., Tonini, S., Cossali, E., Weigand, B., Eds.; Fluid Mechanics and Its Applications; Springer: Berlin/Heidelberg, Germany, 2020; pp. IX, 294. [Google Scholar]
  29. Silverio, V.; de Freitas, S.C. Microfabrication Techniques for Microfluidic Devices. In Complex Fluid-Flows in Microfluidics; Galindo-Rosales, F.J., Ed.; Springer International Publishing: Cham, Switzerland, 2018; Chapter 2; pp. 25–51. [Google Scholar] [CrossRef]
  30. Wissmann, M.; Barié, N.; Guttmann, M.; Schneider, M.; Kolew, A.; Besser, H.; Pfleging, W.; Hofmann, A.; Erps, J.V.; Beri, S.; et al. Mould insert fabrication of a single-mode fibre connector alignment structure optimized by justified partial metallization. J. Micromech. Microeng. 2015, 25, 035008. [Google Scholar] [CrossRef]
  31. Heckele, M.; Schomburg, W.K. Review on micro molding of thermoplastic polymers. J. Micromech. Microeng. 2003, 14, R1–R14. [Google Scholar] [CrossRef]
  32. Worgull, M. Hot Embossing: Theory and Technology of Microreplication (Micro and Nano Technologies); Elsevier: Amsterdam, The Netherlands, 2009. [Google Scholar]
  33. MATLAB™. MATLAB™ Version 9.6 (R2019a); The MathWorks Inc.: Natick, MA, USA, 2019. [Google Scholar]
  34. MATLAB™. Image Processing Toolbox™ User’s Guide; The MathWorks Inc.: Natick, MA, USA, 2019; Volume R2019a. [Google Scholar]
  35. Andersen, N.K.; Gal, O.; Trujillo-Pino, A. Drop Shape Analysis. Fit Contact Angle by Double Ellipses or Polynomials; The MathWorks Inc.: Natick, MA, USA, 2016. [Google Scholar]
  36. Hunyadi, L. Fitting Quadratic Curves and Surfaces; The MathWorks Inc.: Natick, MA, USA, 2014. [Google Scholar]
  37. Hunyadi, L.; Vajk, I. Constrained quadratic errors-in-variables fitting. Vis. Comput. 2014, 30, 1347–1358. [Google Scholar] [CrossRef]
  38. Greiveldinger, M.; Shanahan, M.E. A Critique of the Mathematical Coherence of Acid/Base Interfacial Free Energy Theory. J. Colloid Interface Sci. 1999, 215, 170–178. [Google Scholar] [CrossRef]
  39. Owens, D.K.; Wendt, R.C. Estimation of the surface free energy of polymers. J. Appl. Polym. Sci. 1969, 13, 1741–1747. [Google Scholar] [CrossRef]
  40. Rabel, W. Einige Aspekte der Benetzungstheorie und ihre Anwendung auf die Untersuchung und Veränderung der Oberflächeneigenschaften von Polymeren. Farbe Lacke 1971, 77, 997–1005. [Google Scholar]
  41. Kaelble, D.H. Dispersion-Polar Surface Tension Properties of Organic Solids. J. Adhes. 1970, 2, 66–81. [Google Scholar] [CrossRef]
  42. Fowkes, F.M. Attractive Forces At Interfaces. Ind. Eng. Chem. 1964, 56, 40–52. [Google Scholar] [CrossRef]
  43. Ström, G.; Fredriksson, M.; Stenius, P. Contact angles, work of adhesion, and interfacial tensions at a dissolving Hydrocarbon surface. J. Colloid Interface Sci. 1987, 119, 352–361. [Google Scholar] [CrossRef]
  44. DataPhysics Instruments GmbH. Surface Tensions/Energies. 2018. Available online: https://www.dataphysics-instruments.com/Downloads/Surface-Tensions-Energies.pdf (accessed on 9 April 2019).
  45. Quéré, D. Non-sticking drops. Rep. Prog. Phys. 2005, 68, 2495–2532. [Google Scholar] [CrossRef]
  46. Courbin, L.; Denieul, E.; Dressaire, E.; Roper, M.; Ajdari, A.; Stone, H.A. Imbibition by polygonal spreading on microdecorated surfaces. Nat. Mater. 2007, 6, 661–664. [Google Scholar] [CrossRef] [PubMed]
  47. Ruzicka, M. On dimensionless numbers. Chem. Eng. Res. Des. 2008, 86, 835–868. [Google Scholar] [CrossRef]
  48. Gnielinski, V. G9 Fluid-Particle Heat Transfer in Flow Through Packed Beds of Solids. In VDI Heat Atlas; Springer: Berlin/Heidelberg, Germany, 2010; pp. 743–744. [Google Scholar] [CrossRef]
  49. Ruberto, S.; Reutzsch, J.; Roth, N.; Weigand, B. A systematic experimental study on the evaporation rate of supercooled water droplets at subzero temperatures and varying relative humidity. Exp. Fluids 2017, 58, 55. [Google Scholar] [CrossRef]
  50. Seck, A.; Geist, S.; Harbeck, J.; Weigand, B.; Joos, F. Evaporation Modeling of Water Droplets in a Transonic Compressor Cascade under Fogging Conditions. Int. J. Turbomach. Propuls. Power 2019, 5, 5. [Google Scholar] [CrossRef] [Green Version]
  51. Andersen, N.K.; Taboryski, R. Drop shape analysis for determination of dynamic contact angles by double sided elliptical fitting method. Meas. Sci. Technol. 2017, 28, 047003. [Google Scholar] [CrossRef] [Green Version]
Figure 1. Structure patterns: (a) grooves and (b) pillars of square cross-section with the given parameters in Table 1.
Fluids 06 00092 g001
Figure 2. Quality inspection of the master mould made by Direct LASER Writing (DLW) lithography inspected by scanning electron microscopy (SEM) with a (a) 100× and (b) 2000× magnification. Quality inspection of the nickel shim which is used for the hot embossing reproduction process using SEM. The shim was inspected after removing the master mould at (c) 50×, (d,e) 100× and (f) 5000× magnification.
Fluids 06 00092 g002
Figure 3. Quality inspection of final polymer samples with squared pillars with an edge length of d = w = 60   μ m (surface no. #2) at (a) 100× and (b) 450× magnification.
Fluids 06 00092 g003
Figure 4. (a) Measurement principle of apparent contact angles on structured surfaces and the respective structure orientation in respect to the azimuthal angle of observation for (b) grooves and (c) squared pillars. The azimuthal angle indicates the relative position of the camera to the orientation of the rotating structure.
Fluids 06 00092 g004
Figure 5. Representative shadowgraphs for apparent contact angle measurements of a water droplet on pillars with an edge length of d = w = 60   μ m (#2). The azimuthal angle of (a) α = 45 ° corresponds to the diagonal direction in respect to the structure, (b) α = 90 ° corresponds to an aligned view in respect to the structure, see also Figure 4.
Fluids 06 00092 g005
Figure 6. Experimental setup for measuring the apparent contact angle with the sessile drop method in an azimuthal angle interval of 0° to 360° on structured surfaces.
Fluids 06 00092 g006
Figure 7. Experimental data for all 22 experiments for the structure type #2 with a pillar edge length of 60 μ m . Top: not aligned data, which is only aligned by the preliminary alignment during the experiment preparation; Bottom: aligned data, after a post-processing step in order to compare all data for the same structure alignment in respect to the observation perspective.
Fluids 06 00092 g007
Figure 8. Summarized local apparent contact angle θ ( α ) and projected distance of triple points d p r o j ( α ) for deposited droplets on differently structured surfaces with structure patterns described in Figure 1 and Table 1. The shown data was measured in 22 single experiments for each structure type resulting into total 88 experiments.
Fluids 06 00092 g008
Figure 9. Minimum and maximum apparent contact angle for structures with pillars of square cross-section (#2–#4) and the respective hysteresis in respect of edge length w and the corresponding roughness factor r introduced by Wenzel [16], see Table 1.
Fluids 06 00092 g009
Figure 10. Comparison of apparent contact angle measurements of a 5 μ L water droplet with an azimuthal angle range of 0° to 360° for the surface with 60 μ m -pillars (#2). The blue line represents a measurement with activated climate chamber. The red data line represents a measurement without activated climate chamber. The efficiency of the climate chamber can be clearly shown at the azimuthal angle α = 290 ° , which represents the point of the beginning and the end of the measurement.
Fluids 06 00092 g010
Table 1. Overview of dimensions of structure patterns depicted in Figure 1 and the respective roughness factor r introduced by Wenzel [16]: #1 corresponds to grooves, #2–#4 are corresponding to pillars.
No.Edge LengthDistanceHeight r = A tot A proj
#1 w 1 = 60   μ m
w 2 = 500   μ m
d 1 = 60   μ m
d 2 = 15   μ m
h = 20   μ m 1.36
#2 w = 15   μ m d = 15   μ m h = 20   μ m 1.33
#3 w = 30   μ m d = 30   μ m h = 20   μ m 1.67
#4 w = 60   μ m d = 60     μ m h = 20 μ m 2.33
Table 2. Summarized maximum and minimum apparent contact angles θ and projected distances of the triple points d p r o j with absolute and relative standard deviations for the quadrant ( 0 ° θ 90 ° ) in the shown graphs of Figure 8.
Structure ContactAngle θ proj. Distance of Triple Points d proj Rel. Standard Deviation of d proj
Grooves θ m a x = 121.6 ° ± 5.7 ° d p r o j , m i n = 1.76 m m ± 0.14 m m σ ( d p r o j , m i n ) / w 2 = ± 2.33
(#1) θ m i n = 79.1 ° ± 4.6 ° d p r o j , m a x = 3.13 m m ± 0.22 m m σ ( d p r o j , m a x ) / w 1 = ± 0.44
60   μ m × 60 μ m θ m a x = 105.2 ° ± 2.3 ° d p r o j , m i n = 2.35 m m ± 0.15 m m σ ( d p r o j , m i n ) / w = ± 2.50
(#2) θ m i n = 90.1 ° ± 1.7 ° d p r o j , m a x = 2.67 m m ± 0.14 m m σ ( d p r o j , m a x ) / w = ± 2.33
30   μ m × 30   μ m θ m a x = 117.3 ° ± 2.5 ° d p r o j , m i n = 2.05 m m ± 0.10 m m σ ( d p r o j , m i n ) / w = ± 3.33
(#3) θ m i n = 102.4 ° ± 2.8 ° d p r o j , m a x = 2.39 m m ± 0.09 m m σ ( d p r o j , m a x ) / w = ± 3.00
15   μ m × 15   μ m θ m a x = 126.3 ° ± 3.8 ° d p r o j , m i n = 1.80 m m ± 0.13 m m σ ( d p r o j , m i n ) / w = ± 8.67
(#4) θ m i n = 119.7 ° ± 3.7 ° d p r o j , m a x = 2.00 m m ± 0.14 m m σ ( d p r o j , m a x ) / w = ± 9.33
Publisher’s Note: MDPI stays neutral with regard to jurisdictional claims in published maps and institutional affiliations.

