
Near Stall Unsteady Flow Responses to Morphing Flap Deflections


1
Propulsion Engineering Centre, School of Aerospace Transport and Manufacturing, Cranfield University, Bedfordshire MK43 0AL, UK
2
Department of Engineering Design and Mathematics, University of the West of England, Coldharbour Lane, Frenchay, Bristol BS16 1QY, UK
*
Author to whom correspondence should be addressed.
Fluids 2021, 6(5), 180; https://0-doi-org.brum.beds.ac.uk/10.3390/fluids6050180
Submission received: 28 March 2021
/
Revised: 24 April 2021
/
Accepted: 27 April 2021
/
Published: 7 May 2021
(This article belongs to the Special Issue Computational Biofluid Mechanics)
Abstract
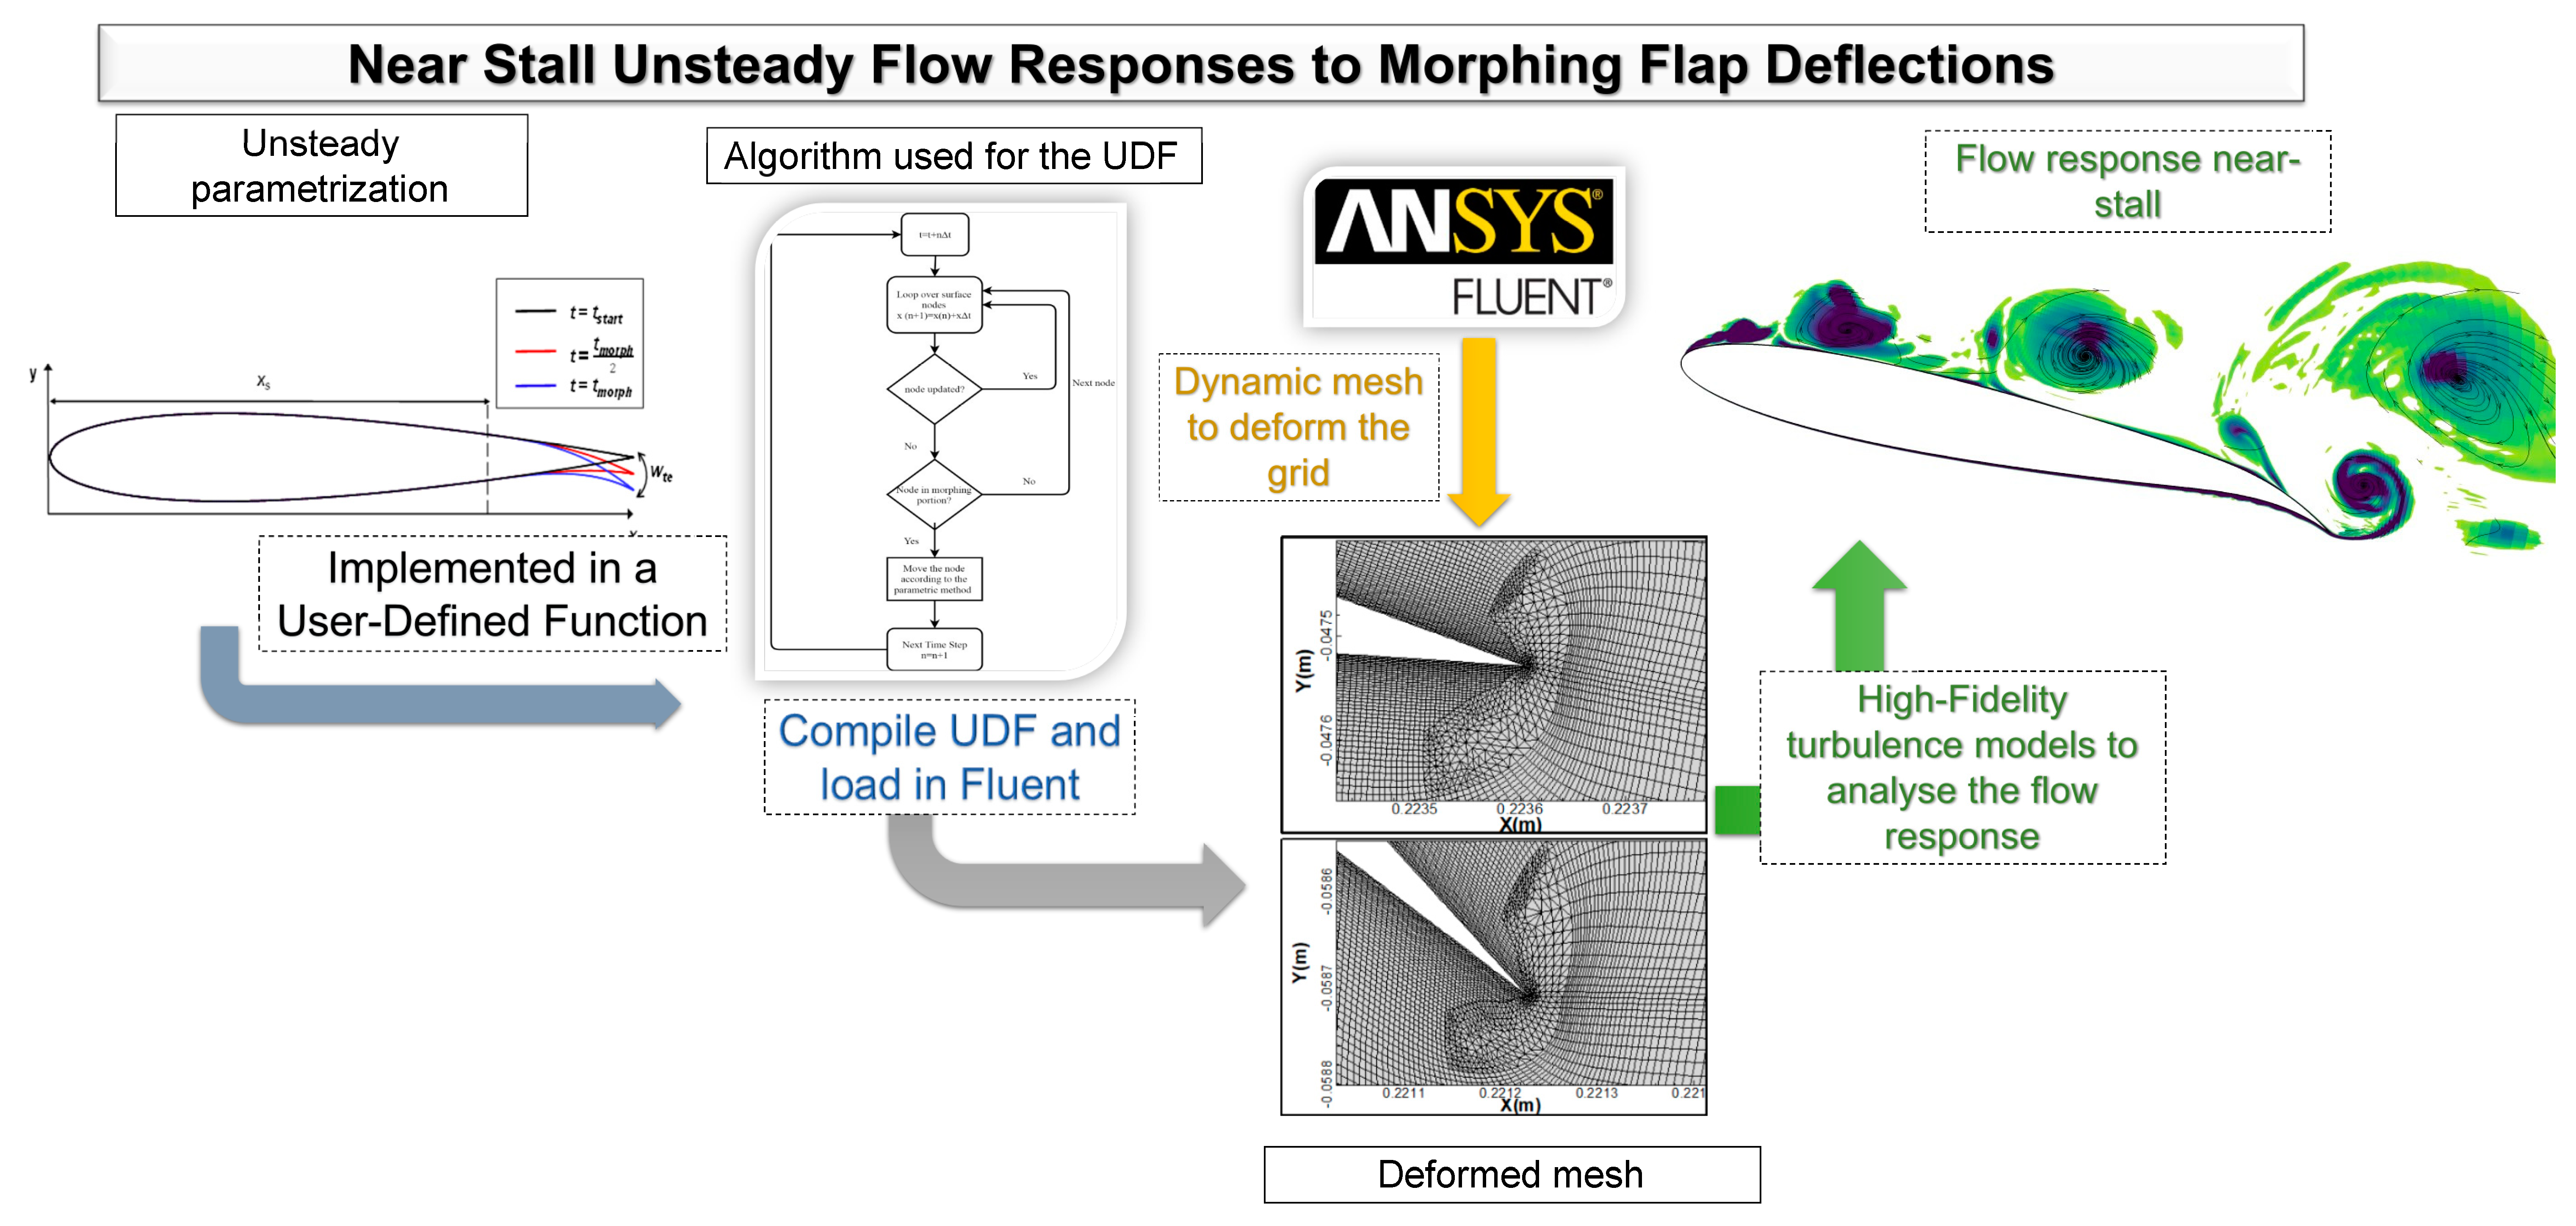
:The unsteady flow characteristics and responses of an NACA 0012 airfoil fitted with a bio-inspired morphing trailing edge flap (TEF) at near-stall angles of attack (AoA) undergoing downward deflections are investigated at a Reynolds number of 0.62 × 10⁶ near stall. An unsteady geometric parametrization and a dynamic meshing scheme are used to drive the morphing motion. The objective is to determine the susceptibility of near-stall flow to a morphing actuation and the viability of rapid downward flap deflection as a control mechanism, including its effect on transient forces and flow field unsteadiness. The dynamic flow responses to downward deflections are studied for a range of morphing frequencies (at a fixed large amplitude), using a high-fidelity, hybrid RANS-LES model. The time histories of the lift and drag coefficient responses exhibit a proportional relationship between the morphing frequency and the slope of response at which these quantities evolve. Interestingly, an overshoot in the drag coefficient is captured, even in quasi-static conditions, however this is not seen in the lift coefficient. Qualitative analysis confirms that an airfoil in near stall conditions is receptive to morphing TEF deflections, and that some similarities triggering the stall exist between downward morphing TEFs and rapid ramp-up type pitching motions.

1. Introduction
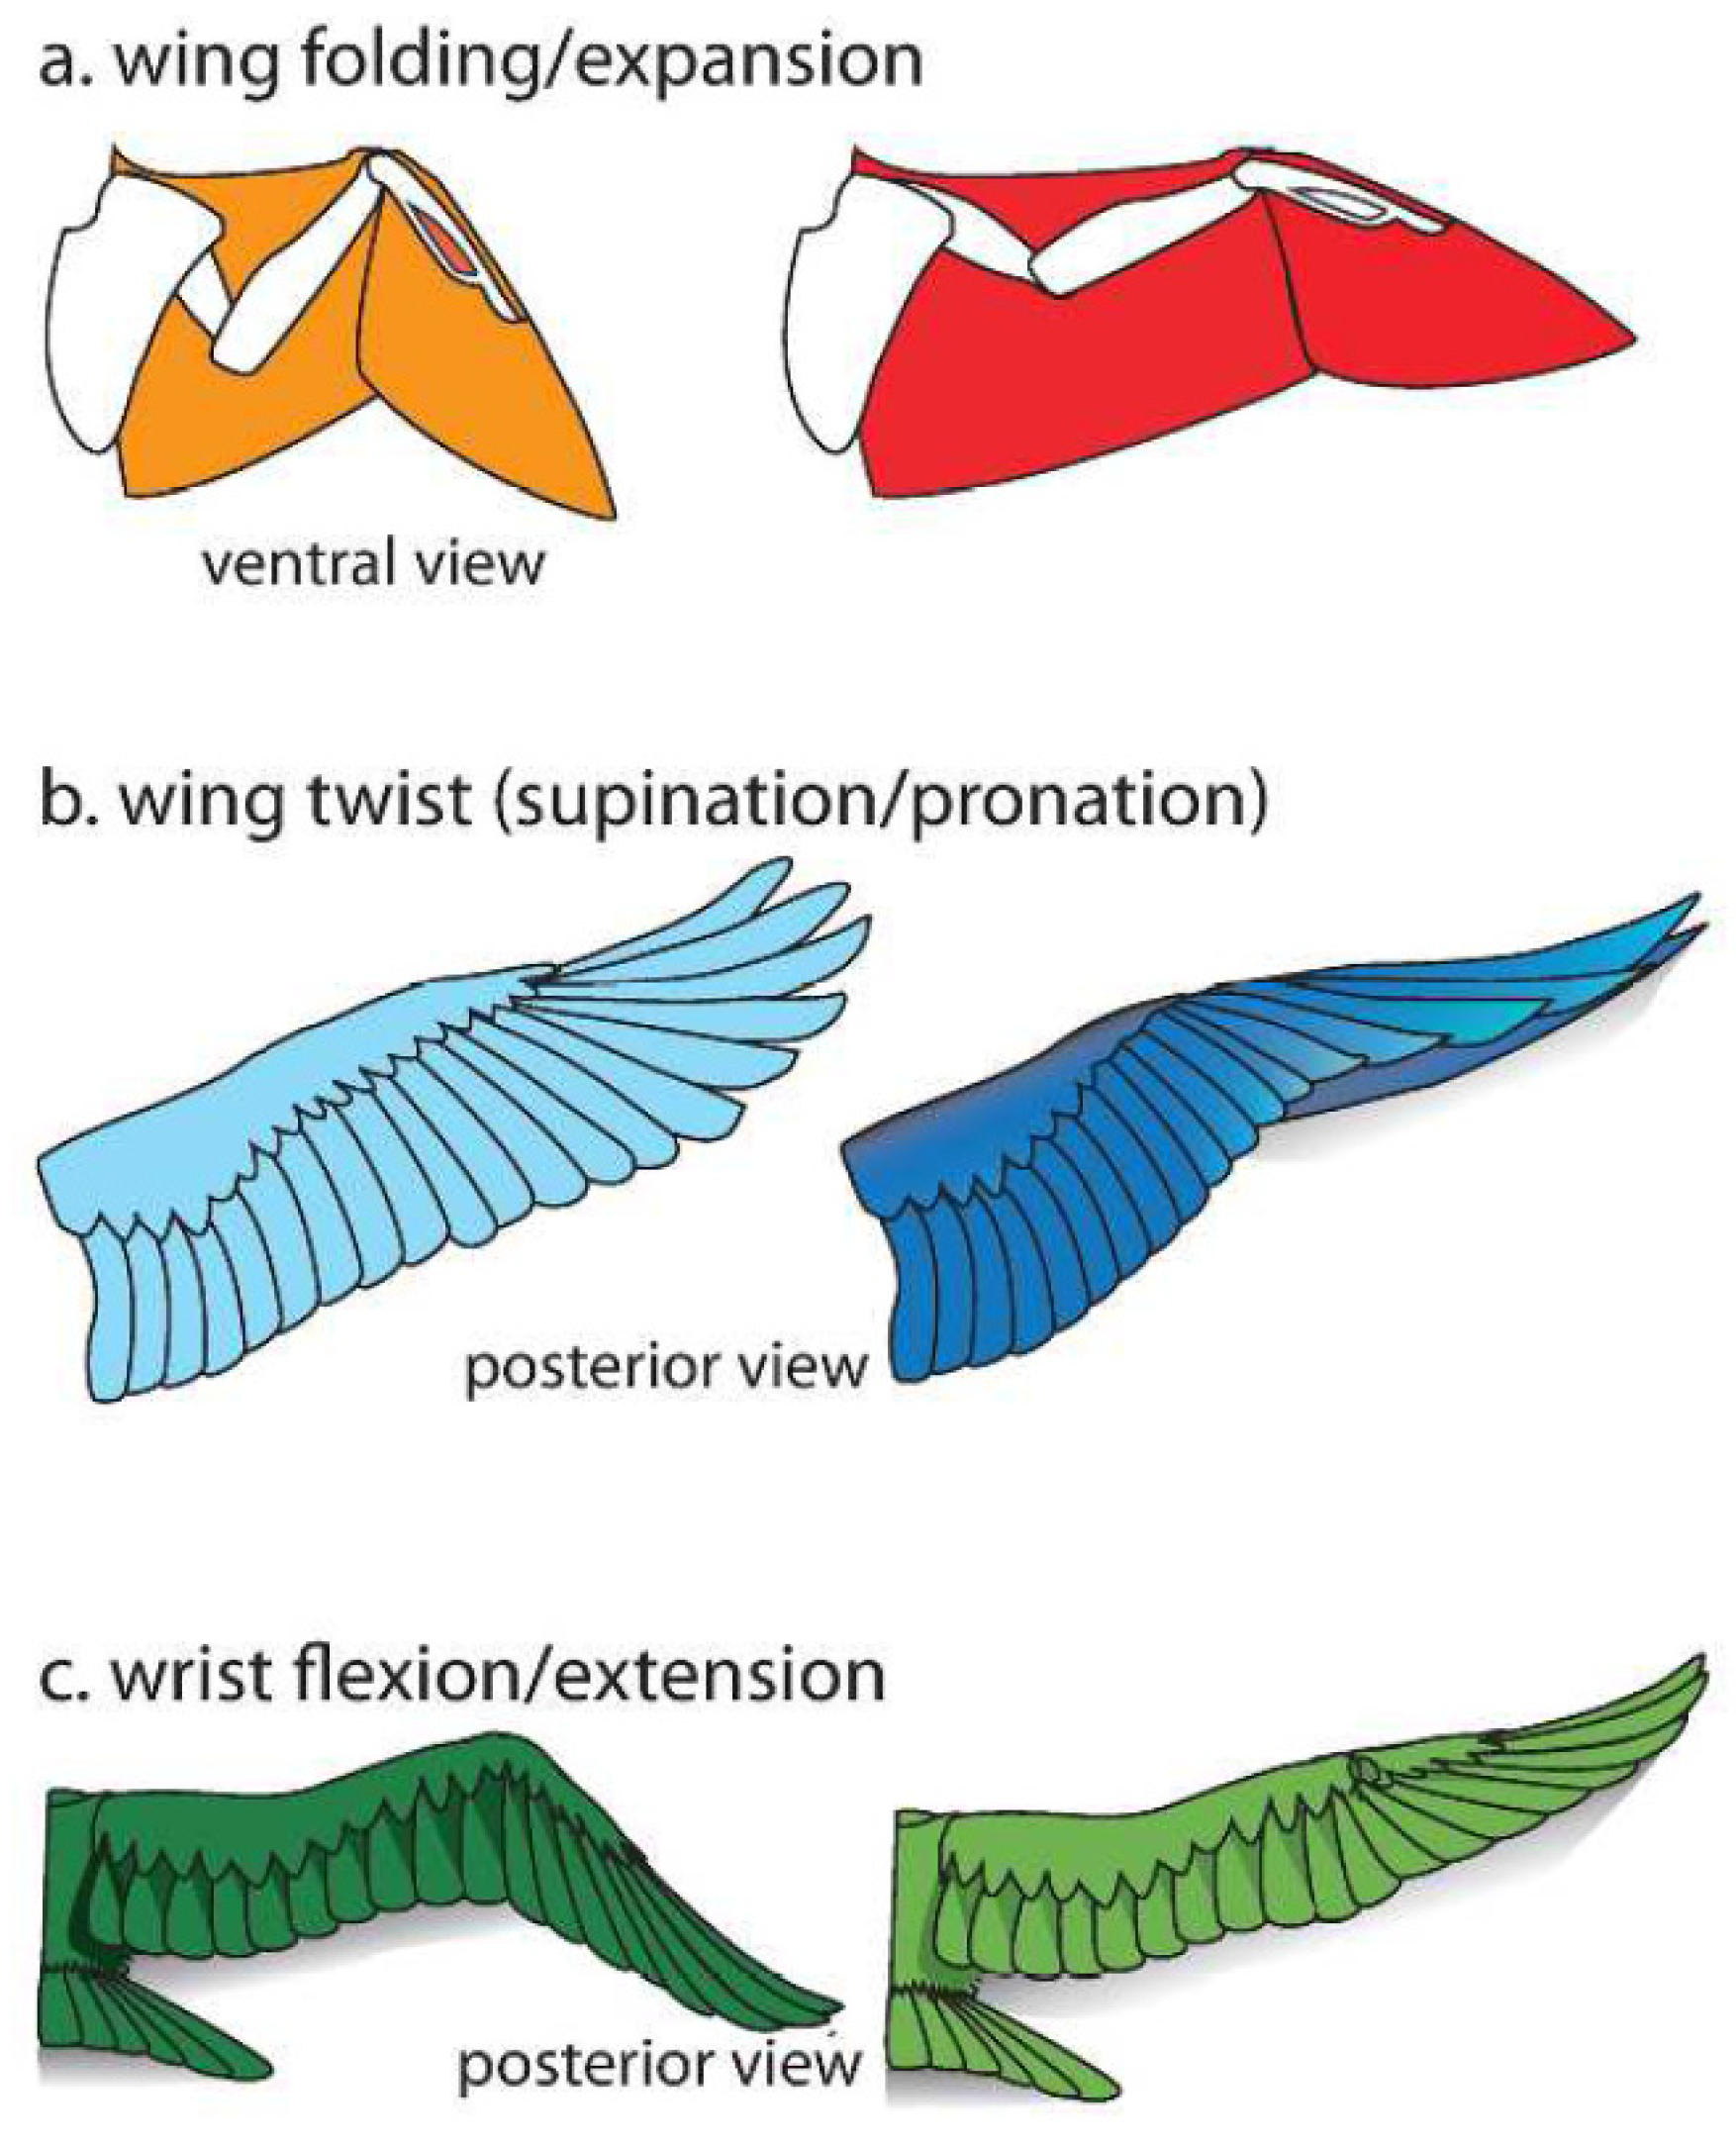
Most natural flyers (insects, birds, bats, or even extinct Pterosaurs) used shape changing, or morphing, mechanisms in order to harness the full capabilities of their wings [1,2] (Figure 1). Inspired by nature, the aerospace industry has recently seen a surge in the research and development of bio-inspired, intelligent, and adaptive design techniques for the next generation of aircrafts [3]. The promising bio-inspired concept of morphing structures is used on wings not only to optimize their shape during flight, but also to actively interact with the surrounding flow field in order to mitigate possible aerodynamic performance degradation, reduce the profile drag, delay onset of stall, or achieve early recovery from flow separation. However, there are many technical challenges in the integration of morphing configurations with an existing ‘rigid’ wing; one in particular is the difficulty of simulating and resolving the complex flow physics around morphing structures [4,5,6,7]. In addition, one would imagine the difficulty of finding the optimal morphing arrangements (e.g., frequency, amplitude, angle) whilst solving such numerically intensive simulations. William et al. [8] affirmed that a deeper understanding of fundamental flow responses to active morphing actuations is a prerequisite for improved flow control in unsteady aerodynamics.
In order to investigate the effects of morphing on the aerodynamic performance of airfoils and wings, various studies have focused on the numerical modeling of morphing wing flaps using low- to high-fidelity computational fluid dynamics (CFD) methods. Often, however, such studies simplify the problem into a series of steady-state CFD analyses in a ‘frozen’ position during the morphing, neglecting the dynamic effects that exist during such transient morphing processes.
Using a hybrid RANS-LES approach, Abdessemed et al. [9,10] investigated the aerodynamic performance of an airfoil fitted with a downward, statically morphing trailing-edge flap (TEF) at low angles of attack (AoA) and compared it with a traditional hinged TEF configuration. The results showed that on average, about a 6.5% increase in the lift-to-drag ratio could be achieved with the morphing configuration. Similar conclusions were made for a 3D straight wing embedded within a portion of a statically morphing TEF with a seamless side-edge transition to the wing ends, as investigated by the same authors [11].
The use of continuous actuation by means of morphing surfaces (e.g., [12]) or vibrating flaps (e.g., [13]) has been the subject of a few recent studies. For example, the ability of periodic surface morphing to mitigate flow separation and reduce drag at a low Reynolds number of 50,000 was demonstrated experimentally [12,13]. In a different experiment at a high Reynolds number of 1 million, Jodin et al. [14] showed that a substantial reduction in flow instabilities could be obtained using a vibrating TEF, in addition to an increase in the aerodynamic efficiency, if the flap vibrations are set at optimal frequencies and amplitudes. The use of a harmonically morphing TEF was also explored numerically for both aerodynamic and aeroacoustic performance enhancements [15,16] at low AoAs. It was shown that up to a 3% increase in the aerodynamic efficiency could be obtained, together with a 1.5 dB reduction of tonal noise. These works and several others have demonstrated the ability of periodic morphing actuation to maintain flow reattachment and improve aerodynamic efficiency.
Nevertheless, Medina et al. [17] argued that the transient (unsteady) responses to pulse-like actuators could be better utilized to produce higher lift than the one achieved with periodic forcing, basing these conclusions on an earlier work performed by Amitay and Glezer [18]. Based on these assumptions, a series of experiments to investigate the transient flow responses to low-amplitude high deflection rates of conventional hinged flaps were conducted [17,19]. In order to observe the lift coefficient response to various deflection frequencies, an NACA 0006 airfoil equipped with a TEF (at 50% chord) was tested in a water tunnel, first at 0° and 20° AoA [19] and then at a fixed AoA of 20°, where the 0° setting corresponds to attached flow, while the 20° setting represents massively separated flow. Observations showed that a spike, whose amplitude was proportional to the flap pitching rate, was captured in the lift coefficient time history, although there was no clear ‘time lag’ in the lift response to the flap pitching motion. The effect of the direction of the flap deflection (either upwards or downwards) was also investigated in both studies and it was found that the lift and drag forces were both highly dependent on the pitching direction, especially in the separated flow regime. It should be noted that these water tunnel experiments were conducted at a low Reynolds number (~40,000), which is an order of magnitude lower than that of practical wind tunnel tests. Thus, higher Reynolds number investigations need to be carried out to verify the effectiveness of such a mechanism in producing lift transients that could be useful in practical applications, such as the enabling of aggressive manoeuvres, gust loading alleviation, and stall delay at high AoA.
Morphing flaps could potentially offer a better alternative to the hinged flaps used by Medina et al. [17] in their experiments, e.g., the implementation of morphing could result in a lower weight penalty. In addition, morphing flaps would cover a larger deflection range compared with traditional hinged flaps; these are limited by the actuators’ mechanisms, which often constrain them to a smaller range of motion. Furthermore, exploring large-amplitude and reasonably fast flap deflections at a higher Reynolds number and at AoA away from stall would allow a better understanding of the flow response in conditions closer to real life. However, at angles of attack near stall, an airfoil is always susceptible to early stall, e.g., in the form of dynamic stall, because of rapid variations in AoA or freestream turbulence, resulting in a number of dynamic effects, such as increased unsteadiness in aerodynamic loads, bursting of leading edge vortices, and shedding of trailing-edge vortices. Therefore, studying the near-stall flow regime using unsteady morphing is of particular practical interest and could provide a pre-stall control mechanism to achieve increments in aerodynamic performance to extend the operational envelope, or at least to mitigate against abrupt transitions to stall (e.g., due to sudden inflow perturbations) where control becomes more challenging and less energy-efficient.
To the authors’ best knowledge, the study of near-stall dynamic flow response to a rapid morphing flap deflection rather than a hinged flap deflection has not yet been addressed in open literature by means of either experimental or numerical work at high or low Reynolds numbers. Therefore, this study is a timely addition to the recent works on morphing flaps. The paper presents an exploratory CFD study, using a hybrid RANS-LES model, investigating the responses of both lift and drag forces to rapid downward morphing TEF deflection at various frequencies. An NACA 0012 airfoil fitted with a morphing TEF (of a length equal to 25% of the chord) is investigated at a chord-based Reynolds number of 0.62 × 10⁶. CFD analysis is performed using a newly developed computational framework based on dynamic meshing and unsteady parametrization [10]. The hybrid RANS-LES turbulence model, SBES, is used to resolve the unsteady flow field with reasonable accuracy at an affordable computational cost. Again, to the authors’ best knowledge, this is the first time SBES has been used to investigate the near-stall aerodynamic performance of an airfoil in response to rapid morphing deflections. For a fixed large morphing amplitude, flow responses at three angles of attack near stall (8°, 10°, and 12°) and at a range of morphing frequencies are presented and discussed.
2. Problem Definition
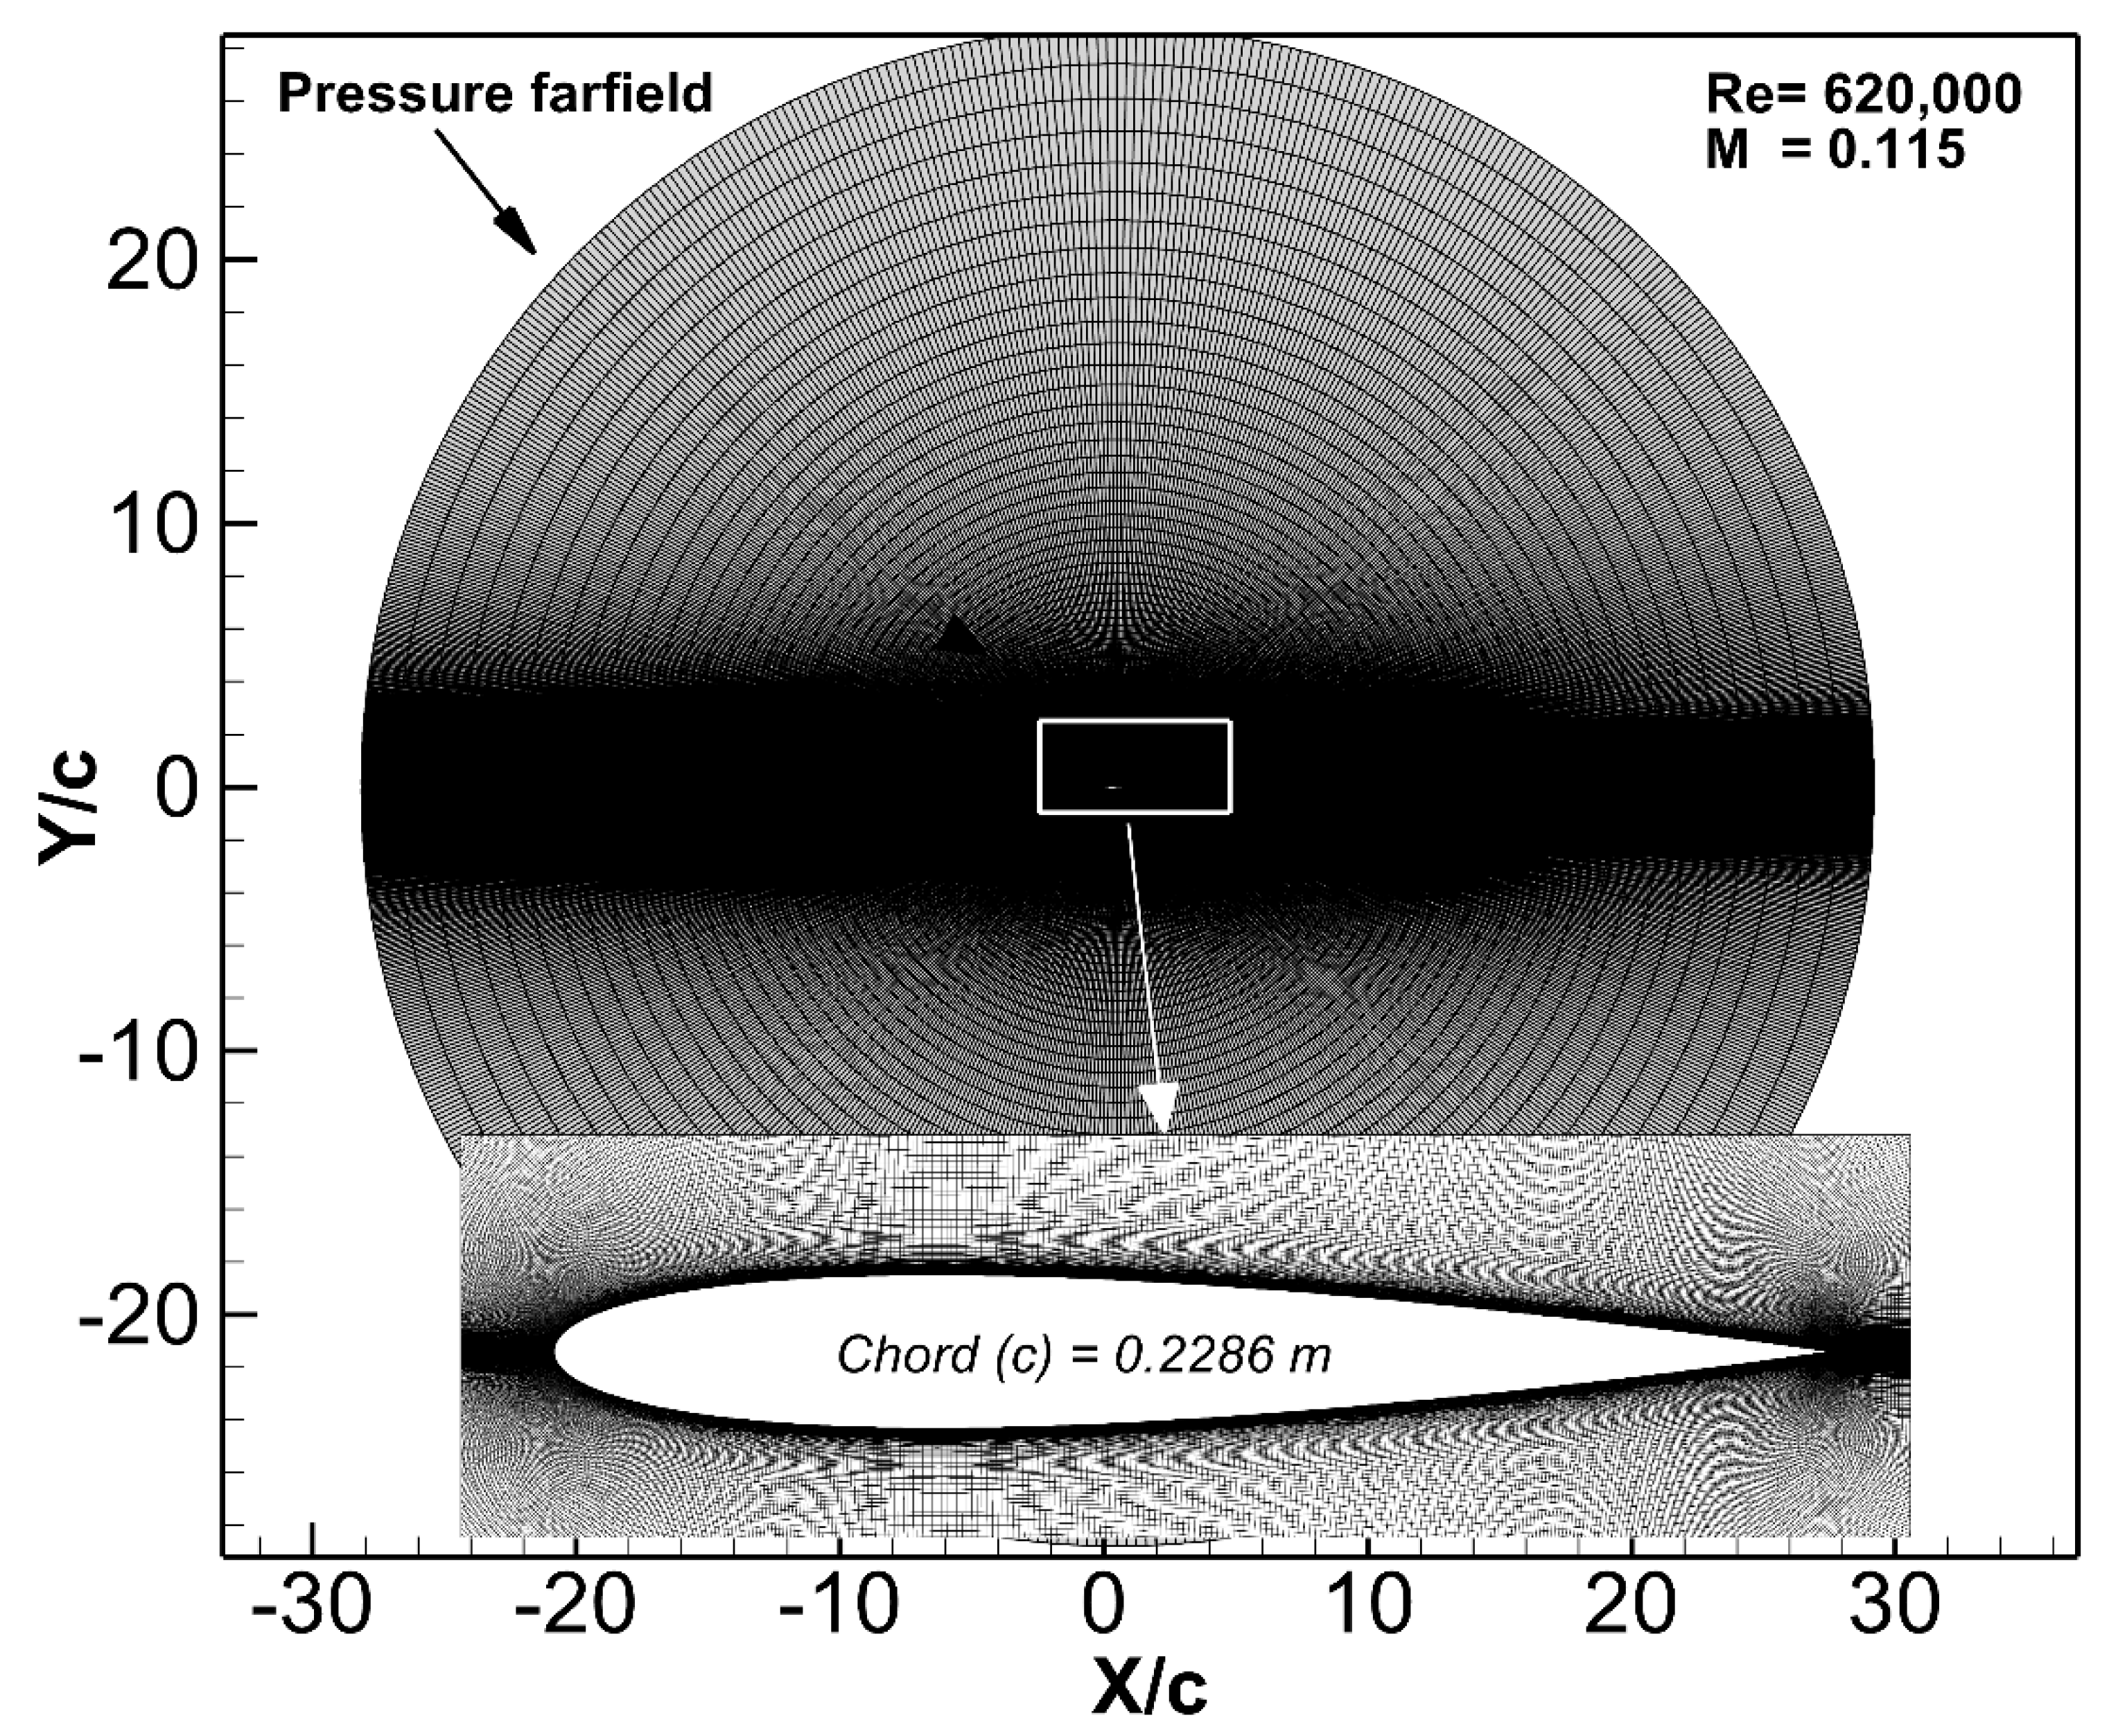
All test cases involve an NACA 0012 airfoil with a chord c = 0.2286 m, a Reynolds number of Re = 0.62 × 10⁶ based on the chord, and a Mach number of 0.115, in a free steam flow velocity of with standard sea-level conditions, matching conditions reproducible in most low-speed wind tunnels and used in recent morphing experimental studies [20].
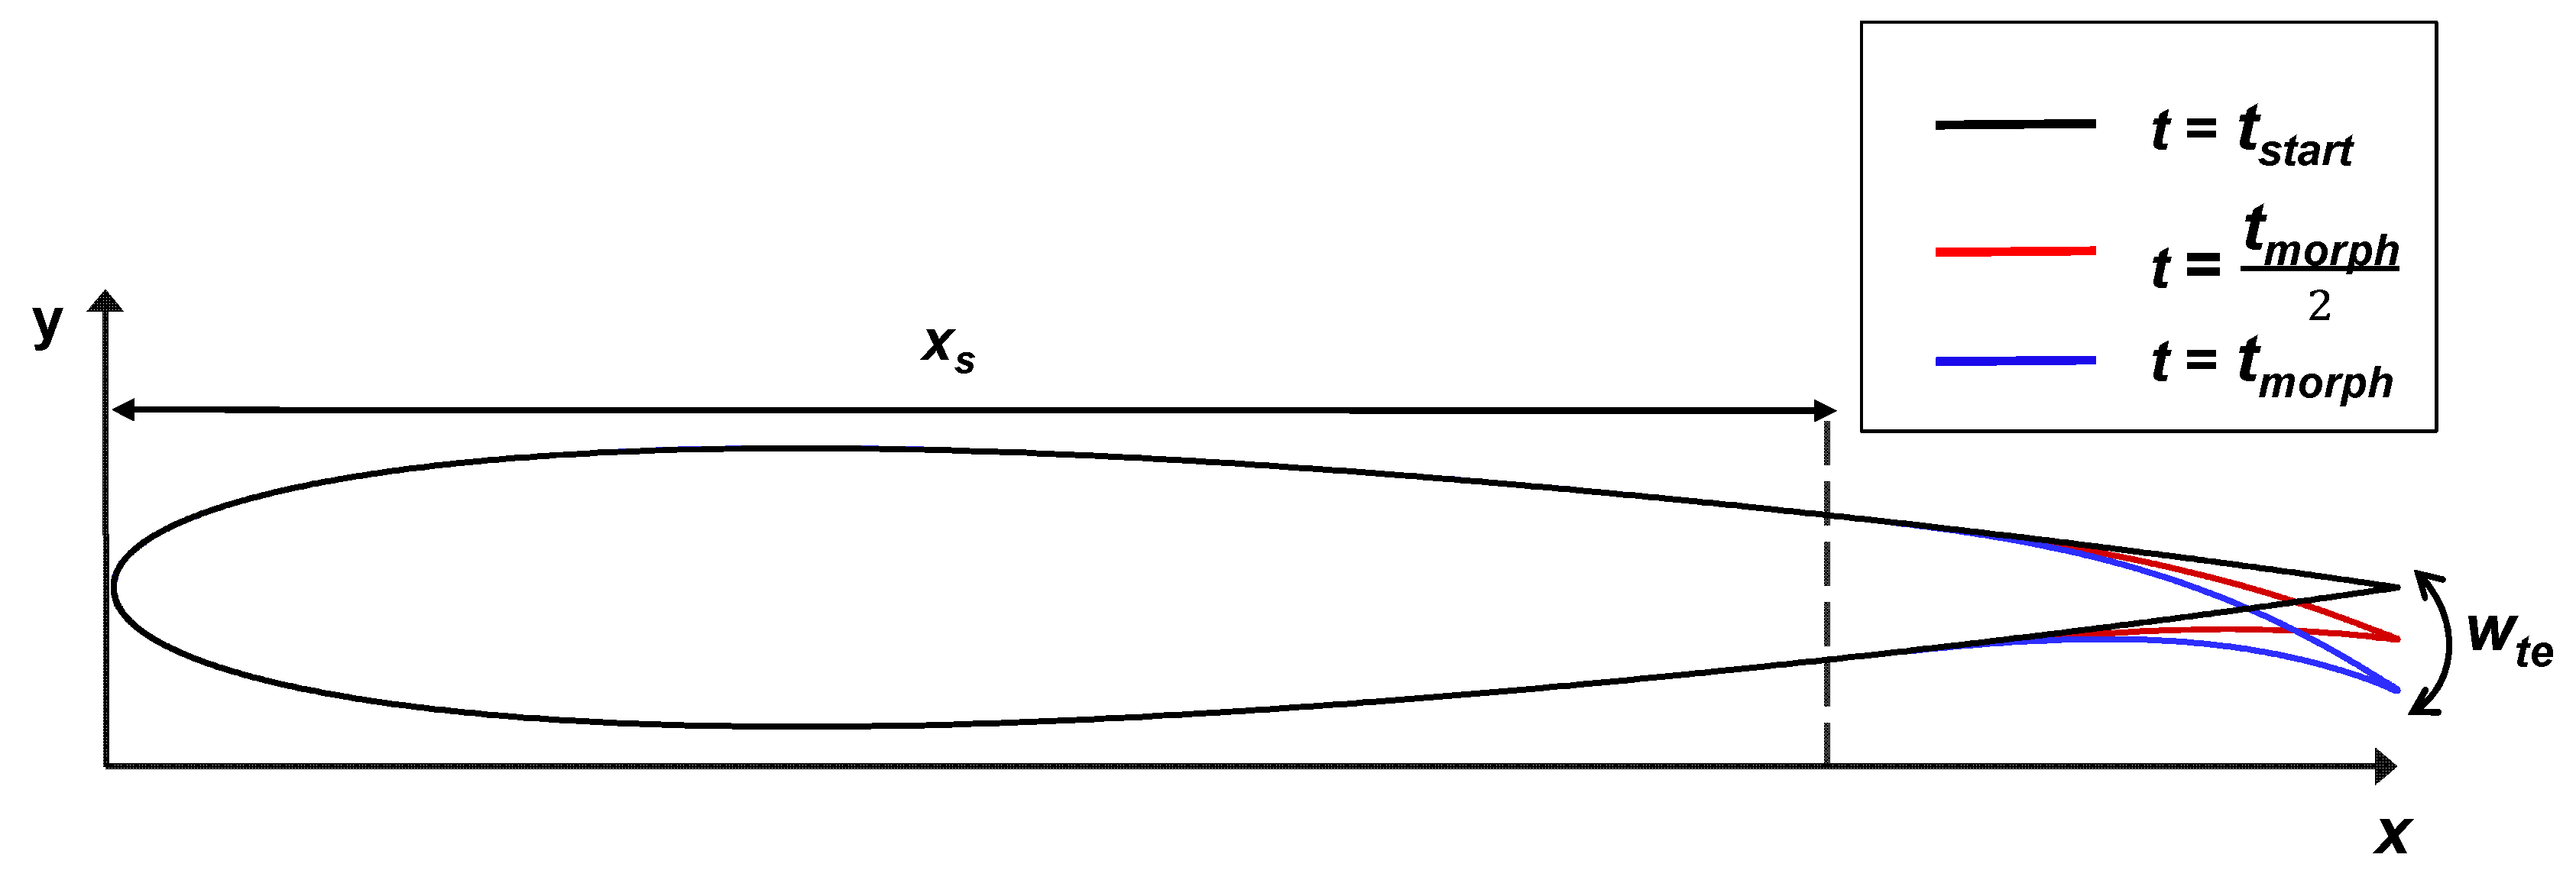
The parametrization approach used for the TEF motion is a modified version of the method introduced by [9,10] and based on the FishBAC concept [20]. It consists of the baseline NACA 0012 thickness distribution added to an unsteady parametrization of the camber line. Interested readers are referred to reference [10] for the mathematical model of the parametrization. Figure 2 illustrates the deforming motion of the TEF, where xs is the morphing starting location (i.e., 75% c in this study); wte is the maximum deflection at the trailing edge, which indicates the vertical distance between the initial TE position and the maximum (final) position of the morphed TE is the morphing starting time; and is the time to reach the final (maximum) deflection position.
The cases presented in this paper all deal with a large deflection angle of the TEF, i.e., for wte = 5% of the chord, which is about 14° of the local deflection compared to the baseline configuration of wte = 0. Table 1 summarizes the parameters used for the study.
3. Governing Equations
3.1. Fluid Dynamics
The governing equations are the conservation of mass and the conservation of momentum. Since the flow velocities in the domain are much smaller than the speed of sound, it can be assumed that the density remains constant throughout the flow field. Therefore, the incompressible pressure-based solver included in ANSYS Fluent is used to solve the Navier–Stokes equations [21]. However, the formulation of the conservation equations is different when it comes to moving boundaries problems, such as for a morphing surface. Equation (1) is the integral form of the conservation equation for a general scalar quantity φ on an arbitrary control volume V with moving boundaries:
where ρ is the fluid density, Γ is the diffusion coefficient, is the time-averaged flow velocity vector, is the grid velocity vector, is a source term, and represents the boundary of the control volume V.
Turbulence Modeling
Given the high Reynolds number in this study, it would be impractical to use computationally intensive approaches such as DNS or LES. At the same time, the potential for early stall, with possible flow separation, vortex growth, and shedding, necessitates the use of a model beyond simple RANS. Therefore, a hybrid RANS-LES model, which offers a balanced approach between accuracy and computation, is used. The hybrid RANS-LES model named the stress-blended eddy simulation, or SBES, introduced by Menter [22] is used in this work to provide closure to the Reynolds-averaged Navier–Stokes equations. The use of hybrid RANS-LES models in aerodynamic studies has previously been reported in the literature [23,24,25]. More recently, Syawitri el al. [26] and Rezaeiha et al. [27] both used SBES to predict the aerodynamic performance of vertical axis wind turbines (VAWTs). More importantly, Syawitri el al. [26] showed that it is possible to significantly improve the numerical prediction of the flow around a 2D VAWT with three straight blades using SBES, while still accurately predicting the flow field. Rezaeiha et al. [27] demonstrated that 2.5D SBES is a superior approach to both URANS and scale-adaptive simulation (SAS). Finally, Abdessemed et al. [16] conducted a comparative study between 2D SBES and 3D LES for the same configuration and Reynolds number (0.408 × 10⁶), with the results showing that the 2D SBES approach was able to accurately capture the loads and flow features with a fraction of the numerical cost, which is sufficient for the current study to obtain trends and inform future works.
The SBES was used in conjunction with the shear stress transport (SST) k-ω turbulence model for the RANS region, while for the large eddy simulation (LES) region, the wall-adapting local eddy–viscosity (WALE) sub-grid model [28] is considered.
The blending function is the same as that used in the shielded delayed eddy simulation (SDES) [21]. Moreover, a shielding function (Equation (2)) is used to explicitly switch between the RANS and LES models:
where is the RANS portion and is the LES portion of the modeled stress tensor; is the shielding function [22]. Unfortunately, the exact formulation of the shielding function is proprietary and to date has not been published by ANSYS for public use.
Amongst the advantages of SBES is that it gives explicit control over which part of the flow the LES is applied to, it provides a rapid transition from the RANS region to LES region, and has less dependency on the mesh compared with the SDES model [22]. The RANS wall boundary layer regions are protected against influences from the LES model when the shielding functions are in use, which protects against early switching to the LES. If the early switching occurs, it can cause a strong decline in the RANS capabilities [29]. The high-performance capabilities of SBES have made it one of the most promising hybrid RANS-LES models available [29].
3.2. Dynamic Mesh Update Methods
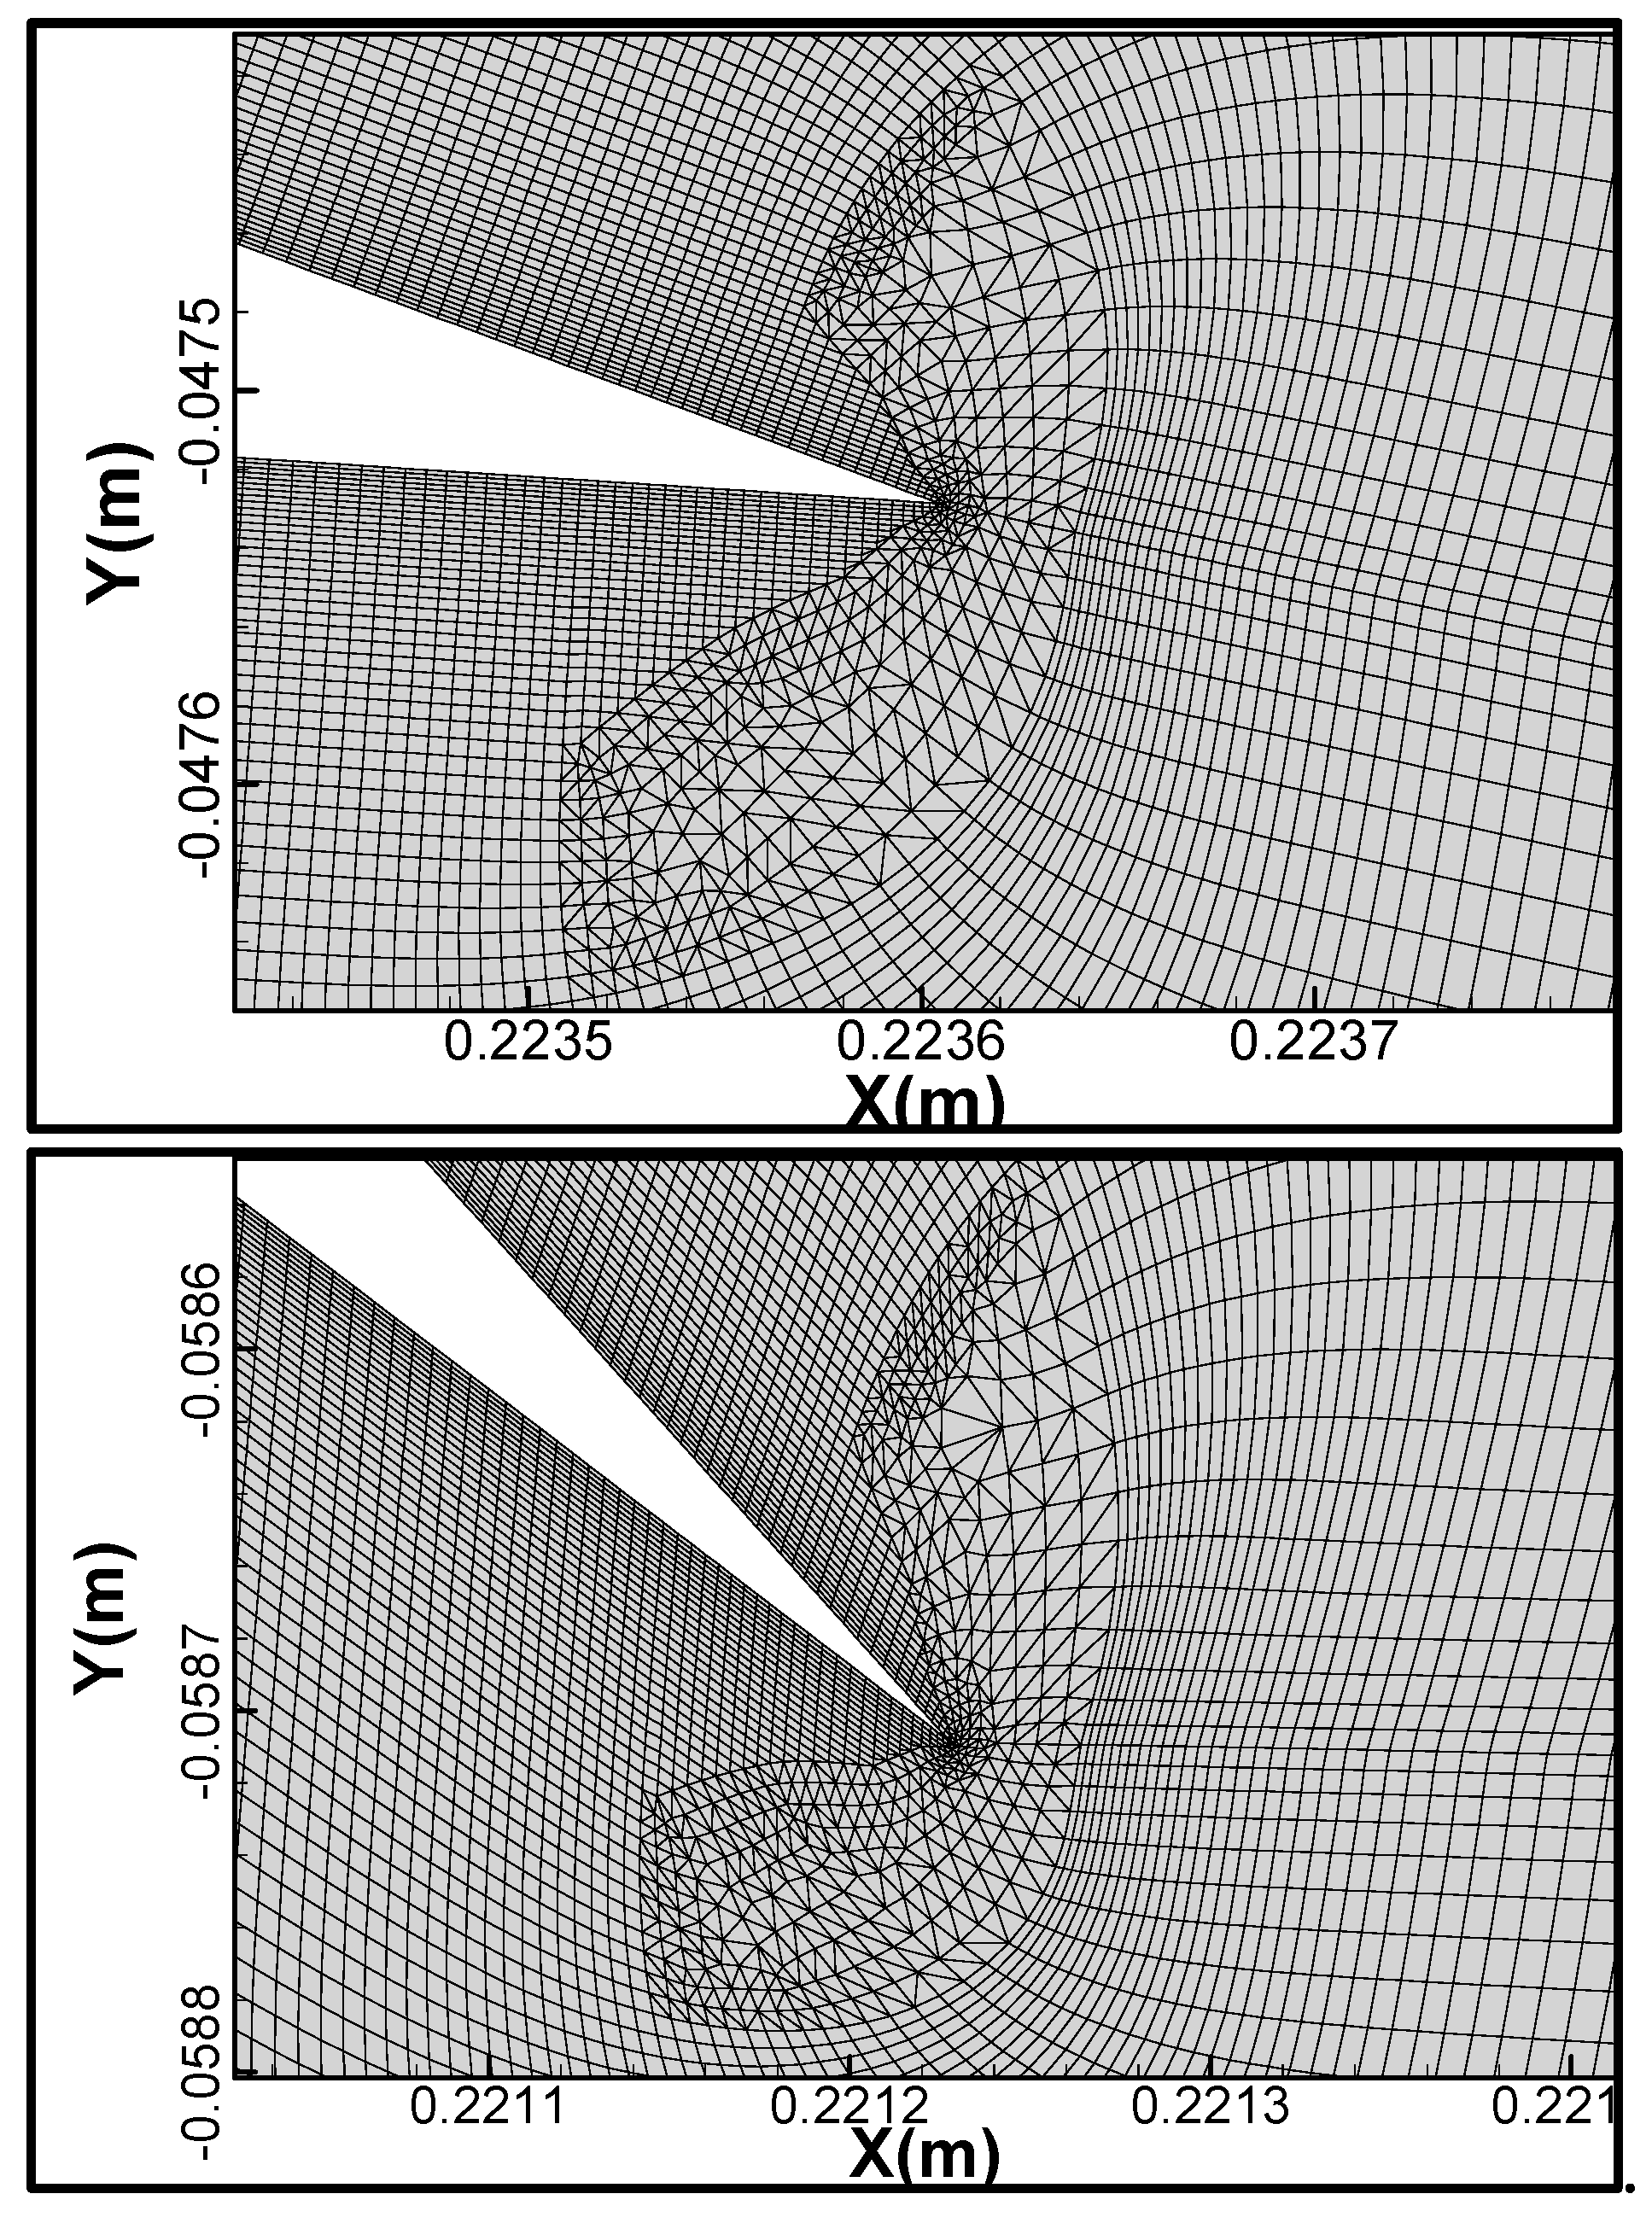
Using the parametric method introduced in Section 4, the dynamic mesh update methods included in ANSYS Fluent are utilized in order to deform the mesh and the geometry simultaneously, whilst maintaining a high-quality mesh in the process. Diffusion-based smoothing was used in the present work because it is more robust when it comes to mesh quality preservation (as required for moving boundaries) compared with spring-based smoothing [21]. The exact setup in [16] was replicated using diffusion-based smoothing to deform the computational grid, and for this specific case with large deformation a limited patch of triangular cells was introduced near the TE (Figure 3) in order to use the remeshing feature included in ANSYS Fluent [21]. Readers are directed to [16,30] for in-depth details of the dynamic mesh setup.
In order to drive the dynamic meshing schemes in ANSYS Fluent, a user-defined function (UDF) was developed to incorporate the unsteady parametrization method explained in Section 4. The UDF makes use of the DEFINE_GRID_MOTION macro embedded in Fluent, while the full source code of the UDF is made available in the following repository [31].
4. Mathematical Model of the Trailing-Edge Motion
The parametrization method used for the TEF motion is a modified version of the one previously introduced in [9,10] and repeated here in Equations (3) and (4) below. It consists of the baseline NACA 0012 thickness distribution as defined in Equation (3) [32] added to the unsteady parametrization of the camber line as defined in Equation (4).
where is the nondimensional airfoil coordinate , t is time, and T is the period of the airfoil’s trailing-edge motion; the morphing frequency is obtained by . In the current study, at t = the morphing starts and the flap is deflected downwards until it reaches the maximum deflection value wte at , effectively simulating one-quarter of a period, as shown in Figure 2.
For convenience, the non-dimensional time is used in subsequent analysis, where , which means the morphing starts from .
5. Computational Setup
A fractional step method of the non-iterative time advancement (NITA) scheme was used for time advancement, as it results in significant CPU time savings [33]. A least-squares cell-based spatial discretization approach was used to calculate all gradients. Moreover, the momentum equation discretization employs a bounded central differencing scheme, with a second-order scheme for all remaining quantities and derivatives.
In order to avoid the appearance of highly skewed cells around the TE region during the morphing, a small region around the TE was created to accommodate an unstructured local mesh by making use of the remeshing option in ANSYS Fluent (see Figure 3). Table 2 summarizes the key mesh characteristics before and after the mesh deformation, showing that all of the values are within the bounds of a well-preserved mesh in terms of mesh quality.
The flow domain consists of an NACA 0012 airfoil with a sharp TE, while the pressure far field is placed 30 chord lengths (30c) away from the TE. A structured O-grid-type mesh was generated around the airfoil (Figure 4). The mesh had a total number of 350,000 cells, with 1400 points around the airfoil surface and 200 points in the streamwise wake direction clustered toward the TE. The inflation layers were refined to achieve a first layer height in wall unit Δy+ smaller than 1. These mesh characteristics were based on the fine mesh previously used by the authors in [34].
A second-order transient formulation was used for all transient simulations. A time step of Δt = 10−5 s (which guarantees a Courant number of an order of unity) was used, and all simulations were run for at least 0.8 s (i.e., equal to 4 through-flow times), which was found sufficient to achieve statistically converged results. The simulations were performed using a 16-core Intel Xeon E5-2680 v2 (Ivy Bridge) with 2.8 GHz CPU, and each simulation needed at least 43 h.
6. Results and Discussion
6.1. Verification and Validation
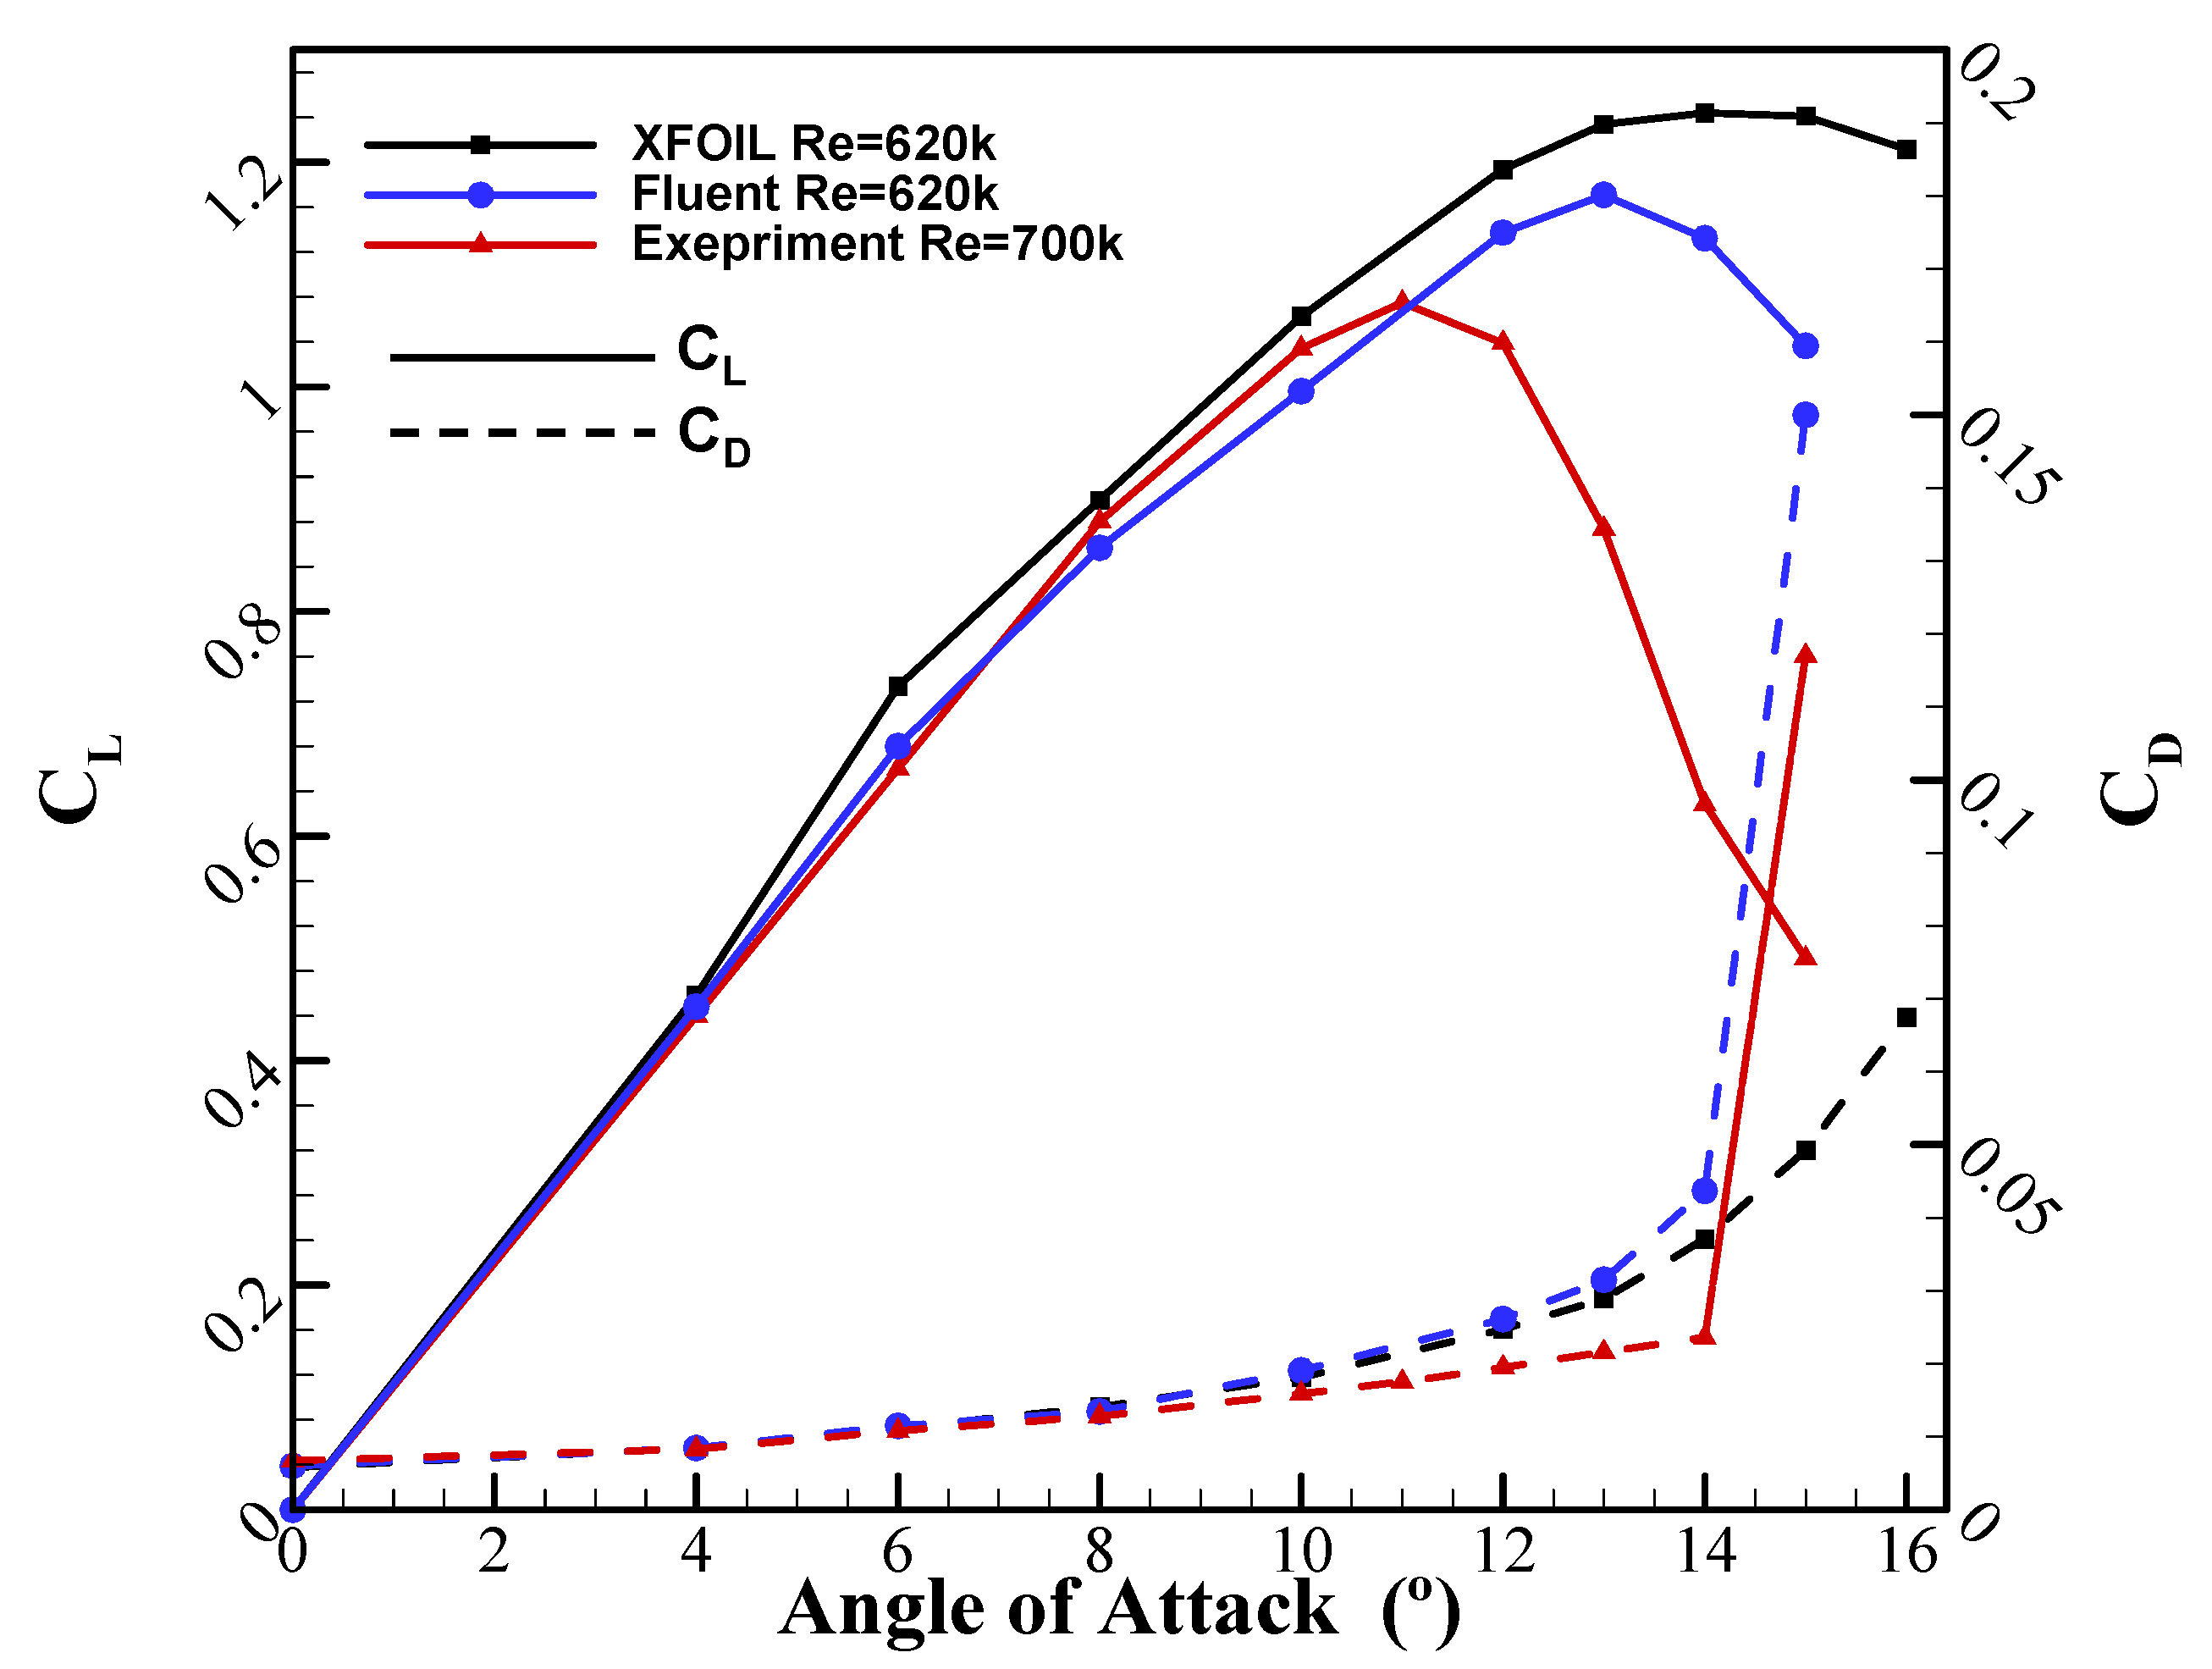
For verification purposes, XFOIL [35] with viscous corrections was used to provide lift and drag predictions for the baseline NACA 0012 airfoil. Figure 5 shows the numerical results obtained for a range of AoA using ANSYS Fluent and XFOIL solvers, compared against the experimental data of Sheldahl et al. [36] for both the lift coefficient (CL) and drag coefficient (CD) for a range of AoAs. Overall, it can be seen that a good agreement is achieved between Fluent and XFOIL’s predictions and the experimental data of Sheldahl et al. [36] in the linear region up to AoA = 10°, whereby the average difference between the two numerical predictions is about 5%. The Fluent predictions are in better agreement with the test data in the linear region for both lift and drag predictions, although the experimental data of Sheldahl et al. [36] seem to show an earlier stall for the airfoil at about AoA = 11°, while the Fluent predictions show a higher stall angle at AoA = 13°, resulting in an 8.6% higher CL,max than the measurement. XFOIL does not capture the stall till AoA = 16° and consistently overpredicts CL from AoA = 4° onwards.
A few possible reasons could explain those discrepancies observed between the two numerical predictions and the test data. In the experimental work performed by Church et al. [37] investigating an NACA 0021 airfoil at lower Reynolds numbers (less than 200,000), for the same Reynolds number it was suggested that Sheldahl et al.’s data [36] undermeasured both the stall angle and the CL,max value. It was concluded that Sheldahl et al.’s experiment is not representative of the NACA 0021 airfoil, mainly because the data prior to stall and early stall were calculated using an in-house PROFILE computer code [36]. Furthermore, experimental data obtained by Ladson et al. [38] showed that for a higher Reynolds number of Re = 2,000,000, Sheldahl et al.’s [36] data undermeasured the stall angle by at least 2° AoA, similar to the findings of the present numerical study. The prediction of the CL,max value by ANSYS Fluent is generally higher than for quasi-3D wind tunnel tests, which can be explained by the fact that using a purely 2D configuration normally results in overprediction of the lift force. Similar trends can be observed for the drag comparisons, where there is good agreement between Fluent, XFOIL, and test data up to the pre-stall region (i.e., AoA = 8°), after which the discrepancies increase monotonically until AoA = 14°. Beyond this point, both Fluent and the test data show a steep increase in drag, indicating that deep stall occurs.
6.2. Morphing TEF Deflection
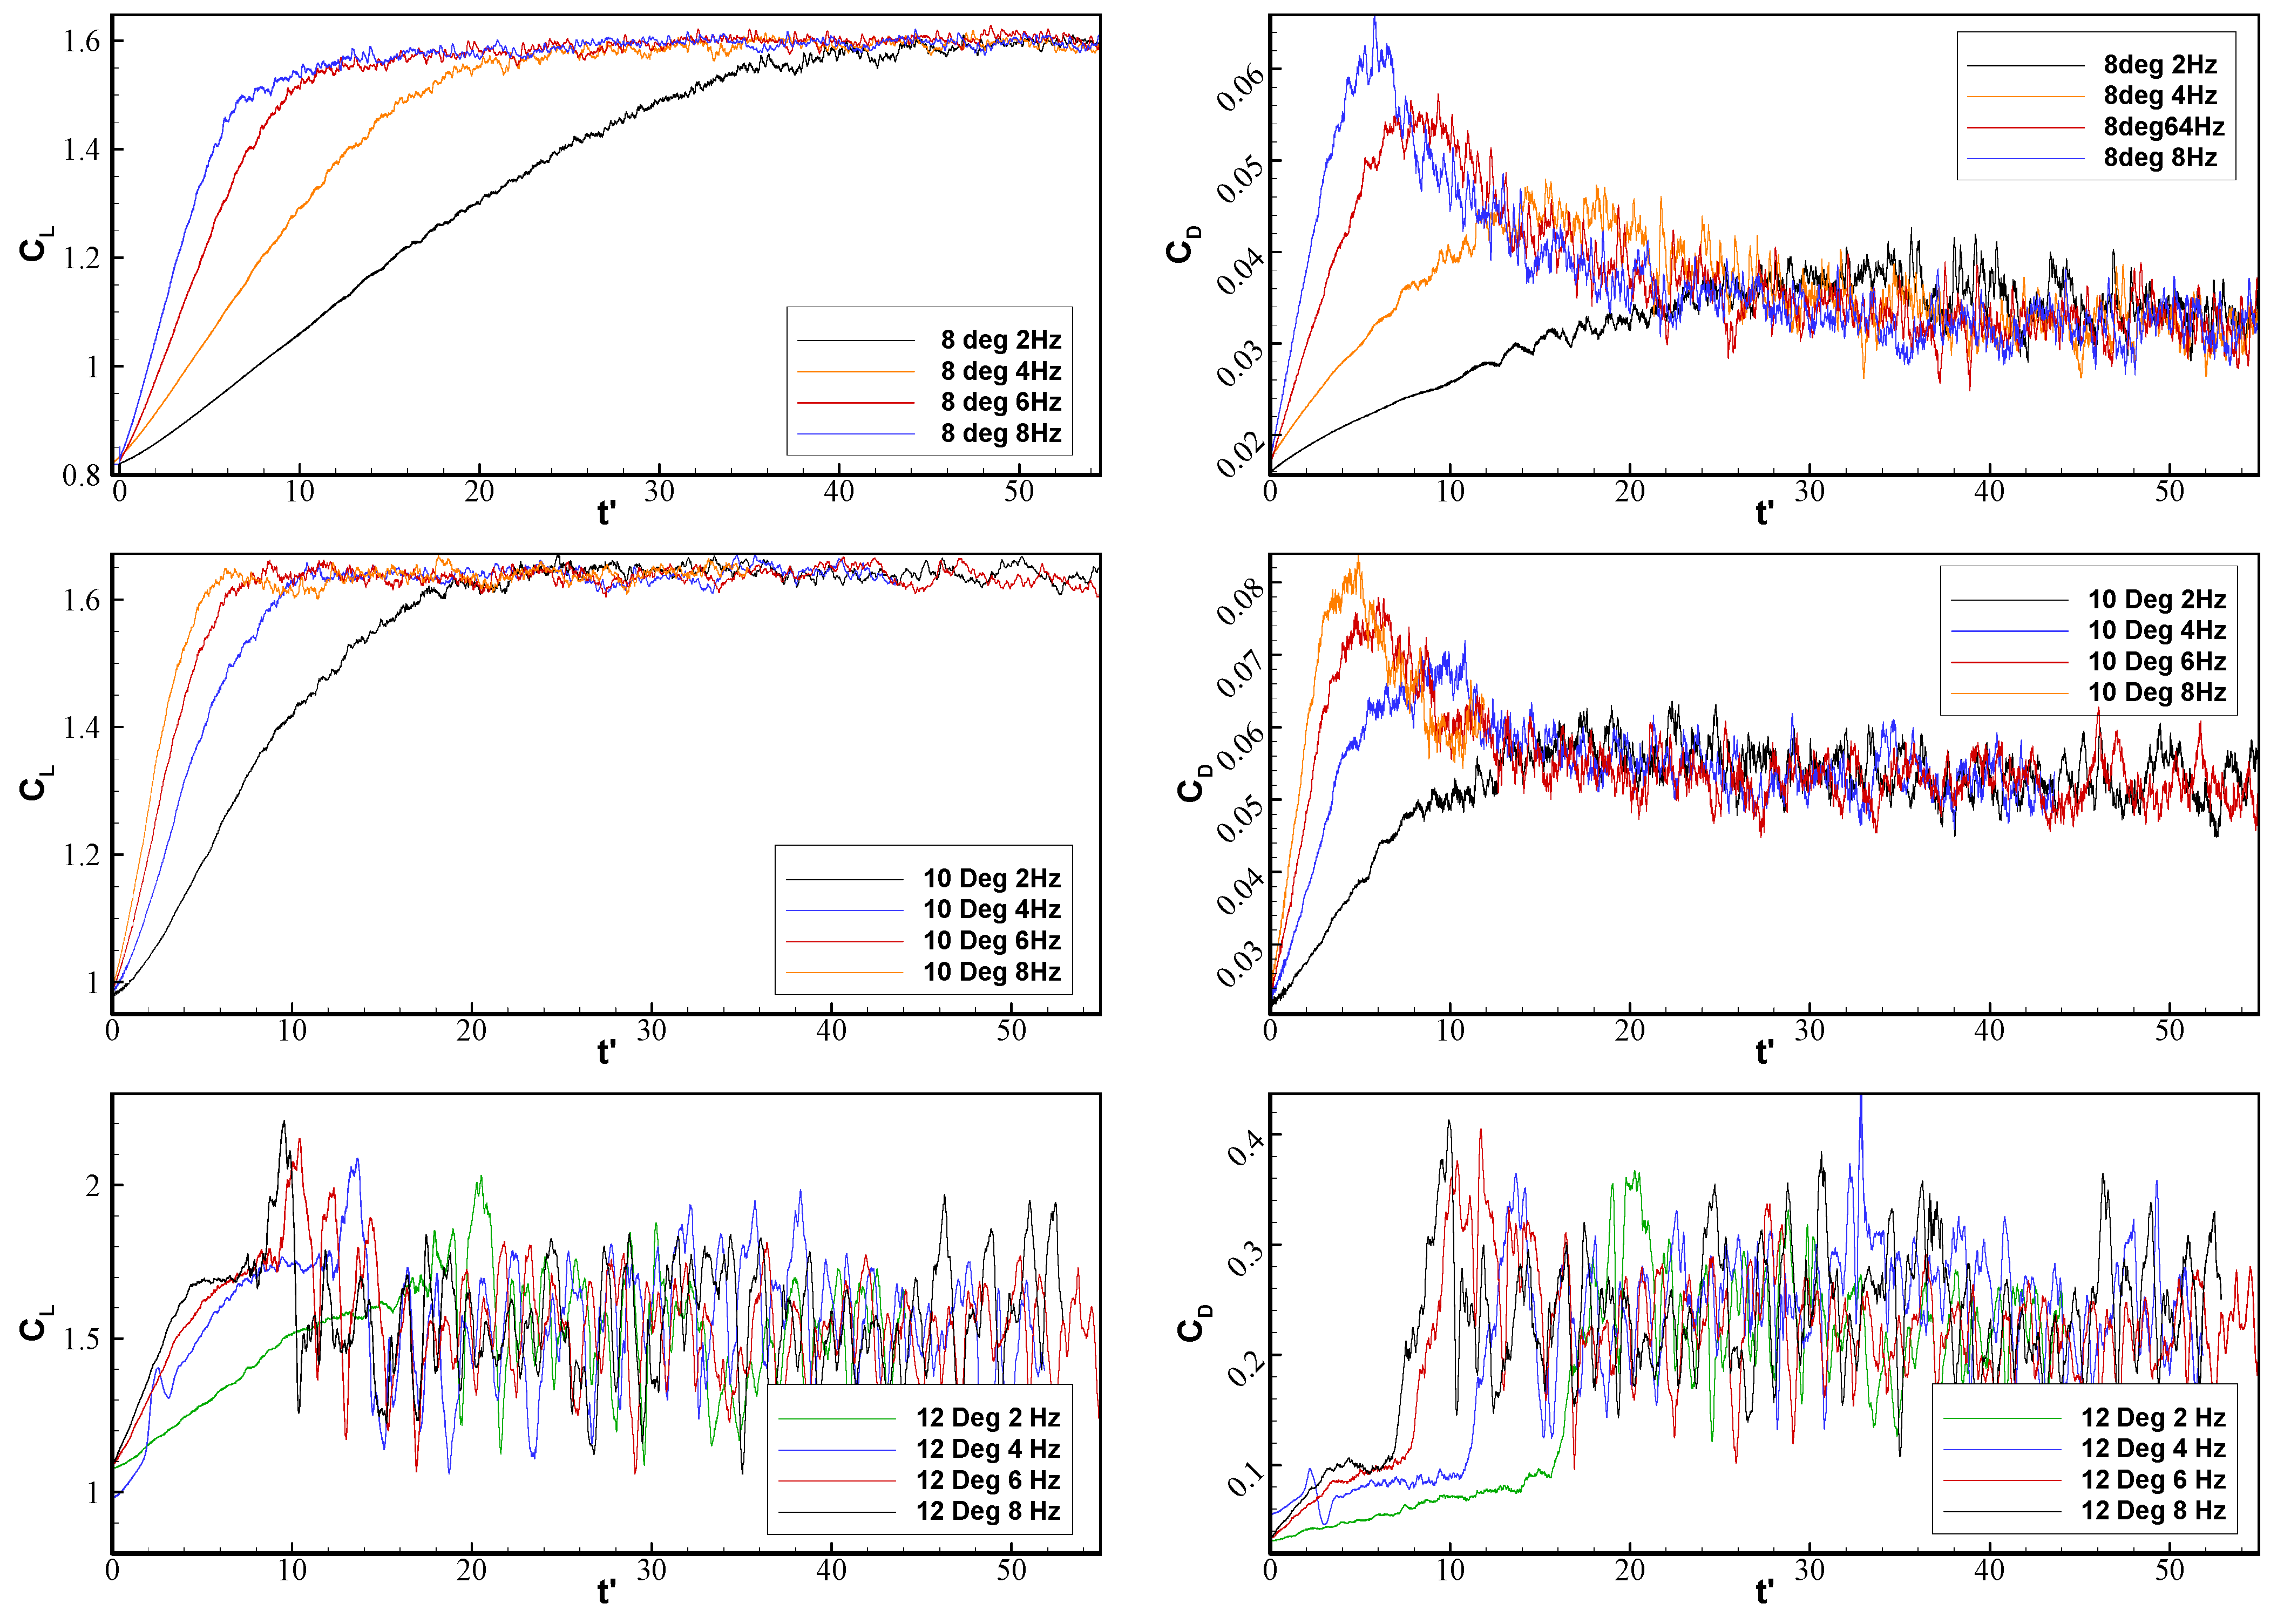
Once validation was established, the next task was to investigate the dynamic flow characteristics in response to the TEF deflections. Figure 6 shows the transient lift and drag coefficient responses to morphing TEF deflecting at various frequencies. For all simulation cases, unsteady CFD runs are performed to reach a statistically converged status: after a precursor run of the unmorphed baseline airfoil until t = 0.50 s (t′ = 0), morphing commences and transient flow simulations continue for four through-flow times to reach a statistically converged status.
Table 3 summarizes the frequencies used, and the related time quantities associated with each frequency. These frequencies were chosen to reflect the morphing times used in flaps deployments and in other morphing studies [19].
At two moderate AoA values of 8° and 10°, both the lift and drag coefficients exhibit similar transient behaviour. For a fixed AoA, the lift increases linearly from a converged static value up until the flap reaches its final position where the lift asymptotes to a steady-state value, which was the same for all studied frequencies. The slope at which the lift increases during the morphing motion is proportional to the frequency; the higher the frequency, the steeper the slope. However, the transient drag response shows a noticeable difference compared with the lift response. An overshoot is observed in the drag time history before the flap reaches its final position; the amplitude of the spike observed is also proportional to the frequency, with higher morphing frequencies causing larger overshoots of the spike. At AoA = 12°, the flow response is found to be different from the lower AoAs studied. At this AoA, the NACA 0012 airfoil is already in a pre-static stall region, so that a further increase of the local camber due to the TEF deflection coupled with its rapid rate of motion causes the airfoil to enter into a deep stall regime. Prior to the initiation of morphing, both the lift and drag coefficients display similar trends, where a vortex sheet forms in the wake (Figure 8) of the baseline airfoil at a shedding frequency of 50 Hz (obtained with a fast Fourier transform (FFT)), corresponding to a Strouhal number (St) of 0.1 based on the maximum airfoil thickness. Similar to the case of moderate AoAs of 8° and 10°, as the morphing flap deflects from its baseline position, a linear increase in the lift and the drag coefficients is observed, with a slight overshoot in the CD values at t′ = 3.50. However, the airfoil does not recover to the steady state (as it does at 8° and 10°), causing the airfoil to experience dynamic stall, as revealed by the large-scale flow oscillations (St = 0.3) and as exhibited in the lift and drag coefficients around higher mean values of both CL and CD.
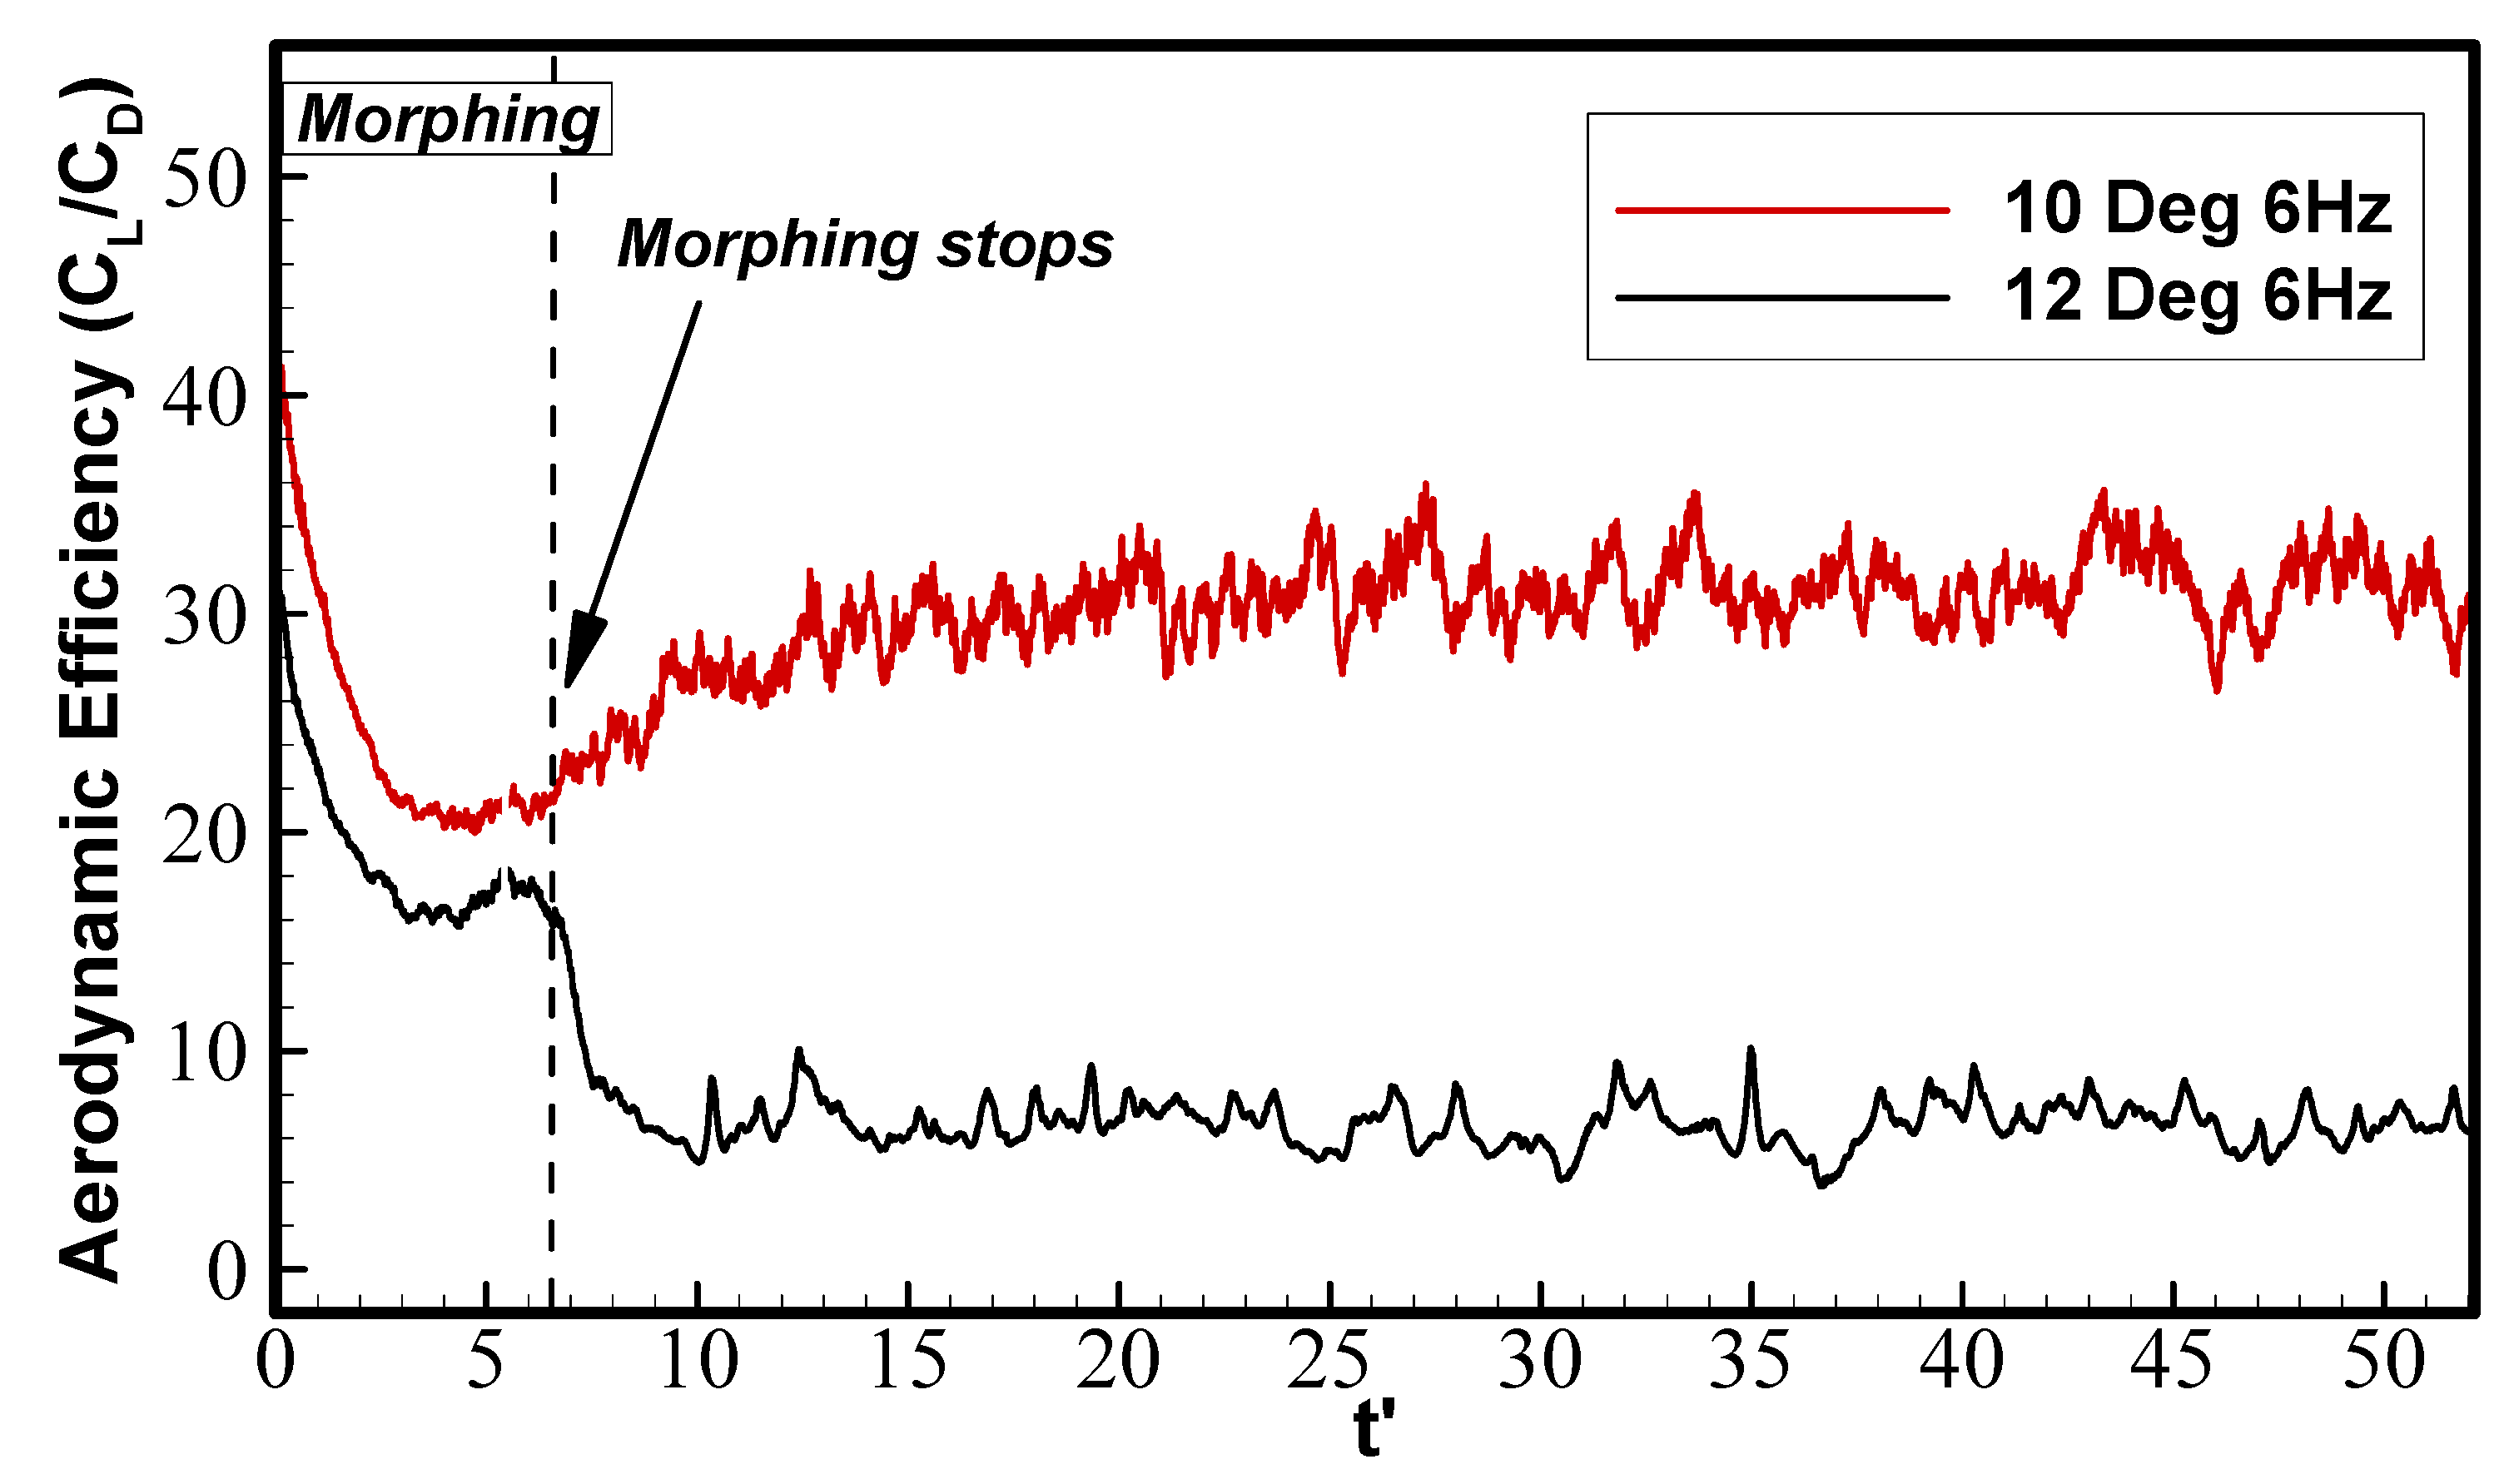
The aerodynamic efficiency (denoted by CL/CD) as illustrated in Figure 7 provides an additional understanding of the aerodynamic load response. Here, two representative cases are shown, AoA = 10° and 12°, both at a morphing frequency of 6 Hz; other frequencies exhibited similar behaviour. Starting from the baseline value for both AoAs, the aerodynamic efficiency begins to monotonically decrease until t′ = 1.75, where the rate of decrease is accelerated due to the overshoot in CD. For AoA = 10°, the efficiency recovers to higher values at t′ = 9.62, where it settles down at an average value of CL/CD = 26 after it experiences a 30% instantaneous drop at t′ = 3.50. In contrast, at AoA = 12° after the morphing motion stops at t′ = 7.35, the aerodynamic efficiency does not recover and continues to decrease further until the dynamic stall process has started. Further insight into the flow behaviour during the rapid morphing flap deflection can be gained by qualitative examination of the flow.
Figure 8 shows the vorticity contours for the airfoil during the morphing process at AoA = 10° and a morphing frequency of 8 Hz. At this AoA and before the start of morphing, the airfoil experiences moderate TE flow separation, which causes the shed vortices to travel downstream, forming a vortex shedding pattern in the wake (Figure 9). This change in the local flow field, which induces local separation, is one of the contributors to the decrease of efficiency that can be observed in Figure 7.
Once the morphing motion starts, the deformed TEF geometry accelerates the vortex shedding process at the TE and further induces a large-scale roll-up vortex that travels upstream. This traveling vortex interacts with the thickening shear layer at the start position of the morphing flap (i.e., at 75%c). The interaction results in a large-scale shed vortex which convects downstream along the flap surface; this could be the cause of the spike observed in the drag coefficient. Once this initial large-scale vortex has convected into the wake, the same cycle repeats, however the resulting vortices are smaller than the initial starting vortex.
Medina et al. [19] observed a spike in their lift measurements, for which the flap motion time was of an order of one convective time or less ), whereas in this study the morphing flap motion time was much larger (between 5 to 20), which could explain the absence of the overshoot in the lift in the current study. Additionally, Medina et al. [17] only studied the lift response but not the drag response as was the case in this work, so comparing the drag response between the two cases was not possible.
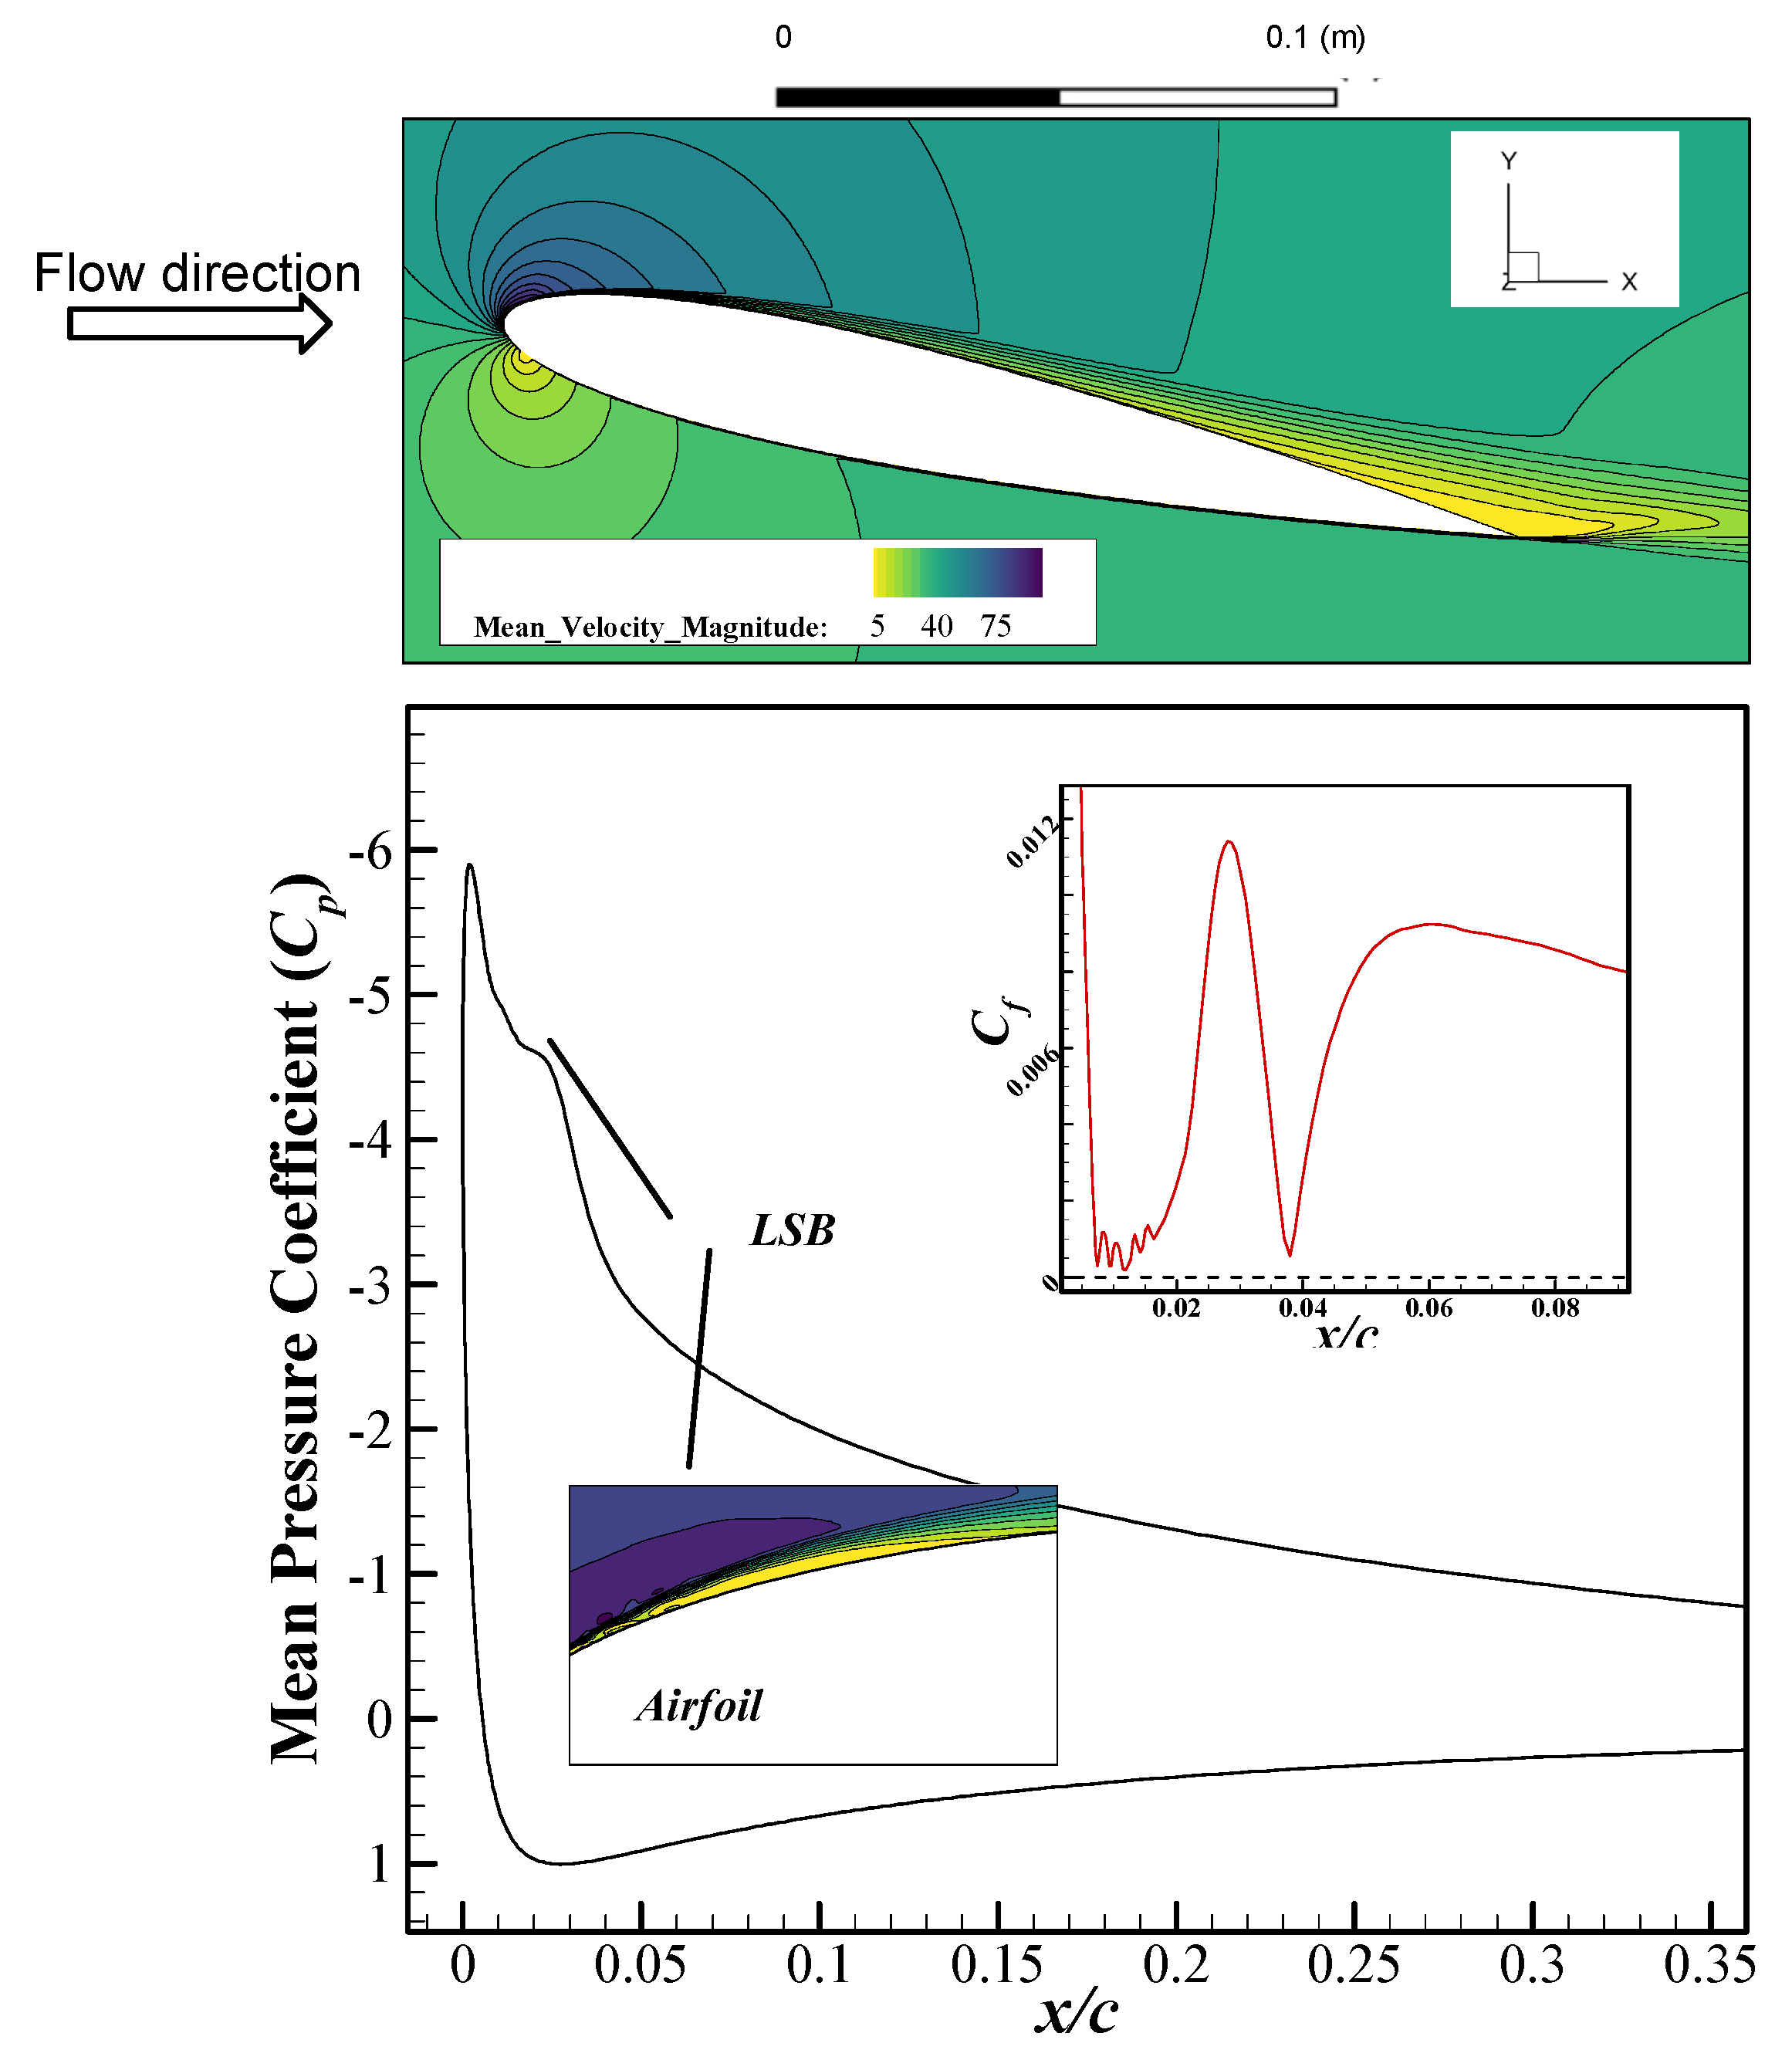
With morphing motion, the lift and drag responses at the higher AoA of 12° are found to be quite different from their behaviours at the slightly lower AoA of 10°. At AoA = 12°, the airfoil is already in a pre-stall condition with local flow separation occurring at the TE, however the flow is still primarily attached to most of the airfoil surfaces, as illustrated by the mean velocity contours (e.g., see Figure 10). The boundary layer is characterized by the presence of a small laminar separation bubble (LSB) near the leading edge (LE). The signature of this LSB is shown in Figure 11 in both the pressure coefficient (Cp) and the skin friction coefficient (Cf), in addition to a close-up view of the mean velocity magnitude. The laminar boundary layer (LBL) instabilities are also captured just upstream of the LSB, as shown with the unsteadiness in the Cf curve.
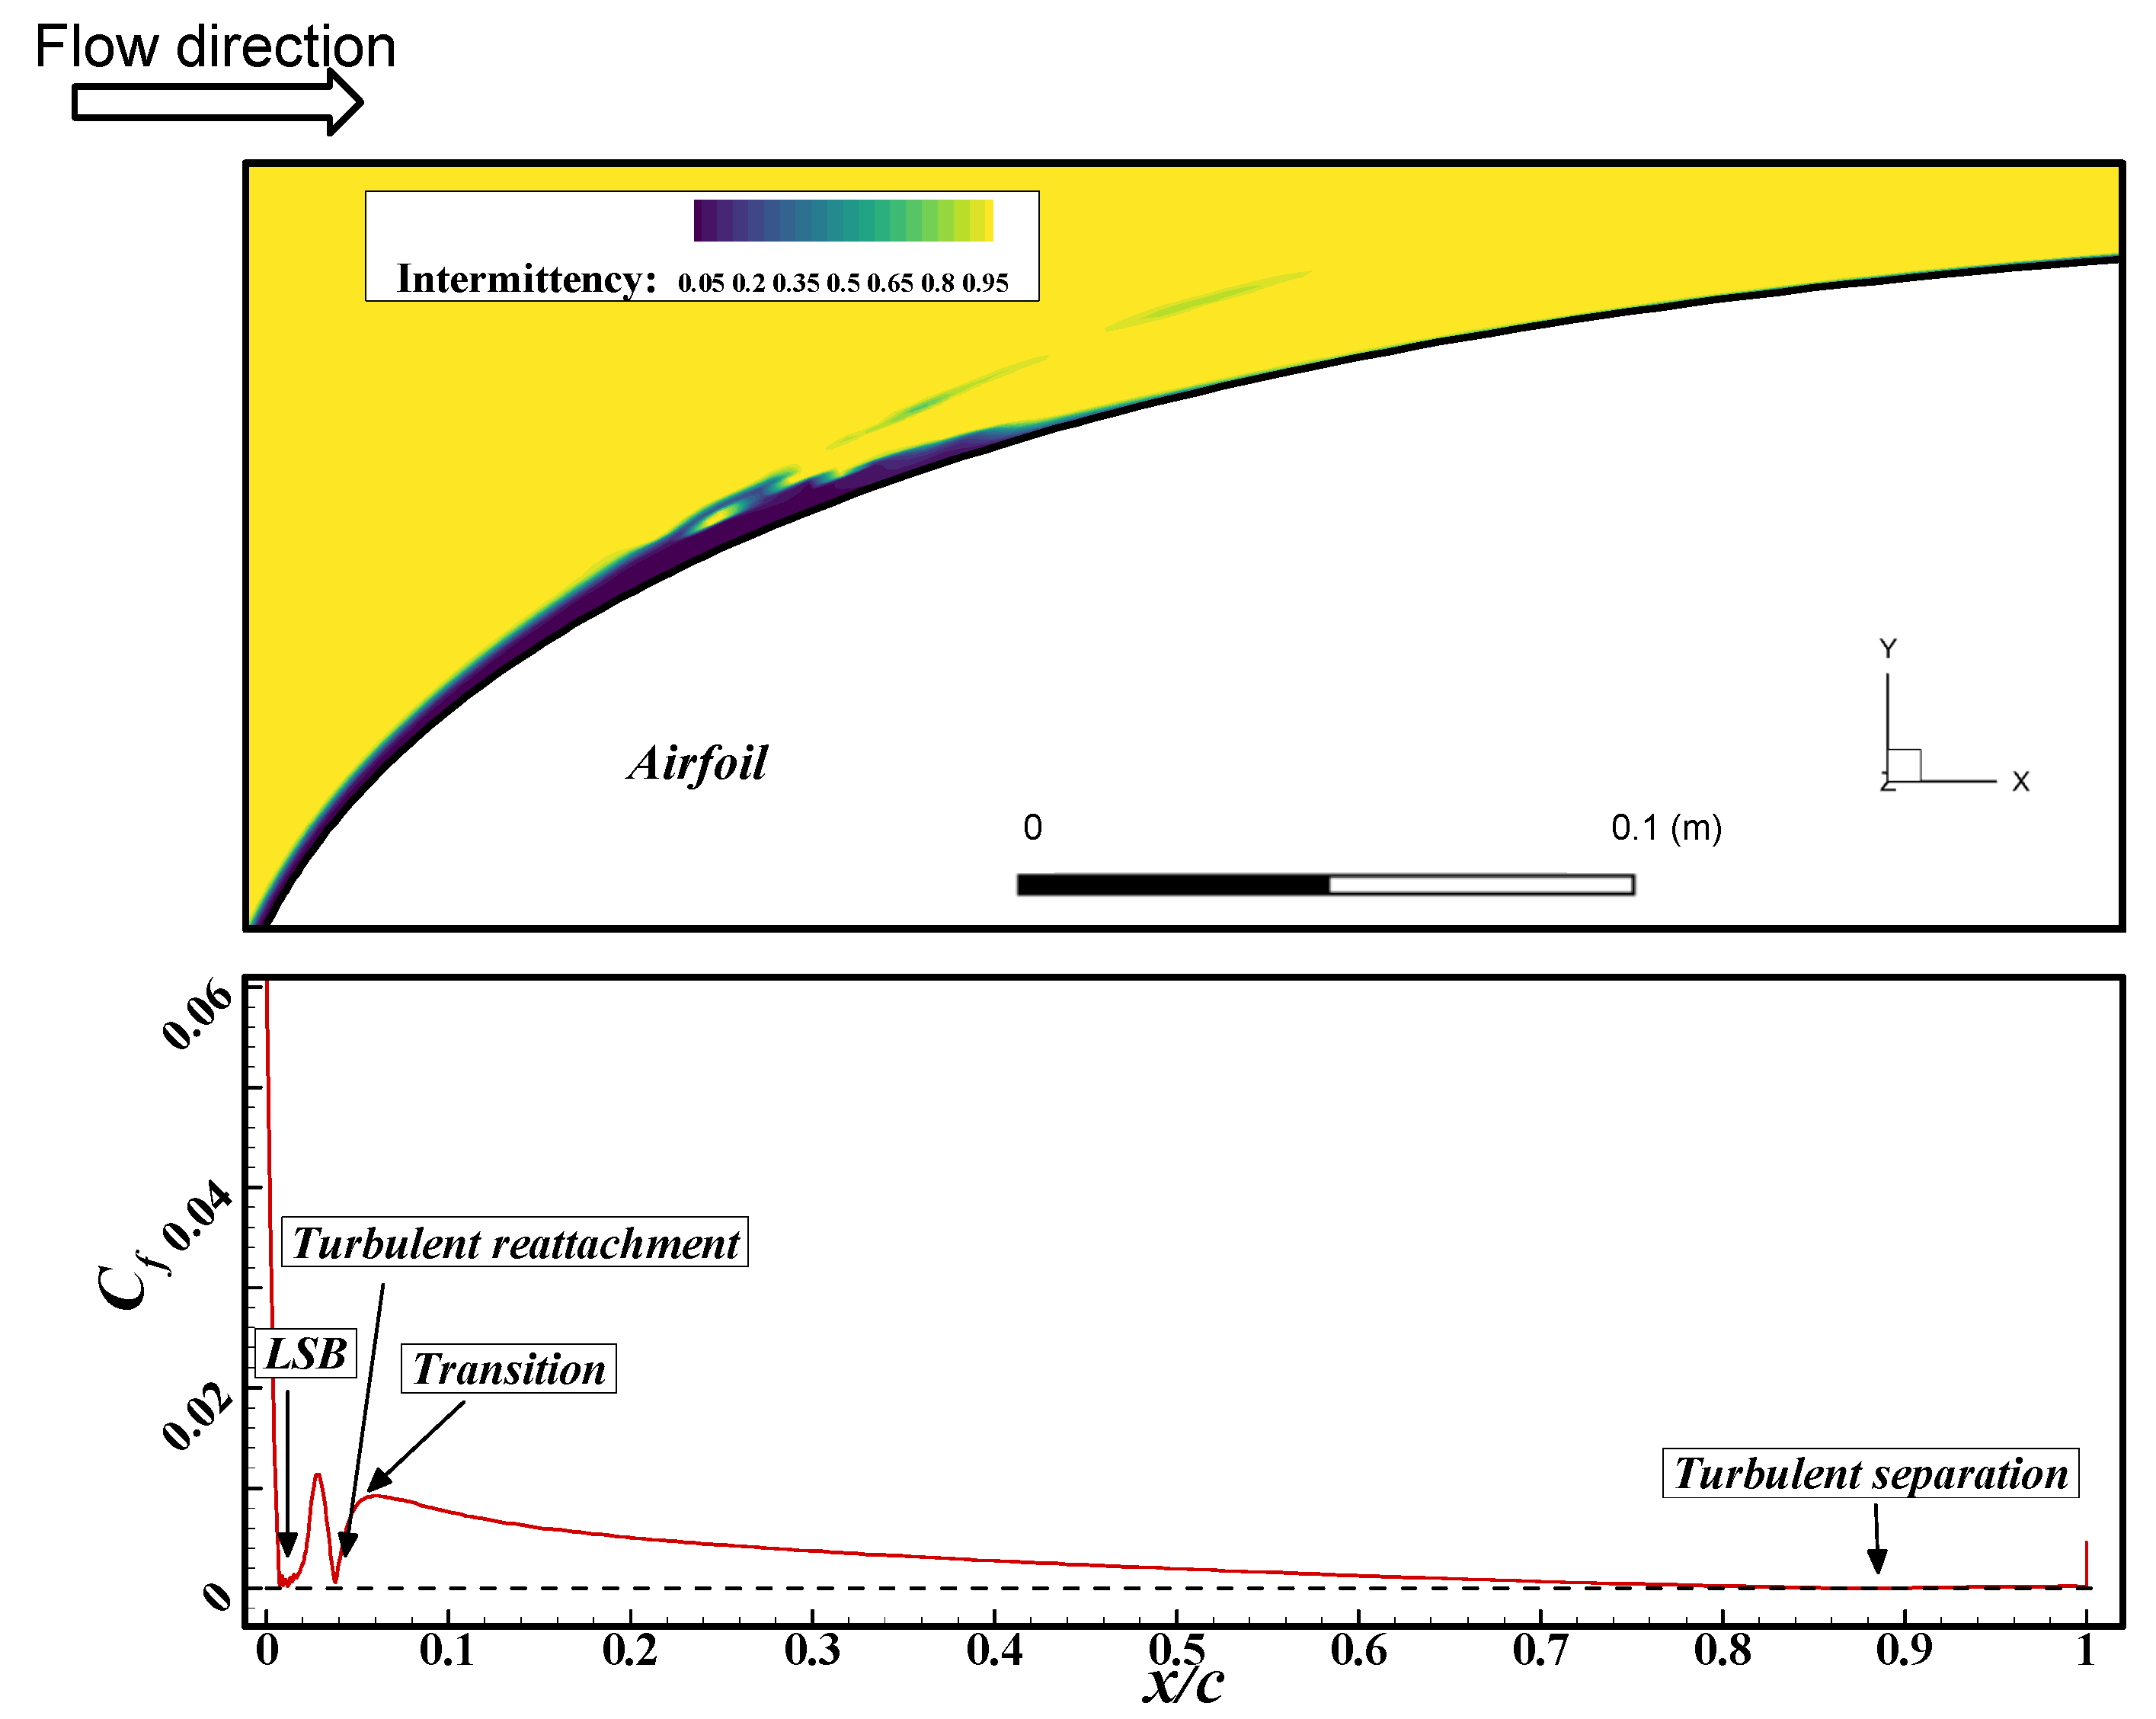
The LSB triggers the transition from a laminar to a turbulent BL at x/c = 0.0123, where Cf ~ 0. This LSB also causes a separation-induced transition, resulting in a turbulent boundary layer developing downstream of the LSB, starting at x/c = 0.04. This behaviour near the transition was captured through the use of the intermittency transition model; similar behaviour of both Cp and Cf curves has been associated in the literature with LSB triggering the onset transition when captured by transitional models [39].
The transition could also be captured by the intermittency contours (Figure 11), where a value of 0 indicates a laminar BL and a value of 1 indicates a fully developed turbulent BL. On the suction side, the flow is completely laminar. At the TE, the turbulent boundary layer eventually separates due to the larger adverse pressure gradients there, as illustrated in the Cf curve in Figure 11.
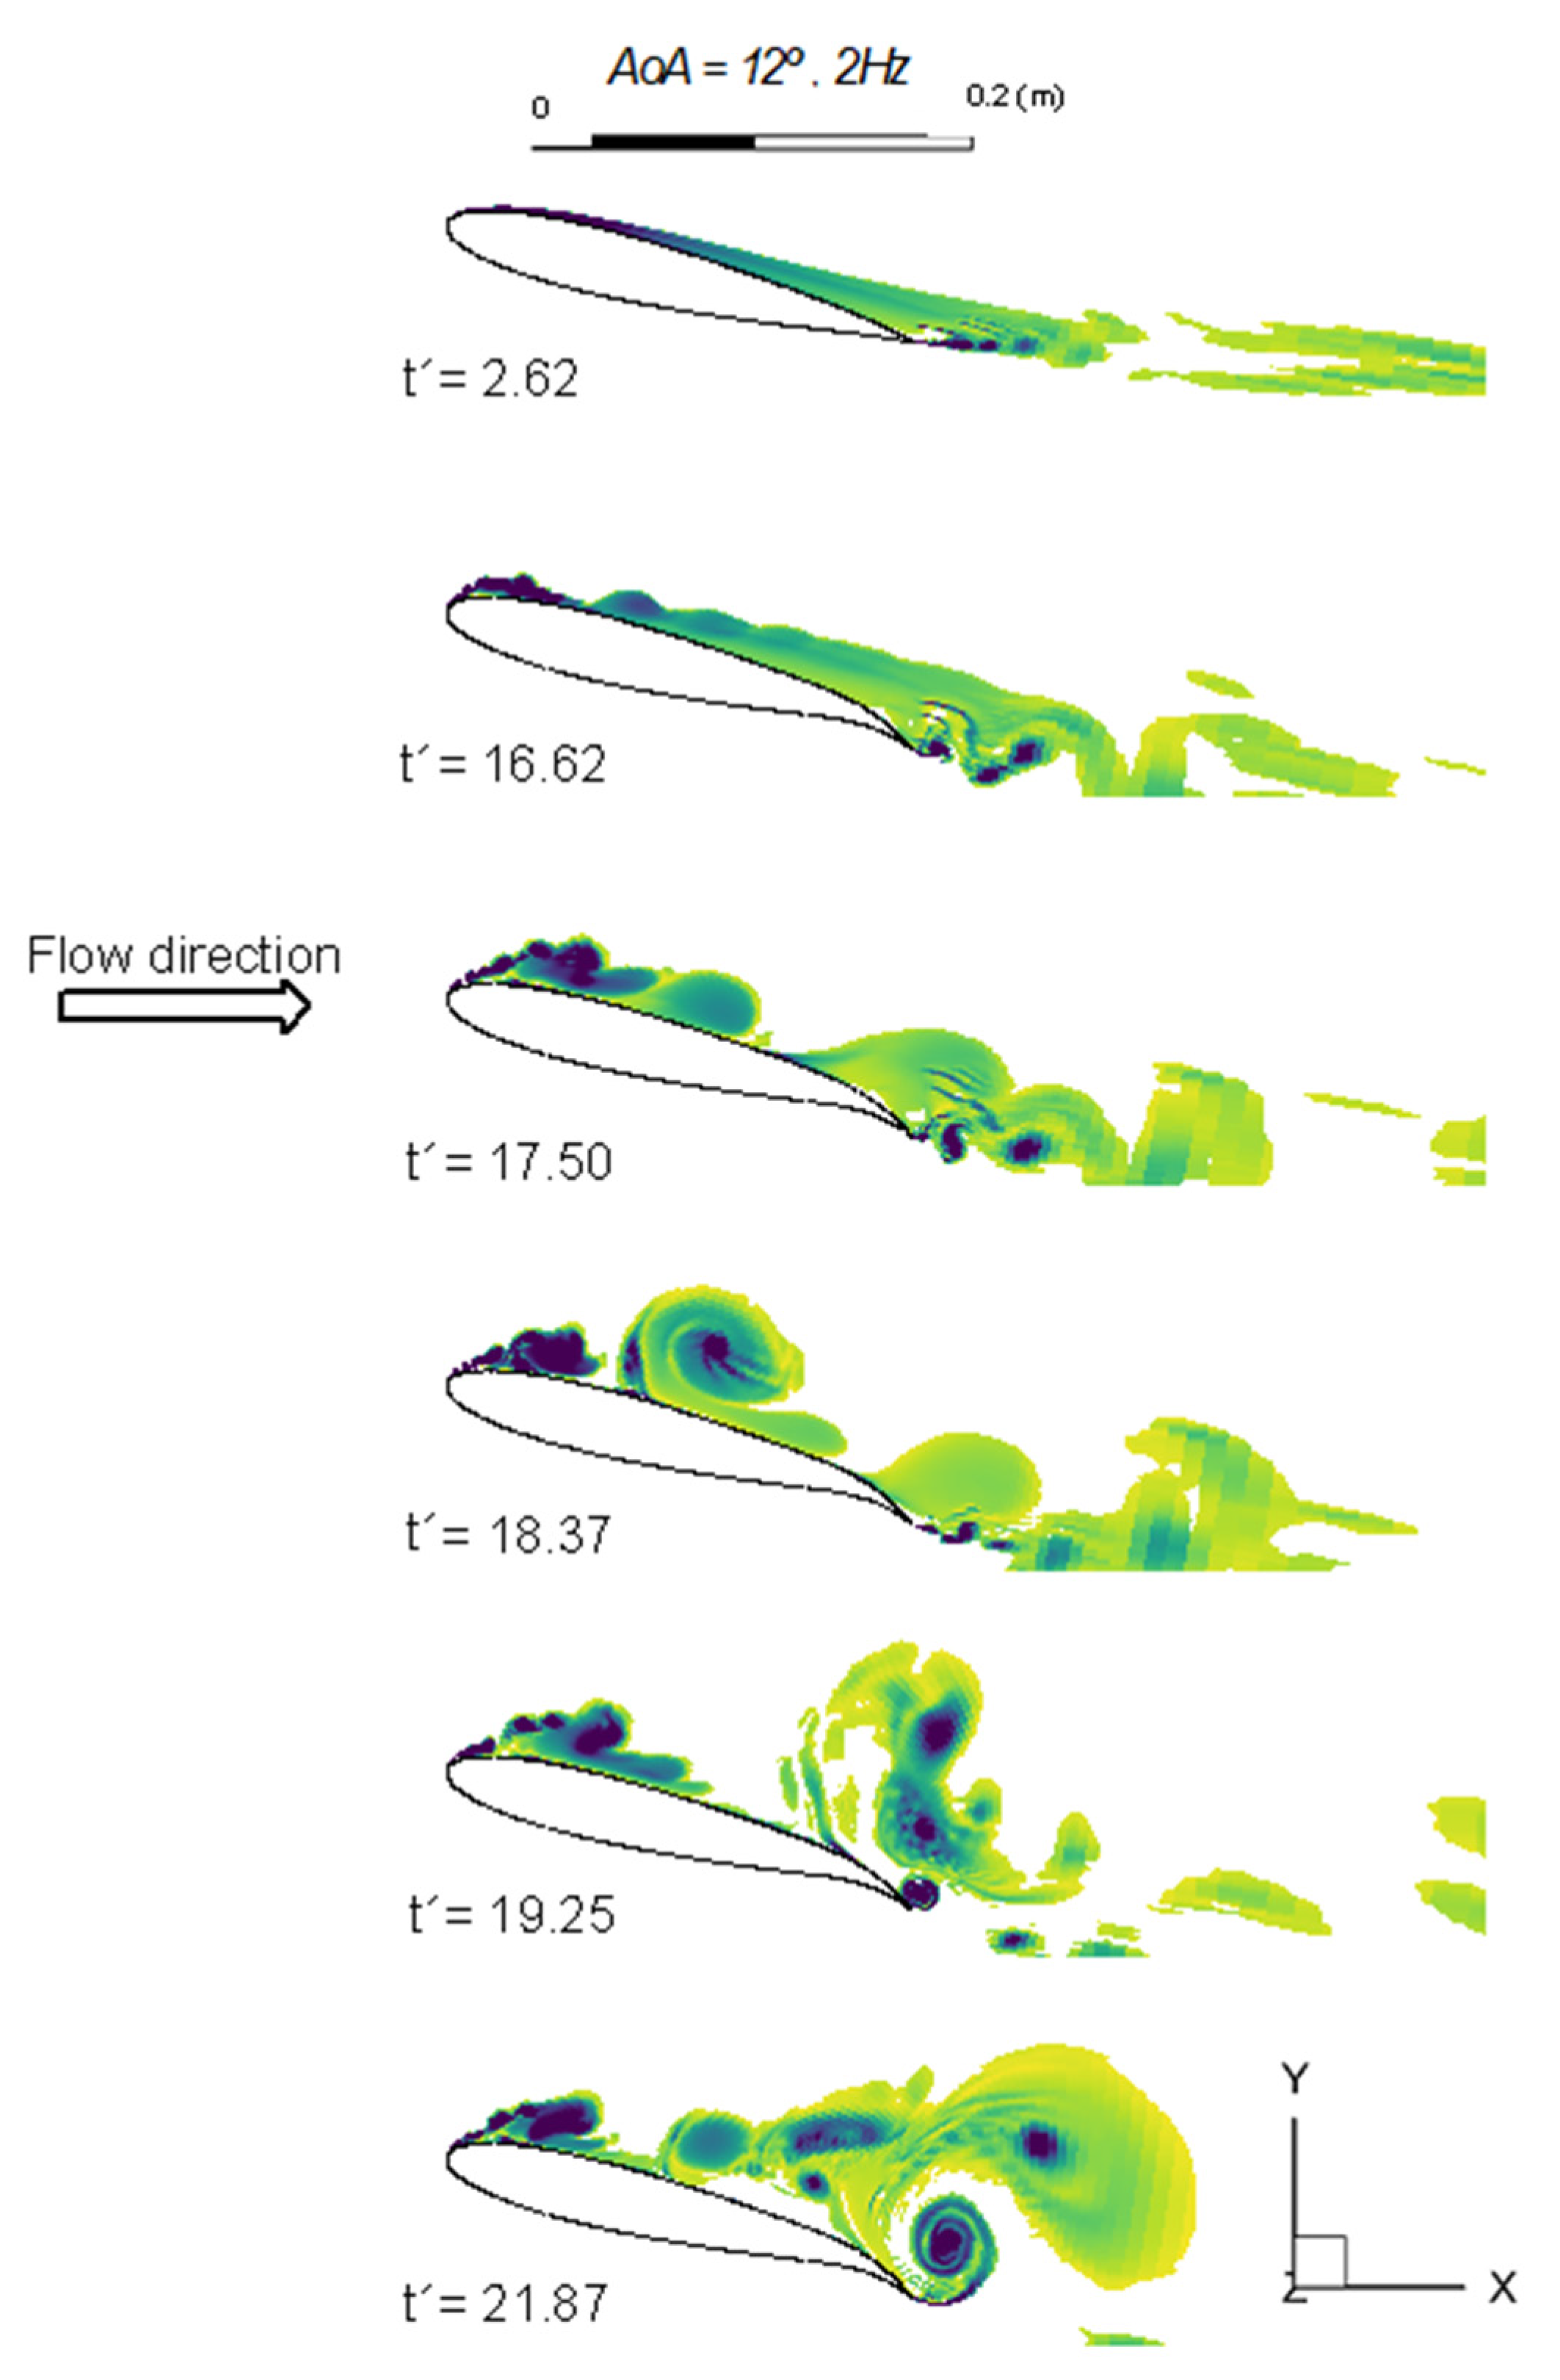
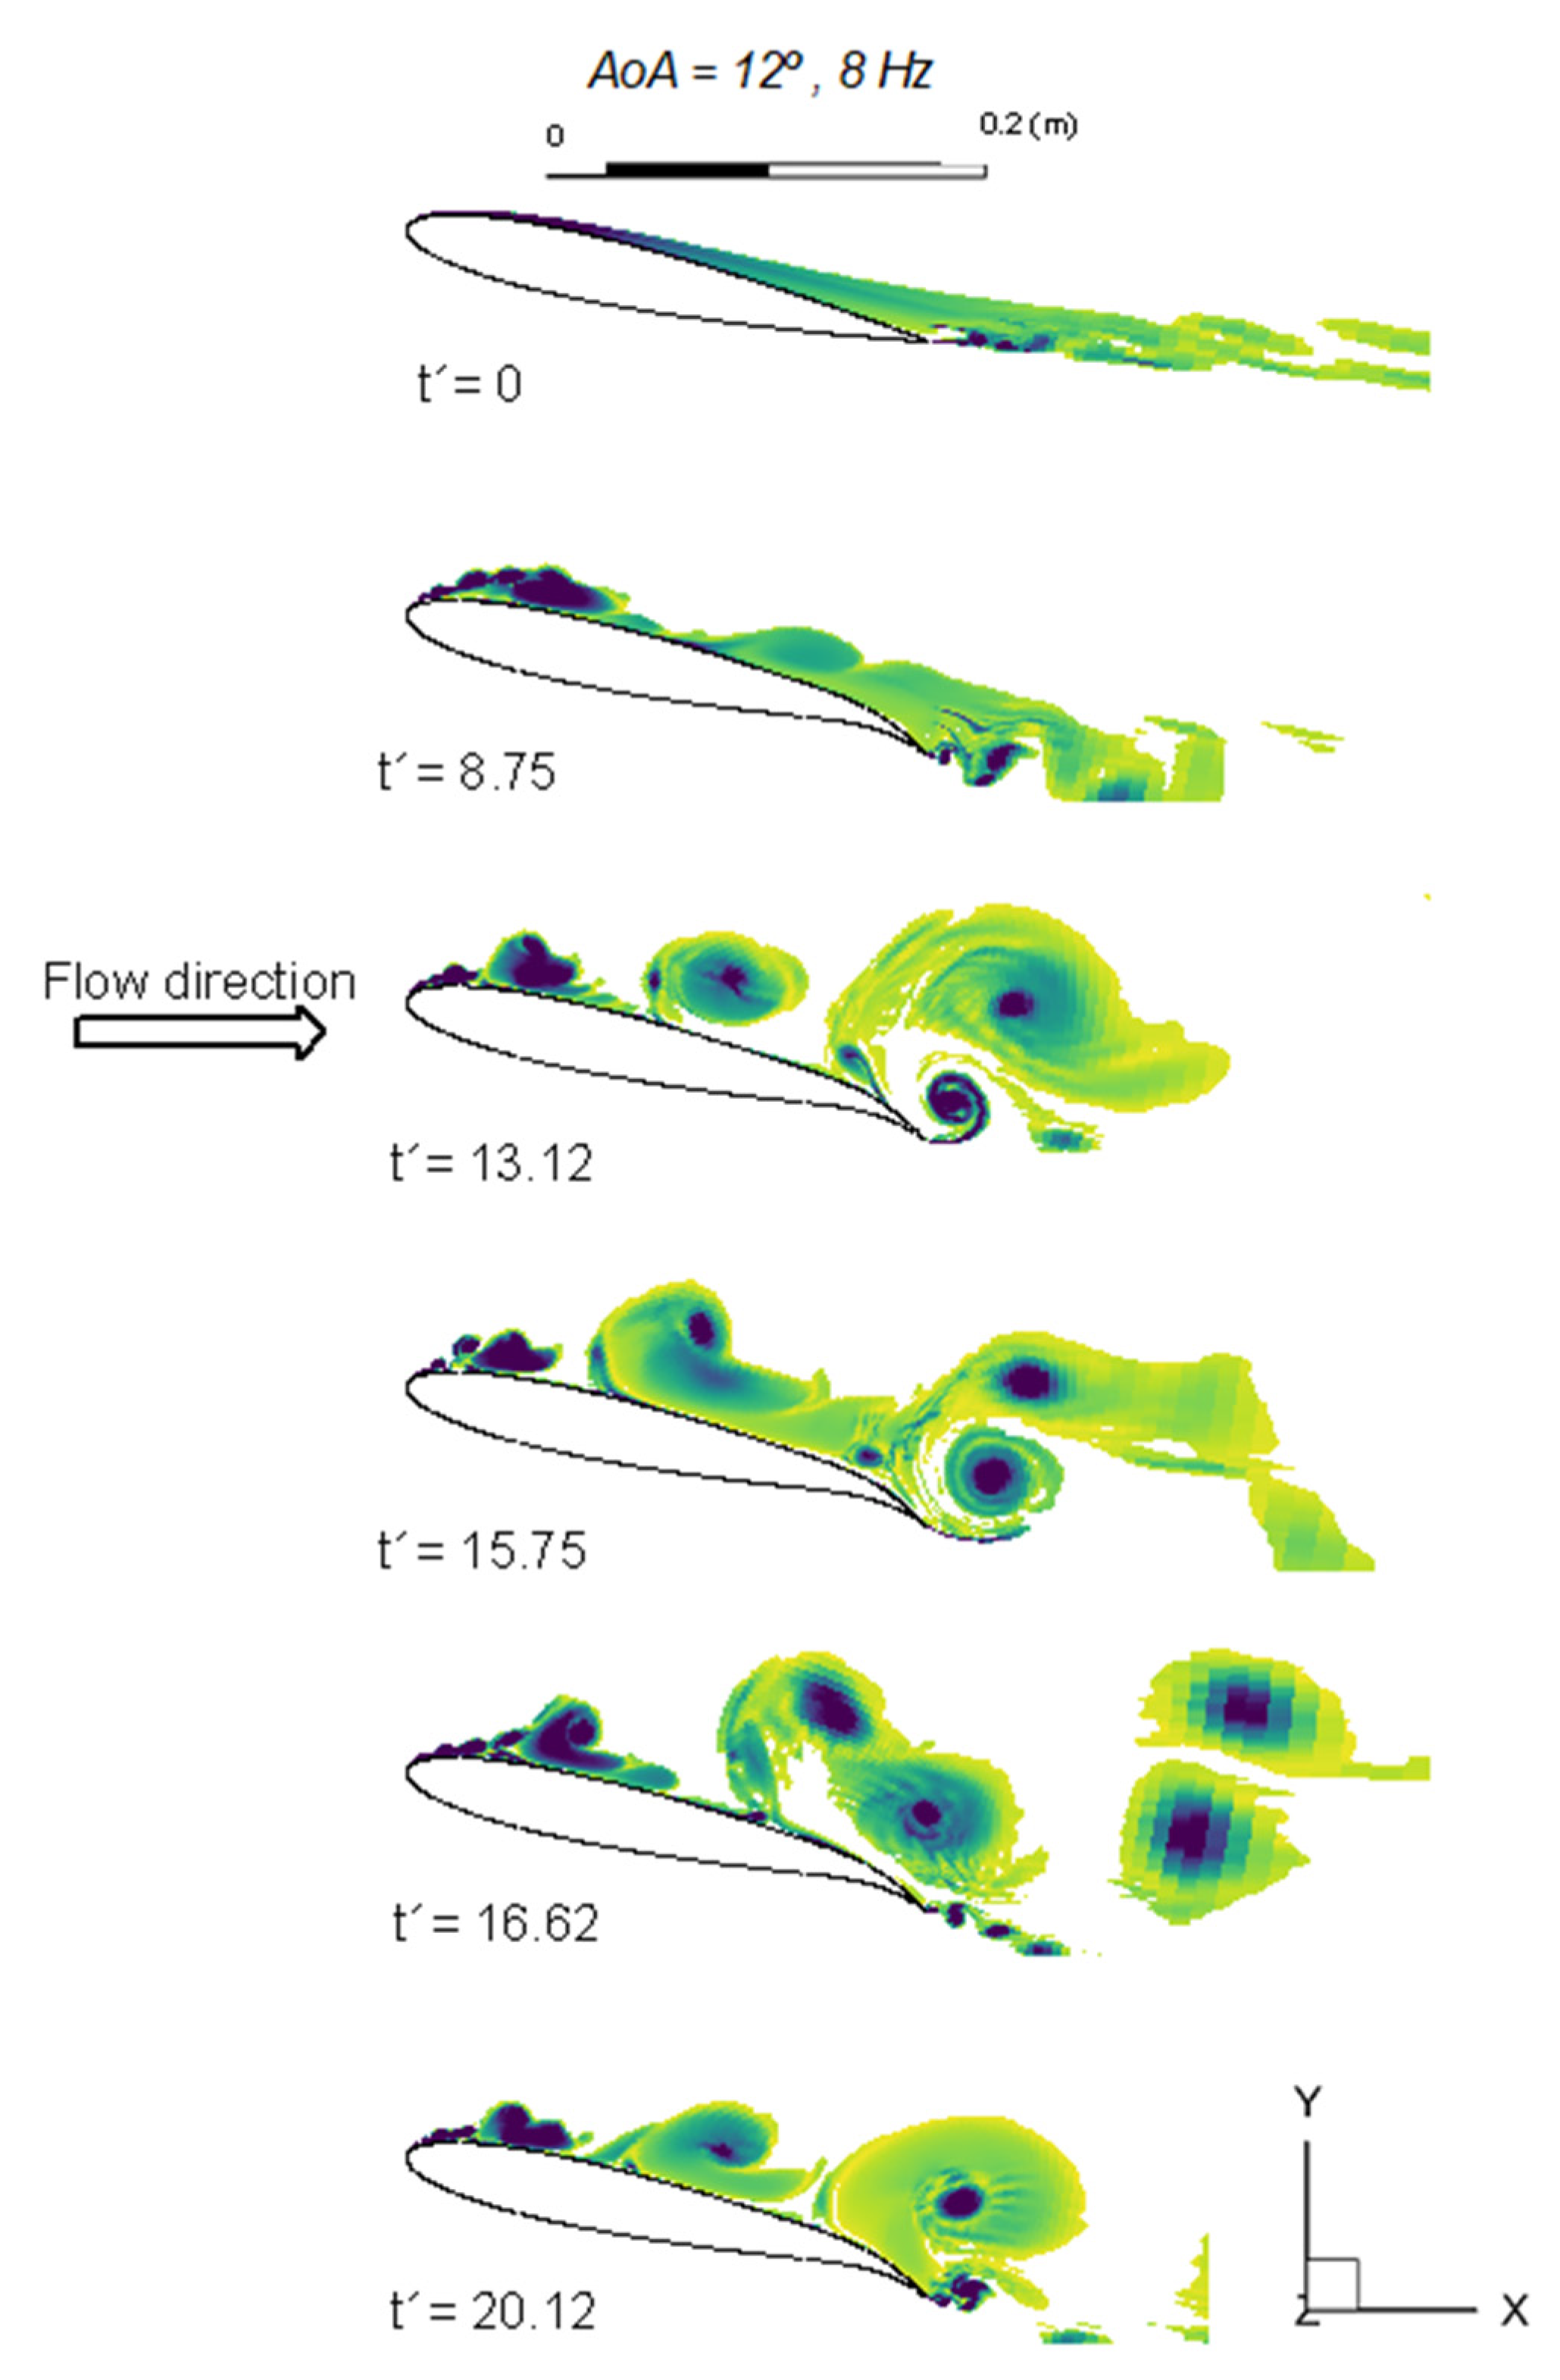
Figure 12 and Figure 13 show the vorticity contours at AoA = 12° for two different frequencies: 2 and 8 Hz. Overall, the cases do not show striking differences; perhaps the only noticeable difference is the size and vorticity of the initial vortex forming just before the morphing motion stops. Nevertheless, from the qualitative inspection of the flow responses to the morphing deflection, further insights into the mechanism by which the dynamic stall occurs can be gained.
As soon as the morphing motion starts, the separated turbulent boundary layer flow at the TE begins to propagate upstream, and in contrast to AoA = 10°, the propagation accelerates on the airfoil’s suction surface with increasing camber due to downward flap deflection. The unsteady dynamic stall flow appears to be triggered when the large-scale turbulent flow structures interact with the LSB present near the LE, which causes the latter to burst, forming a large-scale vortex which then convects downstream. In the meantime, it induces a small-scale leading-edge vortex (LEV). The turbulent boundary layer becomes separated at the TE and begins to form a second vortex that also convects downstream and merges with a counter-clockwise TE vortex. Thus, it seems that the dynamic stall is associated with the bursting of the laminar separation bubble (LSB) present in the leading-edge region.
A remarkable similarity could be found in the flow responses observed in this study to those reported by Benton et al. [40] for a ramp-type pitching-up motion at similar AoA. Benton et al. [40] studied an NACA 0012 airfoil experiencing a rapid pitching-up motion at Re = 1,000,000 using a high-fidelity LES. They reached similar conclusions regarding the mechanism that causes the airfoil to enter deep stall. This indicates that the mechanism governing the unsteady behaviour of a morphing flap has similarities with ramp-type pitching-up of a ‘rigid’ airfoil, which would possibly allow future studies of morphing downward flaps to be approximated with a rapid pitching-up motion for simplicity and with low computational overhead costs.
7. Conclusions and Future Work
High Reynolds number transient flow responses to various deflections of a morphing TEF were investigated using a hybrid RANS-LES turbulence model at three angles of attack near stall (8°, 10°, and 12°). Using a pre-defined large-amplitude flap deflection, the effects of various morphing frequencies on the dynamic response of the aerodynamic forces and on the surrounding flow field were explored.
For all AoA, both the lift and the drag coefficient responses showed a proportional relationship between the morphing frequency and the slope of response at which these quantities evolve. Interestingly, an overshoot in the drag coefficient was captured, even at quasi-static conditions, but this was not seen in the lift coefficient. The amplitude of spike in the drag coefficient was also found to be proportional to the morphing frequency, with higher frequencies causing larger overshoots. The results obtained for the range of frequencies investigated at a Reynolds number of 0.62 show the potential of rapid downward deflections for obtaining instantaneous lift increments. However, the frequencies studied did not seem to produce a recovery from the stall, and instead at the higher AoA of 12° the morphing even drove the airfoil into a dynamic stall.
Qualitative results have given some insights into the mechanism of flow responses to a rapid morphing deflection. At all AoA, the downward morphing motion enhances vortex shedding, although the mechanisms are different at lower and higher AoA. In particular, at an AoA = 12°, the morphing causes the turbulent flow structures that form at the TE to propagate upstream before interacting with the leading-edge laminar separation bubble and causing it to burst, forming a large-scale vortex that convects downstream and initiating a dynamic stall. This behaviour was also observed in the literature in a rapid pitching-up airfoil LES study.
The findings of this study indicate that at the high Reynolds number investigated, a downward morphing TEF can be used to obtain instantaneous lift increments for operational purposes, however care must be exercised to avoid large-scale flow instabilities and deep stall, especially at AoA much closer to stall.
For future work, wall-resolved 3D high-fidelity simulation is needed (e.g., using LES) in order to resolve small-scale turbulent flow structures, which would enrich our understanding of how the flow responds to dynamic morphing flap deflection. Additionally, near-stall AoA should be investigated at higher frequencies (e.g., a deflection time of an order of one convective time) to gain further understanding of unsteady flow physics, to investigate possible stall mitigation, and to explore the capabilities of TE morphing for load alleviation purposes. Lastly, it is important to extend the scope of the current study into different morphing motions, different frequency–magnitude combinations, and a wider range of Reynolds numbers.
Author Contributions
Conceptualization, C.A., A.B., and Y.Y.; methodology, C.A., A.B., and Y.Y.; software, C.A.; validation, C.A., A.B., and Y.Y.; formal analysis, C.A., A.B., and Y.Y.; investigation, C.A., A.B., and Y.Y.; resources, C.A., A.B., and Y.Y.; data curation, C.A.; writing—original draft preparation, C.A.; writing—review and editing, C.A., A.B., and Y.Y.; visualization, C.A.; supervision, A.B. and Y.Y.; project administration, Y.Y., A.B., and C.A.; funding acquisition, Y.Y., A.B., and C.A. All authors have read and agreed to the published version of the manuscript.
Funding
This research received no external funding.
Institutional Review Board Statement
Not applicable.
Informed Consent Statement
Not applicable.
Data Availability Statement
The data presented in this study are available on request from the corresponding authors.
Acknowledgments
The first author gratefully acknowledges the studentship funding received from the Engineering Modeling and Simulation Research Group, University of the West of England, Bristol, UK.
Conflicts of Interest
The authors declare no conflict of interest.
References
- Altshuler, D.L.; Bahlman, J.W.; Dakin, R.; Gaede, A.H.; Goller, B.; Lentink, D.; Segre, P.S.; Skandalis, D.A. The biophysics of bird flight: Functional relationships integrate aerodynamics, morphology, kinematics, muscles, and sensors. Can. J. Zool. 2015, 93, 961–975. [Google Scholar] [CrossRef] [Green Version]
- Abdessemed, C.; Viba, J. Investigation of flight of micro aerial vehicle with flapping wings. Eng. Rural Dev. 2014, 13, 234–240. [Google Scholar]
- Barbarino, S.; Bilgen, O.; Ajaj, R.M.; Friswell, M.I.; Inman, D.J. A Review of Morphing Aircraft. J. Intell. Mater. Syst. Struct. 2011, 22, 823–877. [Google Scholar] [CrossRef]
- Wang, L.; Li, L.; Fu, S. A comparative study of DES type methods for mild flow separation prediction on a NACA0015 airfoil. Int. J. Numer. Methods Heat Fluid Flow 2017, 27, 2528–2543. [Google Scholar] [CrossRef]
- Leveque, E.; Touil, H.; Malik, S.; Ricot, D.; Sengissen, A. Wall-modeled large-eddy simulation of the flow past a rod-airfoil tandem by the Lattice Boltzmann method. Int. J. Numer. Methods Heat Fluid Flow 2018, 28, 1096–1116. [Google Scholar] [CrossRef]
- Haldar, A.; Jansen, E.; Hofmeister, B.; Bruns, M.; Rolfes, R. Analysis of Novel Morphing Trailing Edge Flap Actuated by Multistable Laminates. AIAA J. 2020, 58, 3149–3158. [Google Scholar] [CrossRef]
- Abdessemed, C.; Yao, Y.; Bouferrouk, A.; Narayan, P. Flow Response to Rapid Morphing Flap Deflection. In Proceedings of the 54th 3AF International Conference on Applied Aerodynamics, Paris, France, 26–27 March 2019; pp. 1–10. [Google Scholar]
- Williams, D.; Kerstens, W.; Pfeiffer, J.; King, R.; Colonius, T. Unsteady lift suppression with a robust closed loop controller. In Active Flow Control II; Springer: Berlin, Germany, 2010; pp. 19–30. [Google Scholar]
- Abdessemed, C.; Yao, Y.; Narayan, P.; Bouferrouk, A. Unsteady parametrization of a morphing wing design for improved aerodynamic performance. In Proceedings of the 52rd 3AF International Conference on Applied Aerodynamics, Lyon, France, 27–29 March 2017; pp. 1–10. [Google Scholar]
- Abdessemed, C.; Yao, Y.; Bouferrouk, A.; Narayan, P. Morphing airfoils analysis using dynamic meshing. Int. J. Numer. Methods Heat Fluid Flow 2018, 28, 1117–1133. [Google Scholar] [CrossRef] [Green Version]
- Abdessemed, C.; Yao, Y.; Bouferrouk, A.; Narayan, P. Analysis of a 3D Unsteady Morphing Wing with Seamless Side-edge Transition. In Proceedings of the 36th AIAA Applied Aerodynamics Conference, Atlanta, GA, USA, 25–29 June 2018; AIAA: Atlanta, GA, USA, 2018; p. 2897416. [Google Scholar] [CrossRef] [Green Version]
- Jones, G.; Santer, M.; Debiasi, M.; Papadakis, G. Control of flow separation around an airfoil at low Reynolds numbers using periodic surface morphing. J. Fluids Struct. 2018, 76, 536–557. [Google Scholar] [CrossRef] [Green Version]
- Abderahmane, M.; Yannick, B.T.; Nikolaos, S.; Jean-Baptiste, T.; Jean-François, R.; Yannick, H.; Marianna, B. Numerical investigation of frequency-amplitude effects of dynamic morphing for a high-lift configuration at high Reynolds number. Int. J. Numer. Methods Heat Fluid Flow 2019. ahead-of-print. [Google Scholar] [CrossRef] [Green Version]
- Jodin, G.; Motta, V.; Scheller, J.; Duhayon, E.; Döll, C.; Rouchon, J.F.; Braza, M. Dynamics of a hybrid morphing wing with active open loop vibrating trailing edge by time-resolved PIV and force measures. J. Fluids Struct. 2017, 74, 263–290. [Google Scholar] [CrossRef] [Green Version]
- Abdessemed, C.; Yao, Y.; Bouferrouk, A.; Narayan, P. Aerodynamic Analysis of a harmonically Morphing Flap Using a Hybrid Turbulence Model and Dynamic Meshing. In Proceedings of the 36th AIAA Applied Aerodynamics Conference, Atlanta, GA, USA, 25–29 June 2018; American Institute of Aeronautics and Astronautics: Atlanta, GA, USA, 2018; pp. 1–15. [Google Scholar] [CrossRef]
- Abdessemed, C.; Bouferrouk, A.; Yao, Y. Aerodynamic and Aeroacoustic Analysis of a Harmonically Morphing Airfoil Using Dynamic Meshing. Acoustics 2021, 3, 177–199. [Google Scholar] [CrossRef]
- Medina, A.; Hemati, M.S.; Rockwood, M. Separated flow response to rapid flap deflection. AIAA J. 2020, 58, 1446–1457. [Google Scholar] [CrossRef]
- Amitay, M.; Glezer, A. Flow transients induced on a 2D airfoil by pulse-modulated actuation. Exp. Fluids 2006, 40, 329–331. [Google Scholar] [CrossRef]
- Medina, A.; Ol, M.V.; Mancini, P.; Jones, A. Revisiting Conventional Flaps at High Deflection Rate. AIAA J. 2017, 55, 2676–2685. [Google Scholar] [CrossRef]
- Woods, B.K.; Bilgen, O.; Friswell, M.I. Wind tunnel testing of the fish bone active camber morphing concept. J. Intell. Mater. Syst. Struct. 2014, 25, 772–785. [Google Scholar] [CrossRef]
- ANSYS. Release 18.2, Help System 2018; ANSYS: Canonsburg, PA, USA, 2018. [Google Scholar]
- Menter, F. Stress-blended eddy simulation (SBES)—A new paradigm in hybrid RANS-LES modeling. In Notes on Numerical Fluid Mechanics and Multidisciplinary Design; Springer: Cham, Switzerland, 2016; Volume 137, pp. 27–37. ISBN 978-3-319-70031-1. [Google Scholar] [CrossRef]
- Housman, J.A.; Stich, G.D.; Kiris, C.C. Predictions of slat noise from the 30p30n at high angles of attack using zonal hybrid rans-les. In Proceedings of the 25th AIAA/CEAS Aeroacoustics Conference, Delft, The Netherlands, 20–23 May 2019; p. 2438. [Google Scholar] [CrossRef] [Green Version]
- Mahak, M.; Naqavi, I.Z.; Tucker, P.G. Cost-effective hybrid RANS-LES type method for jet turbulence and noise prediction. Int. J. Aeroacoust. 2017, 16, 97–111. [Google Scholar] [CrossRef]
- Arunajatesan, S.; Sinha, N. Hybrid RANS-LES Modeling for Cavity Aeroacoutics Predictions. Int. J. Aeroacoust. 2003, 2, 65–93. [Google Scholar] [CrossRef]
- Syawitri, T.P.; Yao, Y.; Yao, J.; Chandra, B. Assessment of stress-blended eddy simulation model for accurate performance prediction of vertical axis wind turbine. Int. J. Numer. Methods Heat Fluid Flow 2020, 31, 655–673. [Google Scholar] [CrossRef]
- Rezaeiha, A.; Montazeri, H.; Blocken, B. CFD analysis of dynamic stall on vertical axis wind turbines using Scale-Adaptive Simulation (SAS): Comparison against URANS and hybrid RANS/LES. Energy Convers. Manag. 2019, 196, 1282–1298. [Google Scholar] [CrossRef]
- Nicoud, F.; Ducros, F. Subgrid-scale stress modelling based on the square of the velocity gradient tensor. Flow Turbul. Combust. 1999, 62, 183–200. [Google Scholar] [CrossRef]
- Spalart, P.R.; Deck, S.; Shur, M.L.; Squires, K.D.; Strelets, M.K.; Travin, A. A new version of detached-eddy simulation, resistant to ambiguous grid densities. Theor. Comput. Fluid Dyn. 2006, 20, 181–195. [Google Scholar] [CrossRef]
- Abdessemed, C. Dynamic Mesh Framework for Morphing Wings CFD. Ph.D. Thesis, University of the West of England, Bristol, UK, 2019. [Google Scholar]
- Abdessemed, C. Dynamic Mesh Framework for Morphing Wings CFD—User Defined Function; Zenodo: Genève, Switzerland, 2020. [Google Scholar] [CrossRef]
- Jacobs, E.; Ward, K.; Pinkerton, R. The characteristics of 78 related airfoil sections from tests in the variable-density wind tunnel. Natl. Advis. Comm. Aeronaut. 1933, 299–354. [Google Scholar] [CrossRef]
- Abdessemed, C.; Yao, Y.; Bouferrouk, A.; Narayan, P. Influence of non-iterative time-advancement schemes on the aerodynamic prediction of pitching airfoils using dynamic mesh. In Proceedings of the 8th International Symposium on Physics of Fluids (ISPF8), Xi’an, China, 10–13 June 2019. [Google Scholar]
- Abdessemed, C.; Yao, Y.; Bouferrouk, A.A.; Narayan, P. Aeroacoustic Investigation of a Harmonically Morphing Trailing Edge Flap. In Proceedings of the 53rd 3AF International Conference on Applied Aerodynamics, Salon de Provence, France, 23–26 March 2018; pp. 23–26. [Google Scholar]
- Drela, M. XFOIL: An analysis and design system for low Reynolds number airfoils. In Proceedings of the Conference on Low Reynolds Number Airfoil Aerodynamics, University of Notre Dame, Notre Dame, IN, USA, 5–7 June 1989; Volume 54, pp. 1–12. [Google Scholar] [CrossRef]
- Sheldahl, R.E.; Klimas, P.C. Aerodynamic Characteristics of Seven Symmetrical Airfoil Sections through 180-Degree Angle of Attack for Use in Aerodynamic Analysis of Vertical Axis Wind Turbines; SAND80-211; Sandia National Labs: Albuquerque, NM, USA, 1981; p. 118. [CrossRef] [Green Version]
- Church, B.; Paschereit, C.O.; Holst, D.; Saverin, J.; Pechlivanoglou, G.; Tüzüner, E.; Nayeri, C.N. Experimental Analysis of a NACA 0021 Airfoil Section Through 180-Deg Angle of Attack at Low Reynolds Numbers for Use in Wind Turbine Analysis. J. Eng. Gas Turbines Power 2018, 141, 041012. [Google Scholar] [CrossRef]
- Ladson, C.L. Effects of Independent Variation of Mach and Reynolds Numbers on the Low-Speed Aerodynamic Characteristics of the NACA 0012 Airfoil Section; Nasa Tm 4074; NASA Langley Research Center: Hampton, VA, USA, 1988; Volume 97. [CrossRef]
- Langtry, R.; Menter, F. Transition Modeling for General CFD Applications in Aeronautics. In Proceedings of the 43rd AIAA Aerospace Sciences Meeting and Exhibit, Reno, NV, USA, 10–13 January 2005; American Institute of Aeronautics and Astronautics: Reston, VA, USA, 2005; p. 522. [Google Scholar] [CrossRef] [Green Version]
- Benton, S.I.; Visbal, M.R. The onset of dynamic stall at a high, transitional Reynolds number. J. Fluid Mech. 2018, 861, 860–885. [Google Scholar] [CrossRef]
Figure 1.
Various aspects of active morphing in nature’s flyers (with permission of [1]).
Figure 1.
Various aspects of active morphing in nature’s flyers (with permission of [1]).

Figure 2.
Resulting deformation of the unsteady FishBAC parametrization method.

Figure 3.
Unstructured patch around the TEF, (top—no deflection) before and (down at max deflection) after mesh deformation.
Figure 3.
Unstructured patch around the TEF, (top—no deflection) before and (down at max deflection) after mesh deformation.

Figure 4.
Details of the computational domain and mesh used.

Figure 5.
Results for CL (solid) and CD (dashed) obtained from the Fluent simulation compared with XFOIL predictions and the experimental results for an NACA 0012 airfoil obtained by Sheldahl et al. (with permission of [36]).
Figure 5.
Results for CL (solid) and CD (dashed) obtained from the Fluent simulation compared with XFOIL predictions and the experimental results for an NACA 0012 airfoil obtained by Sheldahl et al. (with permission of [36]).

Figure 6.
Lift and drag coefficient response to rapid morphing flap for all the cases studied, where .
Figure 6.
Lift and drag coefficient response to rapid morphing flap for all the cases studied, where .

Figure 7.
Aerodynamic efficiency during the morphing TEF deflection, where .

Figure 8.
Instantaneous contours of the vorticity showing the evolution of the turbulent structures at AoA = 10° and 8 Hz.
Figure 8.
Instantaneous contours of the vorticity showing the evolution of the turbulent structures at AoA = 10° and 8 Hz.

Figure 9.
Close-up view showing the flow features around the TE and the formation of LBL at the pressure surface at t′ = 8.05.
Figure 9.
Close-up view showing the flow features around the TE and the formation of LBL at the pressure surface at t′ = 8.05.

Figure 10.
Mean velocity magnitude contours (top). Mean pressure coefficient (Cp) and skin friction coefficient (Cf) (down) for NACA 0012 at AoA = 12°.
Figure 10.
Mean velocity magnitude contours (top). Mean pressure coefficient (Cp) and skin friction coefficient (Cf) (down) for NACA 0012 at AoA = 12°.

Figure 11.
Intermittency contours (top) and mean skin friction coefficient (Cf) (bottom) on the suction side of the NACA 0012 at AoA = 12°.
Figure 11.
Intermittency contours (top) and mean skin friction coefficient (Cf) (bottom) on the suction side of the NACA 0012 at AoA = 12°.

Figure 12.
Instantaneous contours of the vorticity showing the evolution of the turbulent structures at AoA = 12° and 2 Hz.
Figure 12.
Instantaneous contours of the vorticity showing the evolution of the turbulent structures at AoA = 12° and 2 Hz.

Figure 13.
Instantaneous contours of the vorticity showing the evolution of the turbulent structures at AoA = 12° and 8 Hz.
Figure 13.
Instantaneous contours of the vorticity showing the evolution of the turbulent structures at AoA = 12° and 8 Hz.


Table 1.
Summary of the cases investigated.
| wte = 0.05%c, AoA = 8° | ||||
| Frequencies (Hz) | 1 | 2 | 4 | 6 |
| wte = 0.05%c, AoA = 10° | ||||
| Frequencies (Hz) | 2 | 4 | 6 | 8 |
| wte = 0.05%c, AoA = 12° | ||||
| Frequencies (Hz) | 2 | 4 | 6 | 8 |
Table 2.
Mesh characteristics before and after mesh deformation, where the range of the metrics indicates the minimum and maximum values of each metric and the solver requirements indicate the minimum value that the mesh metrics need to satisfy.
Table 2.
Mesh characteristics before and after mesh deformation, where the range of the metrics indicates the minimum and maximum values of each metric and the solver requirements indicate the minimum value that the mesh metrics need to satisfy.
| Mesh Metric | Baseline | Deformed at Max Deflection | Difference | Range of the Metrics | Solver Requirements |
|---|---|---|---|---|---|
| Average Orthogonal Quality | 0.9624 | 0.9479 | −2% | 0 (worst) to 1 (best) | the closer to 1 the better |
| Minimum Orthogonal Quality | 0.0609 | 0.06052 | −1% | Larger than 0.01 | |
| Maximum Skewness | 0.6825 | 0.7031 | 3% | 0 (best) to 1 (worst) | Lower than 0.98 |
Table 3.
Summary of frequencies used, morphing lengths, and times when the morphing stopped.
| Frequency (Hz) | Morphing Time Tmoprh (s) | Morphing Stop Time | |
|---|---|---|---|
| 1 | 0.25 | 0.75 | 43.74 |
| 2 | 0.125 | 0.625 | 21.87 |
| 4 | 0.0625 | 0.5625 | 10.93 |
| 6 | 0.042 | 0.542 | 7.29 |
| 8 | 0.03125 | 0.53125 | 5.46 |
Publisher’s Note: MDPI stays neutral with regard to jurisdictional claims in published maps and institutional affiliations. |
© 2021 by the authors. Licensee MDPI, Basel, Switzerland. This article is an open access article distributed under the terms and conditions of the Creative Commons Attribution (CC BY) license (https://creativecommons.org/licenses/by/4.0/).
Share and Cite
MDPI and ACS Style
Abdessemed, C.; Yao, Y.; Bouferrouk, A. Near Stall Unsteady Flow Responses to Morphing Flap Deflections. Fluids 2021, 6, 180. https://0-doi-org.brum.beds.ac.uk/10.3390/fluids6050180
AMA Style
Abdessemed C, Yao Y, Bouferrouk A. Near Stall Unsteady Flow Responses to Morphing Flap Deflections. Fluids. 2021; 6(5):180. https://0-doi-org.brum.beds.ac.uk/10.3390/fluids6050180
Chicago/Turabian StyleAbdessemed, Chawki, Yufeng Yao, and Abdessalem Bouferrouk. 2021. "Near Stall Unsteady Flow Responses to Morphing Flap Deflections" Fluids 6, no. 5: 180. https://0-doi-org.brum.beds.ac.uk/10.3390/fluids6050180