
Effect of the Pore Geometry on the Driving Pressure across a Bubble Penetrating a Single Pore


Department of Mechanical Engineering, University of Alberta, Edmonton, AB T6G 2R3, Canada
*
Author to whom correspondence should be addressed.
Fluids 2022, 7(10), 333; https://0-doi-org.brum.beds.ac.uk/10.3390/fluids7100333
Submission received: 9 September 2022
/
Revised: 10 October 2022
/
Accepted: 18 October 2022
/
Published: 20 October 2022
(This article belongs to the Special Issue Recent Advances in Fluid Mechanics: Feature Papers, 2022)
Abstract
:The passage of a bubble and the required energy for its motion through a confining pore can potentially be affected by the surface roughness and geometry of the pore. The motion of an isolated bubble passing through four different pore geometries (three circular pores, a smooth pore and 2 with different roughness, and a sharp triangular pore) is investigated. The shape of the deformed bubble passing these geometries was evaluated to determine the pressure drop across the bubble and hence the driving force to cause motion. The results of investigating the motion of the bubbles and the change in the pressure and velocity of the bubbles showed that the pore shape and surface roughness have a significant effect on the passage of the isolated phase. The motion of the bubble entering the entrance of the circular pores was similar for all circular cases. On exiting, however, a clear difference between the cases due to the presence of the peaks of the roughness was observed. These results indicate that, in addition to the critical pressure at the entrance of the pore, extra resistance will be introduced due to bubble phase pinning at the exit caused by roughness of the pore.
1. Introduction
Multi-phase flow motion in a porous media is broadly observed in different applications such as oil recovery [1], food processing [2], and macromolecular delivery [3]. The motion of an immiscible phase having different motility in the pore space will lead to the trapping of the dispersed phase caused by the snap-off or the bypass of the phases within the pore structures [4,5]. The mobilization of the trapped phase is important for many applications such as trap oxygen gas bubbles in contaminated groundwater or residual oil in the recovery of oil reserves [5,6,7,8,9]. Having a better understanding of the motion of the phases and their interaction with the surrounding fluid and solid geometry is beneficial to predict the required energy needed to mobilize the isolated phase.
Over the past two decades, the motion of multi-phase flows in porous media has been studied by groups of researchers at a macro and micro scale [10,11,12,13,14,15,16,17,18,19]. The comparison between the motion of single-phase and multi-phase flow indicates that higher resistance to the flow is observed for multi-phase flows [20,21,22,23,24,25]. The resistance is introduced due to the deformation of the dispersed phase which arises from the interfacial interaction between the phases and the flow passage [26,27,28]. Phase trapping in the pore geometry occurs due to the critical pressure introduced by the interaction of the dispersed phase and the solid interface at the entrance of the confined geometry [29]. To mobilize the trapped phase in the pore geometry, a critical driving force is needed to overcome the entrance pressure [8].
Various factors have an impact on the motion of the isolated dispersed phase in a pore structure such as the velocity [30,31,32,33,34] and rheology of the carrying fluid [35,36,37] the pressure of the system [38], the relative size of the dispersed phase compared to the pore [39,40,41] and the capillary number [39,40,41,42,43]. Studies on the interaction of the solid surface and the trapped isolated phase has shown that pore structure [44], grain morphology, and wettability of the surface play important roles in the motion of isolated dispersed phases in the pore structure [44,45,46,47]. Other studies [22,41] on the effect of the pore structure on the motion of multi-phase flow have mainly focused on the overall phase trapping in the pore space and phase residual. Overall, these studies did not focus on the fundamentals of the interaction of an isolated dispersed phase and solid geometry and the effect of the grain morphology on the motion of the dispersed phase through a pore geometry.
Research work focusing on the pore-scale interaction of an isolated dispersed phase and pore geometry [38,39] showed that in addition to the entrance critical pressure, the strong interaction of the solid interface and the pore geometry can lead to an extra critical pressure at the exit of the pore geometry [48]. The introduced flow restrictions will lead to different flow motions within the geometry and the calculation of the critical entrance pressure is not sufficient to predict the required driving force for the mobilization of the trapped phase in the solid geometry [49,50]. The surface properties of the confined geometry are an important component for emulsion flows in porous media [14,15,16,17,18,19,20,21,22,23].
The main objective of this study is to investigate the pore-scale effects of shape and surface roughness of a confined geometry on pressure distribution within the multi-phase flow and the required transit time for the phase to pass the confined geometry. To achieve this goal, an isolated bubble is considered as a dispersed phase to pass through a pore space and its deformation and velocity will be monitored using a shadowgraph imaging method. The interaction of the bubble and the interface is visualized by the deformation of the phase at different stages and velocity and pressure distribution were selected as representative parameters for the flow properties. The pressure in this study is calculated using an indirect method proposed in our previous studies [33,51]. The results of this study will aim to provide a better understanding of the effect of pore surface properties on pore-scale capillary pressure and fluid motion within a porous media.
2. Pressure Calculation from Shape Analysis
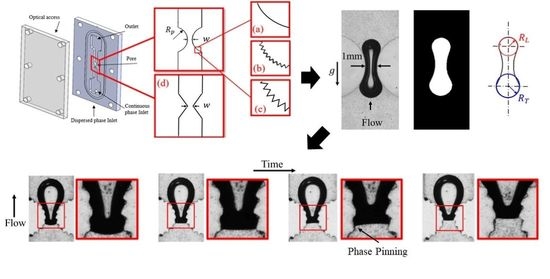
The pressure changes across a dispersed phase passing through a confined geometry or its driving pressure, can be determined using the theory introduced by Jamin (1860) [52] which was derived from the Young–Laplace equation. According to this theory, the pressure changes within the deformed dispersed phase () is inversely proportional to the change in the radii of curvature of the trailing () and leading-edge () as defined in Figure 1a and proportional to the interfacial tension () as:
The change in the pressure within the phase () showed that a different local pressure change along the phase can be expected depending on the location of the dispersed phase within the pore geometry. A sample of the different stages of bubble deformation and their corresponding change in the pressure of the phase is shown in Figure 1b. The deformation of bubble can be monitored by the relative location of the centroid of the projected area of the bubble () with respect to the pore throat (). Where the bubble will have similar RL = RT at leading to = 0.
The pressure gradient generated within the dispersed phase is positive as the droplet enters the pore in the stage seen in Figure 1b (RL < RT) leading to an extra resistance to the droplet passage [21,35]. Negative occurs when the dispersed phase exists the pore which results in the acceleration of the dispersed phase (Figure 1b (RL > RT). Zero occurs when the pressure distribution is uniform between the leading and trailing edge of the bubble RL = RT. To monitor the instantaneous change in the motion of isolated bubbles passing through a pore geometry, an image processing technique developed in our previous studies [41,53] can be utilized. As reported in our previous study [49], the maximum uncertainty for detection will result to a 5.5% error in calculation of the change in the radius of curvature. The proposed methodology to evaluate the motion of the phase can detect the critical pressure required for mobilization of the phase in the pore geometry (). The critical pressure can be determined from the first peak detected in the motion of the dispersed phase on entrance into the confined geometry.
3. Experimental Setup and Image Processing
An optical setup was used to measure and track the motion and deformation of a bubble passing through a pore geometry is shown in Figure 2. The setup consists of two main sections of an imaging system containing a camera (4M180, IO Industries Inc., London, UK), a light source (BX0404-520 nm; Advanced Illumination Inc., Rochester, VT, USA), and data acquisition (DVR Express Core 2, IO Industries Inc., London, UK) [54,55,56]. The second section, the flow loop, consisted of two syringe pumps for each phase (PHD 2000, Harvard Apparatus, Holliston, MA, USA) and a flow channel, as highlighted in the figure.
The designs of the flow channels used to study different pore geometries are shown in Figure 3. The flow channels consisted of two assembled layers of an optical access window and the main flow channel. The window access is made of acrylic sheet and manufactured using a laser cutter (VersaLaser VLS Version 3.50; Universal Laser Systems, Scottsdale, AZ, USA). The design main flow channels with the desired features were manufactured from a photo-reactive resin using the stereolithography (SLA) additive manufacturing technique (Form 2, Formlabs Inc., Somerville, MA, USA). The flow channels are manufactured with resolution of 25 µm for each layer.
Two separate inlets for the continuous and the dispersed phase were designed at the bottom of the flow channel as highlighted in Figure 3. Glycerol (100% Pure Glycerol (Molecular Biology), Fisher BioReagents™, Pittsburgh, PA, USA) was used as the continuous flow and air was used as the dispersed phase. The glycerol had a viscosity of 1.412 Pa.s, density of 1.26 g/cm and surface tension of 64 mN/m [57,58]. The continuous phase in each experiment was injected with different flow rates of 0.1, 0.2, and 0.3 mL/min. Air, as a dispersed phase, was injected at time intervals to generate an isolated bubble. The content angle measurement between the phases was obtained using a SLA sample piece manufactured with the same setting as the flow channel. The contact angle between a glycerol droplet and the solid interface is 130°.
The motion of the multi-phase flow in the pore space was studied by modeling the pore space of two adjacent particles in the flow channels. Four different pore geometries were designed as shown in the detailed views of Figure 3. These pore geometries are a smooth circular pore, circular pore with two different roughness (0.2 and 0.4 mm), and a sharp pore. In these channels, two cylindrical pillars were used to mimic the geometry of two adjacent particles in the pore space with smooth surfaces. The diameter pillars () were 2 mm and they were separated by w = 1 mm at the pore throat. The detail view (a) of Figure 3 represents the design of the smooth circular pore. Two different roughness of 0.2 and 0.4 mm, shown in the detail view (b) and (c), were used to compare the effect of roughness. A sharp pore geometry with the same aperture was also considered to account for the effect of the change of the convergence of the pore on the pressure distribution. In this case, two adjacent rectangles were considered as shown in the detail view (d). For all cases, the depth of the channel was 3 mm. Figure 4 shows the pictures of the pore geometries after manufacturing on the left for each pore geometry and their corresponding original designs are shown on the right.
A sample of a raw image of a bubble and the surrounding fluid passing through a circular pore is shown in Figure 5a. The images are collected in the mid-plane of channel to evaluate the deformation of the bubble in the symmetry plane. The bubble is reflected as a black hollow region as shown in the picture due to the difference between the refractive indexes of glycerol and air. To have better detection of the deformation of the bubble and remove noise of the background, the images need to be pre-processed. The details of these procedures can be seen in [33,41,53]. The deformation of the dispersed phase in the pore geometry will be then detected by the radius of the leading and trailing edge at each location as shown in Figure 5c. Having the curvature of the leading and trailing edges, the pressure change across the bubble can be evaluated using Equation (1).
4. Results
4.1. Flow Visualization of Bubbles Deformation Passing Different Pore Geometries
A series of images showing the passage of the bubble and its deformation for bubbles having a similar equivalent radius (radius of bubble, 3 mm) passing through the different pore geometries are shown in Figure 6. The images were selected based on the location of the centroid of the projected area of the bubble from the pore throat to highlight the bubble shape at these locations for the different surface conditions. As shown in location (a) for all pore geometries, the bubbles are symmetric and have a similar radius of the curvature of leading and trailing edges. They are slightly oval at this position due to the presence of a confining wall effect on the bubble’s interface as was reported in [59]. The results of the pressure calculation for the bubble passage are unique for the current experiment due to the presence of the confining wall. As the size of the bubble considered in this study is same, the results of the trend of the change in the pressure and the radius of curvature is general and can be applied for any confining geometry condition.
As the bubbles approach the pore geometry, their leading-edge deforms slightly as shown in location (b) in Figure 6. The deformation in this location leads to the decrease in the radius of curvature of the leading edge compared to the trailing edge of the bubble. The decrease in the leading edge continues until it passes the pore throat as shown in Figure 6c. After this location, the leading-edge radius of curvature increases and reaches an equilibrium condition after the bubble has passed through the pore geometry.
As shown in Figure 6, there is a significant difference between the motion of bubbles exiting the pore geometries with different roughness. The effect of the surface condition of the pore geometry on the motion of the bubble can be observed by the deformation of the trailing edge at different locations along the pore. In the case of a smooth circular pore, shown in Figure 6I, the bubbles trailing edge decreases as it enters the pore geometry. The trailing edge maintains its convex curvature during its passage in the pore. As it reaches the exit of the pore, in location (h) of case (I), the interaction between the pore solid interface and the bubble leads to the development of phase pinning. Change in the detachment of the bubble exiting a circular pore geometry is highly affected by the relative size of the bubble with the pore and the continuous phase flow rate. A sample of the effect of the continuous phase flow rate is shown in Figure 7. The bubble’s trailing edge interface becomes flat for lower flow rates and as the flow rate increases, the bubbles trailing interface becomes concave.
The motion of a bubble passing through a circular pore with roughness is shown in Figure 6II,III. Having a closer look at the interaction of the bubble and pore geometry shows that the bubble deforms to fill the pore roughness. It does not block the valleys of the pore roughness and the phases are mostly in contact at the peak of the roughness of the pore. The higher contact area between the bubble and the solid surface in this condition results in more interaction between the surface and the trailing region of the bubble. Therefore, phase pinning occurs at each peak of the roughness of the pore interface shown in locations (g) and (h) for cases (II), and (III).
For rough pores, the interface of the trailing edge of the bubble goes through different steps due to pinning at each peak of the pore. The details of the change in the curvature of the bubble passing a 0.4 mm roughness are shown in Figure 8. As shown in the detailed view of Figure 8a, the bubble has a convex curvature before its trailing edge reaches the peak of the roughness. As the bubble moves further into the pore, the bubble’s trailing edge and reaches the same elevation of the pore the roughness in Figure 8b, the bubble has a flat trailing edge due to the pinning of the phase. On breaking of the pinning, in Figure 8c the trailing edge curvature has become concave. As the bubble is not in contact with the valleys of the pore, the trailing edge becomes unstable, and the bubbles’ trailing edge moves to the next pore peak as shown in Figure 8d. The same deformation steps for the trailing edge were observed at each peak of the roughness. Similar interaction of the phase was observed in the case of a bubble moving through a pore with a roughness of 0.2 mm.
For the case of the flow in the sharp pore geometry shown in Figure 6IV, the bubble has a smooth transition in the pore geometry. Due to the lower gradient of the change in the available cross-sectional area of the pore geometry, the curvature of the leading and trailing edges has more variation. The bubble has the same trend of change in the leading and trailing edge. Pinning of the phase was observed after the bubble passes the pore throat as shown in location (g) of Figure 6IV.
4.2. Change in the Bubble’s Pressure and Velocity While Passing through Smooth Circular Pore
The instantaneous change of the absolute value of the radius of curvature of the leading and trailing edges of a bubble passing through a circular pore (geometry shown in Figure 4a) is represented in Figure 9a. The location of the bubble, symbolized by , is the normalized location of the centroid of the projected area () along the pore geometry by the width of the channel (). The location was also offset by the pore throat () so the location = 0 represents the condition when the bubbles centroid is aligned with the pore throat.
As indicated in Figure 9a the bubble has the same radius of curvature of the leading and trailing edge before it enters the pore geometry (. This condition is also shown in location (a) of Figure 6I. As the bubble enters the pore, indicated in location (b) in Figure 6I, the bubbles leading edge decreases due to the decrease in the available cross-sectional area. The minimum radius occurs at where the leading edge is aligned with the pore throat. The deformation of the leading edge continues until location (g) of Figure 6I when the bubbles leading edge passes through the pore geometry, and it regains its original radius of curvature for .
It can be seen that the deformation of the bubble’s trailing face occurs further into the pore ( compared to the leading edge. The bubbles trailing edge reaches its minimum value as it aligns with the pore throat (. At the radius increases to infinity and decreases to a constant value. The increase in the radius is caused by the pinning of the bubbles trailing edge before it exits the pore. In this condition, the bubbles trailing edge becomes flat and again regains its convex shape. After , the bubble detaches from the surface, and its radius of curvature of leading and trailing edge becomes equivalent.
The change in the pressure of the bubble at different locations along the pore was determined by the change in the radius of curvature shown in Figure 9a and Equation (1). The pressure is plotted as the ratio of the pressure and the interfacial tension that shows the pressure drop is only function of radii of the change in the trailing and the leading edge. In this study the has the unit of mm−1. As shown in Figure 9b, the pressure across the bubble was similar at the entrance and exit when the bubble is well away from the pore. As it enters the pore, the pressure across the bubble increases to a maximum value at (. This positive pressure is known as the critical pressure required for the bubble to enter the pore. This pressure is highly affected by the relative size of the dispersed phase and pore geometry, flow rate, and interfacial tension of the phases. In the current study, the bubble can pass this region in the pore as the driving force of the carrying fluid overcomes the introduced pressure and the phase can deform further to pass the pore geometry.
As the bubble passes the stages corresponding to the critical pressure, the pressure drop across the bubble decreases and it reaches a minimum value. This negative value of the pressure represents the direction of the pressure gradient across the bubble and corresponds to the high velocity observed when the bubble passes through the pore throat. The pinning of the phase at the exit of the pore results in another positive pressure. The introduced pressure due to the pinning of the bubble, in this case, is lower than the critical pressure at the entrance. The driving force also can again overcome this pressure and the bubble can exit the pore geometry.
The change in the pressure across the bubble results in a variation in the velocity of the of the projected area of the bubble () as depicted in Figure 9c. The bubble reaches the pore geometry with a constant velocity corresponding to its terminal velocity (). A slight decrease in the velocity is detected as the bubble gets closer to the pore geometry. The deceleration is caused by the development of the critical pressure needed to deform the bubble, allowing it to enter the pore. As the bubble passes this location it accelerates as it enters the pore throat. The introduced pinning pressure will result in a decrease of the velocity at the exit of the pore. The bubble accelerates as it detaches from the surface of the pore, returning to its terminal velocity.
4.3. Change in the Bubble’s Pressure and Velocity while Passing through Circular Pore with 0.2 mm Roughness
The variation in the radius of curvature, pressure, and velocity of a bubble passing through a circular pore with 0.2 mm roughness are shown in Figure 10. The leading edge experiences the same deformation as discussed for the smooth circular pore. The trailing edge, however, has a different set of deformation characteristics as the bubble’s centroid passes through the pore throat (y* > 0). The interaction of the moving interface of the bubble and the peak of the solid interface leads to pinning of the phase at different locations after the pore throat. The bubble interface shape changes at each peak of the pore roughness which results in an increase in the radius of curvature. These conditions are represented by the peaks detected in Figure 10a.
The effect of pinning of the phase in this pore geometry on the instantaneous change in the pressure of the bubble at different locations is shown in Figure 10b. The overall trend of the change in the pressure is similar to the circular pore discussed in the previous section. A similar critical pressure is detected in this case as shown for the smooth surface pore. The phase pinning of the bubble trailing edge at different locations along the pore results in multiple positive pressure peaks as the bubble passes the pore throat.
The velocity of the of the projected area of the bubble passing through the rough pore is shown in Figure 10c. The velocity of the bubble is constant before it reaches the pore and as it enters the pore, the bubble accelerates due to the decrease in the available area. The bubble decelerates as its centroid passes the pore throat as the area available for the flow increases. At each pinning location, there is an acceleration and deceleration of the bubble. In these locations, the bubble decelerates as the pinning occurs and it accelerates as it detaches from the surface. The acceleration occurs due to the instability between the roughness peaks which results in a rapid motion of the trailing edge toward the next peak of the surface roughness. These phenomena can be seen for all cases of pinning and motion of the bubble as it exits the pore.
4.4. Change in the Bubble’s Pressure and Velocity While Passing through Circular Pore with 0.4 mm Roughness
The effect of the pore roughness identified by the change in the radius of curvature of a bubble passing through a circular pore with 0.4 mm roughness is shown in Figure 11a. A similar trend of the change in the radius of curvature detected for the case of 0.2 mm roughness. The number of the detected peaks of the change in curvature is lower due to the lower number of the pore roughness objects. The variation of the radius is higher due to the stronger interaction of the bubble and solid interface. The bubble interface shape changes from convex to concave which results in discontinuities in the instantaneous change of the radius of curvature.
For clarity of the discussion, the details of the stages of the change in the curvature highlighted by the blue box in Figure 11a, are represented in Figure 12a. The bubble passes through the different stages of deformation and these stages are numbered and displayed in Figure 12b. The bubble has a convex trailing interface before the pinning of the phase. There is a slight increase in curvature of the trailing edge at location (1). This is due to the pinning of the bubble that occurs at this condition leading to a higher curvature for the bubble’s interface. As the bubble moves further into the pore, the bubble moves to the next peak of the pore roughness. The smaller cross-sectional area available for the bubble’s trailing edge in location (2) leads to a decrease in curvature of the bubble which can be seen by the local minimum at . The bubbles interface becomes a flat surface at location (3) which leads to at location 2.25 in Figure 11a and Figure 12a. The driving force of the continuous phase moves the bubble forward leading to the change in curvature of the bubble to be concave as shown in location (4). This phenomenon can be also observed at different locations along the pore geometry as shown in locations (6), (8), (10) and (12).
The effect of pinning of the phase in this pore geometry on the instantaneous change in the pressure of the bubble at different locations is shown in Figure 11b. The overall trend of the change in the pressure is similar to the circular pore discussed in the previous section. A similar critical pressure is detected in this case as shown for the smooth surface as the bubble enters the pore. The phase pinning pressure, however, is different in this condition due to the multiple locations of pinning in the flow passage. The pressure of the pinning occurs at different locations as the bubble passes the pore throat resulting in a region with a variation in the pressure drop. At the location where the pinning occurs, a series of peaks are detected. The lowest pressure difference across the bubble occurs when the bubble has the smallest value of curvature of the trailing edge at location (6) and the largest pressure is detected for the location of phase pinning at the pore throat having the smallest negative curvature of the bubble at location (8) as shown in Figure 12a.
The effect of the phase pinning on the velocity the projected area of a bubble passing through the rough pore can be seen in Figure 11c. As shown in the case of 0.2 mm of roughness, at each pinning location, there is an acceleration and deceleration of the bubble. In these locations, the bubble decelerates as the pinning occurs and it accelerates as it detaches from the surface. The number of the peaks in this case (0.4 mm) is less than the smaller roughness (0.2 mm) due to a lower number of peaks along the pore interface. The velocity of the bubble increases to 1.5 of its terminal velocity for both cases of the pore roughness (0.2 and 0.4 mm). The increase in the velocity of the bubble at each peak of the surface roughness is higher for the case of 0.4 mm. This is due to the stronger phase pinning phenomena at these locations. These phenomena can be seen for all cases of the pinning and the motion of the bubble as it passes through the pore.
4.5. Change in the Bubble’s Pressure and Velocity While Passing through a Sharp Pore
The variation in the radius of curvature of the leading and trailing edge of a bubble passing through a sharp pore is shown in Figure 13. The bubbles leading, and trailing edge have a similar trend as observed for the bubble flow in a circular pore. Only one phase pinning location can be observed as the bubble passes through the sharp geometry. Comparing the location of the pinning of the bubble in this case and the smooth round pore, shown in Figure 12a and Figure 13a, the pinning in the case of the sharp pore occurs further into the pore (y* ~ 4 for circular pore and y* ~ 3 for the sharp pore). This is due to the difference in the structure of the pore throat. In a sharp pore, the bubble detaches from the solid geometry right after it passes through the pore throat. For the case of the circular pore, however, the bubble is in contact with the pore further in the axial direction due to the gradual change in the pore geometry.
The critical pressure and the pinning pressure of the sharp pore can also be seen in the peaks shown in Figure 13b. The phase pinning pressure in this condition is slightly larger than the one detected for a circular pore. This is because the pinning in the sharp pore occurs closer to the pore throat where the available cross-sectional area is smaller compared to the phase pinning locations of other pore structures. The smaller gap between the pore results in more deformation and a higher-pressure gradient. The effect of the change in the pressure on the velocity is shown in Figure 13c. A lower acceleration is observed in this case due to the difference in the available cross-sectional area at different locations along the pore.
4.6. Bubble’s Transit Time in Different Pore Geometries
The variation of the transit time required for bubbles of different sizes passing through different pore geometries is represented in Figure 14. The transit time in this study is the measured time required for the bubble leading edge to enter the pore structure and the trailing edge to exit the pore structure determined from image analysis obtained using the optical setup. The overall trend of the change in the transit time at the same flow rate in the confined geometry is represented by the fitted line for each collected data set.
For all conditions, the bubble’s transit time increases linearly as the size of the bubble increases. This is due to the higher Volume of the larger bubbles which results in lower mobility of the bubble in the pore geometry. From the figure, the highest transit time corresponds to the motion of a bubble carried with a lower flow rate of the continuous phase. The lower flow rate provides a lower driving force for the bubble passage which leads to a slower bubble motion in the pore geometry.
Figure 14 also shows that there is a significant difference between the transit times of bubbles moving through different geometries. The transit time for the bubble flow in the sharp pore is mostly the highest among the tested pore geometries. The higher required time for the bubble passage through pore space in this condition is due to the difference between the decreases in the available cross-sectional area to the flow. In the sharp pore, the available cross-sectional area decreases at a smaller rate compared to the round pore. The higher available cross-sectional area for the flow for each stage along the pore results in lower acceleration of the bubble and slower motion of the phase in this geometry. The lower acceleration of the bubble’s velocity in the sharp pore can be observed by comparing the velocities reported in Figure 9 and Figure 13.
At the same flow rate, the lowest transit time occurs in the case of a bubble flow in the smooth circular surface. This condition occurs since the only resistance, in this case, arises due to the critical pressure at the entrance and the phase pinning at the exit of the pore geometry. The transit time increases as the roughness on the wall of the pore geometry increases. The increase in the transit time is due to the multiple phase pinning events that occur for the bubble passage after the pore throat. For the case of a bubble flow in the smooth circular pore, as shown in Figure 9, the bubble only pins on the exit of the channel and the reduction in the velocity occurs only in this location. For the bubble passing through the 0.4 mm roughness pore the pinning is a more severe result in the change in the direction of the curvature (concave to convex and vice versa). The change in the trailing interface results in more delay in the motion of the bubble.
5. Conclusions
The main goal of the current study was to determine the effect of pore geometry on the motion and mobilization of an isolated bubble passing through a pore. The effect of the pore structure was studied by the tracking of bubble deformation, pressure, the velocity of the of the projected area, and the required transit time for the phase passage. Four different pore geometries of a circular with a smooth surface, circular with 0.2 mm and 0.4 mm roughness, and a sharp pore were considered for this study. The evidence from this study suggests that the motion of the bubble passing through a pore space is highly affected by the geometry of the pore solid interface.
Investigation of the deformation of the bubble has shown that the different pore structures considered in this study all have a similar effect on the leading edge. However, significant differences were observed for the deformation of the bubble’s trailing edge. For the smooth circular pore structure and sharp pore, only one phase pinning event was observed before the bubble detached from the pore surface. For a bubble passing through a rough pore, the bubble has many pinning events for each peak of the roughness after the pore throat. The number of pinning events increases by the number of roughness structures on the pore surface. The strength of the interaction also increases by the height of each peak of the pore roughness.
The results of the pressure change across the bubble showed that in addition to the critical pressure introduced by the entrance of the pore, a phase pinning pressure is also introduced during the phase passage in the pore. For all cases, a similar critical pressure at the entrance was observed. The pinning pressure was highly affected by the properties of the pore structure. The change in the pressure due to phase pinning was observed with a higher number of peaks and a wider range of pressure effects for pores having a rough surface structure. The applied pinning pressure at each pore roughness resulted in the positive pressure difference along the bubble and ultimately, deceleration of the phase motion.
This study has found that generally, the transit time of the bubble through the pore structure increases with an increase in the pore surface roughness and the size of the dispersed phase. A shorter transit time was observed for the case of the smooth pore due to the minor effect of the phase pinning at the exit of the pore. Phase pinning in the rough structures leads to the delayed passage of the bubble in these pore geometries.
This research extends our knowledge of the pore-scale interactions of pore structure and multi-phase flow on the mobilization of the pore. The values obtained for the pressure in this study is unique due to the presence of the confined walls of the flow channel. The results of the trend of the change in the pressure in this research support the bulk flow studies that a higher driving force is required for the mobilization of a trapped phase in a rough and unstructured pore geometries. The findings from this study suggest that the critical pressure for mobilization of trapped isolated phase in a pore geometry can be predicted by the study of the motion of an individual isolated phase. The current study was also able to detect the phase pinning introduced pressure which results in the delayed passage of multi-phase flows in the pore structure.
Author Contributions
Conceptualization, S.A. and D.S.N.; methodology, S.A.; software, S.A.; validation, S.A. and D.S.N.; formal analysis, S.A. and D.S.N.; investigation, S.A.; resources, S.A.; data curation, S.A.; writing—original draft preparation, S.A.; writing—review and editing, S.A. and D.S.N.; visualization, S.A.; supervision, S.A. and D.S.N.; project administration, D.S.N.; funding acquisition, D.S.N. All authors have read and agreed to the published version of the manuscript.
Funding
This research was funded from Natural Sciences and Engineering Research Council (NSERC) of Canada, the Alberta Innovates and the Canadian Foundation for Innovation (CFI).
Institutional Review Board Statement
Not applicable.
Informed Consent Statement
Not applicable.
Data Availability Statement
The data presented in this study are available on request from the corresponding author.
Conflicts of Interest
The authors declare no conflict of interest.
References
- Huang, J.S.; Varadaraj, R. Colloid and interface science in the oil industry. Curr. Opin. Colloid Interface Sci. 1996, 1, 535–539. [Google Scholar] [CrossRef]
- Soottitantawat, A.; Bigeard, F.; Yoshii, H.; Furuta, T.; Ohkawara, M.; Linko, P. Influence of emulsion and powder size on the stability of encapsulated D-limonene by spray drying. Innov. Food Sci. Emerg. Technol. 2005, 6, 107–114. [Google Scholar] [CrossRef]
- Nakano, M. Places of emulsions in drug delivery. Adv. Drug Deliv. Rev. 2000, 45, 1–4. [Google Scholar] [CrossRef]
- Chatzis, I.; Morrow, N.R.; Lim, H.T. Magnitude and Detailed Structure of Residual Oil Saturation. Soc. Pet. Eng. J. 1983, 23, 311–326. [Google Scholar] [CrossRef]
- Geistlinger, H.; Zulfiqar, B. The Impact of Wettability and Surface Roughness on Fluid Displacement and Capillary Trapping in 2-D and 3-D Porous Media: 1. Wettability-Controlled Phase Transition of Trapping Efficiency in Glass Beads Packs. Water Resour. Res. 2020, 56, e2019WR026826. [Google Scholar] [CrossRef]
- Geistlinger, H.; Ataei-Dadavi, I.; Mohammadian, S.; Vogel, H.J. The impact of pore structure and surface roughness on capillary trapping for 2-D and 3-D porous media: Comparison with percolation theory. Water Resour. Res. 2015, 51, 9094–9111. [Google Scholar] [CrossRef]
- Johnson, P.C.; Johnson, R.L.; Bruce, C.L.; Leeson, A. Advances in in situ air sparging/biosparging. Bioremediat. J. 2001, 5, 251–266. [Google Scholar] [CrossRef]
- Mohammadian, S.; Geistlinger, H.; Vogel, H.J. Quantification of Gas-Phase Trapping within the Capillary Fringe Using Computed Microtomography. Vadose Zone J. 2015, 14, 1–9. [Google Scholar] [CrossRef]
- Wildenschild, D.; Sheppard, A.P. X-ray imaging and analysis techniques for quantifying pore-scale structure and processes in subsurface porous medium systems. Adv. Water Resour. 2013, 51, 217–246. [Google Scholar] [CrossRef]
- Anbari, A.; Chien, H.T.; Datta, S.S.; Deng, W.; Weitz, D.A.; Fan, J. Microfluidic Model Porous Media: Fabrication and Applications. Small 2018, 14, 1703575. [Google Scholar] [CrossRef]
- Zhang, Z.; Li, L.; Xie, W.; Wang, H. Experimental study of bubble formation process on the micro-orifice in mini channels. Exp. Therm. Fluid Sci. 2020, 117, 110144. [Google Scholar] [CrossRef]
- Hu, R.; Lan, T.; Wei, G.J.; Chen, Y.F. Phase diagram of quasi-static immiscible displacement in disordered porous media. J. Fluid Mech. 2019, 875, 448–475. [Google Scholar] [CrossRef]
- Cha, L.; Xie, C.; Feng, Q.; Balhoff, M. Geometric criteria for the snap-off of a non-wetting droplet in pore-throat channels with rectangular cross-sections. Water Resour. Res. 2021, 57, e2020WR029476. [Google Scholar] [CrossRef]
- Zou, A. Effects of Grain-Size Distribution and Hysteresis on Soil-Water Characteristic Curve (SWCC). Ph.D. Thesis, Nanyang Technological University, Singapore, 2018. [Google Scholar]
- Chen, H.; Yang, M.; Chen, K.; Zhang, C. Relative Permeability of Porous Media with Nonuniform Pores. Geofluids 2020, 2020, 5705424. [Google Scholar] [CrossRef] [Green Version]
- Molnar, I.L.; Gerhard, J.I.; Willson, C.S.; O’Carroll, D.M. Wettability Effects on Primary Drainage Mechanisms and NAPL Distribution: A Pore-Scale Study. Water Resour. Res. 2020, 56, e2019WR025381. [Google Scholar] [CrossRef] [Green Version]
- Mehmani, A.; Kelly, S.; Torres-Verdín, C.; Balhoff, M. Capillary Trapping Following Imbibition in Porous Media: Microfluidic Quantification of the Impact of Pore-Scale Surface Roughness. Water Resour. Res. 2019, 55, 9905–9925. [Google Scholar] [CrossRef]
- Qiao, Z.; Wang, Z.; Zhang, C.; Yuan, S.; Zhu, Y.; Wang, J. PVAm–PIP/PS composite membrane with high performance for CO2/N2 separation. AIChE J. 2012, 59, 215–228. [Google Scholar] [CrossRef]
- Jiang, H.; Guo, B.; Brusseau, M.L. Characterization of the micro-scale surface roughness effect on immiscible fluids and interfacial areas in porous media using the measurements of interfacial partitioning tracer tests. Adv. Water Resour. 2020, 146, 103789. [Google Scholar] [CrossRef]
- Khishvand, M.; Akbarabadi, M.; Piri, M. Micro-scale experimental investigation of the effect of flow rate on trapping in sandstone and carbonate rock samples. Adv. Water Resour. 2016, 94, 379–399. [Google Scholar] [CrossRef]
- Askari, R.; Taheri, S.; Hejazi, S.H. Thermal conductivity of granular porous media: A pore scale modeling approach. AIP Adv. 2015, 5, 097106. [Google Scholar] [CrossRef]
- Yu, L.; Sang, Q.; Dong, M.; Yuan, Y. Effects of interfacial tension and droplet size on the plugging performance of oil-in-water emulsions in porous media. Ind. Eng. Chem. Res. 2017, 56, 329237–329246. [Google Scholar] [CrossRef]
- Ansari, S.; Sabbagh, R.; Yusuf, Y.; Nobes, D.S. The role of emulsions in steam-assisted-gravity-drainage (SAGD) oil-production process: A review. SPE J. 2019, 25, 969–989. [Google Scholar] [CrossRef]
- Amani, P.; Suzanne, H.; Victor, R.; Firouzi, M. Comparison of flow dynamics of air-water flows with foam flows in vertical pipes. Exp. Therm. Fluid Sci. 2020, 119, 110216. [Google Scholar] [CrossRef]
- Ezeuko, C.; Wang, J.; Gates, I. Investigation of emulsion flow in SAGD and ES-SAGD. In Proceedings of the SPE Heavy Oil Conference, Calgary, AL, Canada, 12–14 June 2012; pp. 1–16. [Google Scholar]
- Smith, W.O.; Crane, M.D. The Jamin effect in cylindrical tubes. J. Am. Chem. Soc. 1930, 52, 1345–1349. [Google Scholar] [CrossRef]
- Seo, J.H.; Lele, S.K.; Tryggvason, G. Investigation, and modeling of bubble-bubble interaction effect in homogeneous bubbly flows. Phys. Fluids 2010, 22, 063302. [Google Scholar] [CrossRef]
- Patel, T.; Patel, D.; Thakkar, N.; Lakdawala, A. A numerical study on bubble dynamics in sinusoidal channels. Phys. Fluids 2019, 31, 052103. [Google Scholar] [CrossRef]
- Benet, E.; Vernerey, F.J. Mechanics and stability of vesicles and droplets in confined spaces. Phys. Rev. E 2016, 94, 062613. [Google Scholar] [CrossRef] [Green Version]
- Kim, S.H.; Hyun, S.P.; Donggun, K.; Kim, M.H. Wetting characteristic of bubble on micro-pillar structured surface under a water pool. Exp. Therm. Fluid Sci. 2019, 100, 135–143. [Google Scholar] [CrossRef]
- Vasiljevic, D.; Parojcic, J.; Primorac, M.; Vuleta, G. An investigation into the characteristics and drug release properties of multiple W/O/W emulsion systems containing low concentration of lipophilic polymeric emulsifier. Int. J. Pharm. 2006, 309, 171–177. [Google Scholar] [CrossRef]
- Mittal, K.L. Particles on Surfaces 1: Detection, Adhesion, and Removal; Plenum Press: New York, NY, USA, 1988. [Google Scholar]
- Ansari, S.; Yusuf, Y.; Sabbagh, R.; Soltani, H.; Kinsale, L.; Nobes, D.S. An imaging derivation of the pressure field of a multi-phase flow in a porous media using µ-SPIV. In Proceedings of the 19th International Symposium on the Application of Laser and Imaging Techniques to Fluid Mechanics, Lisbon, Portugal, 16–19 July 2018. [Google Scholar]
- Gkotsis, P.K.; Evgenidis, S.P.; Karapantsios, T.D. Influence of Newtonian and non-Newtonian fluid behaviour on void fraction and bubble size for a gas-liquid flow of sub-millimeter bubbles at low void fractions. Exp. Therm. Fluid Sci. 2019, 109, 109912. [Google Scholar] [CrossRef]
- Sattari, A.; Tasnim, N.; Hanafizadeh, P.; Hoorfar, M. Motion and deformation of migrating compound droplets in shear-thinning fluids in a microcapillary tube. Phys. Fluids 2021, 33, 053106. [Google Scholar] [CrossRef]
- Tian, Z.; Youwei, C.; Xi, L.; Lijun, W. Bubble shape and rising velocity in viscous liquids at high temperature and pressure. Exp. Therm. Fluid Sci. 2019, 102, 528–538. [Google Scholar] [CrossRef]
- Jamshidi, N.; Mostoufi, N. Investigating bubble dynamics in a bubble column containing shear thinning liquid using a dual-tip probe. Exp. Therm. Fluid Sci. 2018, 94, 34–48. [Google Scholar] [CrossRef]
- Javadpour, F. Bubble breakup in porous media. J. Can. Pet. Technol. 2007, 46, 26–32. [Google Scholar] [CrossRef]
- Azadi, R.; Nobes, D.S. On the three-dimensional features of a confined slug bubble in a flowing square capillary. Phys. Fluids 2021, 33, 033327. [Google Scholar] [CrossRef]
- Ansari, S.; Nobes, D.S. Interaction of loosely packed bubbly flow passing through a pore space. J. Vis. 2020, 23, 649–660. [Google Scholar] [CrossRef]
- Ansari, S.; Yusuf, Y.; Sabbagh, R.; Nobes, D.S. Determining the pressure distribution of a multi-phase flow through a pore space using velocity measurement and shape analysis. Meas. Sci. Technol. 2019, 30, 054004. [Google Scholar] [CrossRef]
- Soltani, H.; Sabbagh, R.; Nobes, D.S. The passage of bubbles rising through a confining rectangular geometry. Phys. Fluids 2018, 10, 103302. [Google Scholar] [CrossRef]
- Jin, B.J.; Kim, Y.W.; Lee, Y.; Yoo, J.Y. Droplet merging in a straight microchannel using droplet size or viscosity difference. J. Micromech. Microeng. 2010, 20, 035003. [Google Scholar] [CrossRef]
- Wang, M.; Hung, Y.L.; Lin, F.H.; Lin, S.Y. Dynamic behaviors of droplet impact and spreading: A universal relationship study of dimensionless wetting diameter and droplet height. Exp. Therm. Fluid Sci. 2009, 33, 1112–1118. [Google Scholar] [CrossRef]
- Sarioglu, A.F.; Aceto, N.; Kojic, N. A microfluidic device for label-free, physical capture of circulating tumor cell clusters. Nat. Methods 2015, 12, 685–691. [Google Scholar] [CrossRef]
- Preira, P.; Grandne, V.; Forel, J.-M.; Gabriele, S.; Camara, M.; Theodoly, O. Passive circulating cell sorting by deformability using a microfluidic gradual filter. Lab Chip 2013, 13, 161–170. [Google Scholar] [CrossRef]
- Mugele, F. On the shape of a droplet in a wedge: New insight from electrowetting. Soft Matter 2015, 11, 7717–7721. [Google Scholar]
- Mohamed, H.; Murray, M.; Turner, J.N.; Caggana, M. Isolation of tumor cells using size and deformation. J. Chromatogr. A 2009, 1216, 8289–8295. [Google Scholar] [CrossRef]
- Ansari, S.; Nobes, D.S. The effect of three-phase contact line pinning during the passage of an isolated bubble through a confining pore. Phys. Fluids 2021, 33, 053310. [Google Scholar] [CrossRef]
- Benet, E.; Badran, A.; Pellegrino, J.; Vernerey, F. The porous media’s effect on the permeation of elastic (soft) particles. J. Membr. Sci. 2017, 535, 10–19. [Google Scholar] [CrossRef]
- Ansari, S.; Sabbagh, R.; Soltani, H.; Nobes, D.S. Flow visualization of a bubble penetration through porous media in SAGD process using µSPIV. In Proceedings of the 5th International Conference on Experimental Fluid Mechanics—ICEFM, Munich, Germany, 2–4 July 2018. [Google Scholar]
- Jamin, M.J. Memoire sur l’equilibre et les mouvements de liquides dans corps poreux. Compt. Rend. Acad. Sci. 1860, 50, 172–176. [Google Scholar]
- Ansari, S. Experimental Study of the Geometric Characteristics of Bubbles/Droplets Passing through a Pore Space. Ph.D. Thesis, University of Alberta, Edmonton, AL, Canada, 2021. [Google Scholar]
- Raffel, J.; Ansari, S.; Nobes, D.S. An Experimental Investigation of Flow Phenomena in a Multistage Micro-Tesla Valve. J. Fluids Eng. 2021, 11, 111205. [Google Scholar] [CrossRef]
- Ansari, S. Newtonian and Non-Newtonian Flows through Mini-Channels and Micro-Scale Orifices for SAGD Applications. Master’s Thesis, University of Alberta, Edmonton, AL, Canada, 2016. [Google Scholar]
- Ansari, S.; Rashid, M.A.I.; Waghmare, P.R.; Ma, Y.; Nobes, D. Newtonian, and non-Newtonian flows through micro scale orifices. In Proceedings of the 10th Pacific Symposium on Flow Visualization and Image Processing, Naples, Italy, 15–18 June 2015. [Google Scholar]
- Sahasrabudhe, S.N.; Rodriguez-Martinez, V.; O’Meara, M.; Farkas, B.E. Density, viscosity, and surface tension of five vegetable oils at elevated temperatures: Measurement and modeling. Int. J. Food Prop. 2017, 20, 1965–1981. [Google Scholar] [CrossRef] [Green Version]
- Segur, J.B.; Oderstar, H.E. Viscosity of glycerol and its aqueous solutions. Ind. Eng. Chem. 1951, 43, 2117–2120. [Google Scholar] [CrossRef]
- Azadi, R.; Wong, J.; Nobes, D.S. Experimental and analytical investigation of meso-scale slug bubble dynamics in a square capillary channel. Phys. Fluids 2020, 32, 083304. [Google Scholar] [CrossRef]
Figure 1.
(a) Schematic of bubble deformation and (b) an example of the determined pressure difference across an isolated bubble passing through a pore and its corresponding locations.
Figure 1.
(a) Schematic of bubble deformation and (b) an example of the determined pressure difference across an isolated bubble passing through a pore and its corresponding locations.

Figure 2.
A picture of the experimental setup showing the main components.

Figure 3.
Design of flow channels containing different shapes of pore space (a) circular pore (b) circular pore with 0.2 mm surface roughness, (c) circular pore with 0.4 mm surface roughness, and (d) pore with a sharp corner. In the current study, w = 1 mm and = 2 mm.
Figure 3.
Design of flow channels containing different shapes of pore space (a) circular pore (b) circular pore with 0.2 mm surface roughness, (c) circular pore with 0.4 mm surface roughness, and (d) pore with a sharp corner. In the current study, w = 1 mm and = 2 mm.

Figure 4.
Picture of the manufactured pore and designed geometry (a) smooth circular pore, (b) sharp pore, (c) circular pore with 0.2 mm roughness, and (d) circular pore with 0.4 mm roughness (all dimensions are in mm).
Figure 4.
Picture of the manufactured pore and designed geometry (a) smooth circular pore, (b) sharp pore, (c) circular pore with 0.2 mm roughness, and (d) circular pore with 0.4 mm roughness (all dimensions are in mm).

Figure 5.
An example of (a) a raw image, (b) the isolated dispersed phase, and (c) processed image defining the leading and trailing geometry.
Figure 5.
An example of (a) a raw image, (b) the isolated dispersed phase, and (c) processed image defining the leading and trailing geometry.

Figure 6.
Bubble passing through (I) circular pore (II) circular pore with 0.2 mm surface roughness, (III) circular pore with 0.4 mm surface roughness, and (IV) pore with a sharp corner.
Figure 6.
Bubble passing through (I) circular pore (II) circular pore with 0.2 mm surface roughness, (III) circular pore with 0.4 mm surface roughness, and (IV) pore with a sharp corner.

Figure 7.
Pinning of a bubble existing a smooth pore interface at (a) 0.1 mL/min and (b) 0.3 mL/min.
Figure 7.
Pinning of a bubble existing a smooth pore interface at (a) 0.1 mL/min and (b) 0.3 mL/min.

Figure 8.
Phase pinning of a bubble. (~1.95 mm) at different stages passing through a rough pore space having (a) convex, (b) flat, (c) concave, and (d) flat trailing edge.
Figure 8.
Phase pinning of a bubble. (~1.95 mm) at different stages passing through a rough pore space having (a) convex, (b) flat, (c) concave, and (d) flat trailing edge.

Figure 9.
Plots of (a) change in the radii of curvature of leading and trailing edge of a bubble, (b) pressure along the bubble, and (c) velocity of the centroid of the projected area of a bubble (1.95 mm) passing through a smooth circular pore surface. (Sample images of different conditions are shown in Figure 6I).

Figure 10.
Plots of (a) change in the radii of curvature of leading and trailing edge of a bubble, (b) pressure along the bubble, and (c) velocity of the centroid of a bubble (1.95 mm) passing through a circular pore with 0.2 mm roughness on the surface (Sample images of different conditions are shown in Figure 6II).

Figure 11.
Plots of (a) change in the radii of curvature of leading and trailing edge of a bubble, (b) pressure along the bubble, and (c) velocity of the of the projected area of a bubble (1.95 mm) passing through a circular pore with 0.4 mm roughness on the surface (Sample images of different conditions are shown in Figure 6III).

Figure 12.
(a) zoomed-in condition represented in Figure 10a and (b) stages of bubble pinning in a pore.
Figure 12.
(a) zoomed-in condition represented in Figure 10a and (b) stages of bubble pinning in a pore.

Figure 13.
Plots of (a) change in the radii of curvature of leading and trailing edge of a bubble, (b) pressure along the bubble, and (c) velocity of the projected area of a bubble (1.95 mm) passing through a sharp pore (Sample images of different conditions are shown in Figure 6IV).
Figure 13.
Plots of (a) change in the radii of curvature of leading and trailing edge of a bubble, (b) pressure along the bubble, and (c) velocity of the projected area of a bubble (1.95 mm) passing through a sharp pore (Sample images of different conditions are shown in Figure 6IV).

Figure 14.
Plots of change in the transit time of bubble at different flow rates, size, and pore geometry.The flowrates are color-coded where black, red and blue corresponds to 0.1, 0.2 and 0.3 mm/min, respectively.
Figure 14.
Plots of change in the transit time of bubble at different flow rates, size, and pore geometry.The flowrates are color-coded where black, red and blue corresponds to 0.1, 0.2 and 0.3 mm/min, respectively.

Publisher’s Note: MDPI stays neutral with regard to jurisdictional claims in published maps and institutional affiliations. |
© 2022 by the authors. Licensee MDPI, Basel, Switzerland. This article is an open access article distributed under the terms and conditions of the Creative Commons Attribution (CC BY) license (https://creativecommons.org/licenses/by/4.0/).
Share and Cite
MDPI and ACS Style
Ansari, S.; Nobes, D.S. Effect of the Pore Geometry on the Driving Pressure across a Bubble Penetrating a Single Pore. Fluids 2022, 7, 333. https://0-doi-org.brum.beds.ac.uk/10.3390/fluids7100333
AMA Style
Ansari S, Nobes DS. Effect of the Pore Geometry on the Driving Pressure across a Bubble Penetrating a Single Pore. Fluids. 2022; 7(10):333. https://0-doi-org.brum.beds.ac.uk/10.3390/fluids7100333
Chicago/Turabian StyleAnsari, Shadi, and David S. Nobes. 2022. "Effect of the Pore Geometry on the Driving Pressure across a Bubble Penetrating a Single Pore" Fluids 7, no. 10: 333. https://0-doi-org.brum.beds.ac.uk/10.3390/fluids7100333