1. Introduction
In recent years, the share of unconventional oil resources brought into development by oil producing companies has been growing. In Russia, oil fields with different oil properties and reservoir geophysics are being developed. Both low-viscosity and high-viscosity oil occurs, mainly belonging to three oil and gas provinces: Volga-Ural, West Siberia and Timan-Pechora. Given the fact that most of the low-viscosity oil fields tend to enter the last stages of development, for the Russian and global oil industry the viscous and high-viscosity oil resources are viewed not only as a production reserve but also as the mainstream of the fuel and energy development for the upcoming years [
1,
2,
3].
This oil industry development trend outlines the problem of increasing the effectiveness of oil recovery enhancement technologies as a very critical matter. Based on field experience, many papers identify thermal treatment that heats formation fluids and causes reduction in oil viscosity as the most efficient physical method. These methods involve the following technologies: injection of hot water into the formation to displace hydrocarbons, thermal steam formation treatment, in situ combustion and cyclic steam stimulation of the near-wellbore area [
4,
5]. These approaches impact high-viscosity oil reserves and result in increased velocity of flow to the bottomhole. The cyclic steam stimulation (CSS) technology is worth a special focus in comprehensive studies since the capital and operational costs of its implementation and deployment are several times lower compared to other thermal technologies for enhanced oil recovery in the case of high-viscosity oil.
The main mechanisms of action in the application of CSS technology are: a decrease in oil viscosity, thermal expansion of rocks and fluids, and steam distillation of oil (evaporation of light oil fractions in a high temperature zone, followed by their condensation in a low temperature zone). The mechanism of the processes occurring in the reservoir is rather complex and is accompanied by the same phenomena as the displacement of oil by steam, but additionally there is countercurrent capillary filtration, redistribution of oil and water (condensate) in a microheterogeneous medium during holding without withdrawing fluid from the well.
Steam penetrates into the most permeable layers and large pores of the formation. During holding in the heated zone of the formation, an active redistribution of saturation occurs due to capillary forces. Hot condensate displaces and replaces low-viscosity oil from small pores and low-permeability layers into large pores and high-permeability layers, i.e., they change places. This redistribution of the reservoir saturation with oil and condensate is the physical basis of the process of oil recovery using technology. Without capillary exchange of oil and condensate, the effect of cyclic steam action would be minimal and would be exhausted during the first cycle.
The technology consists of three consecutive stages that form a subsequently repeated cycle. The first stage is injection, during which the steam is introduced into the near-wellbore area. As long as the steam is injected, the rock at the bottomhole and the fluids saturating the rock are being heated. Further, the steam condenses, giving up heat to the near-wellbore area (second stage). After the second stage, the production phase begins. First, the condensed water is produced and then the heated oil is recovered as the near-wellbore area cools down since part of the heat is given up to the hydrocarbons filtration flow from the formation far-field area.
First, steam is injected into the formation through a production well for a certain period of time. Then the well is stopped for impregnation. During this process, the migration of steam to the top of the formation is completed with the formation of a steam chamber, condensation of steam in the near-wellbore zone of the formation with the transfer of heat to the formation fluids. As a result, the oil heats up and its viscosity decreases; the heated oil also flows into the bottom zone of the formation, where oil is taken out at the stage of production. Capillary forces exert a certain influence on production, the significance of which increases with decreasing oil viscosity. After a certain time, the well is started up and production resumes. During operation, as the heated zone of the formation cools down, the flow rate of the well decreases. This process is one cycle and will be repeated until the marginal rate of return.
The main advantages of the CSS technology:
The process of dispersing the injection of the coolant into the reservoir is accelerated. As a result, the rate of heat exposure and the thermal efficiency of the process increase.
The productive performance of producing wells is increasing. This leads to the intensification of oil production and an increase in the rate of production of oil reserves.
Coverage of the collector by thermal influences is increased.
Conditions are created for the use of sparser well patterns. This leads to a significant decrease in capital investment.
The published theoretical and experimental studies of the heat carrying medium impact on the near-wellbore area indicate the potential for increasing the coverage of the commercial technology introduction to production wells of many high-viscosity oil fields [
6,
7]. However, the problem of determining the CSS technology effectiveness has not been solved in its entirety [
8,
9]. In terms of process physics, the design of the technology in question shall include calculations of the radius and reservoir heating time as well as the time of further cooling during oil production and the change in produced oil rheological properties during flow through a reservoir with variable rock temperature.
A modern scientific approach in EOR technology design implies evaluation of the effectiveness of planned operations using hydrodynamic simulators. However, in the case of CSS simulation, the software product shall allow for the calculation of changes in thermal properties of fluids and rocks as well as the solution of heat and mass transfer equations [
10,
11,
12]. This functionality is implemented only in some software products, such as the CMG STARS reservoir simulator, which results from the lack of such functionality with most oil producing companies [
13]. On these grounds, an approach to evaluate the CSS effectiveness in a short time frame and without the necessity to use specialized reservoir simulators has been developed.
In this work, the following goals were achieved: (1) laboratory and numerical studies were carried out to assess the effectiveness of the CSS technology application in the bottomhole zone of the well; (2) a method is proposed for determining the optimal technological parameters of cyclic steam treatment for the Nozhovskaya group of fields.
2. Materials and Methods
The heat injected into the formation with the steam is used to heat the rock matrix and fluids saturating the formation. The heat transferred to the rock matrix during the initial process stages in the near-wellbore area is used in the main cycle to reduce oil viscosity and to increase its mobility in the last stage of the treatment cycle. Therefore, reducing viscosity is one of the baseline mechanisms for increasing well flow rate.
To determine the key process parameters and CSS effectiveness in the near-wellbore area, the following problems shall be solved. Firstly, the heat carrying medium (steam) injection period shall be calculated, and the effective size of the area covered by the thermal effect shall be determined. Secondly, the thermal-steam soak problem shall be solved, i.e., the rate of steam condensation and oil flow from the ‘cold’ reservoir area into the heated area, shall be predicted. Finally, calculated shall be the degree of well productivity increase due to heated oil in the near-wellbore area and the law of production rate decline as the near-wellbore area is being cooled down by the formation oil flow.
Let us describe the problem algorithm. As the first step, let’s determine the maximum radius of formation heating
, as follows (Equation (1)):
where
Q-coolant injection rate,
-steam density,
-steam heat capacity factor,
-latent heat of vaporisation,
-heat carrier temperature in formation conditions,
-formation temperature,
-well radius and
-heat transfer coefficient.
As it is known from the non-isothermal flow theory, the heat flow rate is constant in the linear case, and proportional to the square of radius in the radial case. With this in view, the time of coolant injection until the steady-state temperature distribution is formed can be determined, then the heat carrier injection becomes ineffective (Equation (2)) [
14]:
where
h-reservoir thickness,
-the ratio of the steam heat content to the saturated porous medium and
m-porosity.
Condensation leads to absorption of oil from the ‘cold’ reservoir strata, i.e., the radius of the steam plateau decreases with time. Heat transfer, condensation and oil absorption are assumed to be equilibrium processes. In this case, pressure and temperature in the area of the steam plateau do not change, i.e., the steam condensation leads to instantaneous oil absorption, at which pressure and temperature in the area are momentarily equalized and compensated by oil inflow from the cold part of the formation. Based on this, let’s determine steam condensation and saturation time (Equation (3)):
Steam condensation during the soak phase is caused by heat loss from the ‘steam plateau’ area and is also accompanied by heating of ‘cold’ oil coming from the area not covered by thermal effect. In linear approximation, formation temperature during fluid flow propagates in the form of temperature waves from to . Thus, the replacement of steam by heated oil results in filling the area closest to the well with oil at temperature.
Fluid flow into the well with zonal temperature change is similar to the expression for Dupuit’s formula with zonal heterogeneity since the formation temperature determines the viscosity of the flowing fluid (Equation (4)):
where
-oil viscosity at reservoir temperature,
-oil viscosity at temperature equal to heat carrier temperature,
-reservoir permeability,
-radius of well drainage area,
-reservoir thickness,
-drawdown in near-wellbore area,
-oil heat content factor and
-saturated porous rock heat content factor, while variable
denotes the radius of heating and is determined by Equation (5):
The system of these equations defining the flow rate and the heating radius leads to an evolution equation for determining the drop in fluid flow rate over time due to near-wellbore cooling, which takes the following form (Equation (6)):
Expression (6) is transcendental and was solved by Newton’s method.
To determine the well flow-rate growth factor in the simplified version, the basic well flow rate is calculated from the Dupuit’s formula (Equation (7)):
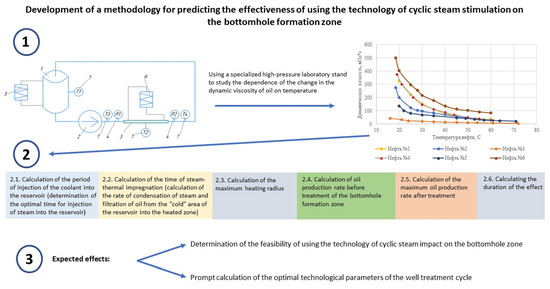
For a more accurate determination of parameters characterizing the steam treatment process, it is proposed to use experimental data on determining the dependency of dynamic viscosity on temperature, obtained on a custom-designed high-pressure hydraulic circuit. This hydraulic circuit was designed by scientists from the Perm national research polytechnic university.
Figure 1 shows a process flow diagram of the high-pressure hydraulic circuit, which consists of a feedstock tank 1, a circulation pump 2, a test section 3, high-precision pressure sensors at the inlet and outlet of section 4, specified temperature maintenance systems for pumped flow 5 and inside wall surface of test section 6, and digital thermometers 7.
The hydraulic circuit allows to record the following characteristics over time: the pressure drop between the inlet and outlet of the test section, the density of the tested fluid, the volumetric flow rate, and the temperature. These data are used to determine the dynamic viscosity of the fluid under study from the Poiseuille equation (Equation (8)):
where
-pressure drop in the test section, mPa·s;
Q-volumetric fluid flow rate, m
3/s;
-length of the test section, m; and
-diameter of the test section, m.
The object of the study was the Upper Devonian-Tournaisian carbonate oil and gas complex, represented by the oil-bearing stratum T. Massive, stratal-massive deposits. The reservoirs are represented by organogenic, porous-cavernous and fractured limestones. The net pay thickness varies from 0.8 m to 19.5 m. The porosity ranges from 12% to 18%; the average permeability is 0.126 mkm2. According to the technological schemes of field development, the dense varieties of limestones of the Tournaisian stage and mudstones of the Radaevsky horizon serve as covers of oil deposits. The oil is very heavy in density, highly viscous, highly resinous, paraffinic and high-sulfur.
Therefore, a series of experiments has been conducted for six oil samples from different oil reservoirs of the Nozhovskaya oilfield group in Perm Krai (Russian Federation) at different temperatures, and dependencies have been further obtained based on the calculations using Equation (7). The resulting curves are shown in
Figure 2.
3. Results
For comparative calculations of the near-wellbore CSS technology effectiveness in the oil viscosity range under study as shown in
Figure 1, the required input data for the reservoir and heat carrier properties were set to the same values, as given in
Table 1 and
Table 2.
Using the input data in
Table 1 and
Table 2, the steam injection time, steam condensation time, maximum bottomhole heating radius, oil flow rate before treatment and initial oil flow rate (maximum value) after heating have been calculated. In the case study, the injection time, condensation time and maximum heating radius are determined only by reservoir and heat carrier properties; therefore, these properties are identical for each oil. The calculations of well flow rates are based on the dynamic oil viscosity data obtained from laboratory studies. The calculations results are shown in
Table 3.
The results of the case study given in
Table 3 show the cyclic steam stimulation technology effectiveness for all of the oils under study in a wide range of their viscosities since, according to the calculations, the oil flow-rate growth factor after heating in all cases approaches 2. However, to define the technology applicability limits, the effect duration shall be estimated and a comparative analysis of the volumes of incremental oil production shall be conducted.
Figure 3 shows the results of well flow rate versus time calculations, factoring in the cooling of the previously heated near-wellbore area. The graph with the calculations results for oil №. 3 is plotted separately since the estimated cooling time is much less than that for other oils.
As seen from the results obtained for the oil with the lowest viscosity (oil № 3), the highest flow rates are observed before and after the steam stimulation, yet this, in turn, results in the rapid cooling and flow rate reduction to the initial rate. Rather high flow rates for low-viscosity oil are explained by the fact that the same reservoir properties were used for all calculations, aiming to determine the limits of applicability of the near-wellbore cyclic steam simulation technology by correlation dependency of the oil dynamic viscosity on temperature. For oil samples with the highest viscosity at reservoir temperature, the lowest flow rates are observed. However, for more viscous oil, the processes of oil cooling and, consequently, increase in viscosity occur more slowly, which in turn means maintenance of the increased flow rate for a longer period of time.
To determine the CSS applicability, it is proposed to compare the results of cumulative oil production calculations without this technology (base case) and after the technology deployment.
Table 4 shows the results of comparative calculations of cumulative production for the oils under study as illustrated by the case study with identical reservoir parameters per year of operation. These calculations factored in well downtime due to cyclic bottomhole treatments.
The comparative analysis shows that for the five wells under study, the cumulative oil production after the treatment is on average 1.35 times greater than the base value, against the 2.0 exceedance when comparing the flow rate before the treatment against the maximum flow rate immediately after the heating. The results of numerical simulation for well № 3 show a decrease in cumulative production after the CSS.
4. Discussion
In order to determine the rationality of the practical application of the proposed approach, the technological efficiency of CSS was modeled in the Tempest More software. The calculations involved the same oils shown in
Figure 2.
Figure 4 shows an example of the obtained results of calculating the distribution of the heating temperature of the bottomhole formation zone and the distribution of changes in the dynamic viscosity in the bottomhole formation zone.
Table 5 shows the results of modeling CSS technology using the Tempest More software. The calculated value of the minimum flow rate Qmin
2 corresponds to the situation when the temperature of the bottomhole formation zone is equal to the initial value. In this situation, the target oils have the maximum values of the dynamic viscosity. The calculated value of the maximum flow rate Qmax
2 characterizes the situation when the bottomhole formation zone is heated to the maximum possible value. Under these conditions, the dynamic viscosity of oil reaches its lowest value.
Analyzing the obtained results of numerical calculations of the technological effect after applying CSS technology according to the proposed author’s methodology and the results obtained using the Tempest More software (
Table 5), it can be concluded that the results obtained have a convergence of more than 90%. However, it should be noted that the Tempest More software does not take into account the formation cooling processes, and, accordingly, the change in the dynamic viscosity of oil over time. It allows you to simulate fluid filtration at a fixed bottomhole temperature. In connection with this fact, it was concluded that the proposed author’s method for assessing the technological efficiency of the CSS technology application makes it possible to take into account in more detail the existing oil production losses caused by the processes of cooling the bottomhole formation zone.
The analysis of the obtained results given in
Table 4 shows that the CSS deployment in well № 3 is inexpedient since the calculated annual cumulative oil production for this well is less than for the base case. This results from the prevalence of well downtime for workover operation over formation cooling time.
The conducted research and numerical calculations allowed to propose a general approach to determination of effectiveness and expediency of the near-wellbore CSS technology deployment, which includes the following stages:
- (1)
Determination of the dependency of change in dynamic oil viscosity on temperature for the target well (where the technology is intended for application). In this case, it is recommended to determine the value of dynamic viscosity at steady-state pressure and temperature conditions of the fluid flow, for instance, on the specialized hydraulic circuit as in this work.
- (2)
Process calculations using the input data for the target and the results of laboratory tests carried out in
Section 1 to determine the following values using the expressions from
Section 2:
Optimal steam injection time;
Condensation time;
Maximum heating radius;
Oil flow rate before treatment;
Maximum oil flow rate after treatment;
Calculation of effect duration time.
- (3)
Comparative analysis of the cumulative oil production for the base case (without CSS) and with the CSS technology deployment based on the calculated parameters. The comparative analysis shall factor in well downtime (the well flow rate is 0 at the specified moment) due to steam injection and its subsequent condensation.
- (4)
Economic comparison of the technology application expediency by comparing the revenues from incremental oil production and the costs of the CSS technology deployment for the time period in question. This aspect has not been considered as a case herein since the sales value of hydrocarbons and the technology application financial costs in the domestic market are variable for different oil producing regions.
Therefore, the proposed approach will allow to promptly assess the effectiveness and expediency of the near-wellbore CSS technology application for a specific oil producing well with no need for specialized single-purpose reservoir simulators, and to calculate the process parameters of the well treatment cycle.
5. Conclusions
The growing share of unconventional oil resources in oil and gas companies’ operations is the most likely trend of the oil industry development. Near-wellbore cyclic steam simulation is one of the most promising technologies to enhance oil recovery from high-viscosity oil reservoirs. However, the technology expediency is an open question.
This paper proposes an approach to assess the near-wellbore CSS technology effectiveness and expediency, and to calculate the process parameters including the calculation of optimal steam injection time, condensation time, maximum heating radius, oil flow rate before treatment, maximum oil flow rate after treatment and time of effect duration.
To study the impact of dynamic viscosity of the produced oil on the technology effectiveness, numerical simulation has been carried out using the proposed technique for six different oils. The calculations have determined that for the oil with the lowest dynamic viscosity within the entire temperature range, the CSS application is inexpedient since, in this case, the well downtime during its treatment prevails over the near-wellbore cooling time.


