
Effect of the Size and Location of Liquid Cooling System on the Performance of Square-Shaped Li-Ion Battery Modules of an Electric Vehicle


1
Department of Automotive Engineering, Graduate School, Seoul National University of Science & Technology, Seoul 01811, Korea
2
Department of Mechanical & Automotive Engineering, Seoul National University of Science & Technology, Seoul 01811, Korea
*
Author to whom correspondence should be addressed.
Fluids 2022, 7(7), 219; https://0-doi-org.brum.beds.ac.uk/10.3390/fluids7070219
Submission received: 20 May 2022
/
Revised: 26 June 2022
/
Accepted: 28 June 2022
/
Published: 29 June 2022
Abstract
:As the core powertrain component of electric vehicles, batteries release heat when charging and discharging due to the chemical reactions between the battery elements and internal resistance. To avoid problems resulting from abnormal temperatures, such as performance and lifespan issues, an effective battery cooling system is required. This paper presents a fundamental study of battery module liquid cooling through a three-dimensional numerical analysis. CFD numerical tests as conducted here are based on the heat transfer characteristics and on the liquid cooling theory, and the temperature distribution and thermal conductivity are analyzed qualitatively and quantitatively using Simcenter STAR CCM+ version 2016 (Siemens Digital Industries Software, Plano, TX, USA). A simulation uses a square-shell lithium-ion battery-made module with two different liquid cooling systems at different positions of the module. The results of the numerical study indicate that the bottom cooling system shows a better battery module temperature difference that is approximately 80% less than that of the side cooling system. For the side cooling system, it is better in terms of the maximum temperature of the battery module, which is approximately 20% lower than that in the bottom cooling system, but this system does not offer very good control of the temperature difference, which is also its greatest shortcoming compared to the bottom cooling system.
1. Introduction
The effort to promote sustainable development in the automotive industry has been ongoing for years with the emerging challenges of environmental issues and energy crises. To cope with energy and environmental issues and promote continued development in the automotive industry, traditional hydrocarbon fuels are being converted to clean energy, and the development of the traditional automotive industry has been greatly challenged. Electric vehicles, as an alternative transport mode, are shifting the powertrains of vehicles from fossil fuels to electricity. The major automotive producers of the world have increased their research and development efforts to focus on electric vehicles [1,2].
As the main source of power for electric vehicles, the performance characteristics of batteries determine the mileage, safety, and life cycle of an electric vehicle. A rechargeable lithium-ion battery is widely used as the dominant energy storage system for electric vehicles to ensure high power, low self-discharge times, long lifetimes, and no memory effect. Moreover, they are widely commercialized [3].
However, thermal control of lithium-ion batteries under various conditions has not been sufficiently addressed. Their performance and lifespan are greatly affected by the battery temperature and the temperature balance of the battery pack. The accumulated heat generated when charging and discharging causes distinct temperature differences in the battery pack. Moreover, long-term, uneven heat generation causes inevitable capacity differences between the batteries in the pack, thereby degrading the performance overall. [4,5]. Therefore, to manage the thermal energy of the battery and maintain the uniformity of the internal temperature of the battery pack, the battery thermal management system design of the battery pack is one of the most important research topics in the battery pack manufacturing industry [6,7,8,9,10,11,12,13].
Many studies have investigated the battery cooling system with the development of electric vehicles. Because of the simple structure, an air-based cooling system was first studied for electric vehicles, and due to its related performance characteristics, many papers have produced very good descriptions [14,15,16,17]. Liquid cooling systems are currently the most widely used, and the related research is also the most of all cooling systems. Whether research has focused on the specific structural design or the flow path design, it has been carefully analyzed [18,19,20,21]. With the improvement in the performance and cruising range of electric vehicles, the requirements for the battery management system is also growing. Therefore, a thermal management system based on phase change material or a heat pipe has also been proposed, and many papers have analyzed this thermal management method [22,23,24,25]. There are advantages and disadvantages among the various cooling systems, so the differences between these systems have also been studied and compared [26,27,28,29,30]. Based on those studies, this numerical study focuses on analyzing and comparing the cooling effect characteristics of the two types of mainstream liquid cooling systems at different positions of the module. This study also tried to analyze the relationship between the coolant channel area and cooling effect. Each cooling system has three models with different coolant channel widths to make different coolant channel areas; a total of six models are created for a numerical analysis by CFD. The cooling effects of each scheme are evaluated by examining the maximum temperature, the temperature difference, and the heat transfer conductance. The advantages and disadvantages of each cooling system are analyzed and summarized, and we explore the causes to provide a basis for subsequent research.
2. Active Cooling System
2.1. Air Cooling
Air cooling uses heat convection to reduce the temperature of the battery pack. Heat dissipation is realized by inducing low-temperature air via wind or by forced-air circulation with a cooling fan. However, the low heat capacity and thermal conductivity of air make heat transfer less efficient. This drawback becomes much more pronounced when EVs operate in hot environments or when large temperature variation conditions exist in the battery pack [14,15,16,17].
2.2. Refrigerant Cooling
Direct refrigerant cooling controls the temperature of the battery pack through energy changes produced by phase change materials (PCM) undergoing physical changes. When the battery functions and releases heat, the PCM absorbs the heat and changes from a solid to a liquid to reduce the temperature of the battery pack; in a low-temperature environment, the heat released by the PCM when changing from a liquid state to a solid state is used to increase the battery temperature. Compared to other battery thermal management methods, it has a faster thermal response [22,23].
2.3. Liquid Cooling
Cooling via a circulating liquid generally performs better in terms of temperature control given the higher thermal conductivity and heat capacity. For liquid cooling, we can control the coolant flow, secondary medium temperature, and mass flow to meet various thermal control requirements. In summary, these systems represent a popular cooling technology in industrial applications due to their integrated flexibility and given that they offer precise control of heating and preheating.
Direct liquid cooling and indirect liquid cooling are two commonly used forms of liquid cooling. The main difference between them is whether the liquid coolant is in direct contact with the battery. For direct liquid cooling, the battery is directly submerged in the coolant. For indirect cooling, the coolant from the battery uses a component that indirectly transfers heat from the battery to the coolant [18,19,20,21].
At present, indirect liquid cooling has become the mainstream method owing to its simplicity and efficiency. Hereafter, liquid cooling, as mentioned in this numerical study, also refers to this indirect liquid cooling method. The liquid cooling method has been used more in actual production. Because different designs will have a significant impact on the cooling effect on the battery pack, continuous research to improve the cooling efficiency of liquid cooling is paramount.
3. Theoretical Background
3.1. Heat Source in a Battery Cell
The heat generated in a battery cell (Qg) can be considered to originate from two factors. These are ohmic heating (Qohmic) and enthalpy heating (Qenthalpy). Their relationship is as follows [31,32]
Ohmic heating is produced due to the internal resistance of the battery cell and the associated electrochemical reactions that take place within it. Enthalpy heating is due to enthalpy changes that occur during the charging and discharging process. It can be positive or negative depending on the endothermic or exothermic reaction. The heat generated due to ohmic heating is computed as [31,32]
where I is the charging or discharging current and E and Eoc are correspondingly the cell potential and open-circuit potential.
This yields the heat generated from the battery cells, which is represented in a simplified form as [31,32]
It can be seen that the battery continues to generate heat during charging and discharging. Therefore, while the electric vehicle is driving, the heat generated by the battery will continue to accumulate. Due to the impact of extreme temperatures on the performance, reliability, and longevity of the battery pack, the cooling system is extremely important for all electric vehicles using lithium-ion battery packs.
In this study, the heat input of a battery cell was set as a constant heating power with an average heat production during a whole discharge process at 1C-rates given to the battery
3.2. Reynolds Number
The choice of flow model is very important. Different models will lead to major differences in the results. Therefore, it is necessary to check the Reynolds number to determine which layer model should be used. All models in this numerical approach are assumed to utilize a laminar layer flow after the calculation.
Here ρ, ν, and μ are the density, velocity, and viscosity of the coolant, respectively, and d is the hydraulic diameter of the flow path of the cooling system. It is given expressed as
where A is the cross-sectional area and L is the cross-sectional perimeter of the coolant tube.
3.3. Governing Equation
In this numerical study, a simple algorithm was incorporated to calculate the max temperature and temperature difference of the module. Objects in nature all satisfy the basic laws of conservation of physics in motion. In a CFD calculation, the governing equations satisfied by the fluid are the continuity equation, momentum equation, and energy equation [33,34]. Because the fluid in this research adopts the laminar flow mode, it does not need to obey the turbulent transport equation. For the analysis of non-compressibility, the governing equation of a laminar flow is as follows [35,36,37].
- (1)
- Continuity equation
- (2)
- Momentum equation
- (3)
- Energy dissipation equation
3.4. Heat Conductance of the Cooling System
The cooling capacity of a fluid can be expressed by the amount of heat transfer conductance of the fluid. The amount of heat transfer conductance of a fluid can be expressed by the following formula:
- Conduction heat flux (W)
- Conductive heat transfer per unit area (W/K∙m2)
4. Research Approach
4.1. Three-Dimensional Model of the Liquid Cooling System
Determining the model in this numerical study requires the consideration of several factors. First, this model should be as close as possible to the model of the battery and cooling tubes actually used. The battery model used in this numerical study was made by 1:1 based on a representative square-shell lithium-ion battery (4.35 V, 55 Ah Ni55+ single crystal cell) that is mature in technology, unified in standards, and is already widely used in many electric vehicles on the market. The battery was cooled by heat transfer through a coolant in a cooling plate or cooling pipe. Secondly, the model should be easy to simulate in simulation software to reduce calculation errors and ensure more accurate results. Therefore, the models have been slightly simplified, which will not affect the result, such as removing chamfers and other simplifications. Based on these, the following model is established here.
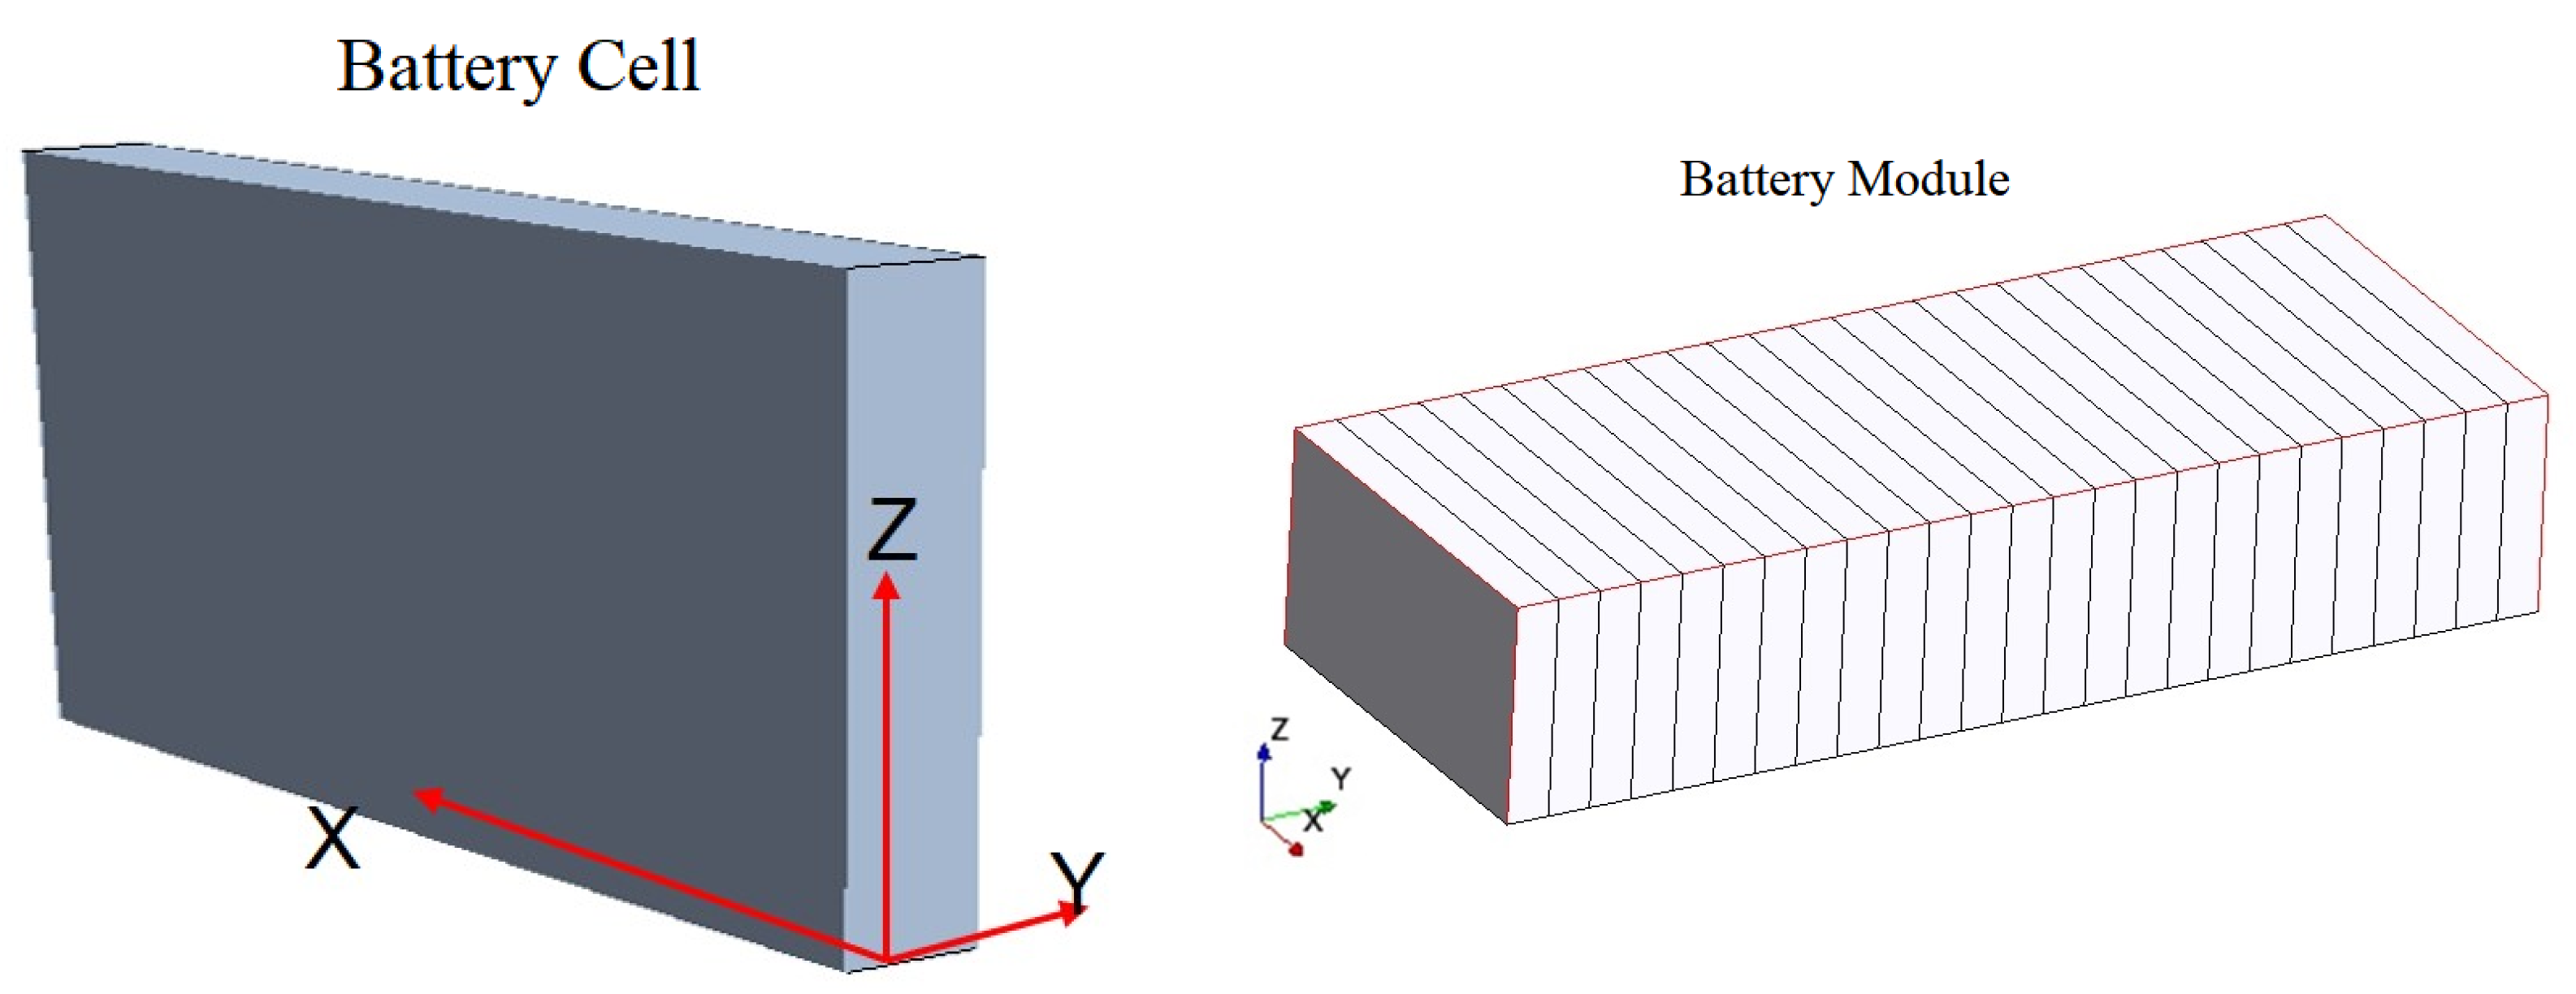
4.1.1. Model of the Battery Cell and Module
To facilitate the numerical study of the temperature distribution of the types of batteries studied here, a module model with 25 cells was fabricated to simplify the numerical study and facilitate the research [37]. Figure 1 shows the shape of the cell and the assembled module, where the size of each cell is X = 120 mm, Y = 12.5 mm, and Z = 65.5 mm.
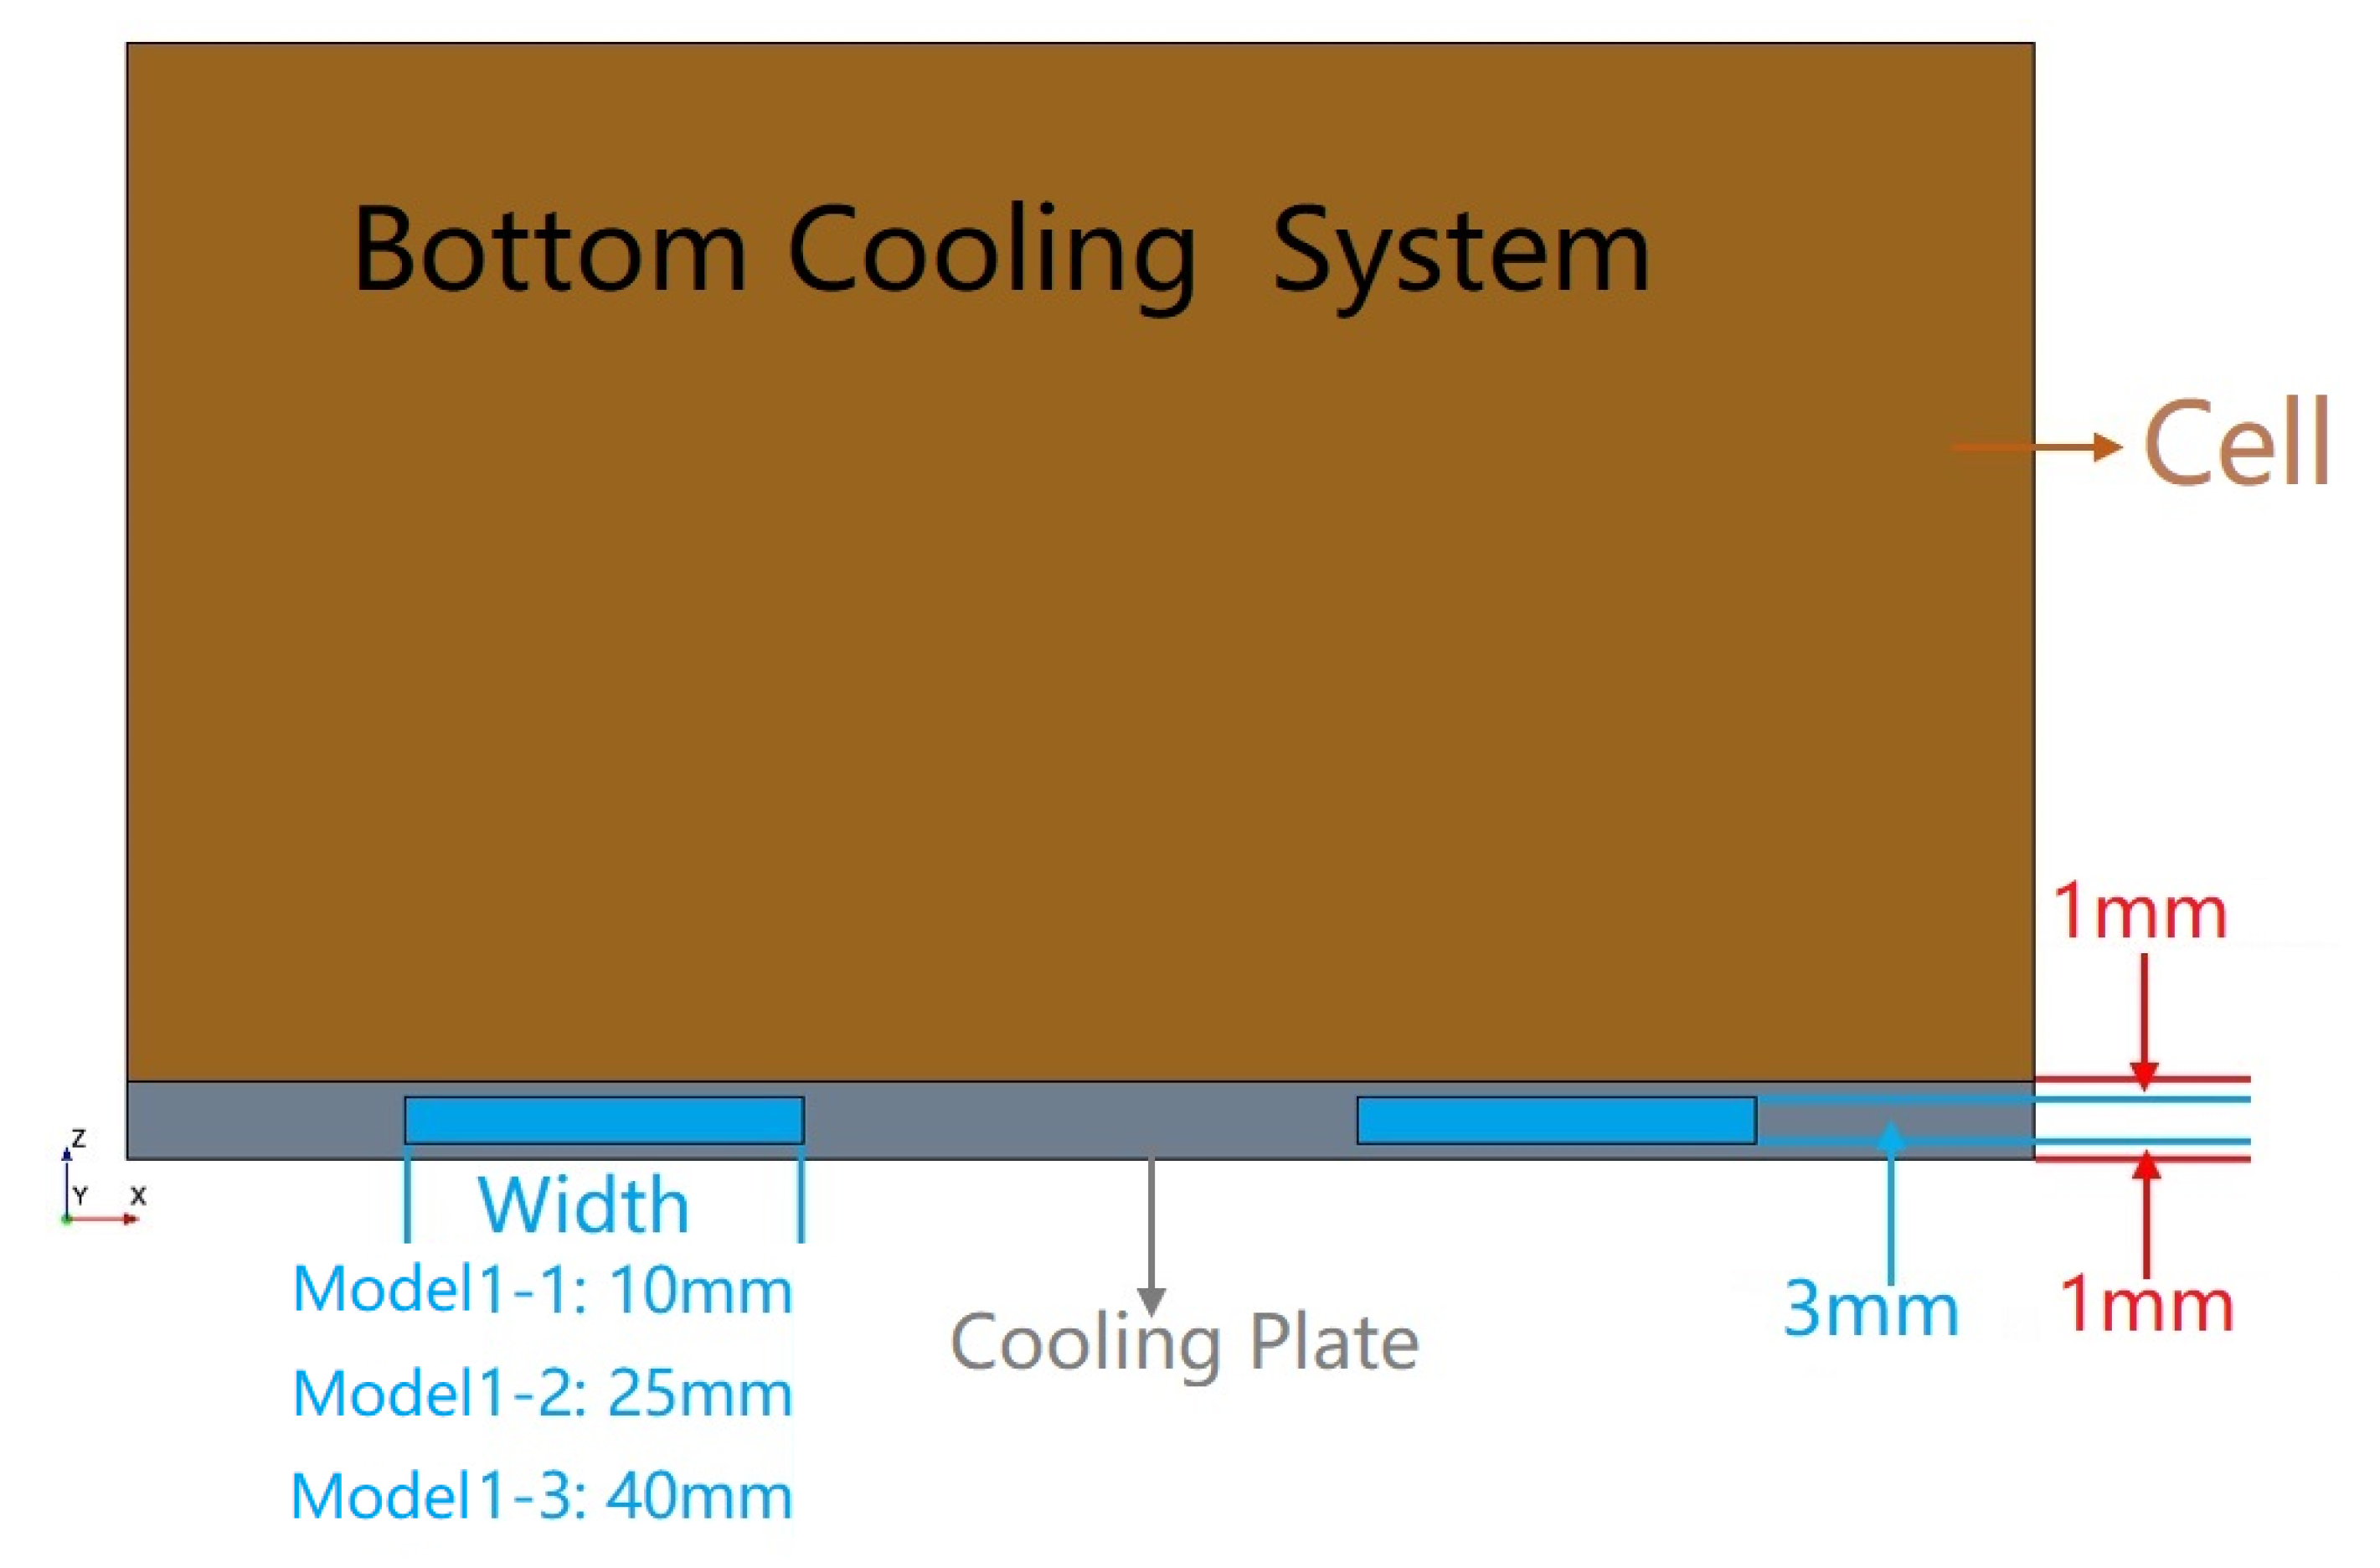
4.1.2. Flow Path Design of the Liquid Cooling System
The cooling effect of the liquid cooling system will vary greatly at different locations of the module. Therefore, two types of cooling systems were designed to be located at the bottom and side of the module. Since the coolant width directly determines the contact area and the system volume, three models with different coolant channel widths were made in each cooling system. In total, six models are used for this paper.
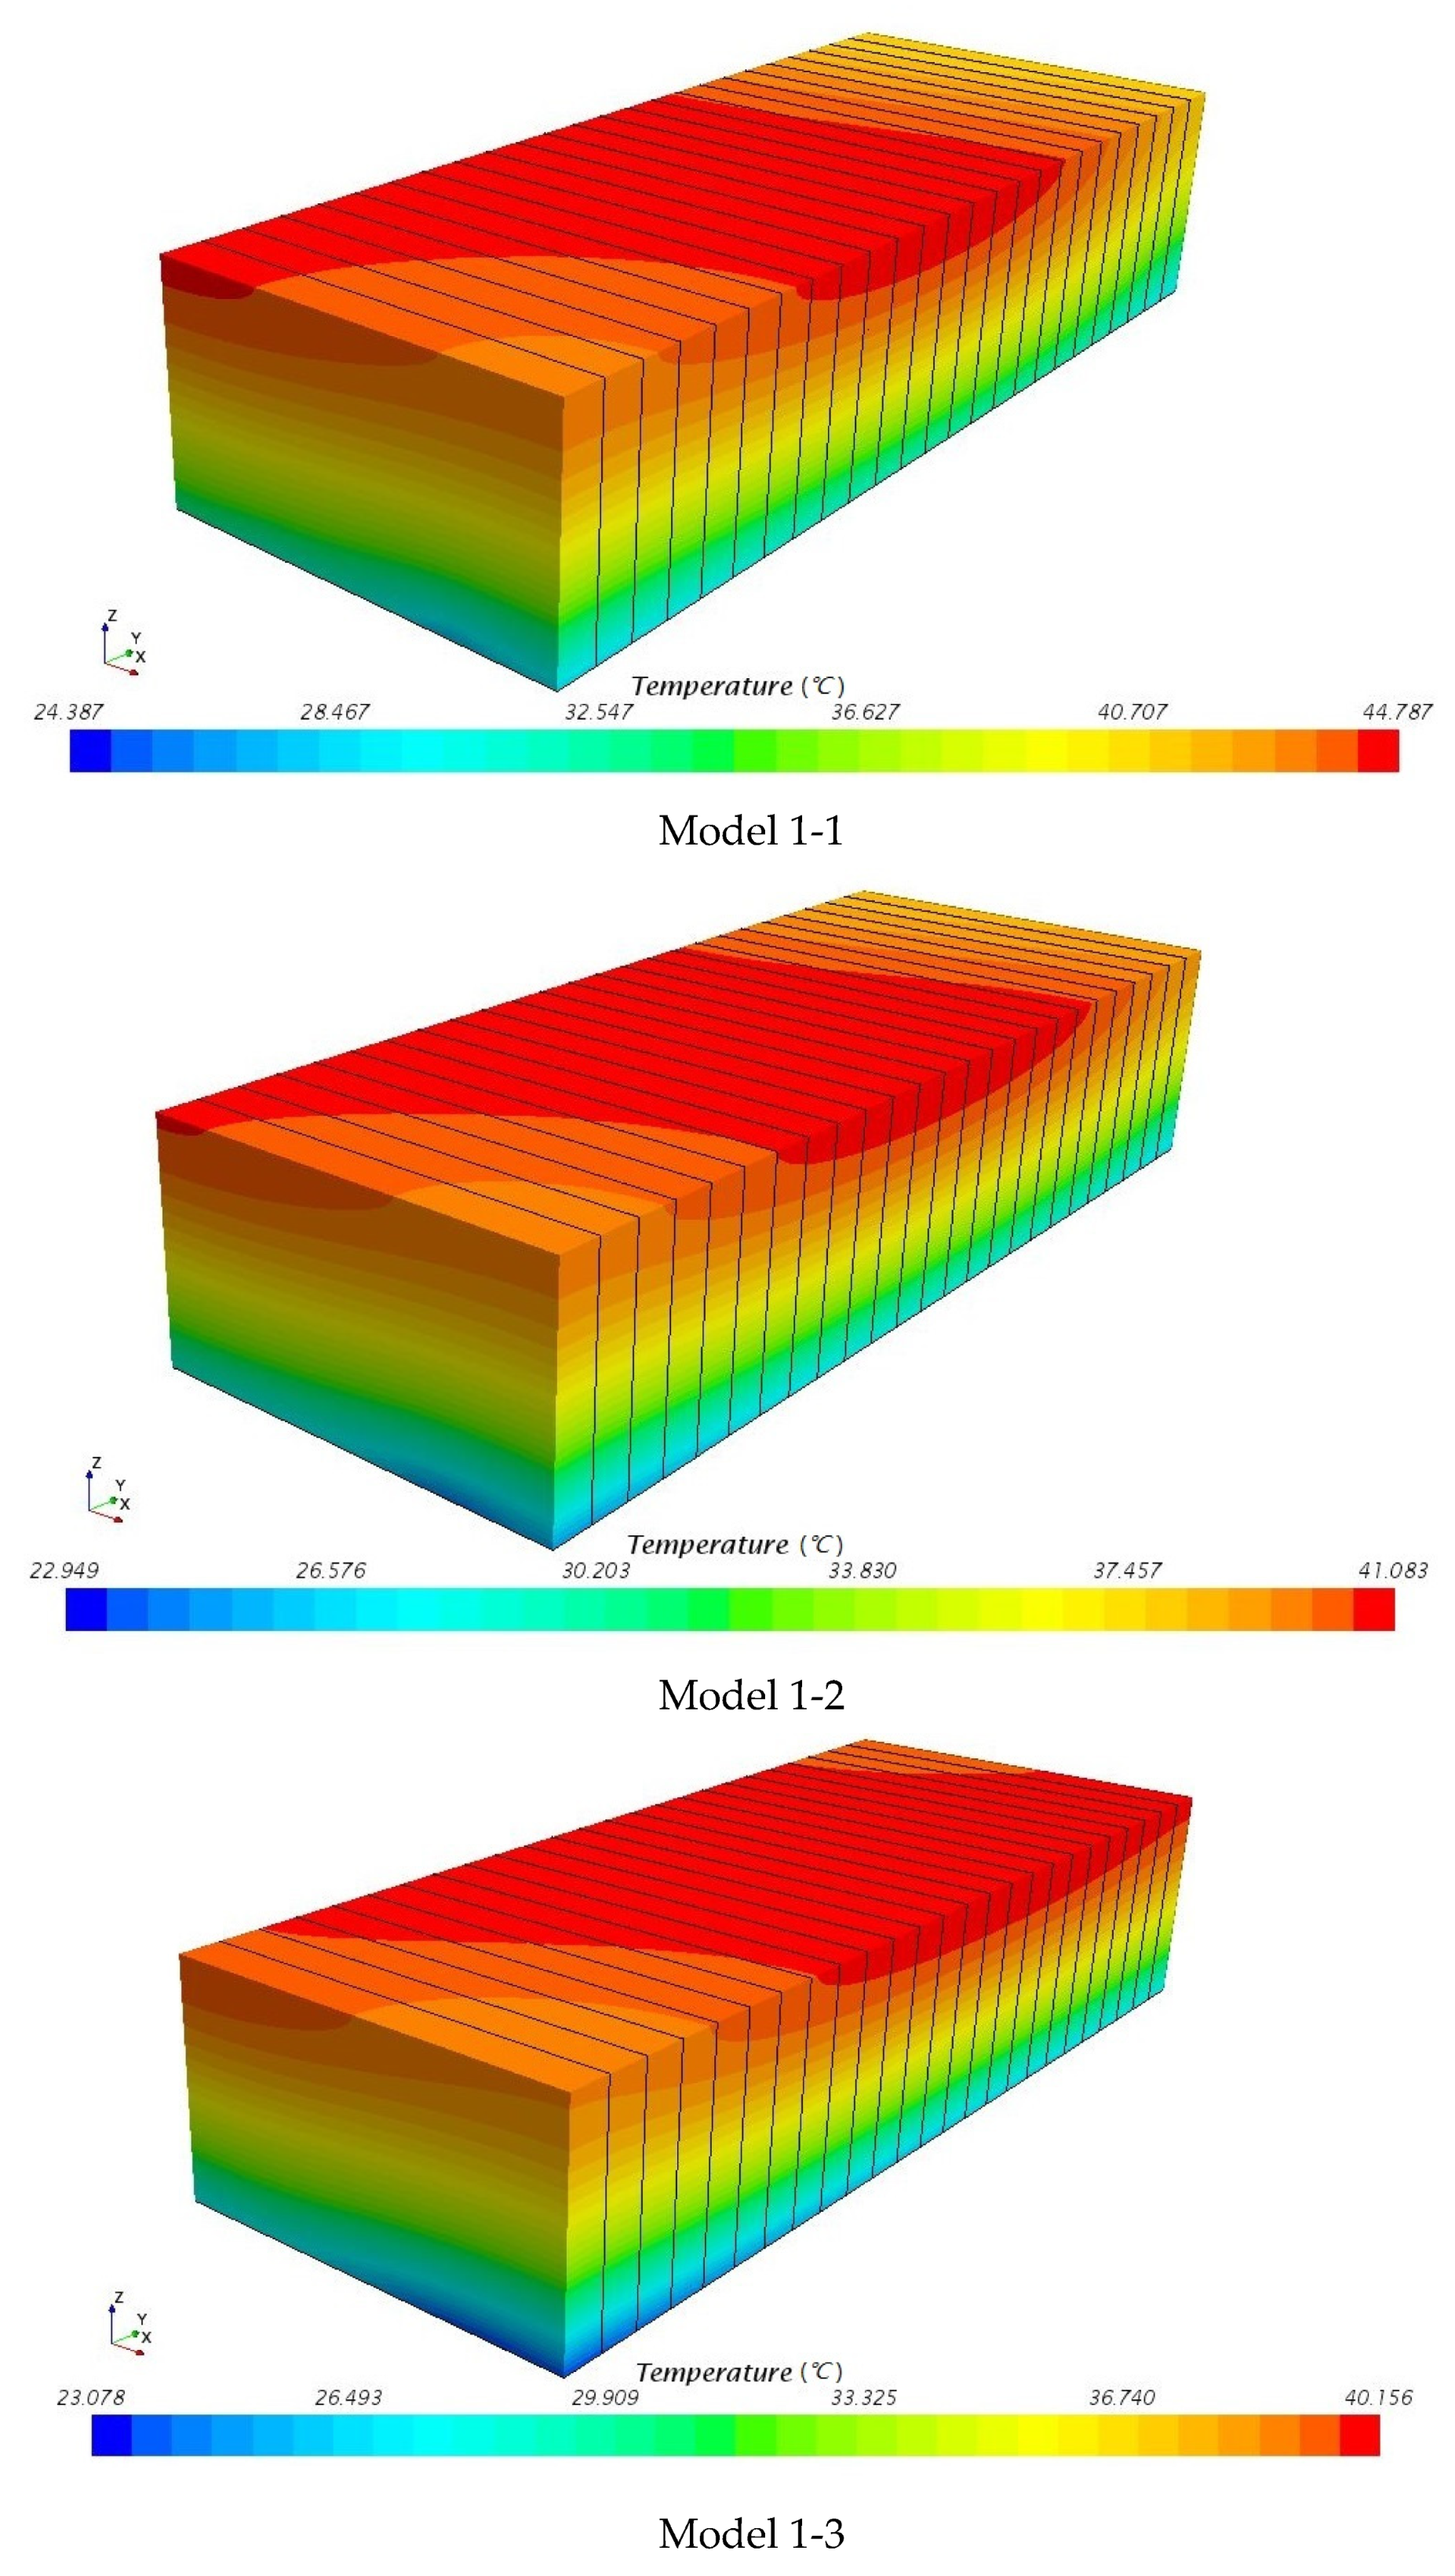
The bottom cooling system is the most popular design at present. The bottom cooling system consists of a large integral cooling plate under the module, with cooling channels that are grooved inside the panel. In this numerical study, three models with different coolant channel widths ranging from 10 mm to 40 mm (Model 1-1: 10 mm, Model 1-2: 25 mm, Model 1-3: 40 mm) are made in the bottom cooling system, while the coolant height is 3 mm in all cases.
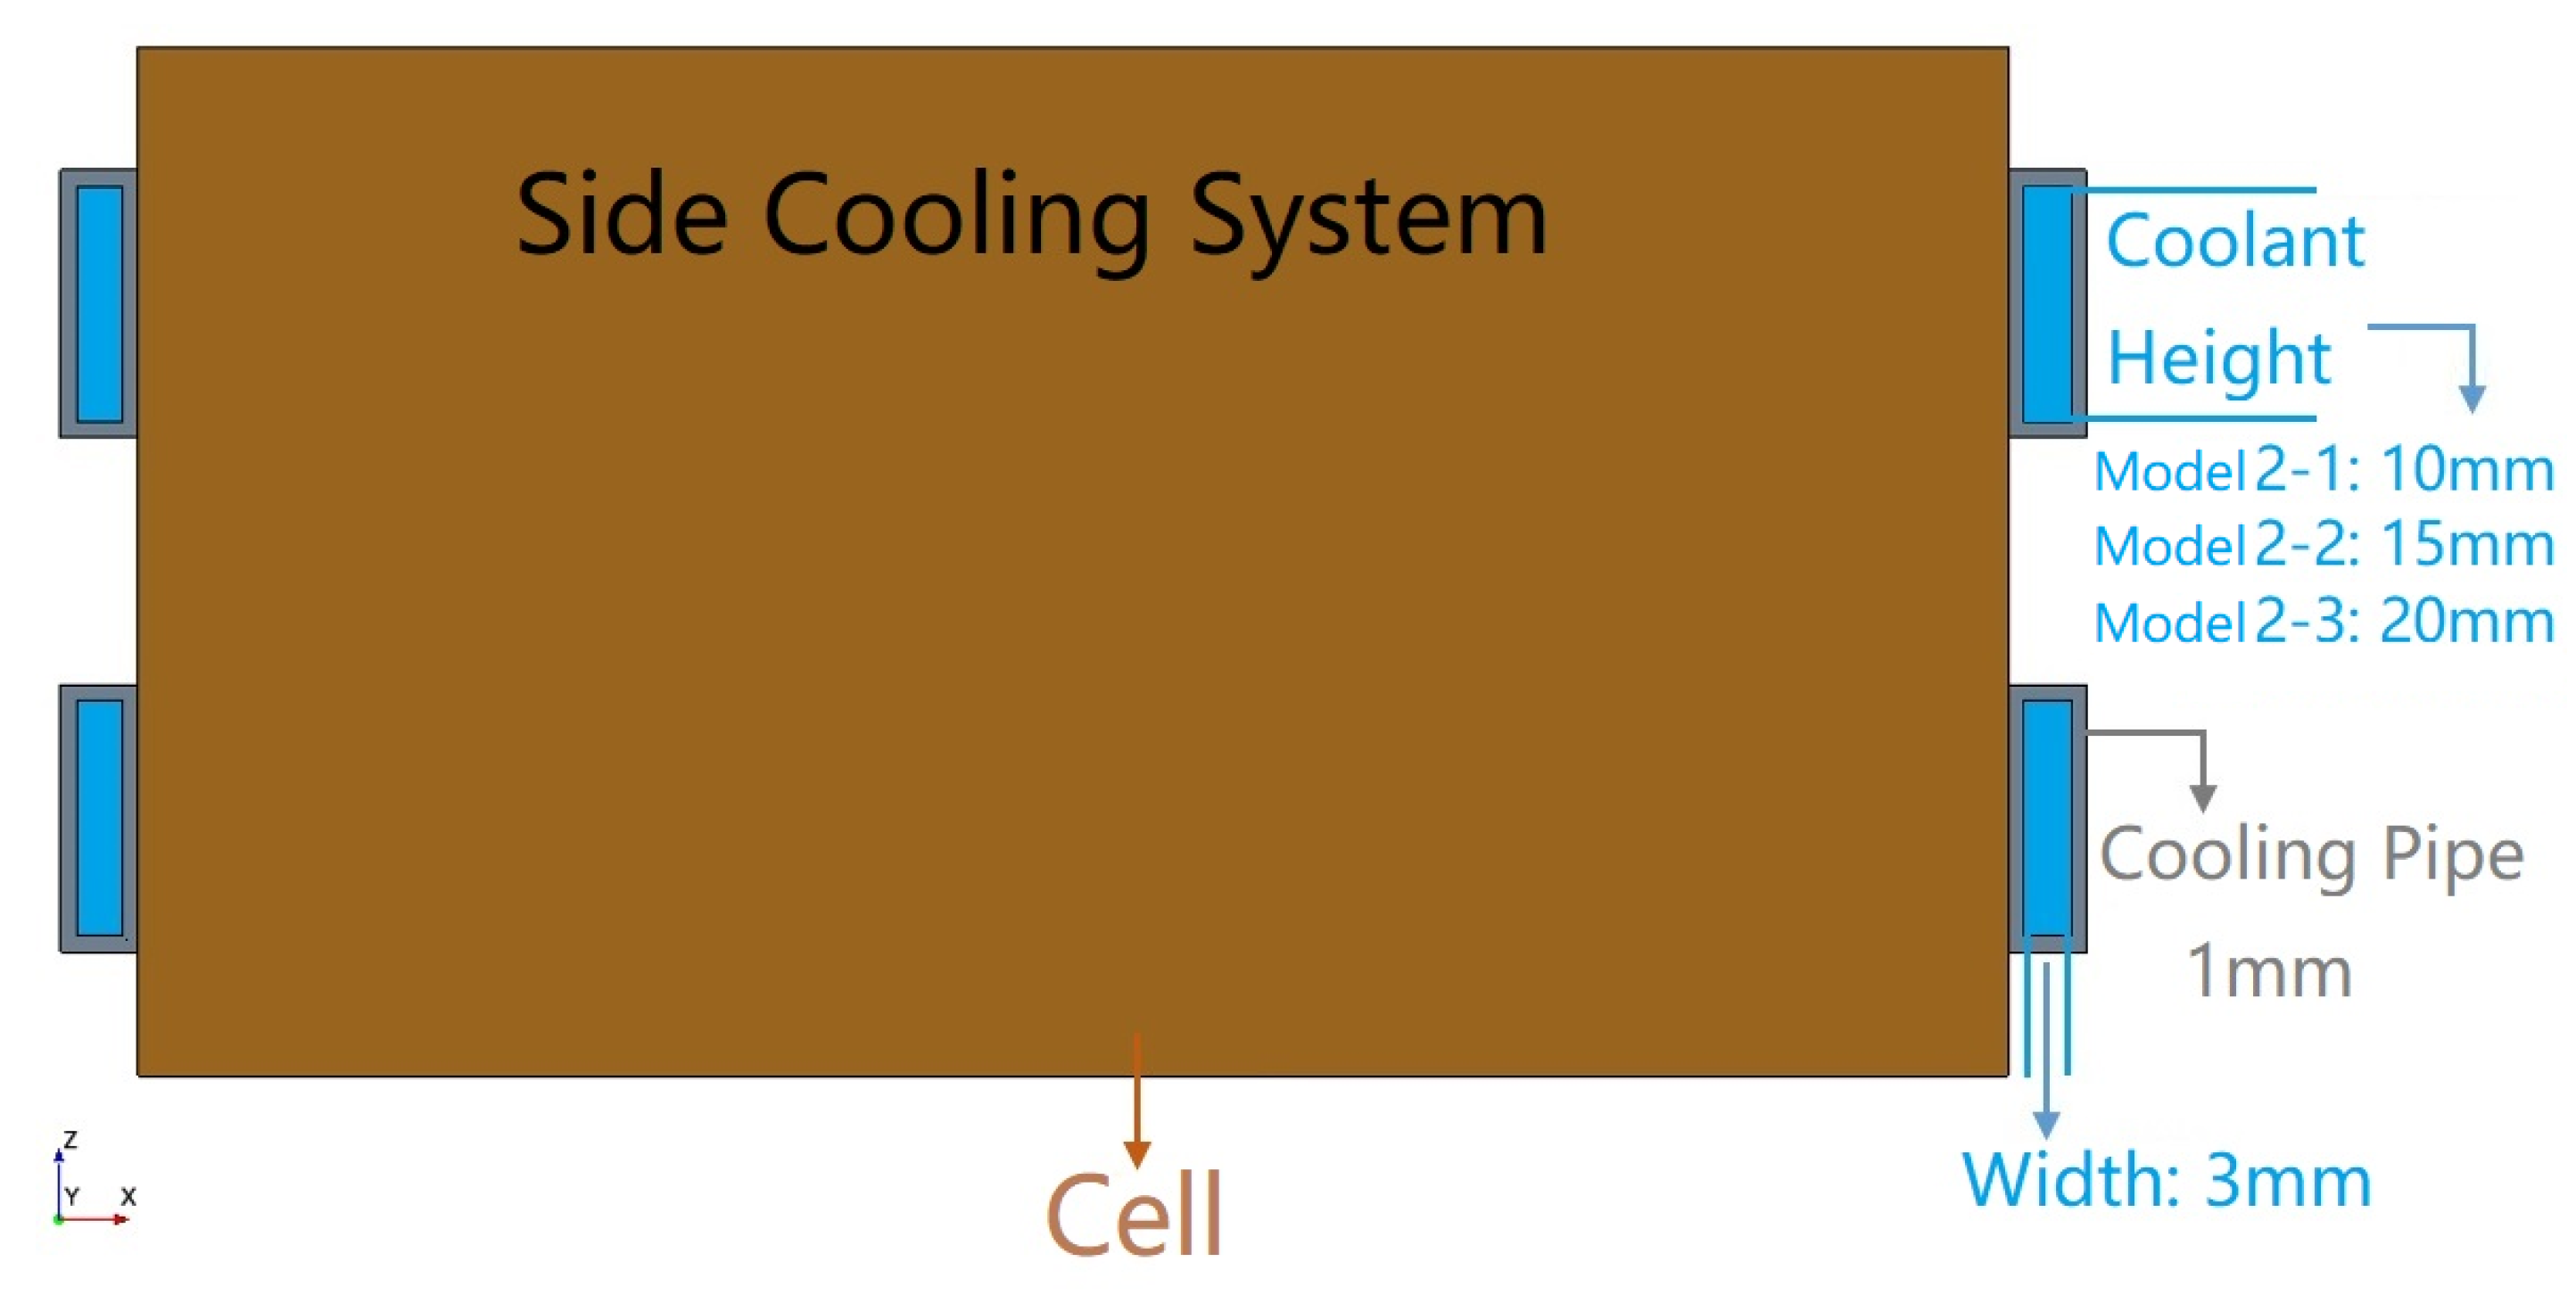
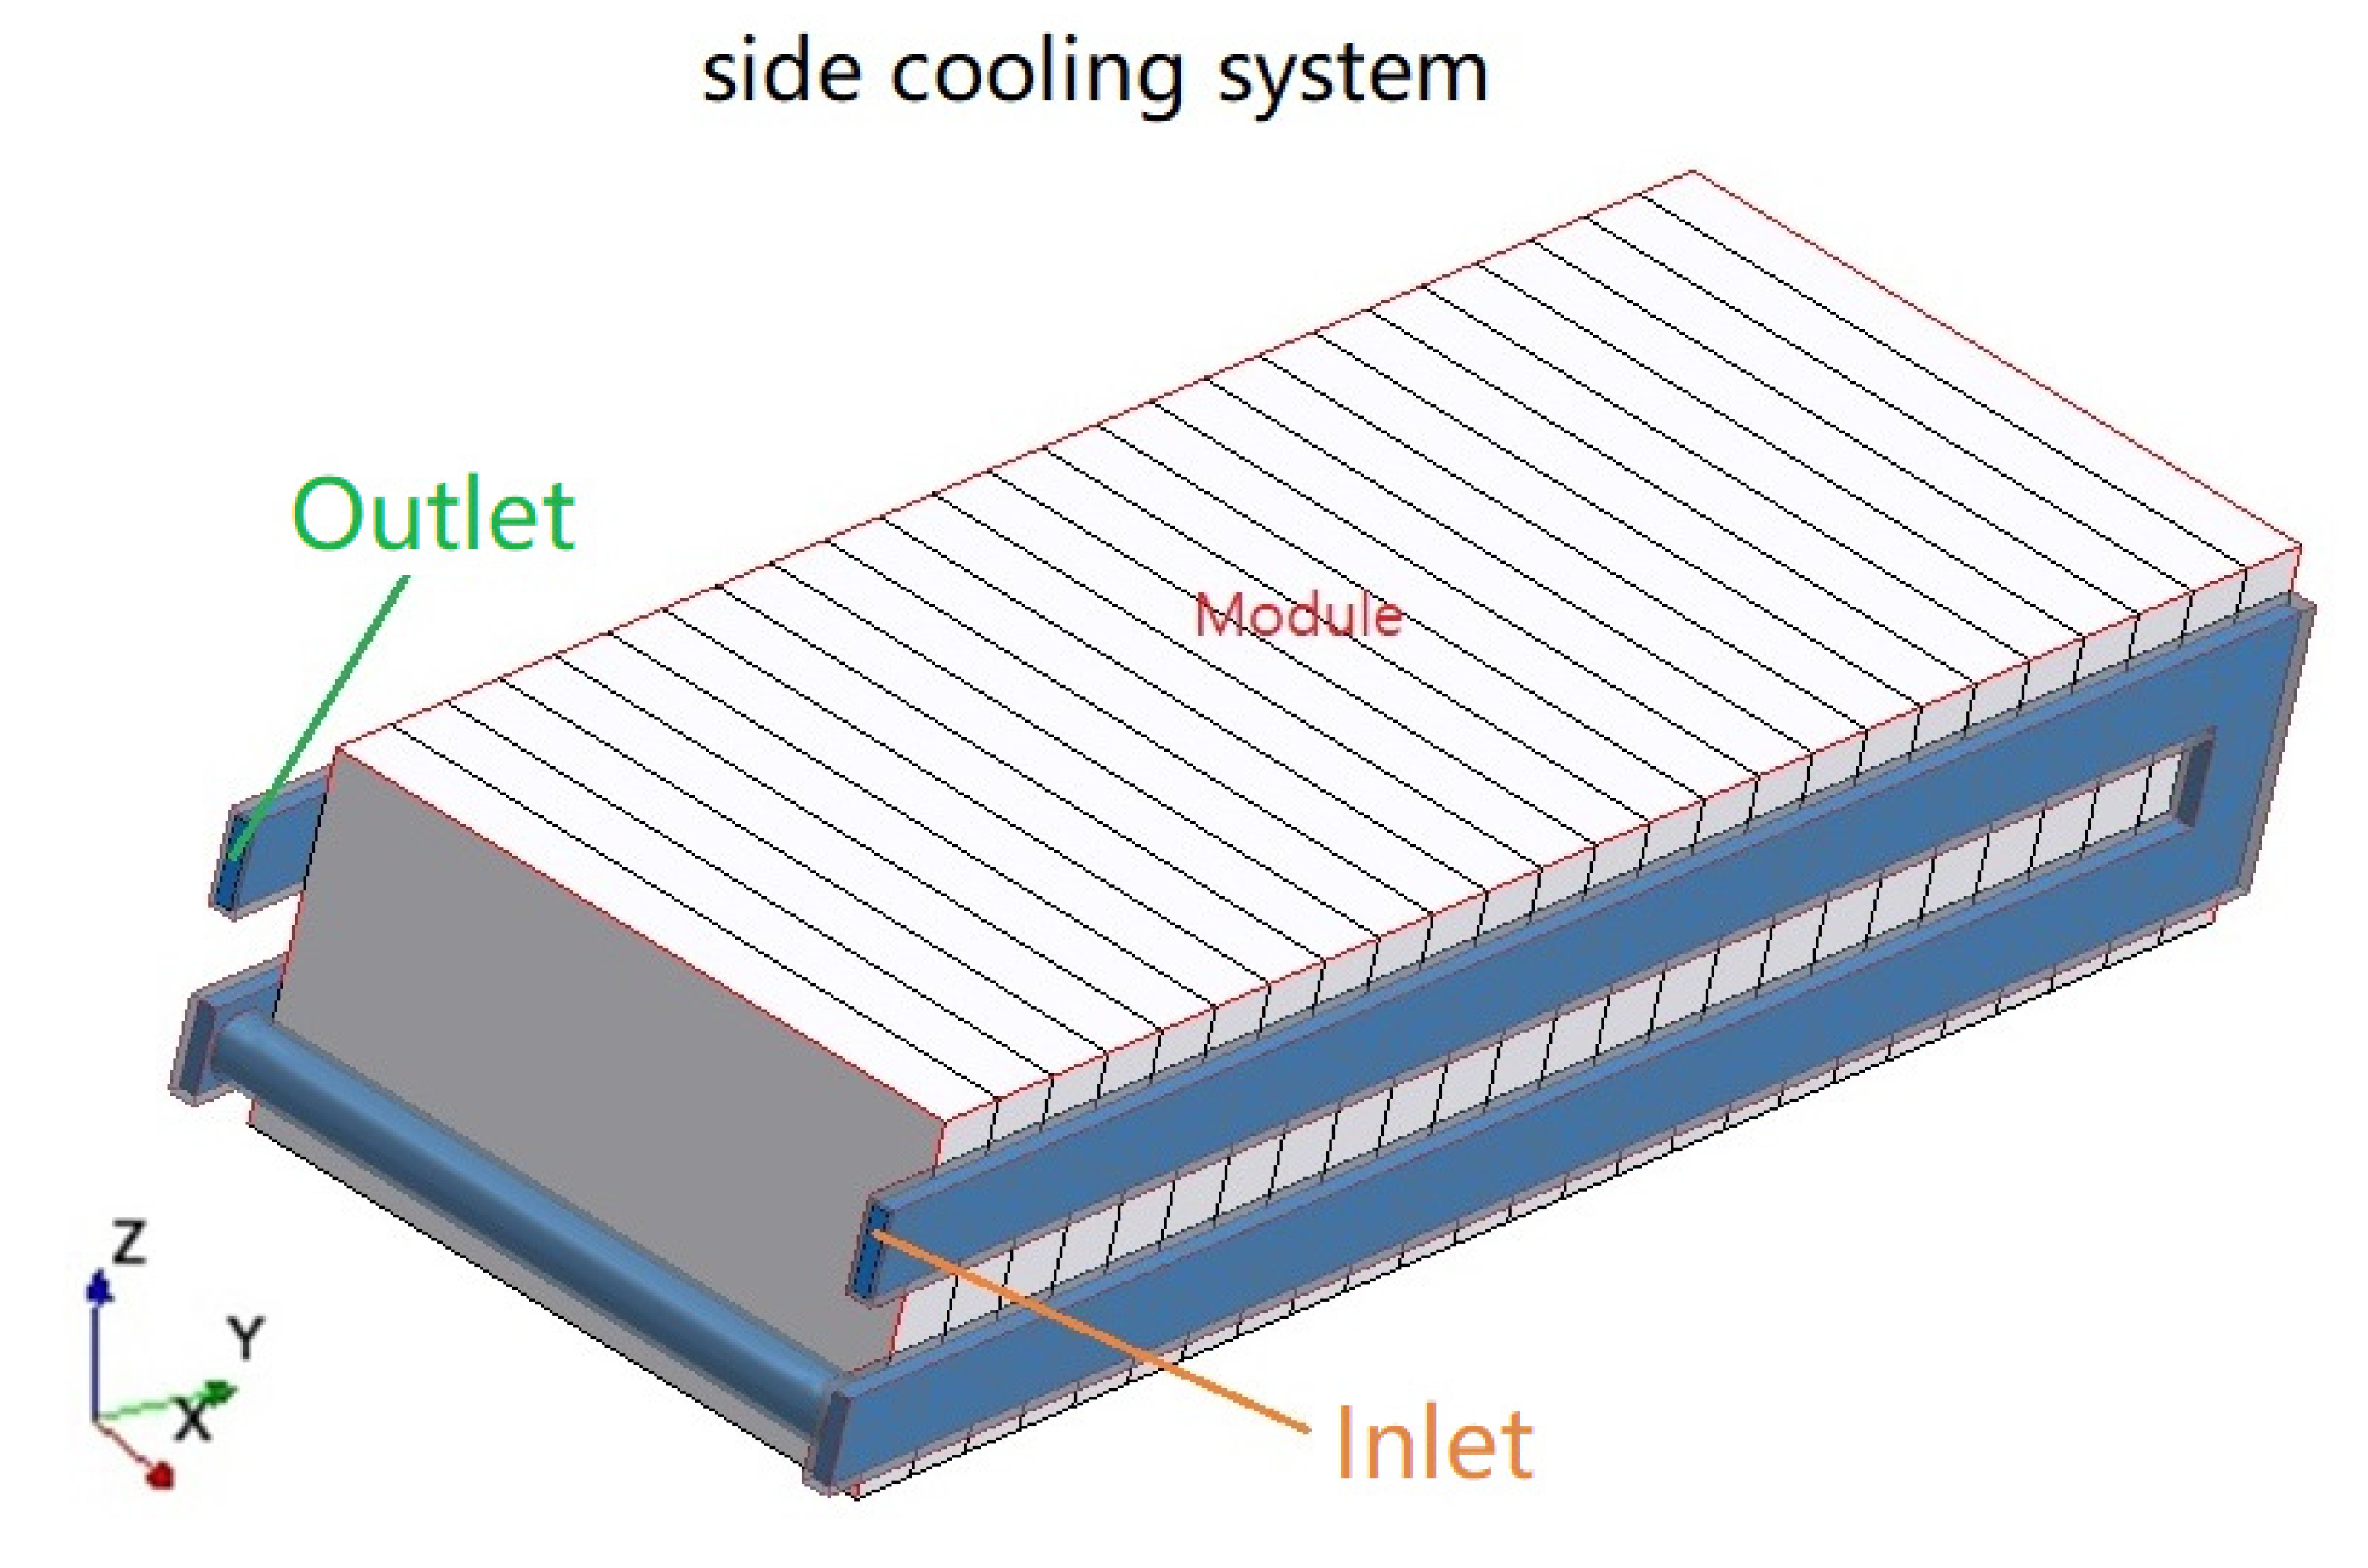
The side cooling system is located on both sides of the module, and the coolant flows through a cooling pipe that is in direct contact with the module. In this numerical study, three models with different cooling channel heights ranging from 10 mm to 20 mm (Model 2-1: 10 mm, Model 2-2: 15 mm, Model 2-3: 20 mm) are created in the side cooling system; the cooling channel width is 3 mm, and the cooling pipe thickness is 1 mm.
4.2. Numerical Scheme
In this numerical study, CATIA was used to shape the models, ANSA was used to generate the surface grids of the models, and STAR CCM+ (ver. 2016) was used to evaluate the cooling performance of the model cooling system from the numerical simulation results. All these software are general-purpose 3-D modeling programs.
For the numerical study, the cartesian coordinate system is shown in Figure 4 and Figure 5 [5], and all six full-scale models were analyzed with the same practical initial and boundary conditions to make sure every case was in the same thermal situation. The detailed setting is as shown below.
4.2.1. Grid Generation
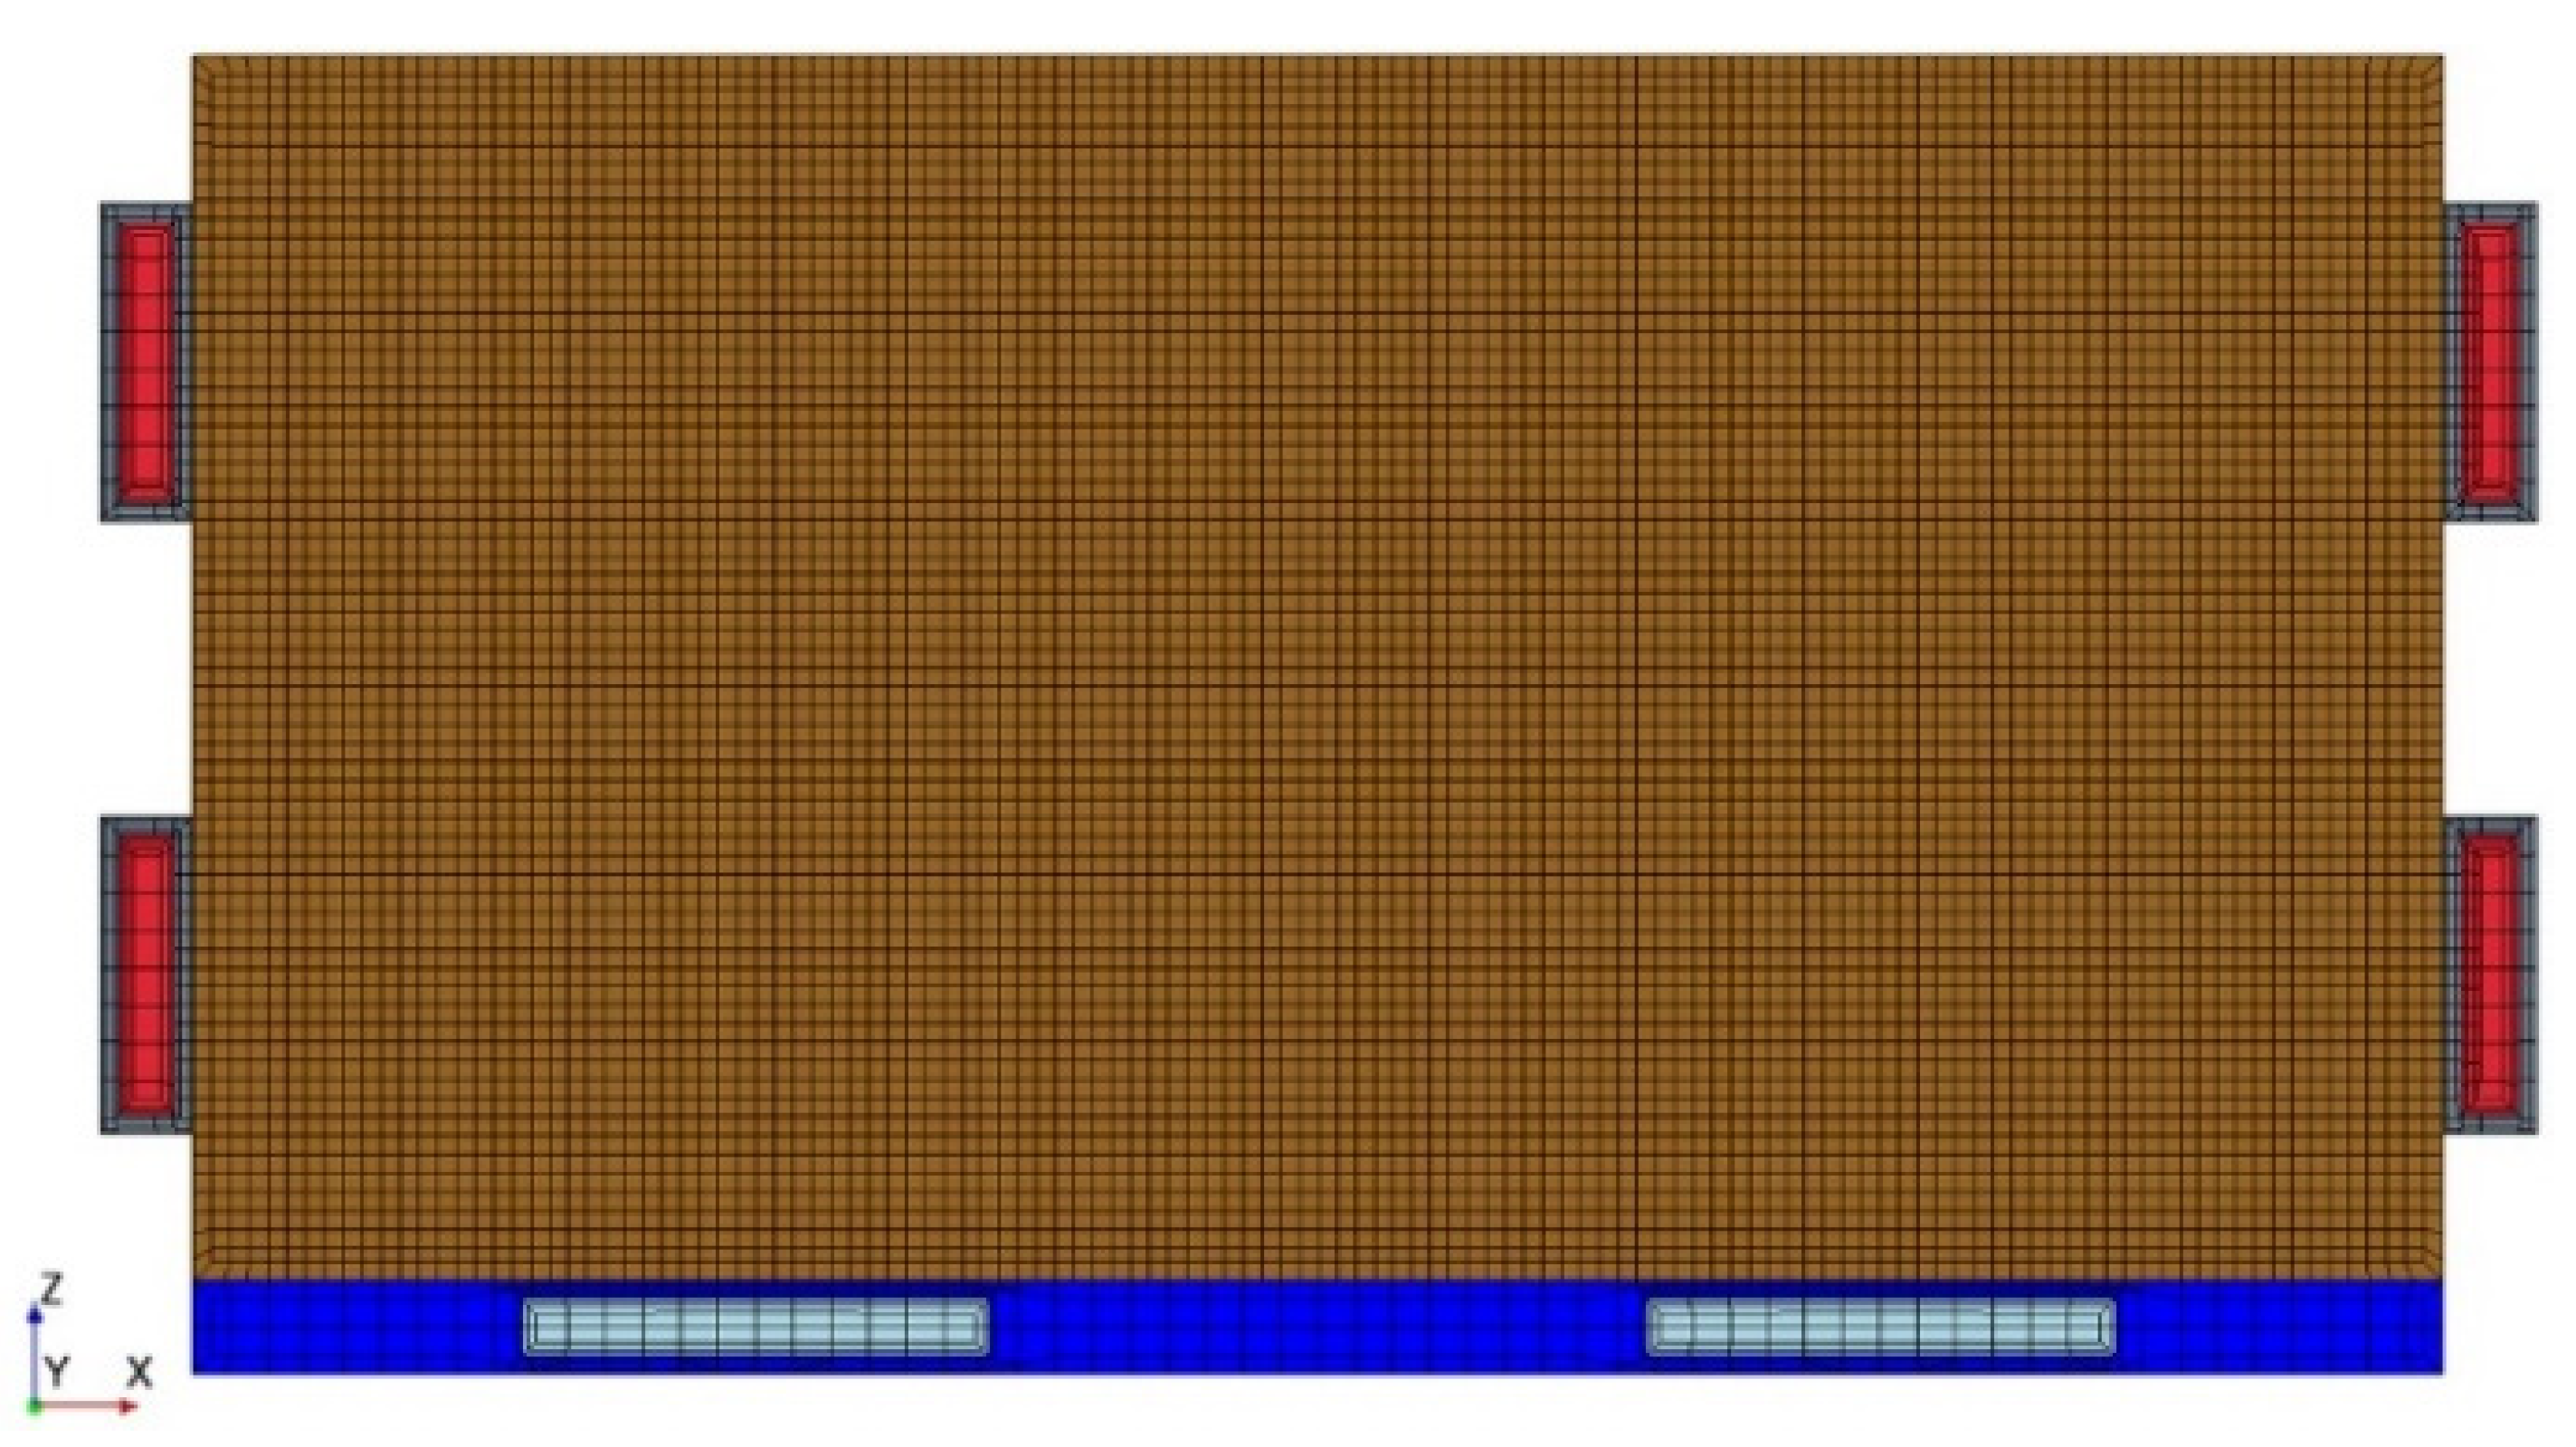
For discretization of the domain, the CAD-to-CFD method was used for grid generation in the numerical domain. After the models were made by CATIA V5 (Dassault Systèmes, Vélizy-Villacoublay, France), the surface grids of the models were generated by ANSA, and then the models were imported with the surface grids into the numerical domain. The volume grids were generated in the numerical domain [13]. To ensure the accuracy of the numerical results, multiple grid settings were created and tested. The final size of the volume mesh generated in the domain was approximately three million, and the mesh quality was checked by STAR CCM+, as shown in Figure 6.
4.2.2. Boundary and Initial Conditions
The main purpose of this study is to compare the cooling effect of the two model cooling systems, so the most important thing is to ensure that the two cooling systems are working under the same thermal environment. A constant heating power of the battery can also provide a uniform thermal environment, and it can shorten the time of CFD at the same time. The constant heating power 6.8 W, with an average heat production to complete a whole discharge process at 1C-rates, was given to the battery cell to make sure the cooling systems were under the same thermal environment.
The coolant was a mixture of 50% ethylene glycol and 50% water, which is widely used in mainstream electric vehicles. The flow model utilized a laminar layer flow after calculations with Equations (5) and (6). Because the heat input of the battery is a constant heating power, a steady-state model was used in order to complete the calculation as quickly as possible. Details of the properties of the coolant and the battery and the initial and boundary conditions are shown in Table 1, Table 2 and Table 3, respectively [4].
4.2.3. Convergence Criterion
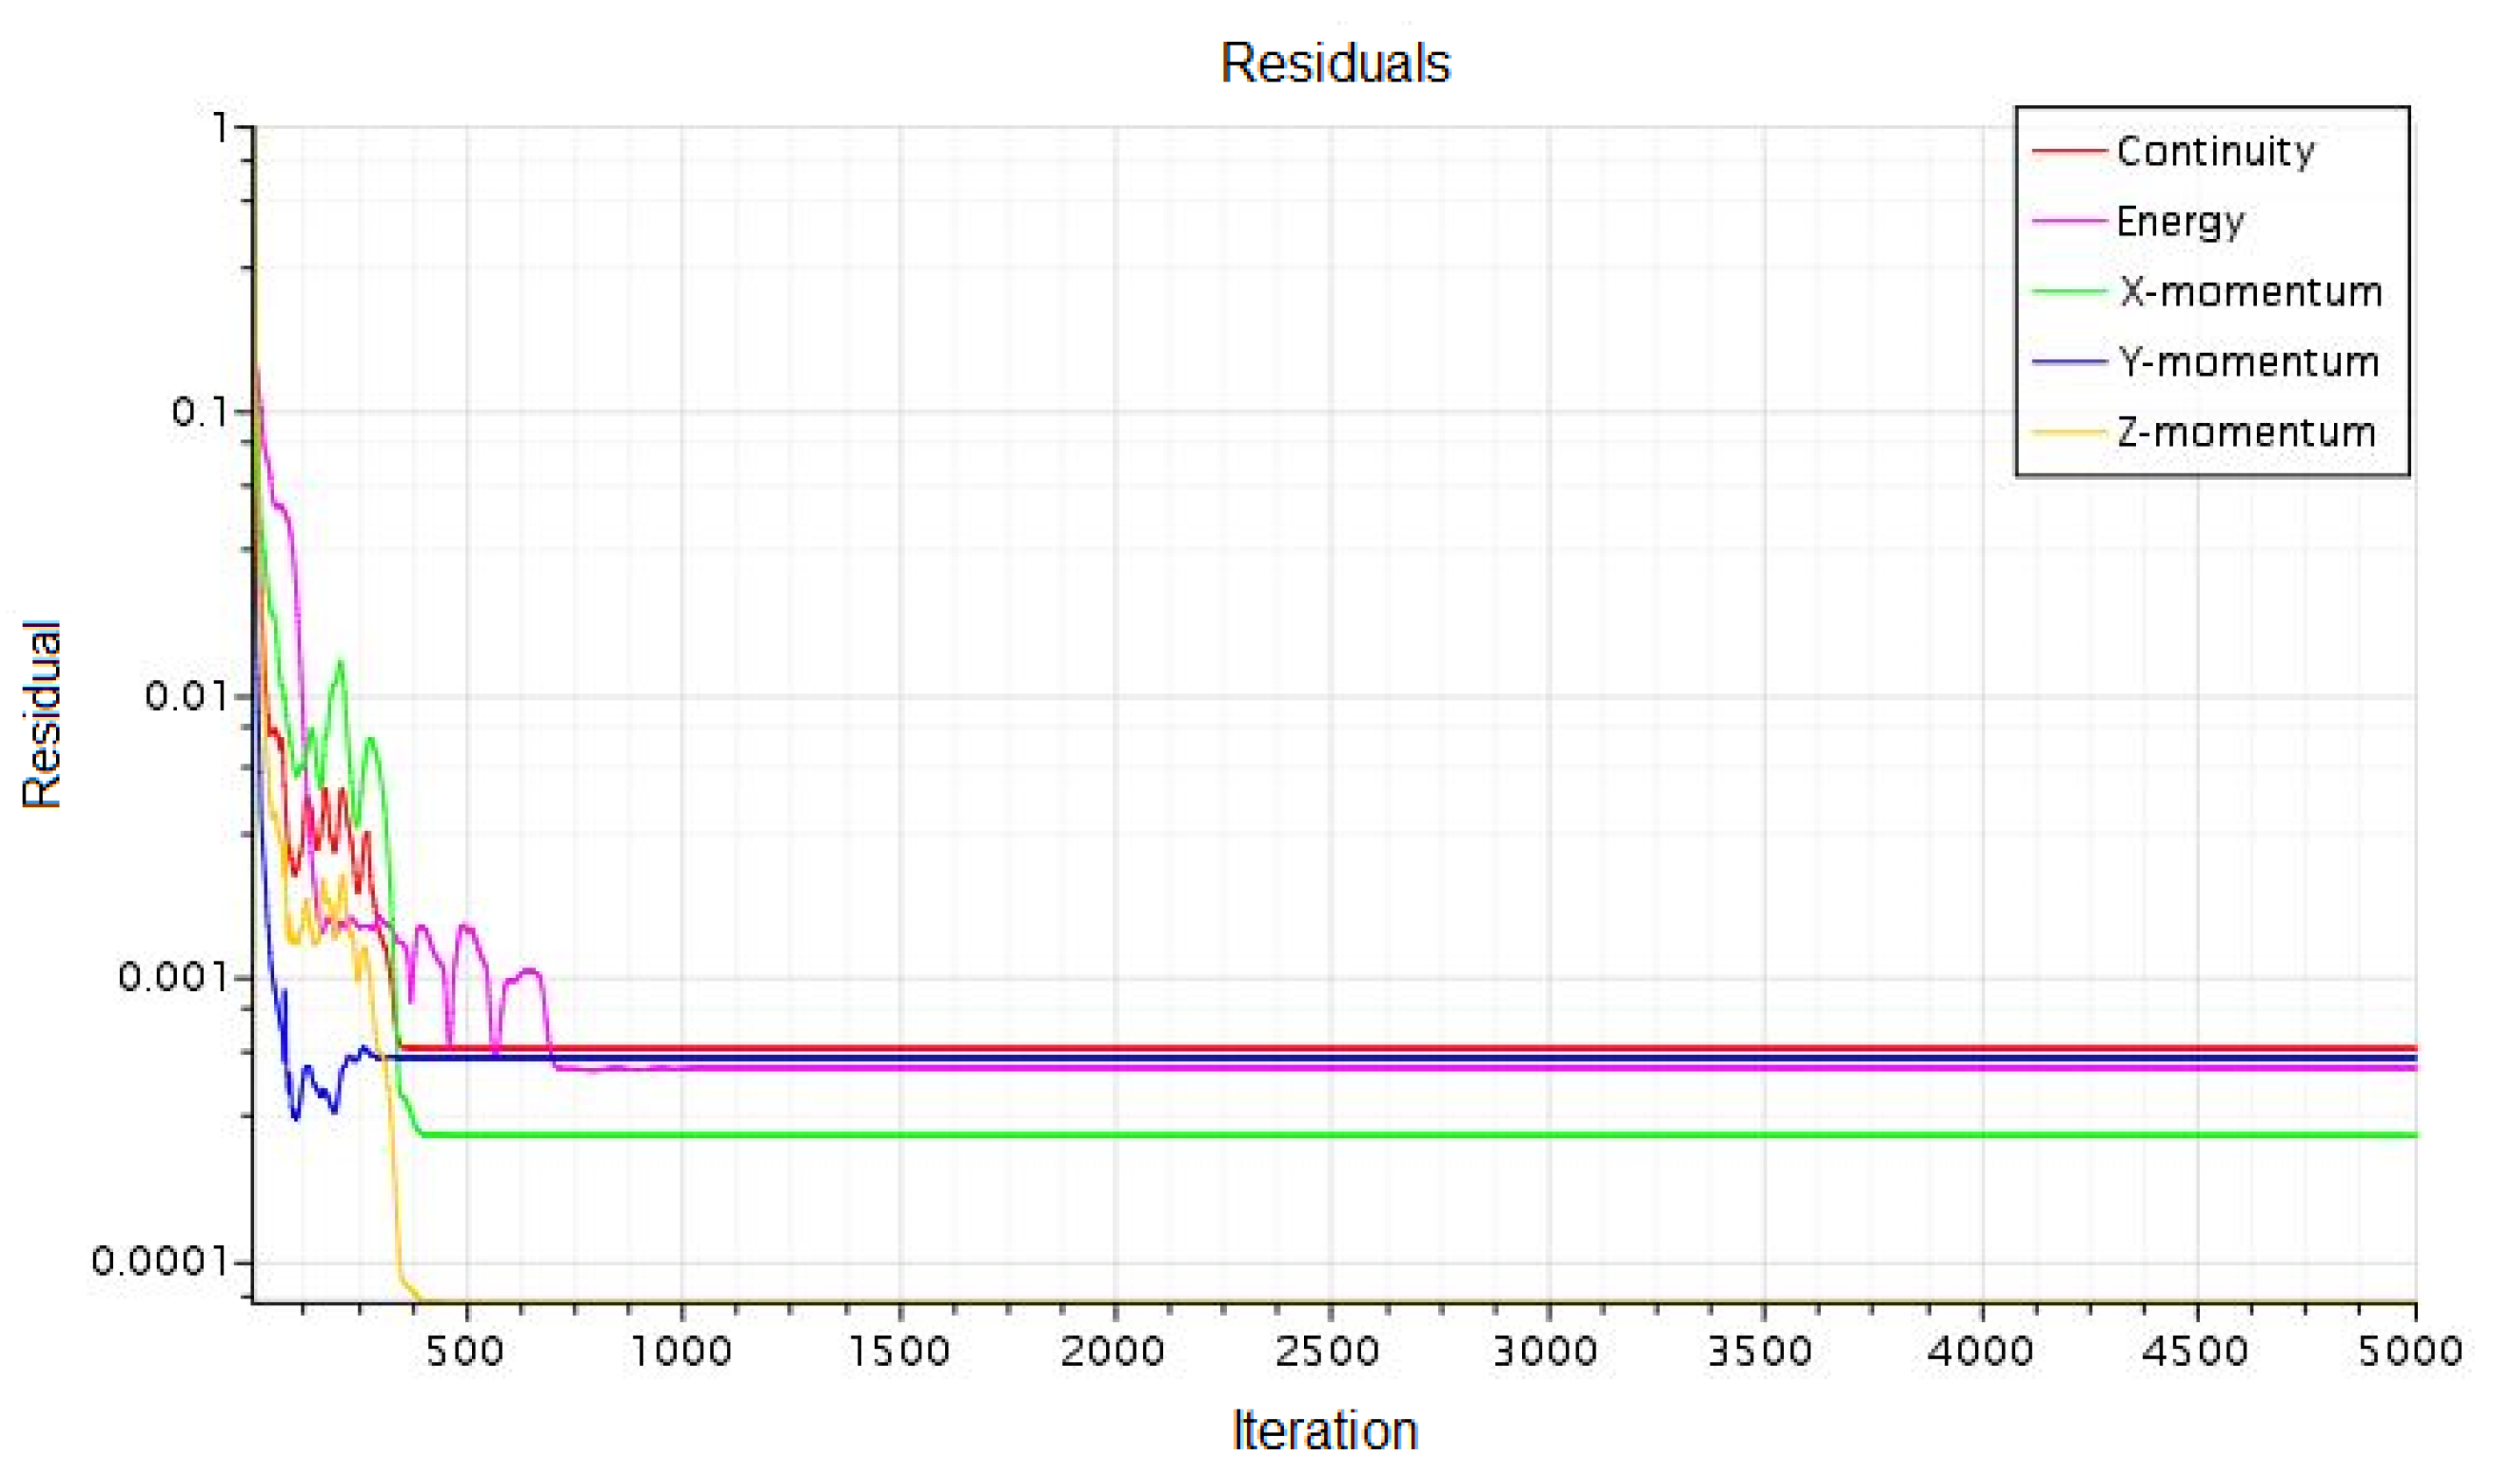
As shown in Figure 7, to ensure the reliability of the results of every case calculation, 5000 iterations were conducted, although the results converged before 1000 iterations. The residual lines descended very smoothly and finally formed a straight line because of the pretty good mesh quality, and the residual fraction of the main properties at last reached 10−3 (%), which means that the error of each simulation step was quite small. All of these could ensure that the simulation results are accurate enough.
5. Numerical Results
5.1. Temperature Distribution of the Modules
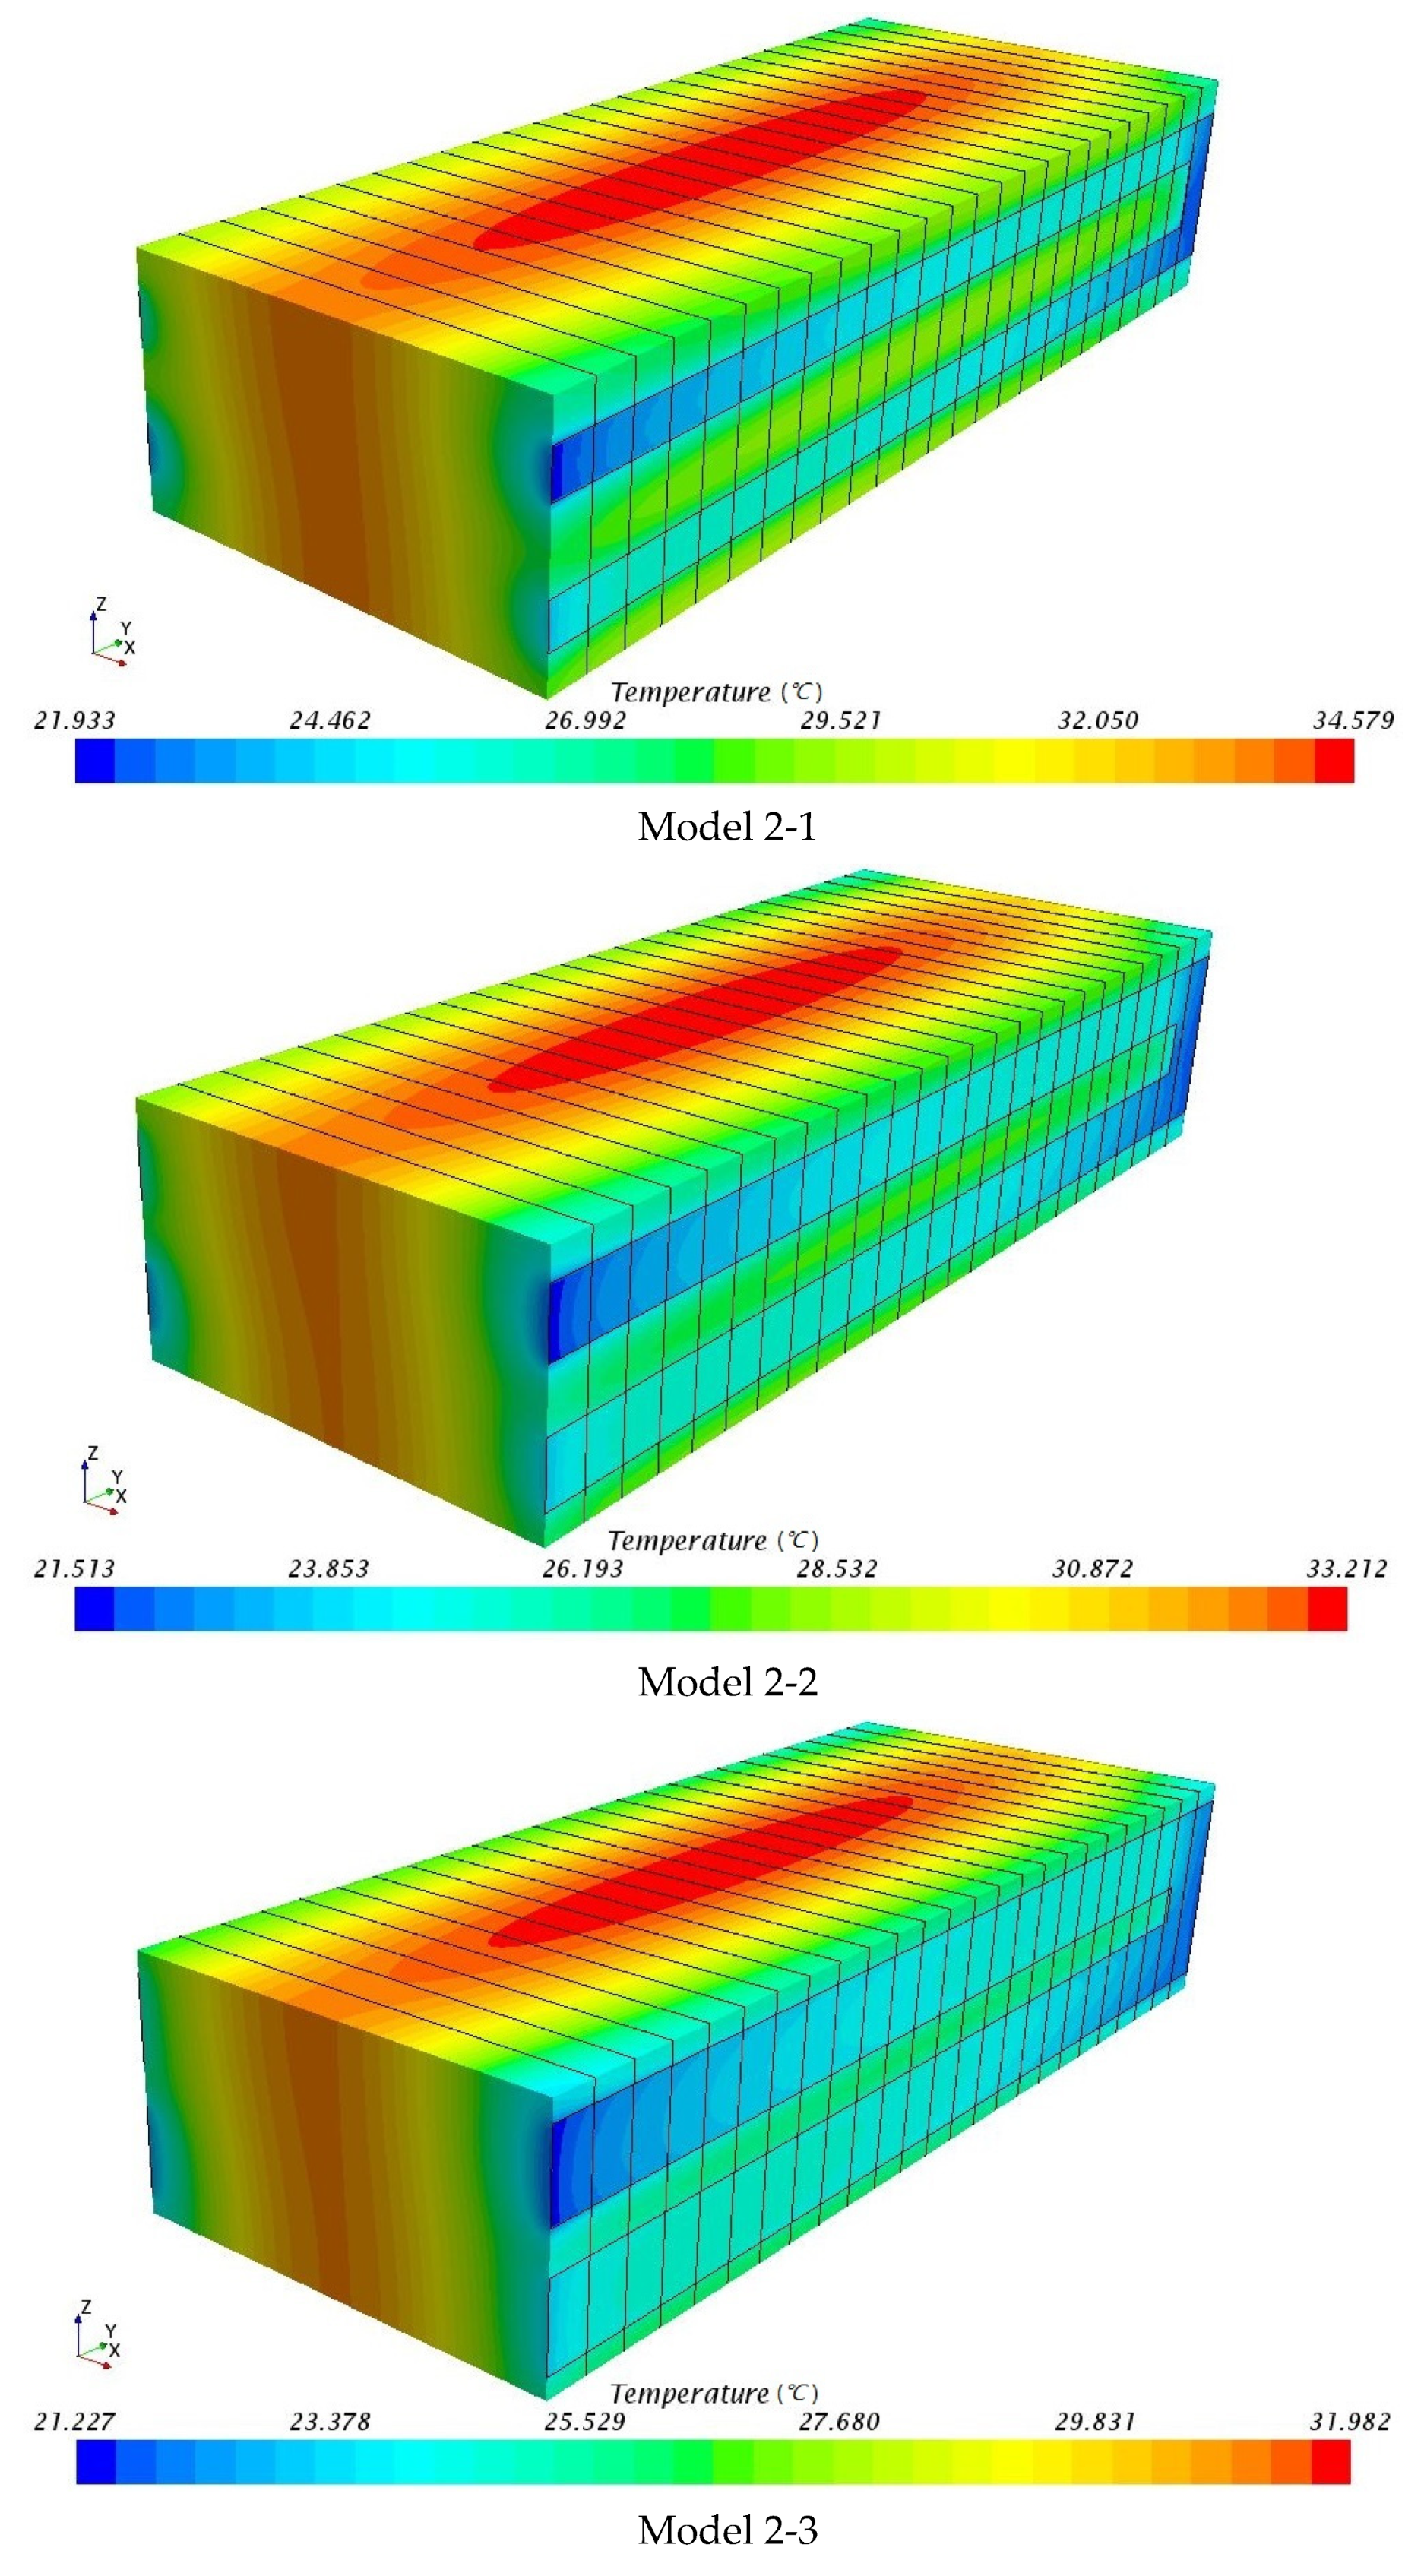
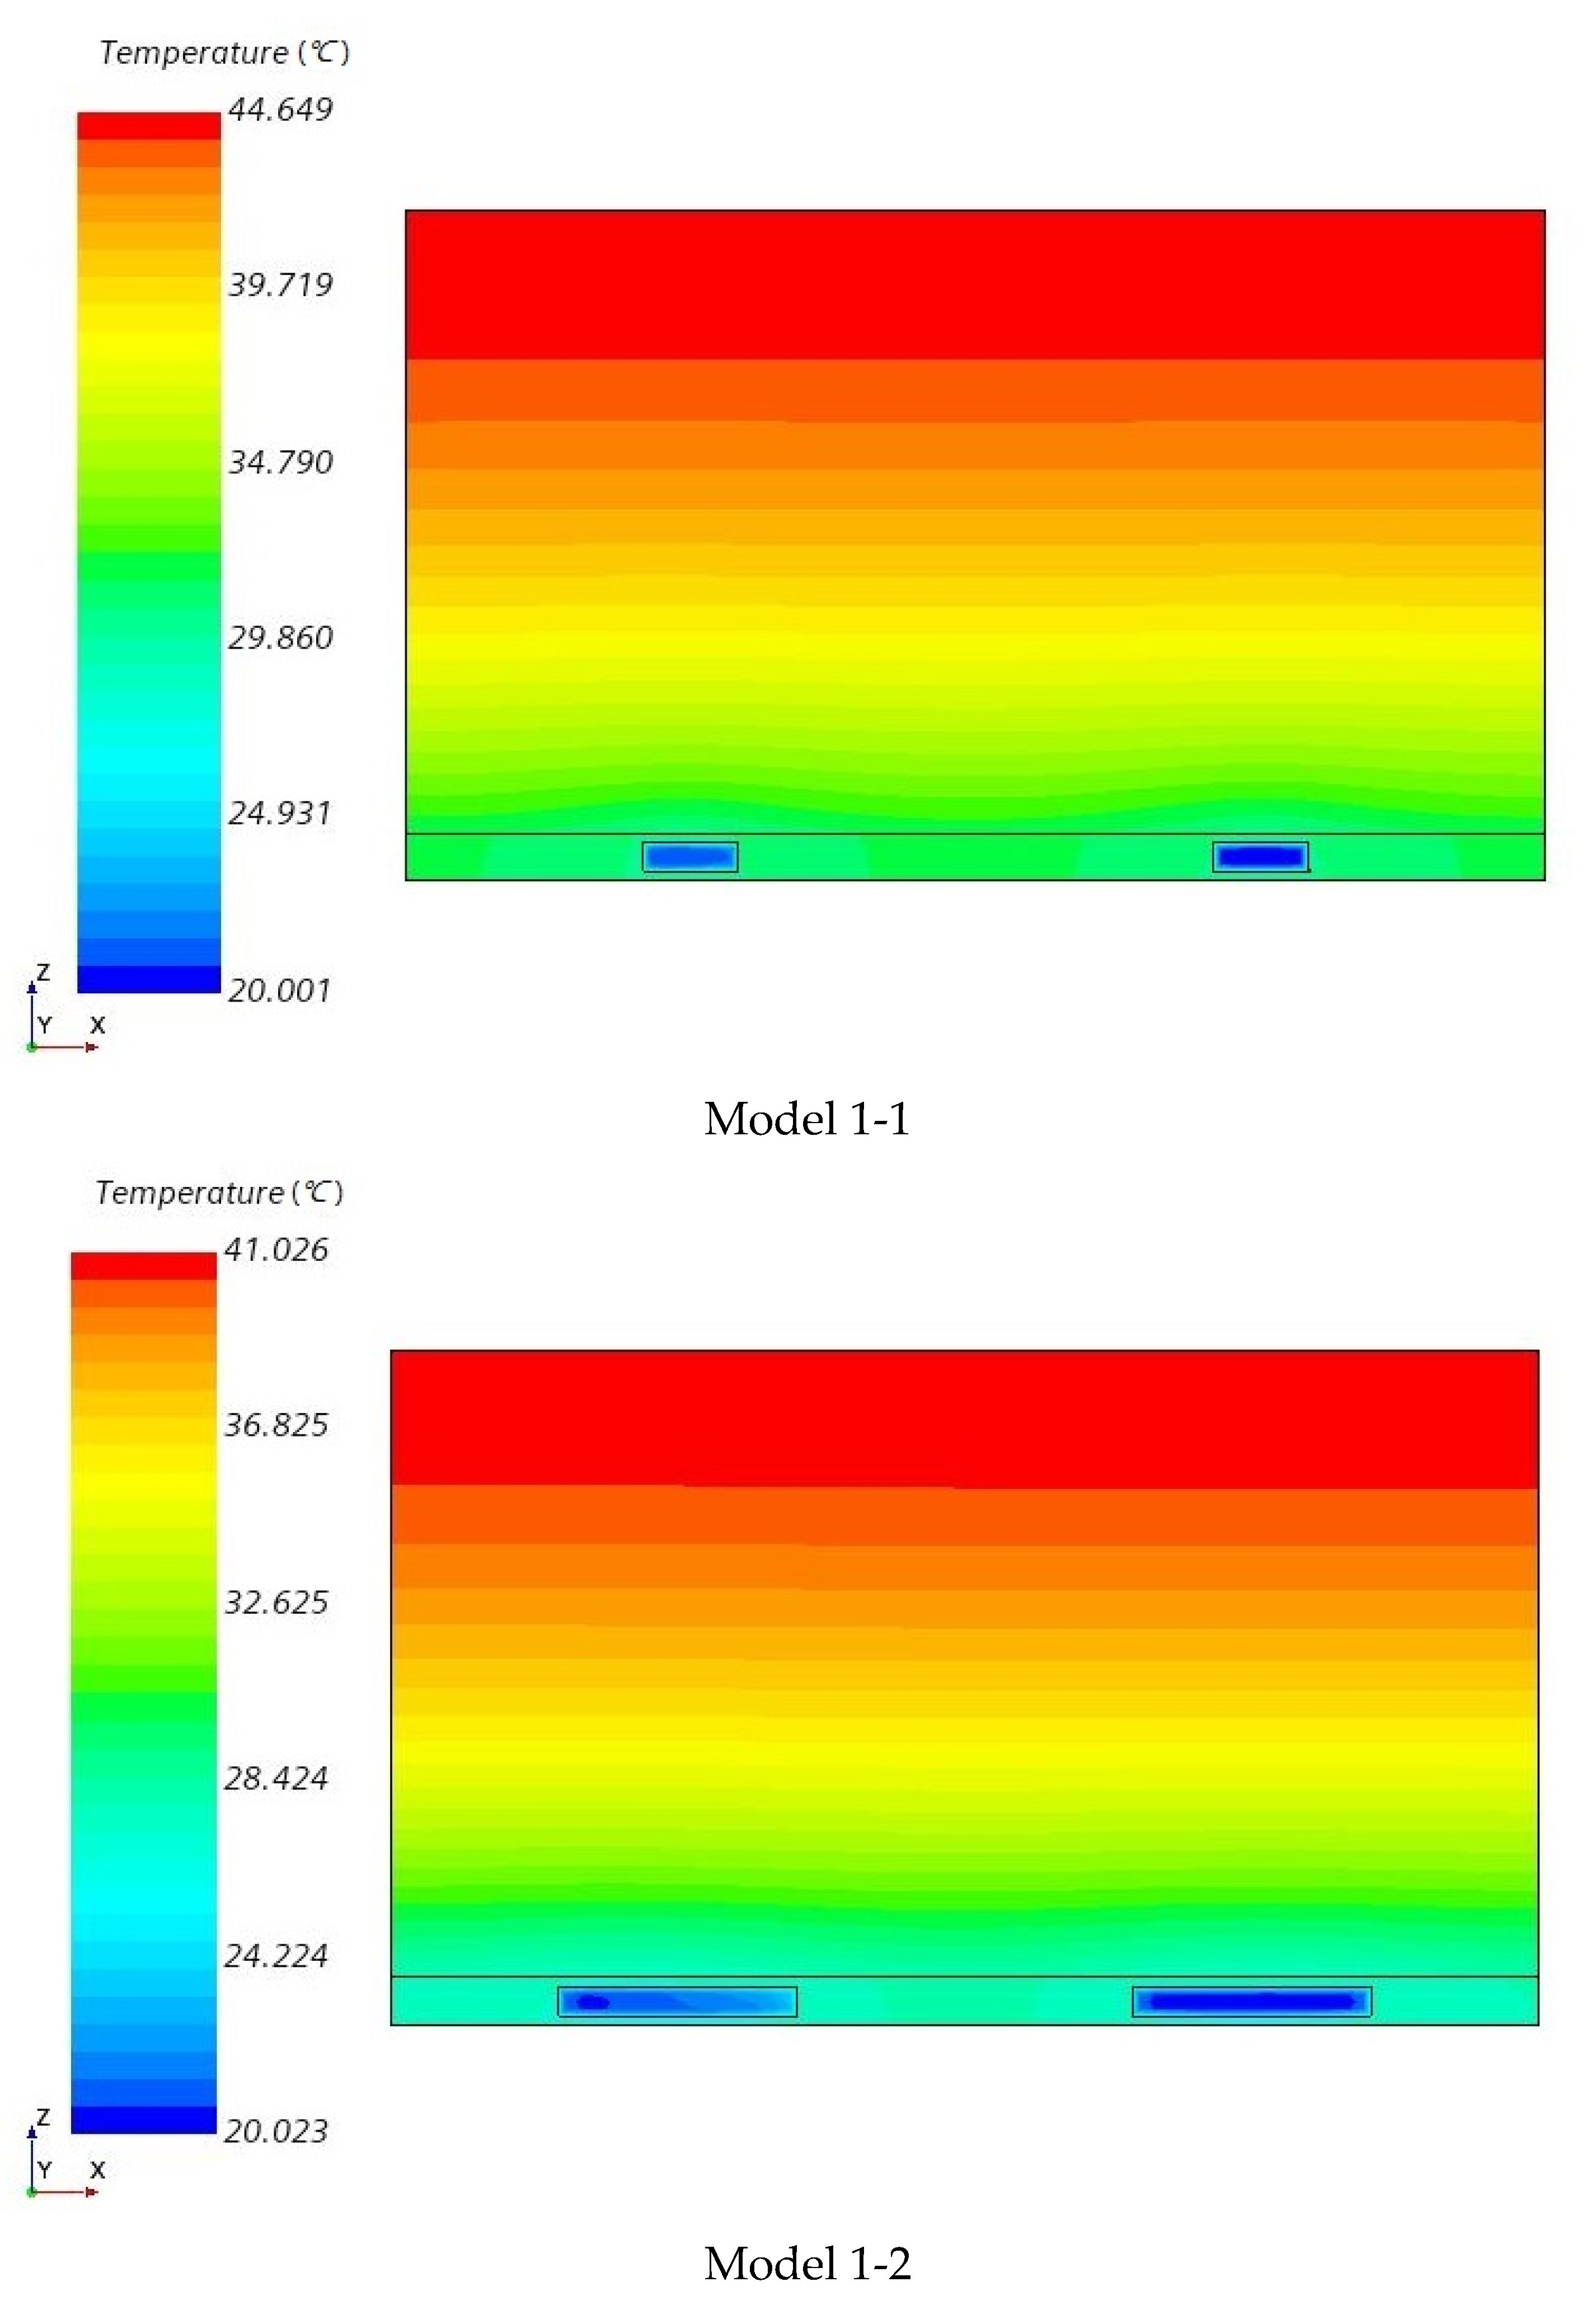
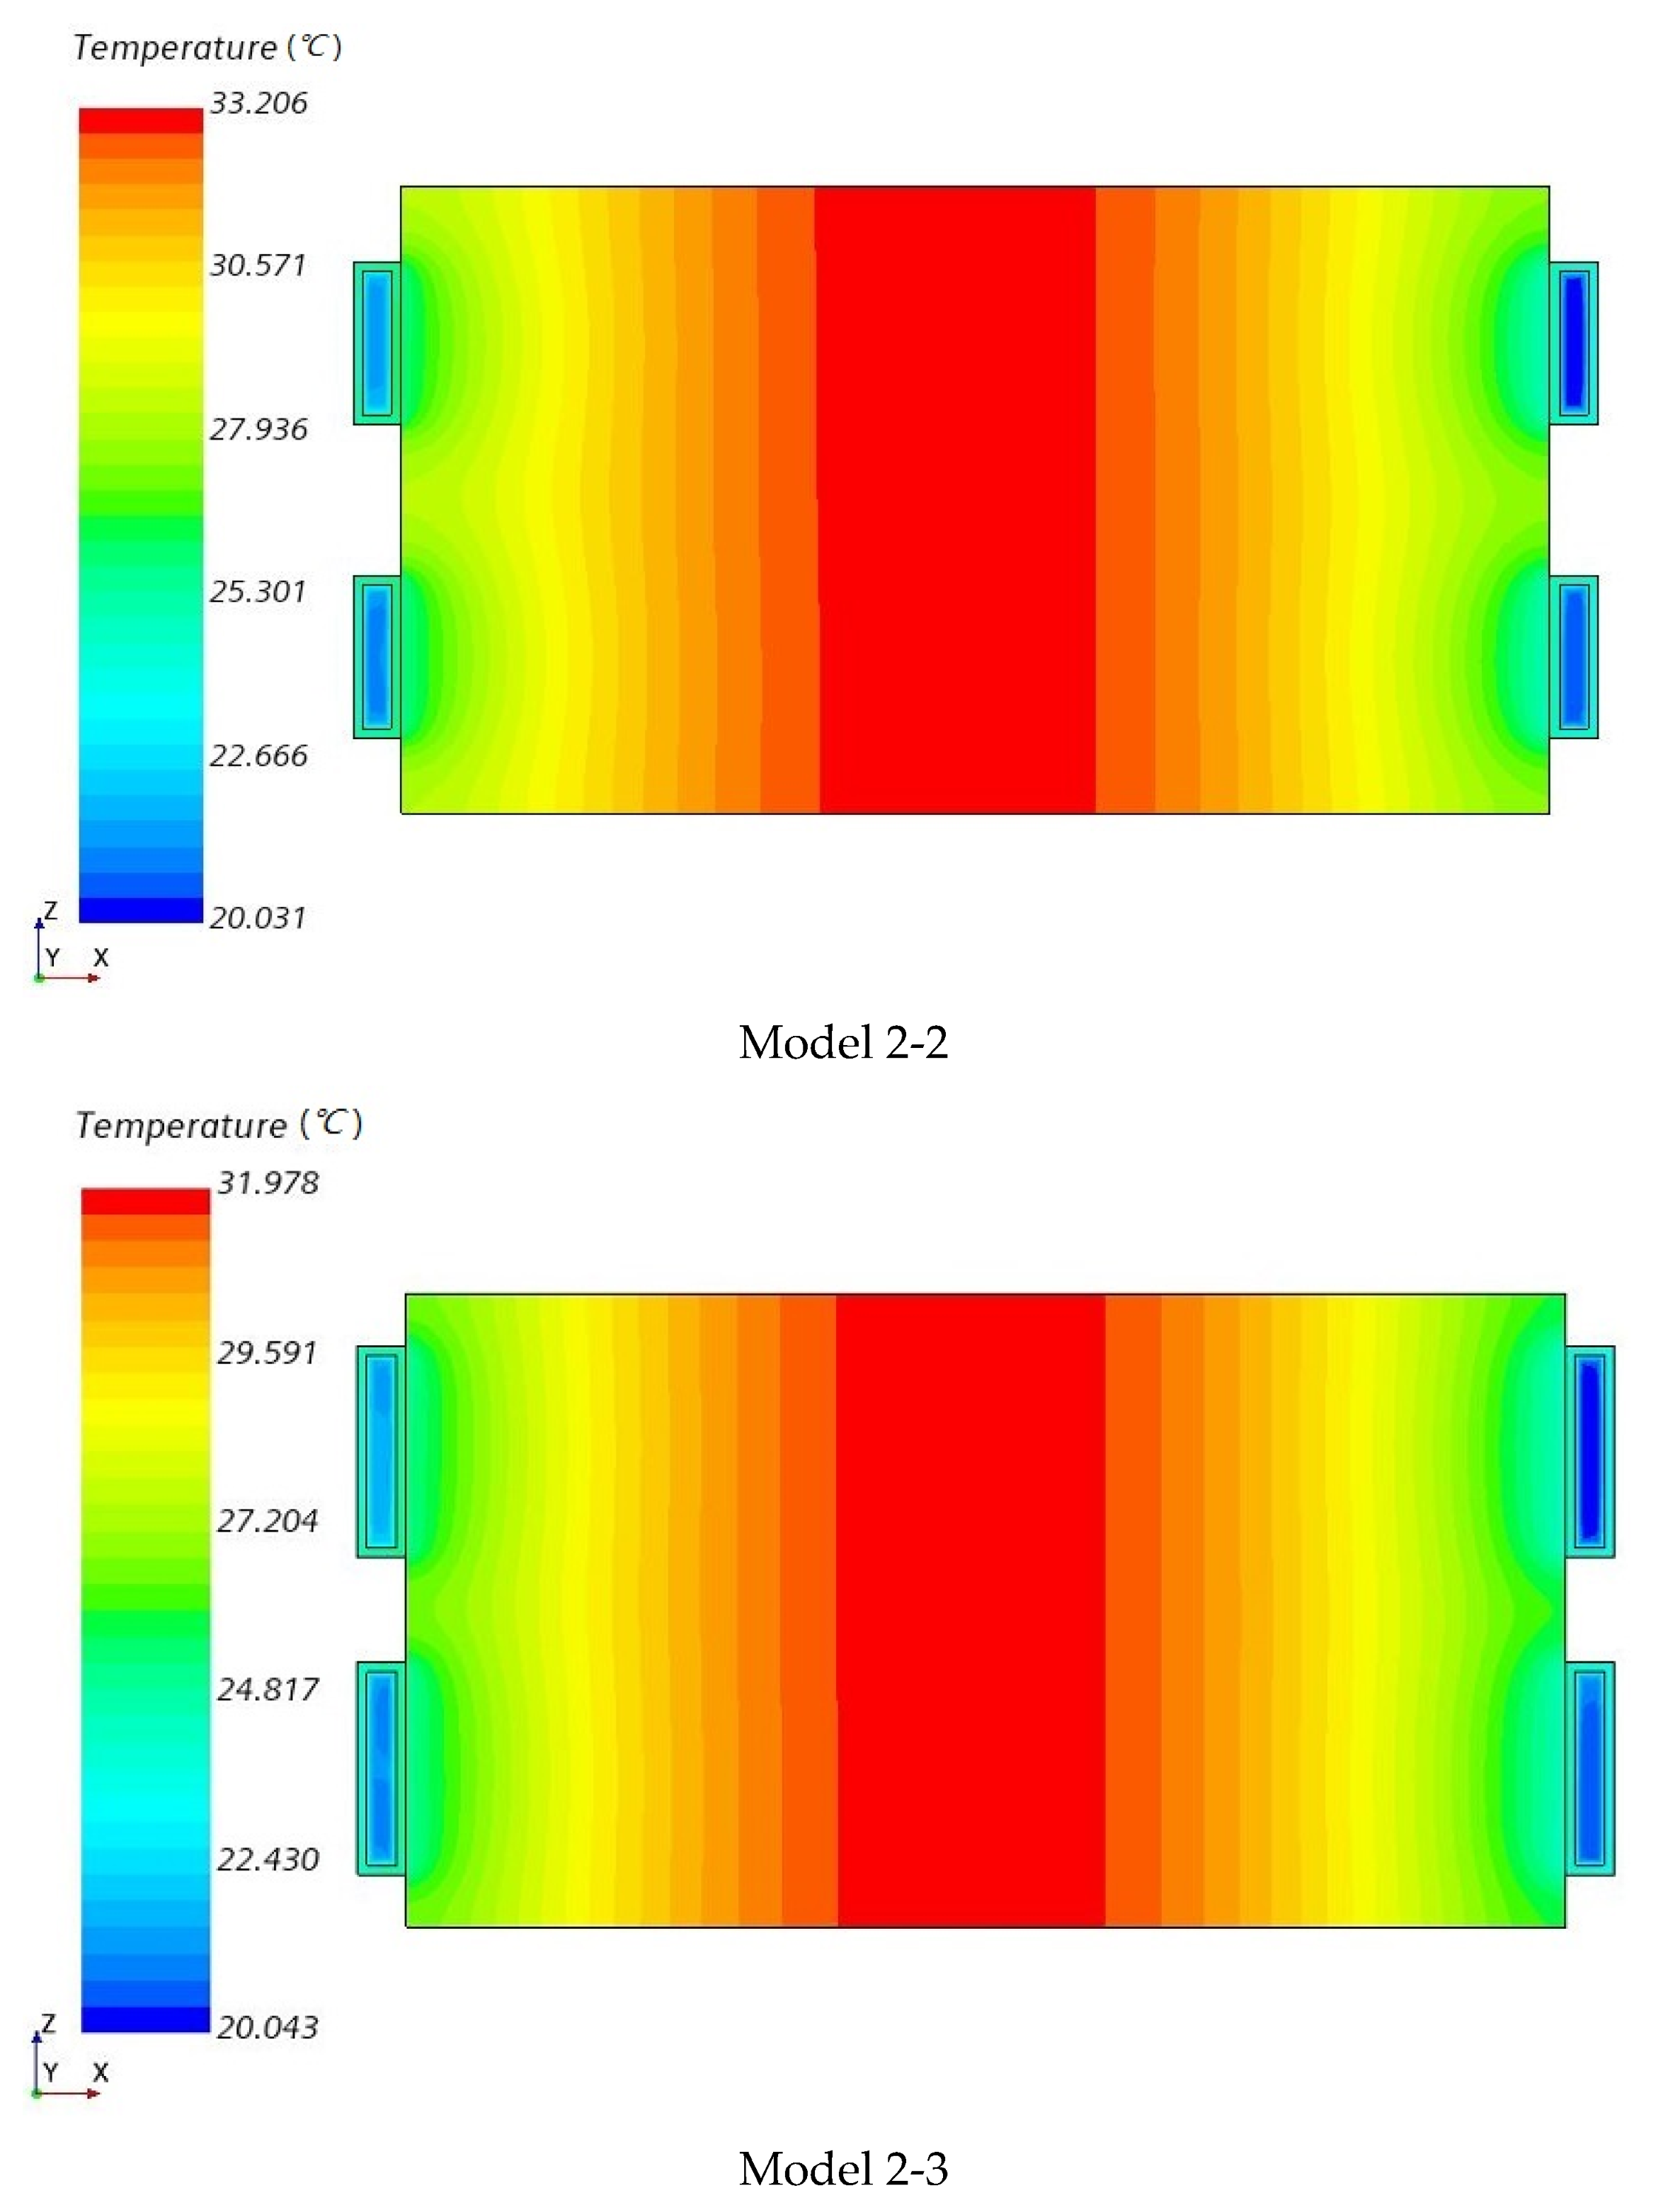
The temperature distributions of all six models are shown in Figure 8 and Figure 9. Through the difference in the maximum temperatures and the shape of the temperature distribution, it is clear that the effect of the cooling system at different positions is very different.
As shown in Figure 8 and Figure 9, a higher temperature is widely distributed on the top sides of the modules with the bottom cooling system compared to those of the side cooling system. It is estimated that the side cooling system is much better than the bottom cooling system in terms of the equilibrium of the temperature distribution of the battery module.
5.2. Temperature Distribution on the Cross-Section Area of the Modules
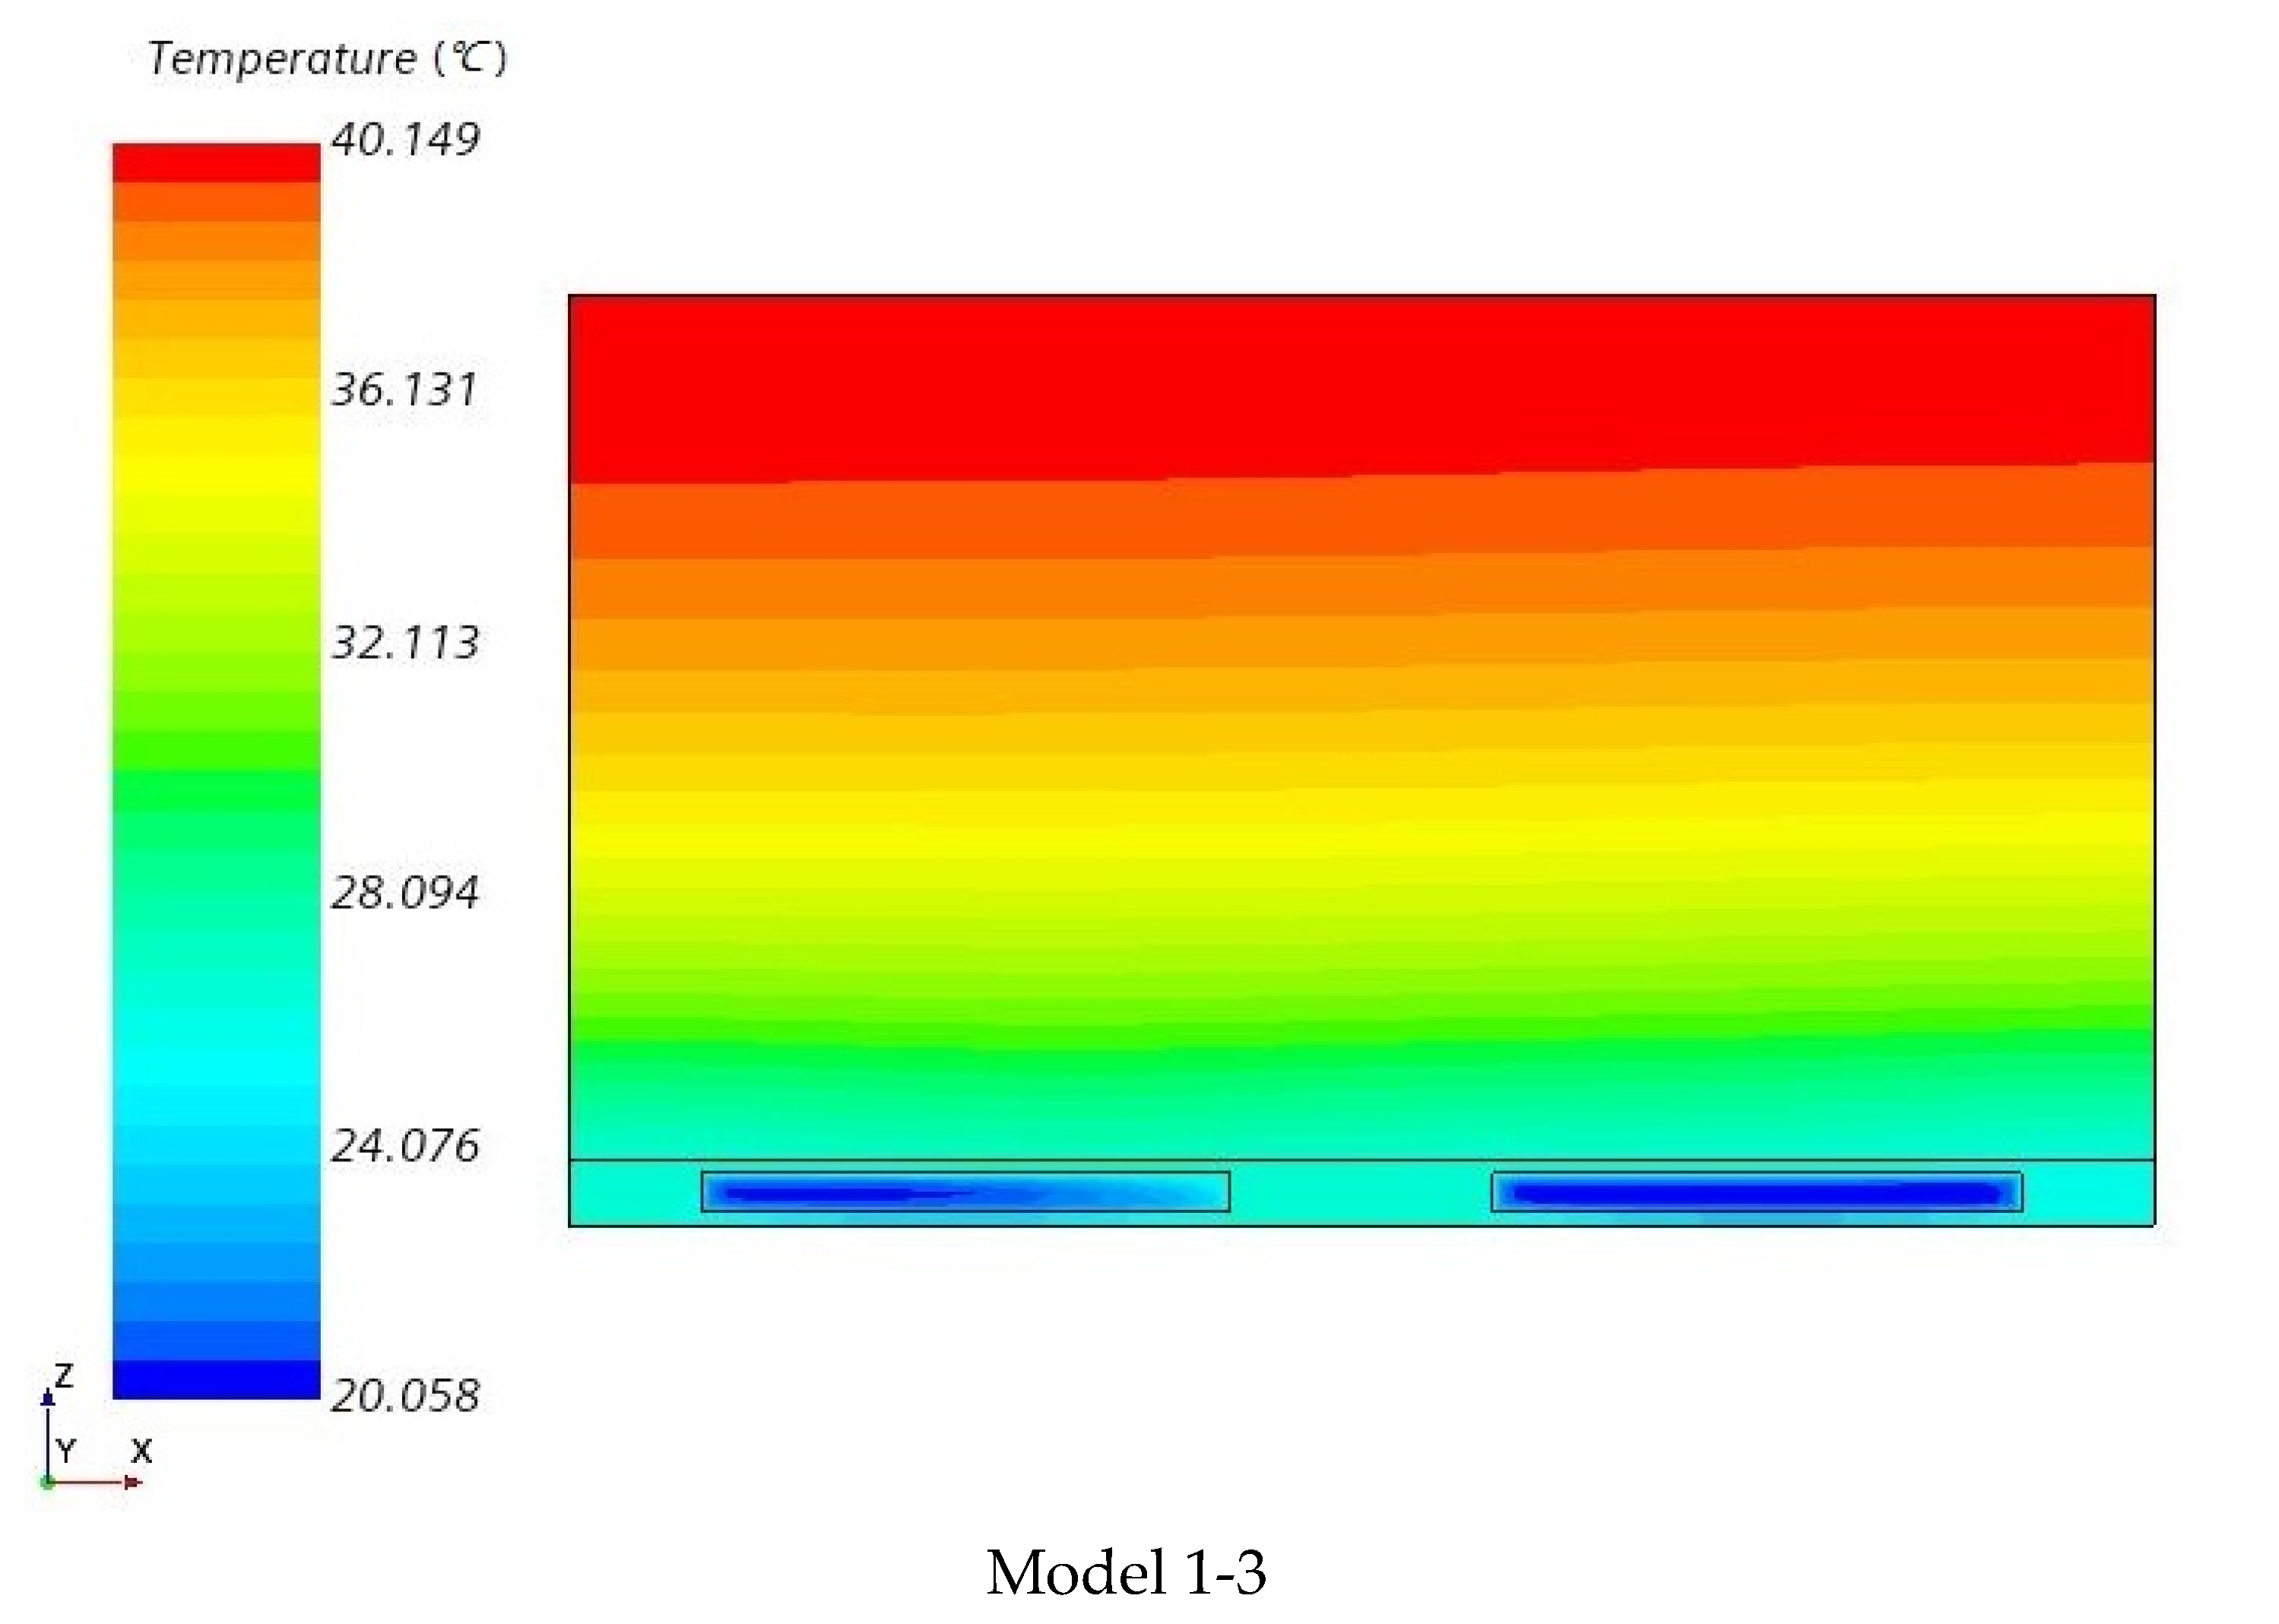
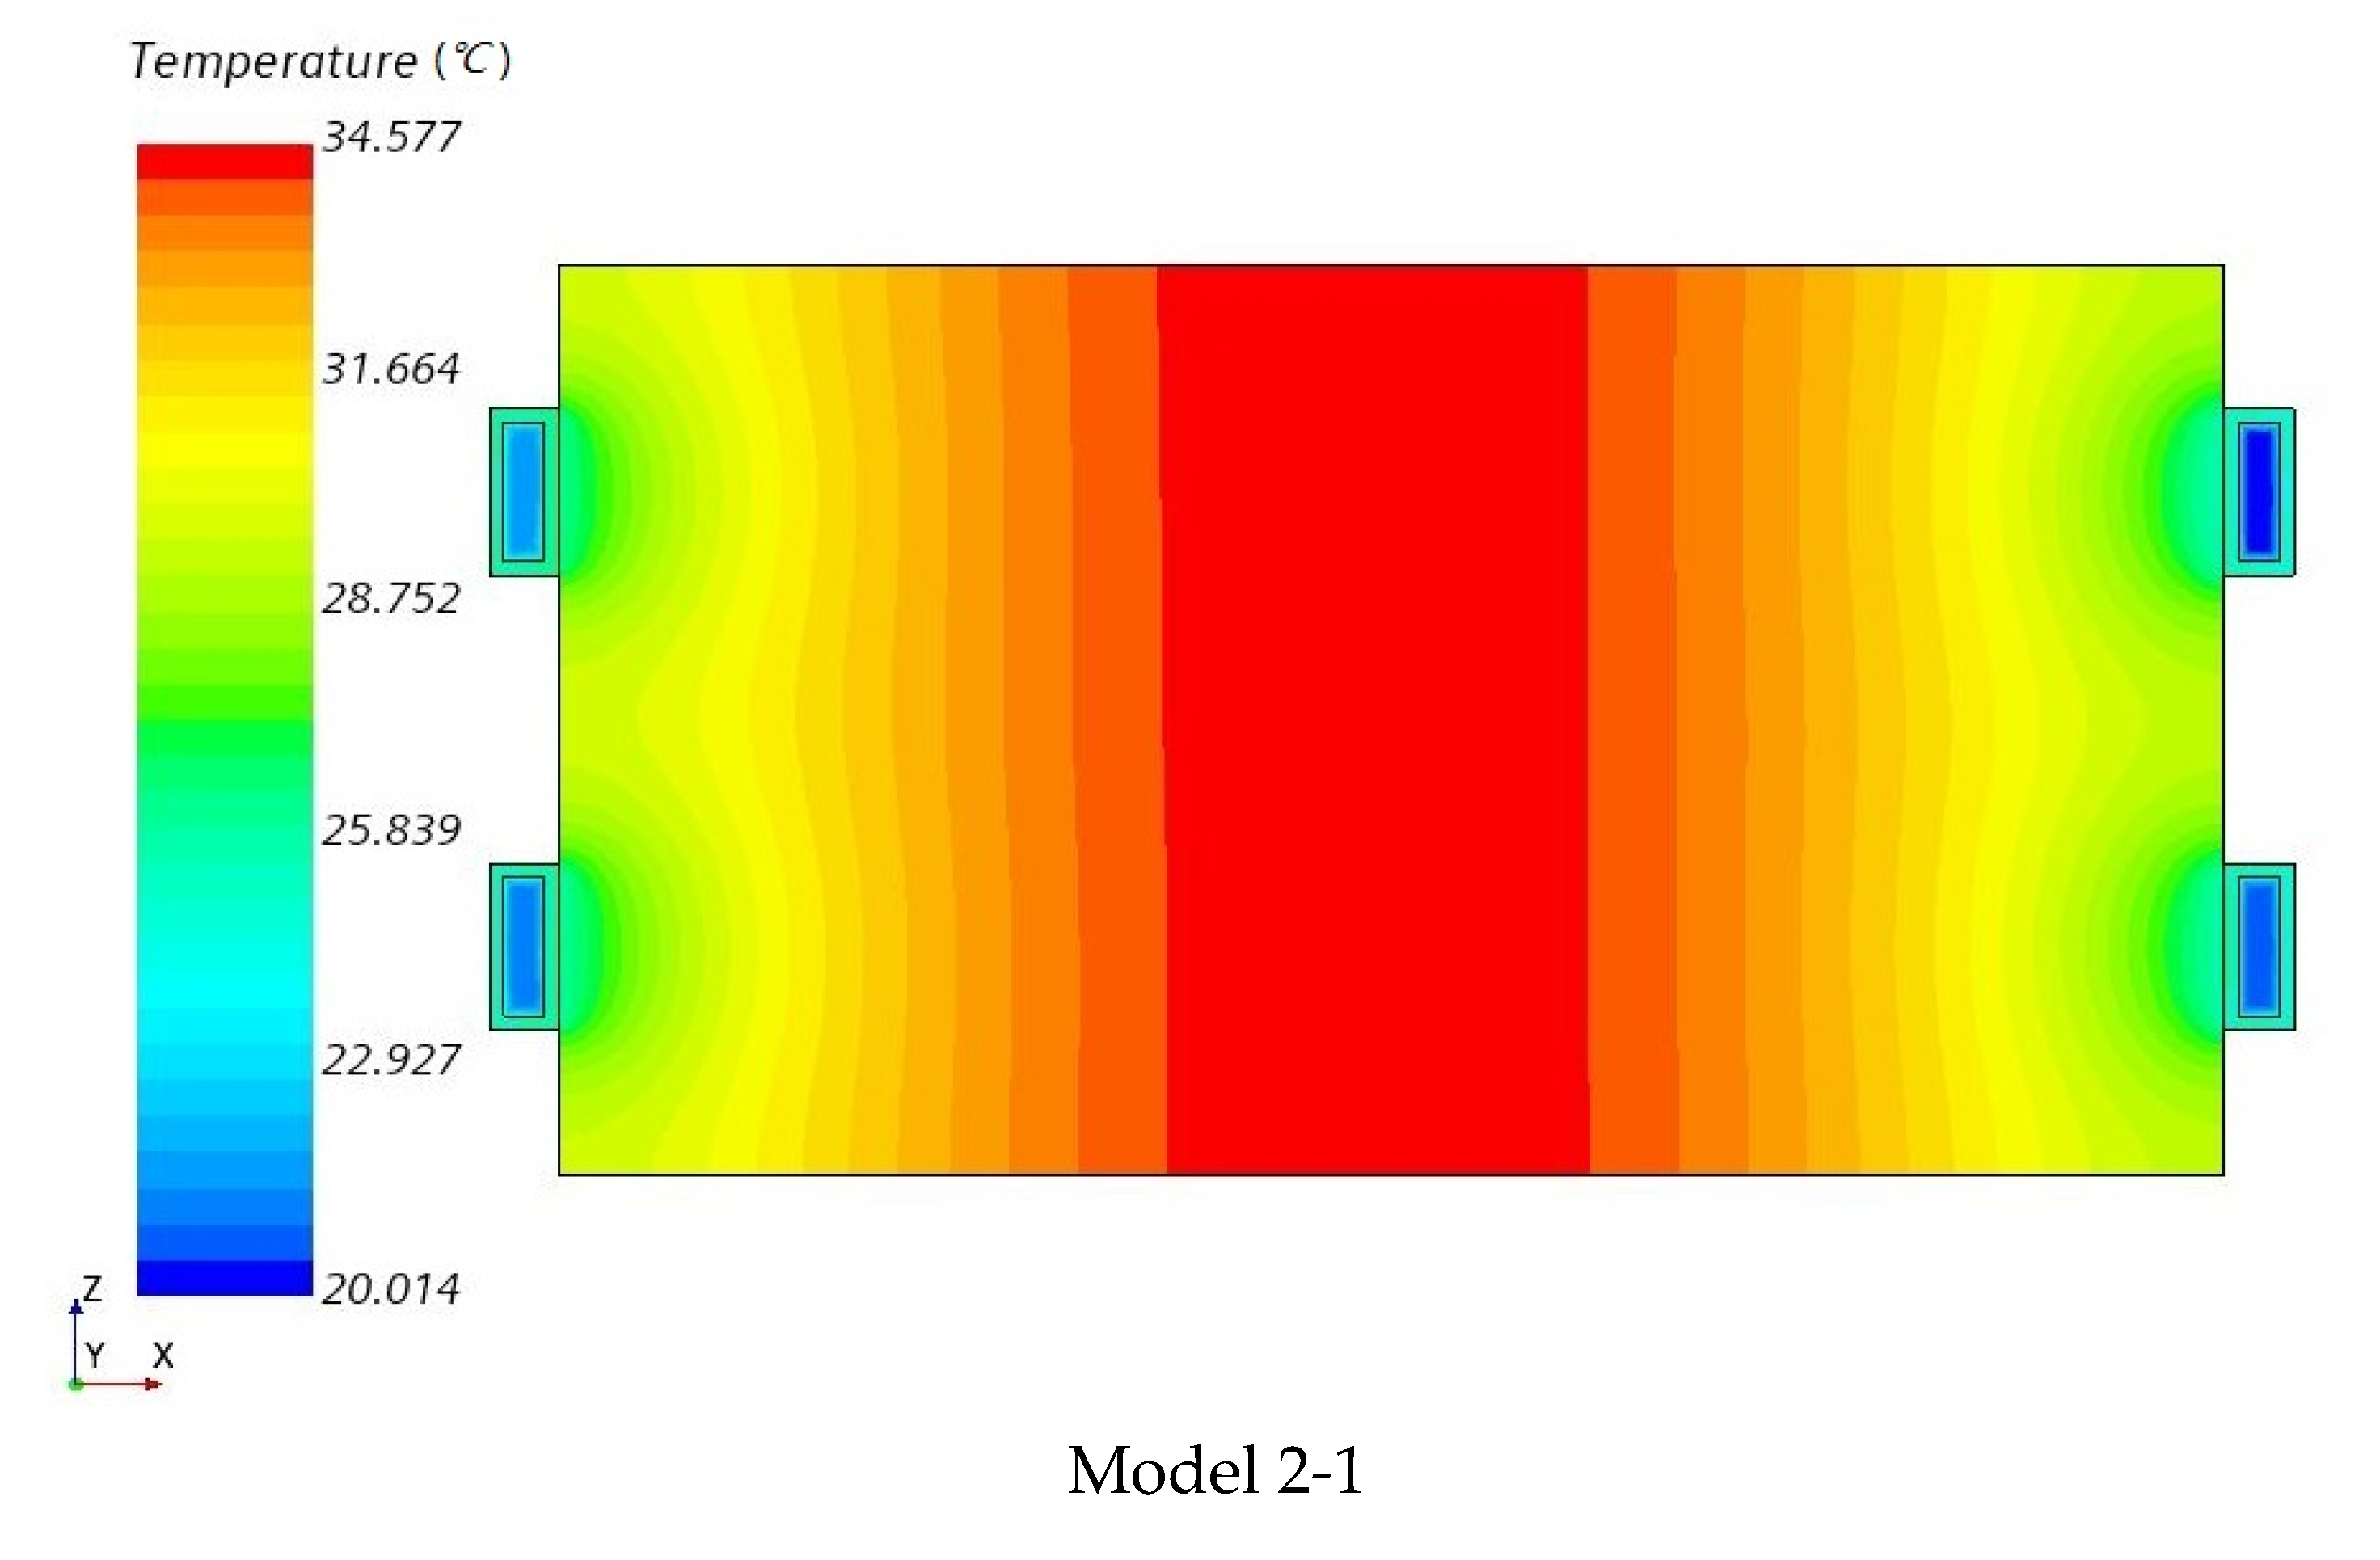
Figure 10 and Figure 11 show the temperature distributions on the cross-section area of the models in the middle of the longitudinal direction. From this angle, the difference in the cooling effect caused by the different cooling system positions can be seen more clearly.
These figures show that the gradient of the temperature distribution in a single cell is very deep in the z-direction for the bottom cooling system. However, for the side cooling system, lower temperatures are distributed on both side ends of the cell and higher temperatures are found in the middle.
These results indicate that with the proper flow rate control of the coolant, the gradient of the temperature distribution can be controlled to improve the performance and life cycle of the battery.
6. Analysis and Comparison
This study aimed to compare the cooling effect of two different cooling systems. To evaluate the cooling effect, the maximum temperature, temperature difference, and heat transfer conductance of the battery module are all important considerations. The coolant channel area was also calculated to explore the relationship between the coolant channel area and cooling effect.
In the actual production process, it is relatively difficult to measure the temperature inside the cell; accordingly, the temperature on the top surface of the cell is usually recorded. Therefore, for the analysis of the results here, all temperature data in this paper were also taken from the top surface after cooling.
The maximum temperature reflects the specific temperature performance of the cooling system; the temperature difference is the temperature difference between the maximum temperature and the minimum temperature, and it indicates temperature uniformity between cells in the module, i.e., whether cells of the module are cooled evenly. The heat transfer conductance is another important parameter in the evaluation of the performance of the cooling system. The coolant channel area here specifically refers to the area in contact with the modules.
6.1. Max Temperature and the Temperature Differences in the Modules
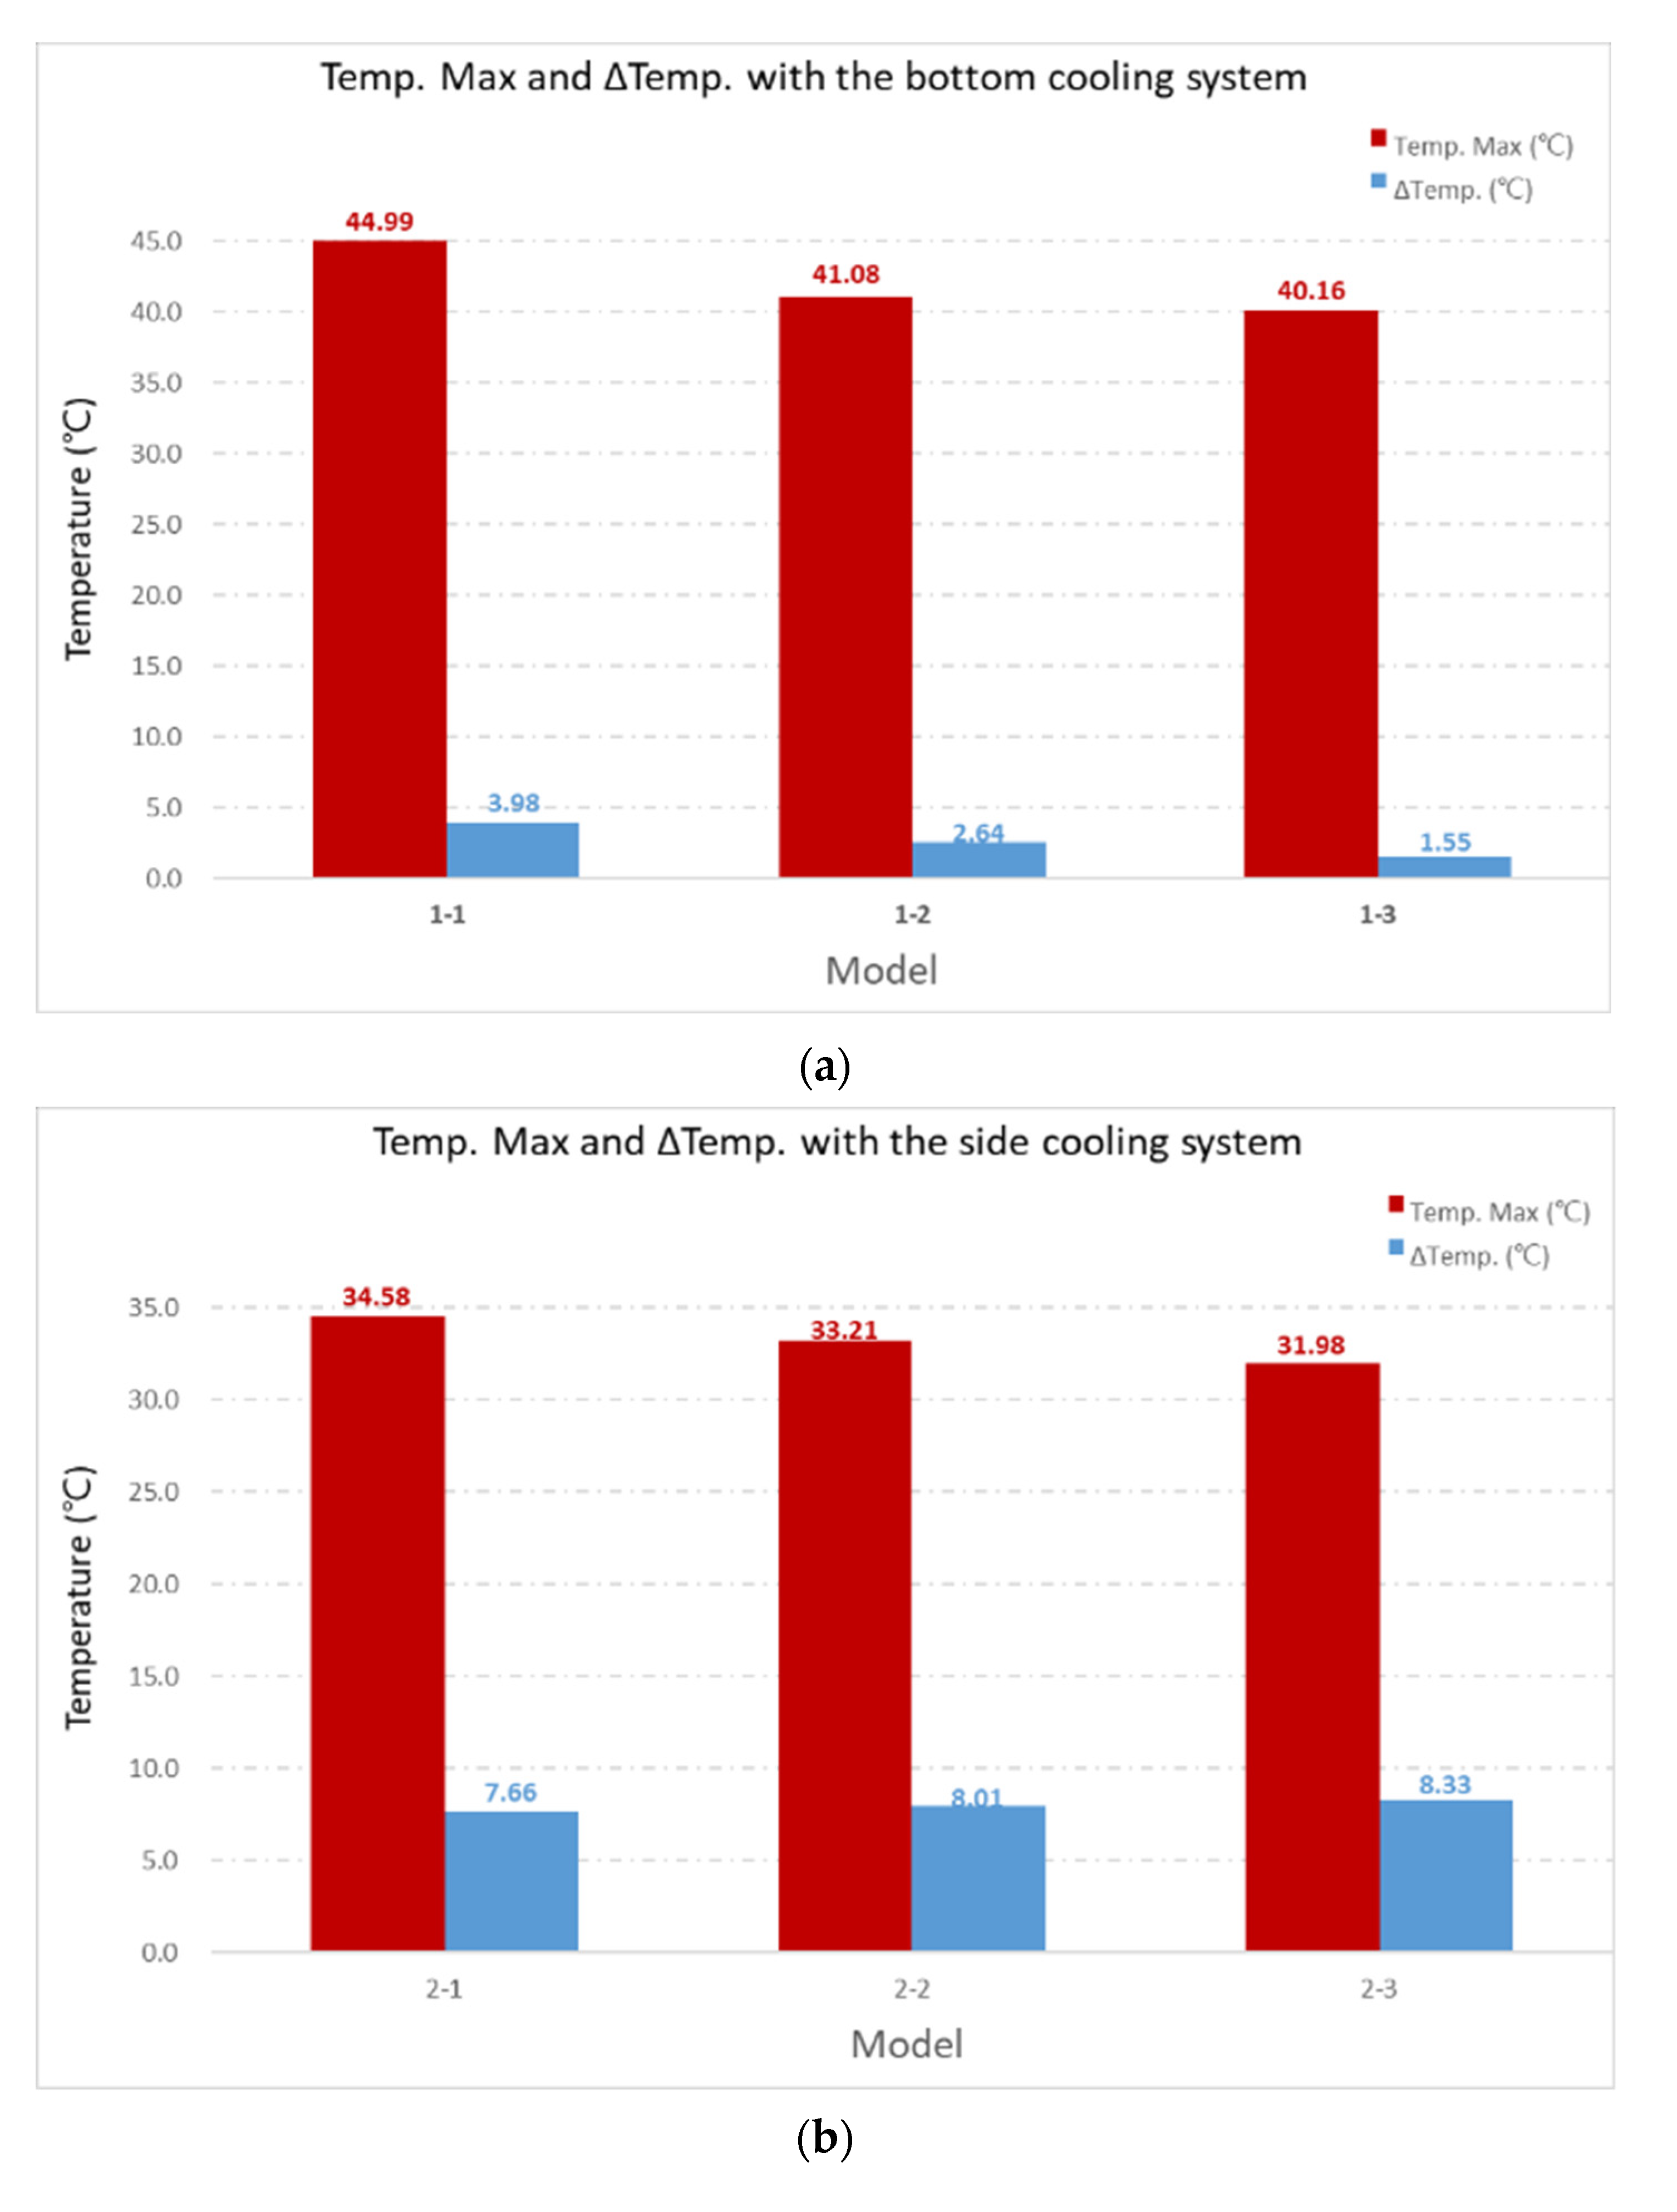
Both the maximum temperature and temperature difference of the three models with the bottom cooling system and the three models with the side cooling system are shown in Figure 12.
As shown in Figure 12, for the three models with the bottom cooling system, all the maximum temperatures of the module exceed 40 °C, and the temperature difference is less than 4 °C. Model 1-1 shows the highest temperature of nearly 45 °C and the lowest temperature difference of 4 °C. With an increase in the coolant channel width, both the maximum temperature and temperature difference become lower, as indicated with model 1-3, which shows the lowest temperature of 40 °C and temperature difference of 1.55 °C.
For the side cooling system, the maximum temperatures of all three models are less than 35 °C and the temperature differences exceed 7.5 °C. Regarding the maximum temperature, the highest appears on model 2-1, and the lowest is found on model 2-3 with almost 32 °C. However, regarding the temperature difference, it becomes higher as the coolant channel width increases. The temperature difference of model 2-1 is the lowest at about 7.6 °C, while the biggest was found at 8.3 °C on model 2-3.
6.2. Cooling System Heat Transfer Conductance of the Modules
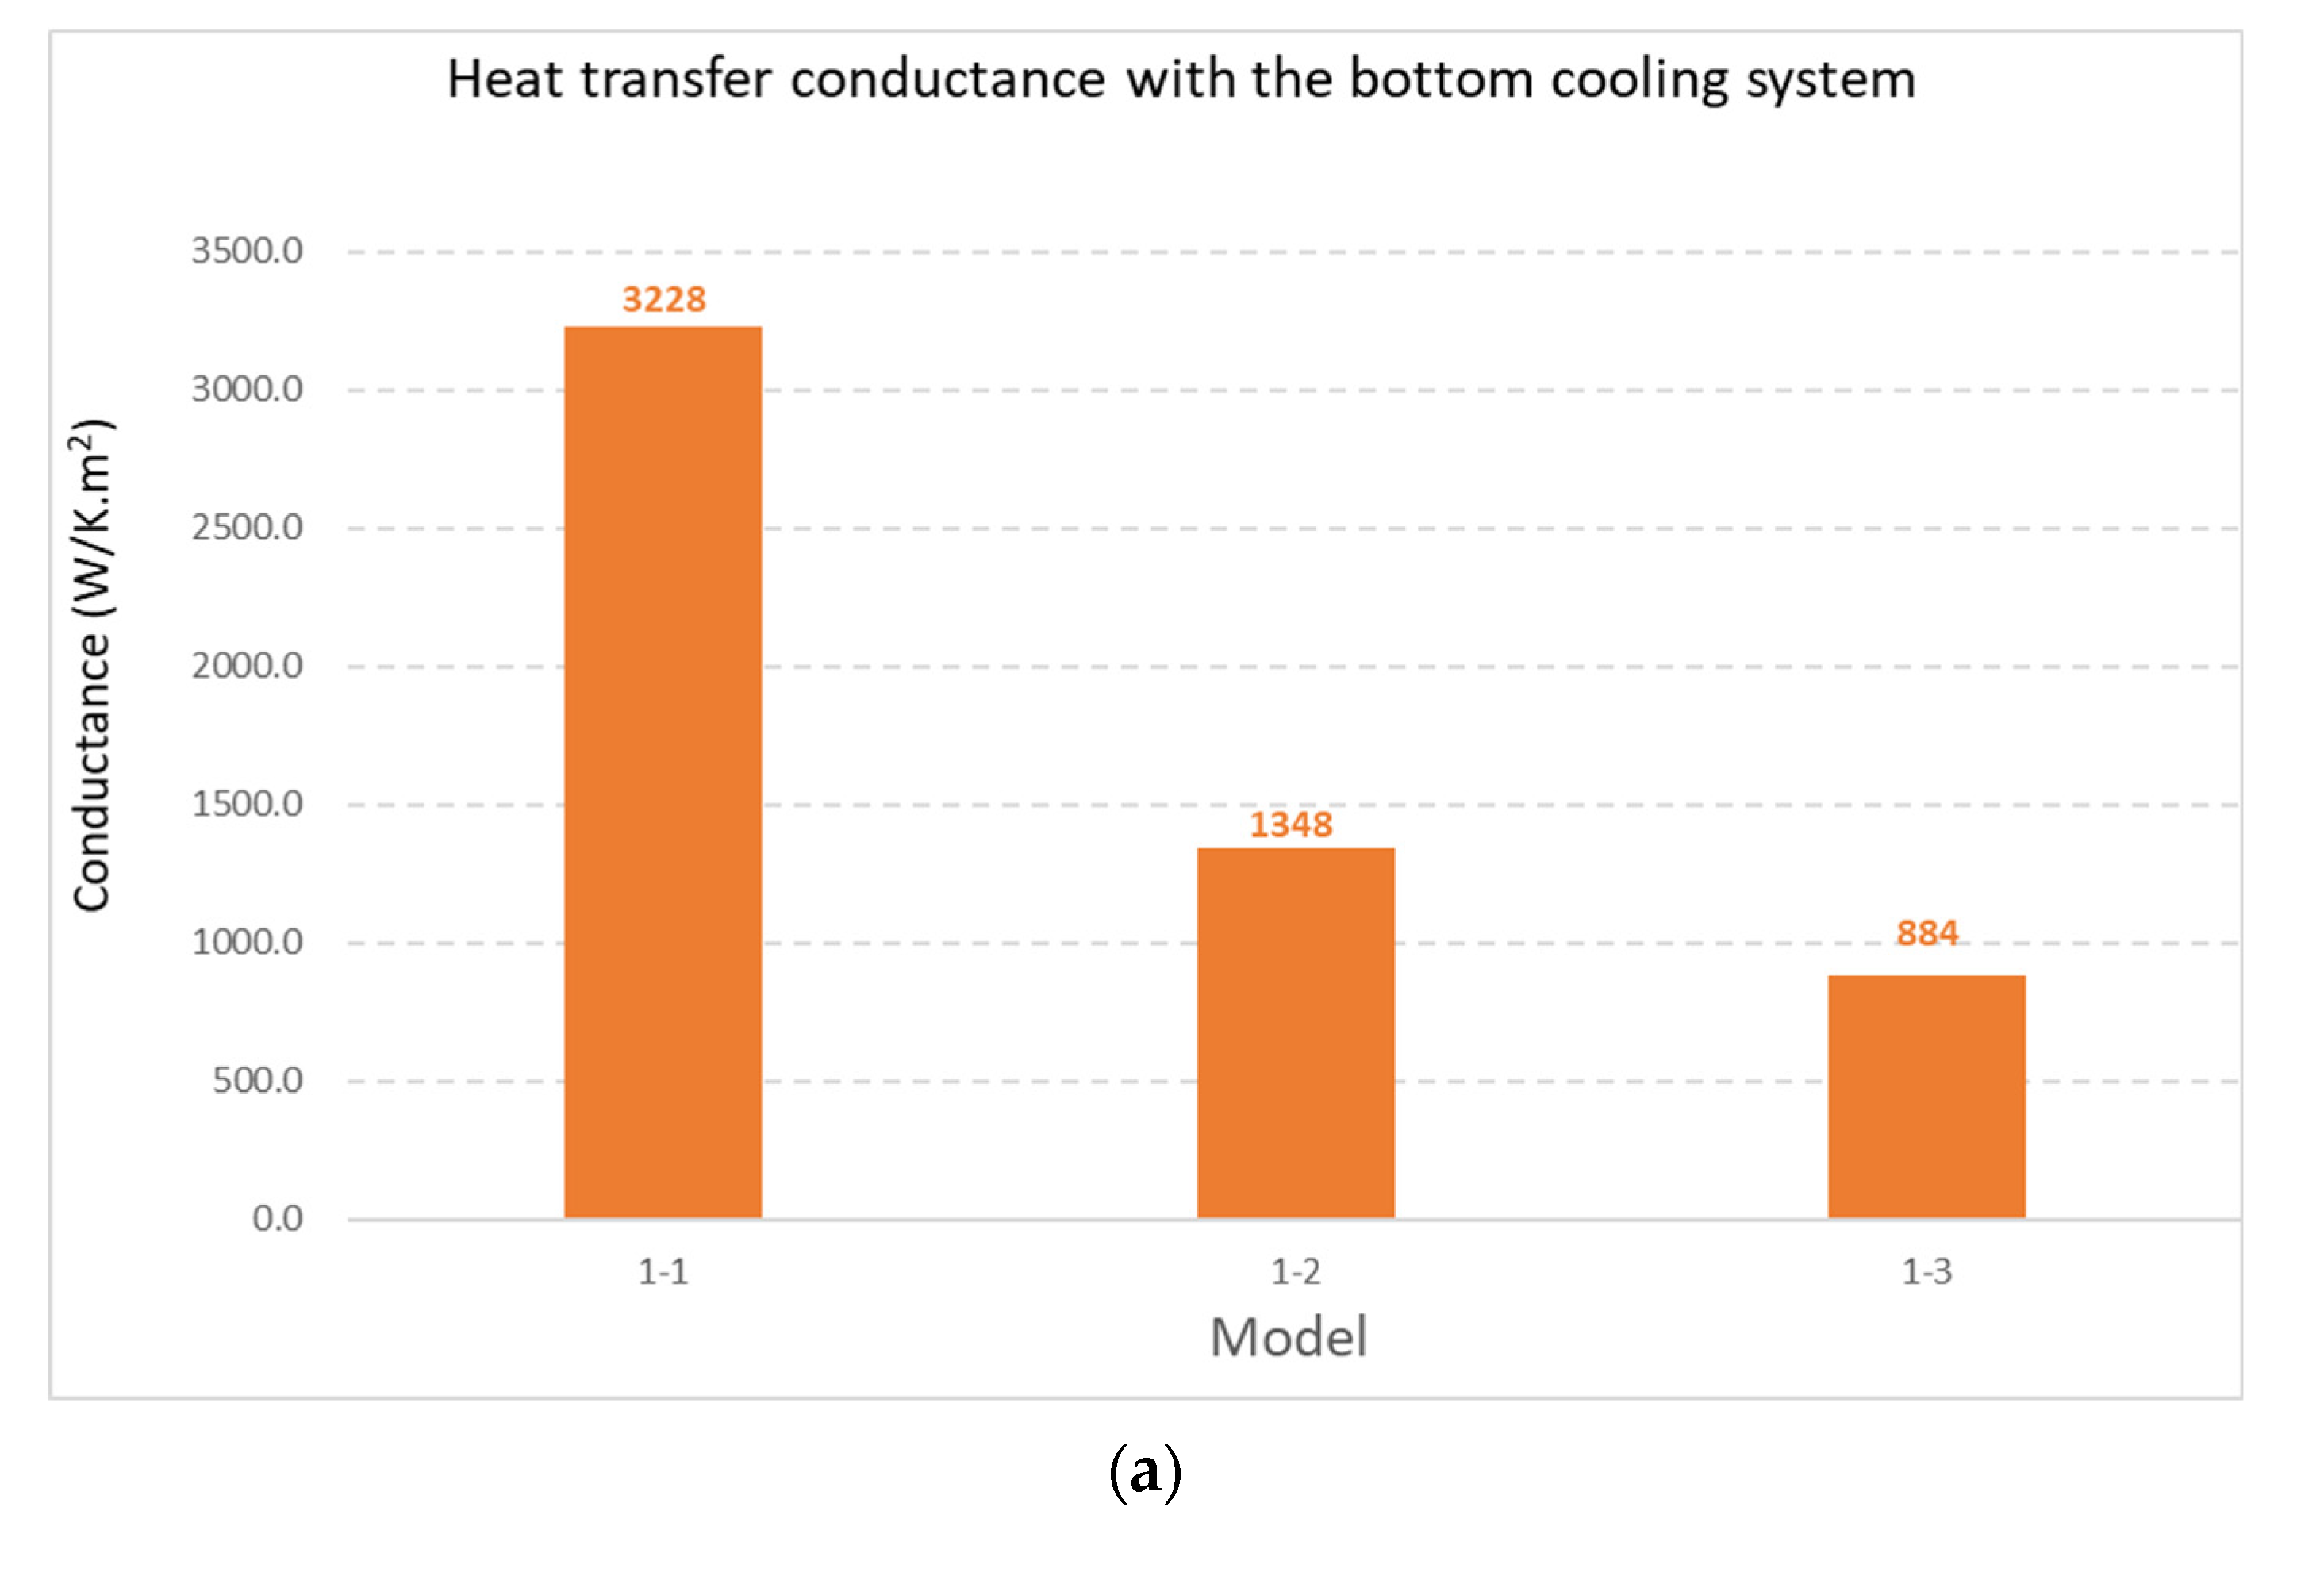
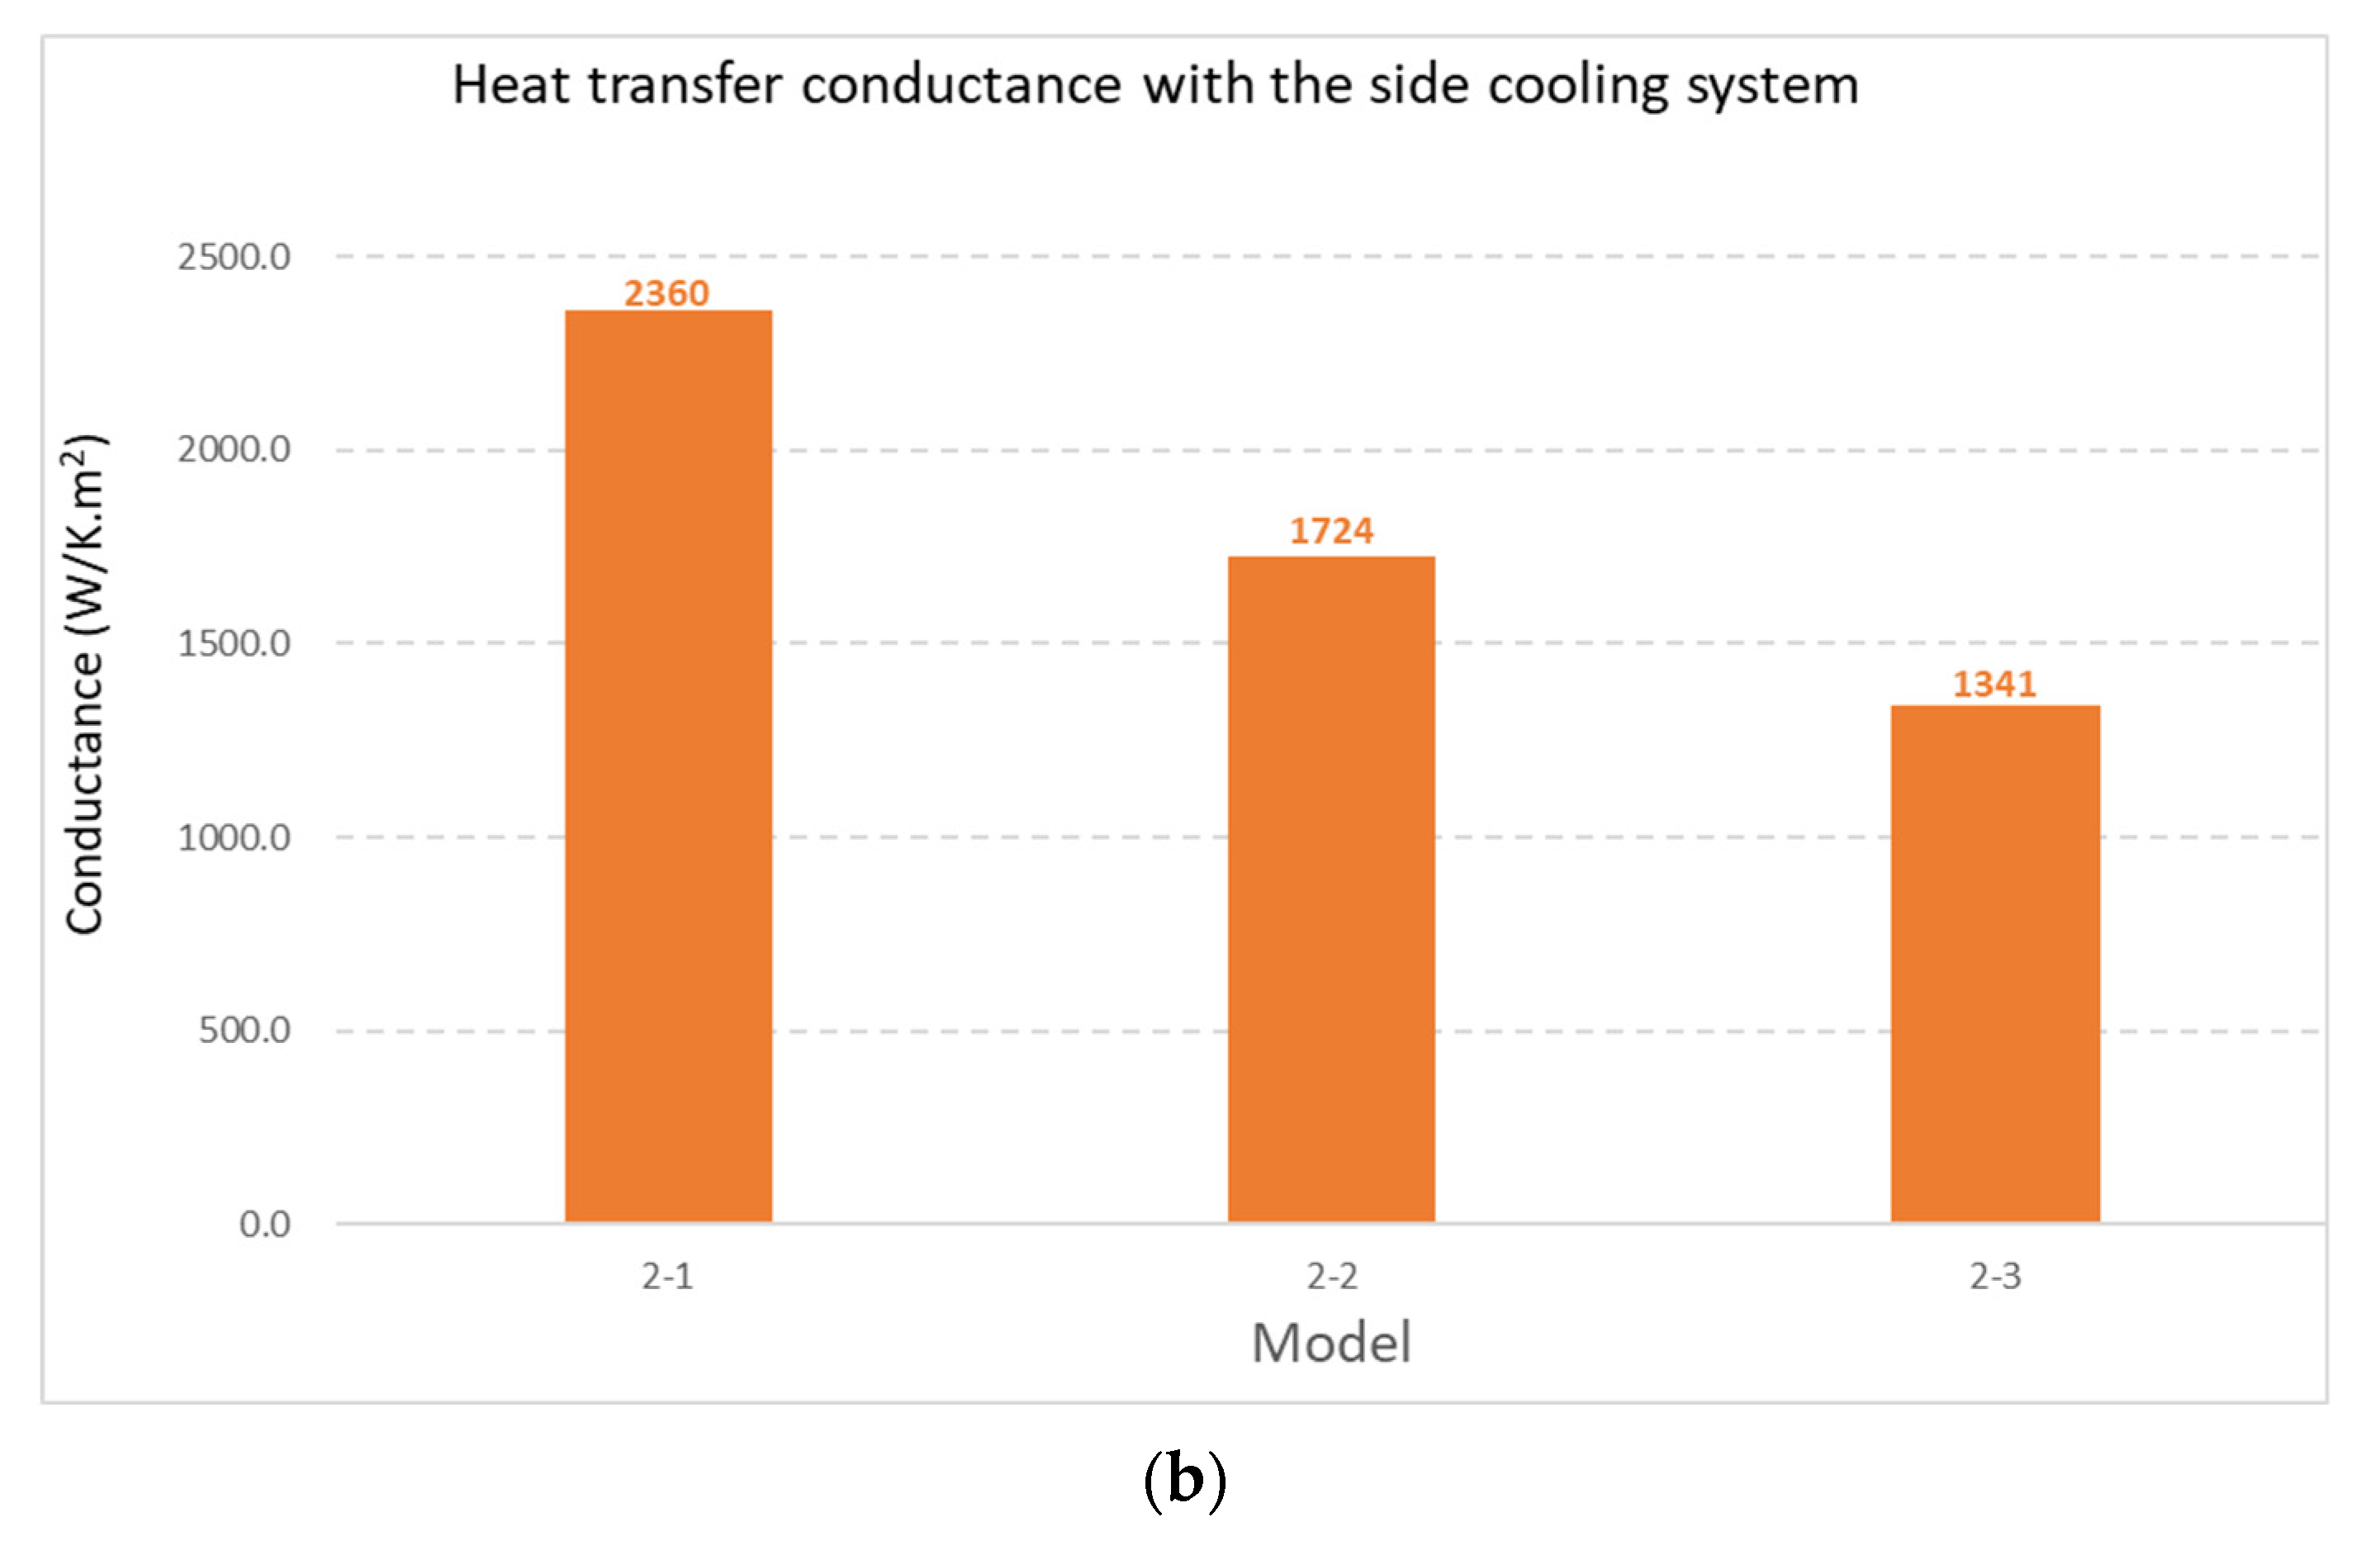
In practice, heat transfer conductance is another very important indicator to describe the thermal conductivity of an object. The heat transfer conductance of all six models is shown in Figure 13.
Figure 13 shows that both the bottom and side cooling systems have the same trend, indicating that the heat transfer conductance becomes lower when the coolant channel width gets bigger. The heat transfer conductance of the models was reduced from 3200 W/K∙m2 to 880 W/K∙m2 with the bottom cooling system and from 2300 W/K∙m2 to 1300 W/K∙m2 with the side cooling system.
From Equations (12) and (13) it can be seen that the heat transfer conductance is mainly linked to ΔTl, ΔTc, and the coolant channel contact area. Because all initial temperatures are identical, it is Tout, Tcell-end, and the coolant channel contact area that determine the heat transfer conductance. As Tcell-end is much greater than Tout, with the contact area increasing exponentially, the heat transfer conductance decreases significantly. Because the contact area of the modules with the side cooling system and the proportion of the increase in the contact area do not match those of the bottom cooling system, the decrease in the conductance with the side cooling system is not as large as that with the bottom cooling system.
6.3. Effect of the Coolant Channel Area in Contact with the Modules
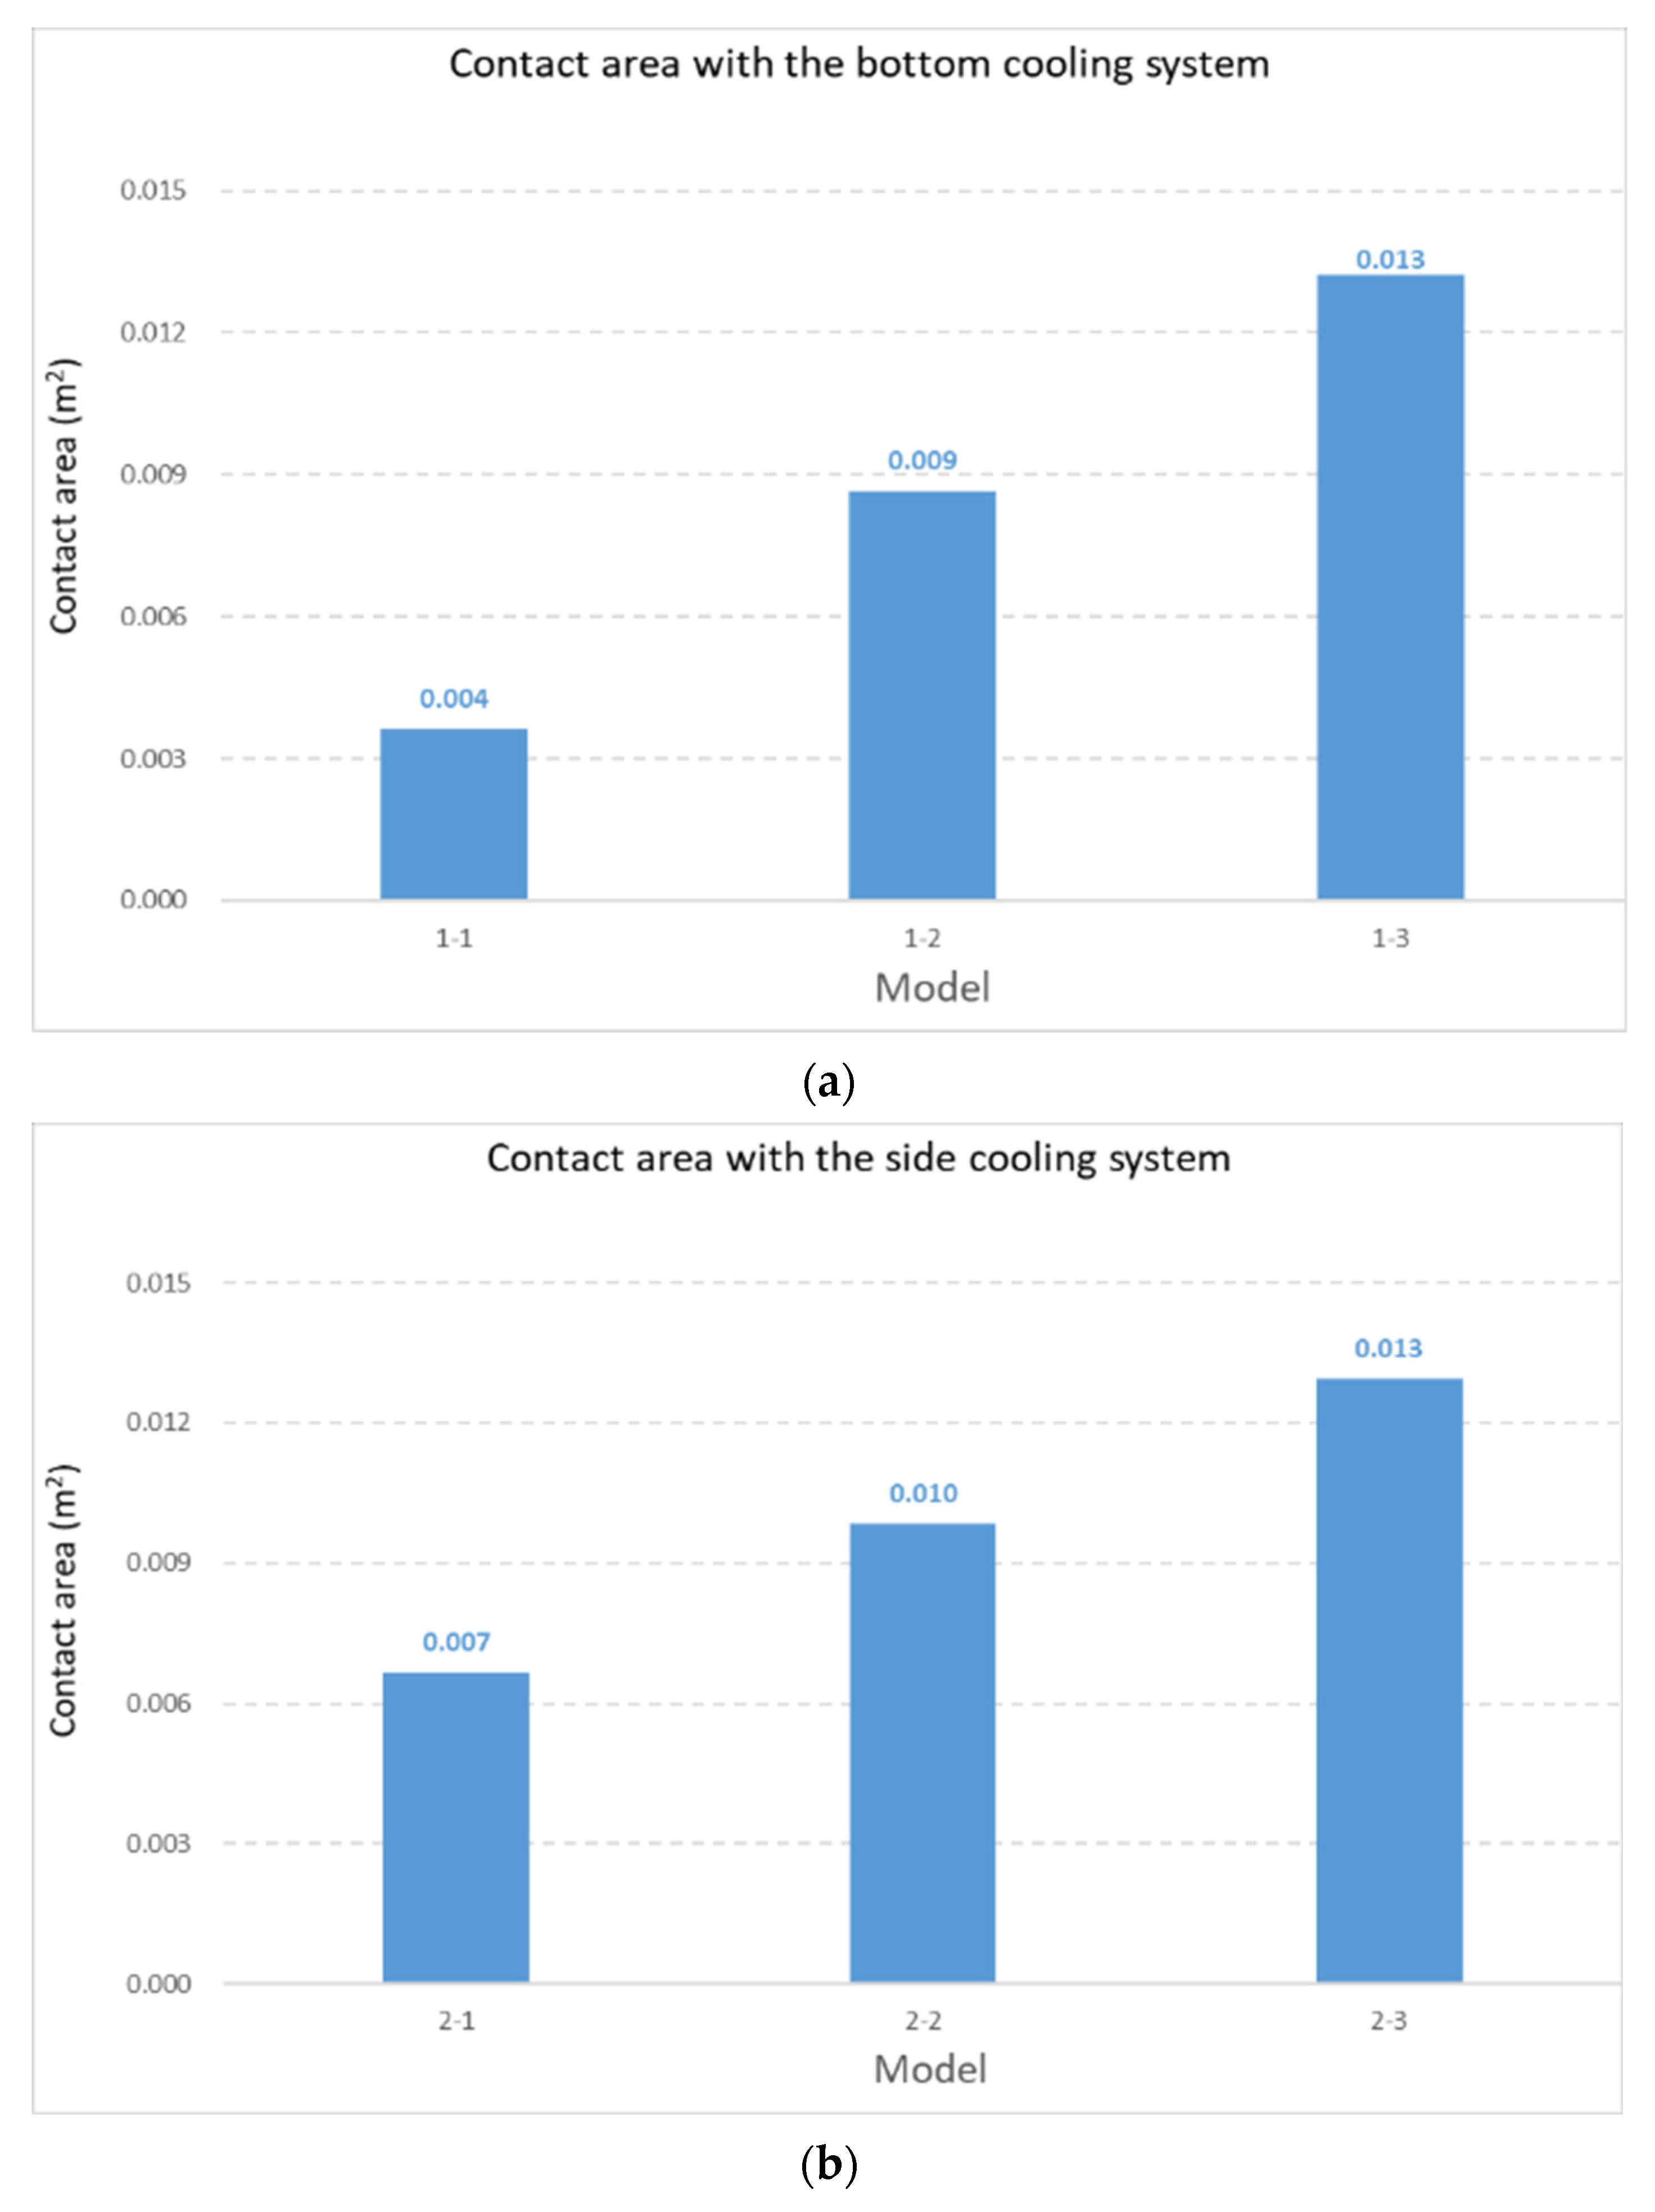
The contact area is a very important factor affecting the cooling effect and system volume. Therefore, this section discusses how this factor can affect the cooling effect through a comparison with different contact areas and cooling results when using the same cooling system. Figure 14 show the contact area size of each model for the bottom cooling system and the side cooling system, respectively.
As shown in Figure 14, from model 1-1 to model 1-3, the contact area increased by 200% with the bottom cooling system. Figure 12 shows that the maximum temperature was reduced by approximately 11%, whereas the temperature difference was reduced by 62.5%, meaning that with an increase in the contact area, though the maximum temperature reduction effect of the module is not obvious, the temperature uniformity of the module was greatly improved.
This occurs because there is a complete cooling plate close to the bottom of the module, and the coolant channel is a groove dug into the cooling plate. The heat exchange between the coolant and the module occurs through the entire cooling plate regardless of how large the coolant channel area is. Therefore, the maximum temperature does not change significantly, but the temperature distribution becomes more uniform due to the increased area with the bottom cooling system.
From model 2-1 to model 2-3, the contact area increased by nearly 100% with the side cooling system. As shown in Figure 12, we find that the maximum temperature was reduced by 10.5%, but the temperature difference instead improved by nearly 8% at the same time. This signifies that with an increase in the contact area, the maximum temperature was also reduced, while the temperature uniformity of the module became worse.
These results occur because the coolant directly exchanges heat with the module through the cooling pipe by the two sides; accordingly, the cooling effect is also more immediate with the side cooling system. By increasing the contact area, the cooling effect is improved; especially for the first several cells, which show the minimum temperature of the module, the temperature is reduced more significantly. Therefore, the maximum temperature is reduced but the temperature uniformity worsens.
6.4. The Comparison of Cooling Effect Characteristics of Two Cooling Systems
Model 1-3 and model 2-3 have a coolant channel contact area sized identically to that of the module. Therefore, a comparison between these two models can be used to describe the difference in the cooling effect performance of the two cooling systems.
As shown in Figure 15, the maximum temperature of model 1-3 is 8 °C higher, but the temperature difference is 6.8 °C lower. These outcomes indicate that the cooling characteristics of the two cooling systems are opposite. Though the overall temperature of the module is higher, the difference in the temperature between the cells is relatively close, and the temperature distribution of the module is relatively uniform with the bottom cooling system. However, with the side cooling system, the temperature of the module can be reduced much more but cannot be distributed evenly at the same time.
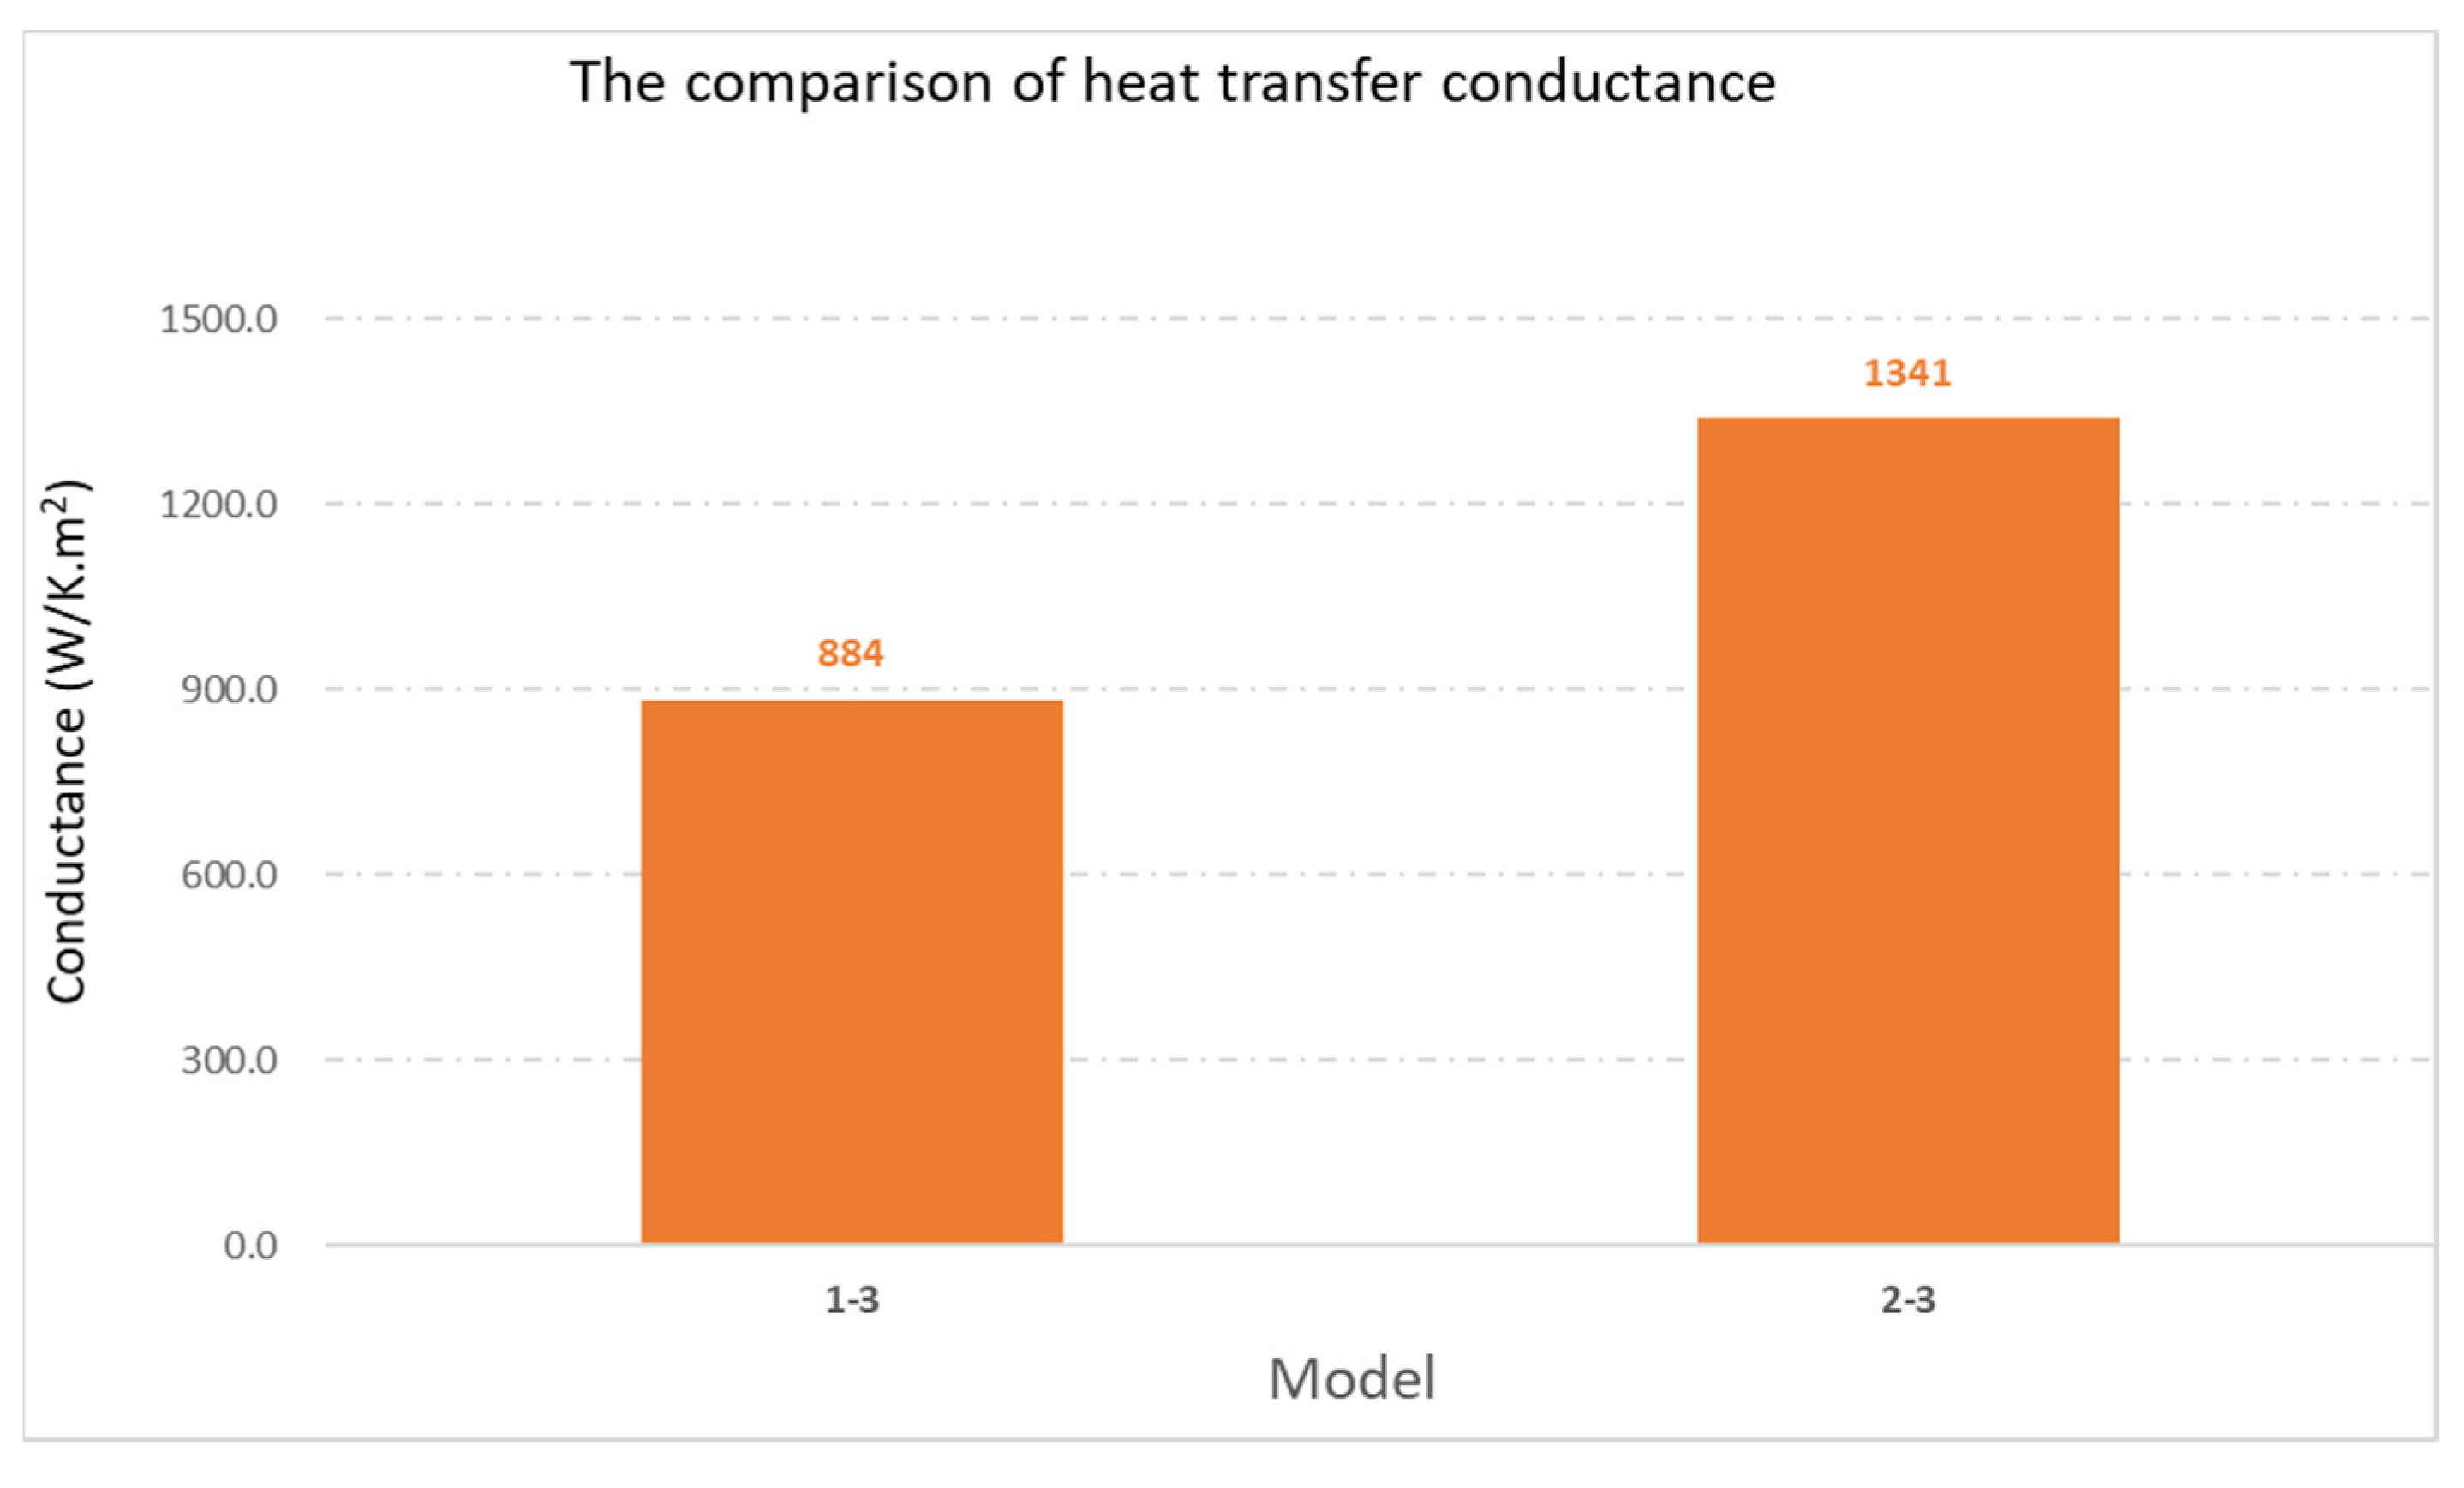
Figure 16 shows that the heat transfer conductance of the side cooling system is approximately 1300 W/K∙m2, while for the bottom cooling system the outcome is 880 W/K∙m2, showing a reduction of approximately 32%. This shows that with the coolant on both sides of the module, the cooling effect is much better compared to when the coolant only exists at the bottom of the module, even if the coolant channel areas are equal.
7. Conclusions
From this study, with the comparison of the different cooling effects on two different cooling systems, it was found that the cooling system position and coolant channel area are very important design parameters for a cooling system of a battery pack. The volume and the cost of the overall cooling system should be minimized while ensuring a proper cooling effect. Therefore, the selection of a suitable cooling system design is crucial to improve the heat dissipation performance of the battery pack. In this way, the efficiency of the battery pack can be maintained as much as possible, thereby improving the performance, lifespan, and driving range of an electric vehicle.
The bottom cooling system has a strong control capability in terms of temperature uniformity of the module. With the same coolant channel area, the temperature difference of the module with the bottom cooling system reduced by about 80% compared to those with the module with the side cooling system, which is the main reason for its popular commercialized design despite the temperature control not being good compared to the side cooling system.
The side cooling system has better temperature performance but poorer temperature uniformity. With the same coolant channel area, the maximum temperature of the module with the side cooling system reduced by about 23% compared to those with the bottom cooling system, which is the biggest advantage compared to the bottom cooling.
Regarding the contact area of the coolant channel, the two cooling systems show different effects. With the bottom cooling system, with the contact area increased by 200%, the maximum temperature was reduced by 11%, whereas the temperature difference was reduced by 62.5%. However, for the side cooling system, with the contact area increased by nearly 100%, the maximum temperature was reduced by 10.5%, but the temperature difference instead improved by 8%.
Thus, for the future, how to design an effective coolant channel to improve the temperature performance for the bottom cooling system, and explore the proper coolant contact area to balance the temperature performance, temperature uniformity, and the volume of the cooling system for the side cooling system, will become the purpose of the research.
The methodology and outcome of this study would be very informative for those devising optimum designs of liquid cooling systems for lithium-ion battery packs for the electric vehicle manufacturing industry in the future.
Author Contributions
Conceptualization, Q.-Z.S. and C.-H.K.; methodology, Q.-Z.S. and C.-H.K.; software, Q.-Z.S.; validation, Q.-Z.S.; formal analysis, Q.-Z.S. and C.-H.K.; investigation, Q.-Z.S.; resources, Q.-Z.S.; data curation, Q.-Z.S.; writing—original draft preparation, Q.-Z.S.; writing—review and editing, Q.-Z.S. and C.-H.K.; visualization, Q.-Z.S.; supervision, C.-H.K.; project administration, C.-H.K.; funding acquisition, C.-H.K. All authors have read and agreed to the published version of the manuscript.
Funding
This research received no external funding.
Institutional Review Board Statement
Not applicable.
Informed Consent Statement
Not applicable.
Data Availability Statement
Not applicable.
Conflicts of Interest
The authors declare no conflict of interest.
Abbreviations
| A | Area (m2) |
| C | Specific heat (J/kg∙K) |
| E | Cell potential (V) |
| Eoc | Open-circuit potential (V) |
| I | Current (A) |
| L | Perimeter (m) |
| Qg | Heat generated (J) |
| Qohmic | Enthalpy heating (J) |
| Qenthalpy | Gas constant (J/K) |
| T | Temperature (°C) |
| V | Volume (m3) |
| d | Diameter (m) |
| t | Time (s) |
| v | Velocity (m/s) |
| ṁ | Mass flow (kg/s) |
| ΔTl | (Tout–Tin) of the coolant (K) |
| ΔTc | (Tcell-end–Tcell-initial) of the battery (K) |
| ρ | Density (kg/m3) |
| μ | Dynamic viscosity (Pa∙s) |
| Velocity component in x, y, z-direction |
References
- Karsten, H.; Hans, R.; Nina, J.; Peter, M. Effects of electric vehicles on power systems in Northern Europe. Energy 2012, 48, 356–368. [Google Scholar]
- Jaewan, K.; Jinwoo, O.; Hoseong, L. Review on Battery Thermal Management System for Electric Vehicles. Appl. Therm. Eng. 2018, 149, 192–212. [Google Scholar]
- Ma, S.; Jiang, M.; Tao, P.; Song, C.; Wu, J.; Wang, J.; Deng, T.; Shang, W. Temperature effect and thermal impact in lithium-ion batteries: A review. Prog. Nat. Sci. Mater. Int. 2018, 28, 653–666. [Google Scholar] [CrossRef]
- Huaqiang, L.; Zhongbao, W.; Weidong, H.; Jiyun, Z. Thermal issues about Li-ion batteries and recent progress in battery thermal management systems: A review. Energy Convers. Manag. 2017, 150, 304–330. [Google Scholar]
- Jing, Z. Research on Thermal Management System of Electric Vehicle Power Battery Pack. Acad. J. Eng. Technol. Sci. 2020, 3, 62–74. [Google Scholar]
- Jing, X.; Zhao, L.C.; Jiang, Q.; Min, Q.P. A lightweight and low-cost liquid-cooled thermal management solution for high energy density prismatic lithium-ion battery packs. Appl. Therm. Eng. 2022, 203, 117871. [Google Scholar]
- Si, Q.C.; Guang, X.Z.; Jian, G.Z.; Xu, N.F.; Xue, Z.W.; Ming, G.O.Y.; Hai, F.D. Multi-objective optimization design and experimental investigation for a parallel liquid cooling-based Lithium-ion battery module under fast charging. Appl. Therm. Eng. 2022, 211, 118503. [Google Scholar]
- Pranjali, R.T.; Mahendra, M.G.; Sandeep, S.J. Numerical investigation on thermal characteristics of a liquid-cooled lithium-ion battery pack with cylindrical cell casings and a square duct. J. Energy Storage 2022, 48, 104041. [Google Scholar]
- Shi, J.; Qing, G.; Xue, G.; Yuan, G.; Tian, S.Z. Study on dual flow medium system for battery thermal management of electric vehicle. Case Stud. Therm. Eng. 2022, 35, 102023. [Google Scholar]
- Su, S.; Li, W.; Li, Y.; Garg, A.; Gao, L.; Zhou, Q. Multi-objective design optimization of battery thermal management system for electric vehicles. Appl. Therm. Eng. 2021, 196, 117235. [Google Scholar] [CrossRef]
- Janarthanam, S.; Paramasivam, S.; Maguire, P.; Gebbie, J.; Hughes, D. HEV Battery Pack Thermal Management Design and Packaging Solutions. SAE Int. J. Engines 2017, 10, 785–789. [Google Scholar] [CrossRef]
- Anonymous. Automotive Battery Thermal Management Report. Adv. Battery Technol. 2018, 54. [Google Scholar]
- Yang, S.T.; Ling, C.; Fan, Y.Q.; Yang, Y.G.; Tan, X.J.; Dong, H.Y. A Review of Lithium-Ion Battery Thermal Management System Strategies and the Evaluate Criteria. Int. J. Electrochem. Sci. 2019, 14, 6077–6107. [Google Scholar] [CrossRef]
- Chen, K.; Li, Z.; Chen, Y.; Long, S.; Hou, J.; Song, M.; Wang, S. Design of Parallel Air-Cooled Battery Thermal Management System through Numerical Study. Energies 2017, 10, 1677. [Google Scholar] [CrossRef] [Green Version]
- Mahamud, R.; Park, C. Reciprocating air flow for Li-ion battery thermal management to improve temperature uniformity. J. Power Sources 2011, 196, 5685–5696. [Google Scholar] [CrossRef]
- Wang, Y.; Liu, B.; Han, P.; Hao, C.; Li, S.; You, Z.; Wang, M. Optimization of an air-based thermal management system for lithium-ion battery packs. J. Energy Storage 2021, 44, 103314. [Google Scholar] [CrossRef]
- Buidin, T.I.C.; Mariasiu, F. Modeling Approach of an Air-Based Battery Thermal Management System for an Electric Vehicle. Appl. Sci. 2021, 11, 7089. [Google Scholar] [CrossRef]
- Sun, Y.; Wang, Y. Structural design and thermal performance analysis of hybrid electric vehicle battery pack cooling system. J. Phys. Conf. Ser. 2021, 1941, 012078. [Google Scholar] [CrossRef]
- Panchal, S.; Mathewson, S.; Fraser, R.; Culham, R.; Fowler, M. Thermal Management of Lithium-Ion Pouch Cell with Indirect Liquid Cooling using Dual Cold Plates Approach. SAE Int. J. Altern. Powertrains 2015, 4, 293–307. [Google Scholar] [CrossRef]
- Darcovich, K.; MacNeil, D.D.; Recoskie, S.; Cadic, Q.; Ilinca, F. Comparison of cooling plate configurations for automotive battery pack thermal management. Appl. Therm. Eng. 2019, 155, 185–195. [Google Scholar] [CrossRef]
- Guo, F.C.; Xian, C.; Yu, Y.L.; Yun, K.J. Effects of reciprocating liquid flow battery thermal management system on thermal characteristics and uniformity of large lithium-ion battery pack. Int. J. Energy Res. 2020, 44, 6383–6395. [Google Scholar]
- Maan, A.-Z.; Ibrahim, D.; Marc, A.R. A novel phase change based cooling system for prismatic lithium ion batteries. Int. J. Refrig. 2018, 86, 203–217. [Google Scholar]
- Yamada, T.; Koshiyama, T.; Yoshikawa, M.; Yamada, T.; Ono, N. Analysis of a lithium-ion battery cooling system for electric vehicles using a phase-change material and heat pipes. J. Therm. Sci. Technol. 2017, 12, JTST0011. [Google Scholar] [CrossRef] [Green Version]
- Huang, Y.; Tang, Y.; Yuan, W.; Fang, G.Y.; Yang, Y.; Zhang, X.Q.; Wu, Y.P.; Yuan, Y.H.; Wang, C.; Li, J.G. Challenges and recent progress in thermal management with heat pipes for lithium-ion power batteries in electric vehicles. Sci. China 2021, 64, 919–956. [Google Scholar] [CrossRef]
- Mei, N.; Xu, X.; Li, R. Heat Dissipation Analysis on the Liquid Cooling System Coupled with a Flat Heat Pipe of a Lithium-Ion Battery. ACS Omega 2020, 5, 17431–17441. [Google Scholar] [CrossRef]
- Chen, D.; Jiang, J.; Kim, G.-H.; Yang, C.; Pesaran, A. Comparison of different cooling methods for lithium ion battery cells. Appl. Therm. Eng. 2016, 94, 846–854. [Google Scholar] [CrossRef] [Green Version]
- Yong, G.L.; Yong, L.; Wei, G.P. Study on Various Types of Cooling Techniques Applied to Power Battery Thermal Management Systems. Adv. Mater. Res. 2012, 608–609, 1571–1576. [Google Scholar]
- Mohsen, A.; Theodoros, K.; Joris, J.; Lu, J.; Hamidreza, B.; Danial, K.; Hamidreza, B.; Joeri, V.M.; Maitane, B. A comparative study between air cooling and liquid cooling thermal management systems for a high-energy lithium-ion battery module. Appl. Therm. Eng. 2021, 198, 117503. [Google Scholar]
- Wei, Z.; Yun, T.Z.; Jia, Q.E.; Jing, L.; Qing, Q.L.; Guang, D.Z. Performance comparison between single S-channel and double S-channel cold plate for thermal management of a prismatic LiFePO4 battery. Renew. Energy 2022, 192, 46–57. [Google Scholar]
- Hamidreza, B.; Danial, K.; Mohammadreza, B.; Morteza, G.; Joris, J.; Mohsen, A.S.; Foad, H.G.; Maitane, B.; Joeri, V.M. A new concept of thermal management system in Li-ion battery using air cooling and heat pipe for electric vehicles. Appl. Therm. Eng. 2020, 174, 115280. [Google Scholar]
- Li, C.J. Design and Thermal Performance Analysis for Liquid Cooling Structure of Lithium-ion Battery. Master’s Thesis, Hefei University of Technology, Hefei, China, 2016. [Google Scholar]
- Wang, Y.Z. Structure Design of Liquid-cooling Thermal Management for Power Batteries in Pure Electric Passenger Vehicles. Master’s Thesis, Hefei University of Technology, Hefei, China, 2017. [Google Scholar]
- He, F.; Li, X.; Ma, L. Combined experimental and numerical study of thermal management of battery module consisting of multiple Li-ion cells. Int. J. Heat Mass Transf. 2014, 72, 622–629. [Google Scholar] [CrossRef]
- Turaka, S.; Obulu, P.; Reddy, K.V.K. Computational fluid dynamics and thermal analysis of a lithium-ion battery with different cooling system for electric vehicles. IOP Conf. Ser. Mater. Sci. Eng. 2021, 1136, 012033. [Google Scholar] [CrossRef]
- Kim, C.-H.; Kim, C.-S.; Lee, S.-H. Development of a Numerical Algorithm for the Evaluation of Aerodynamic Driving Stability of a Vehicle. Trans. Korean Soc. Automot. Eng. 2016, 24, 265–272. [Google Scholar] [CrossRef] [Green Version]
- Douglas, J.F. Fluid Mechanics; Prentice Hall: Hoboken, NJ, USA, 2001. [Google Scholar]
- Concentration Heat and Momentum Limited. The Chen-Kim Modified KE-EP Turbulence Model. 2021. Available online: https://www.cham.co.uk/phoenics/d_polis/d_enc/turmod/enc_t342.htm (accessed on 23 January 2022).
Figure 1.
Three-dimensional model of the battery cell and the module.

Figure 2.
Cross-sectional area of the liquid tube models of the bottom cooling system.

Figure 3.
Cross-sectional area of the liquid tube models of the side cooling system.

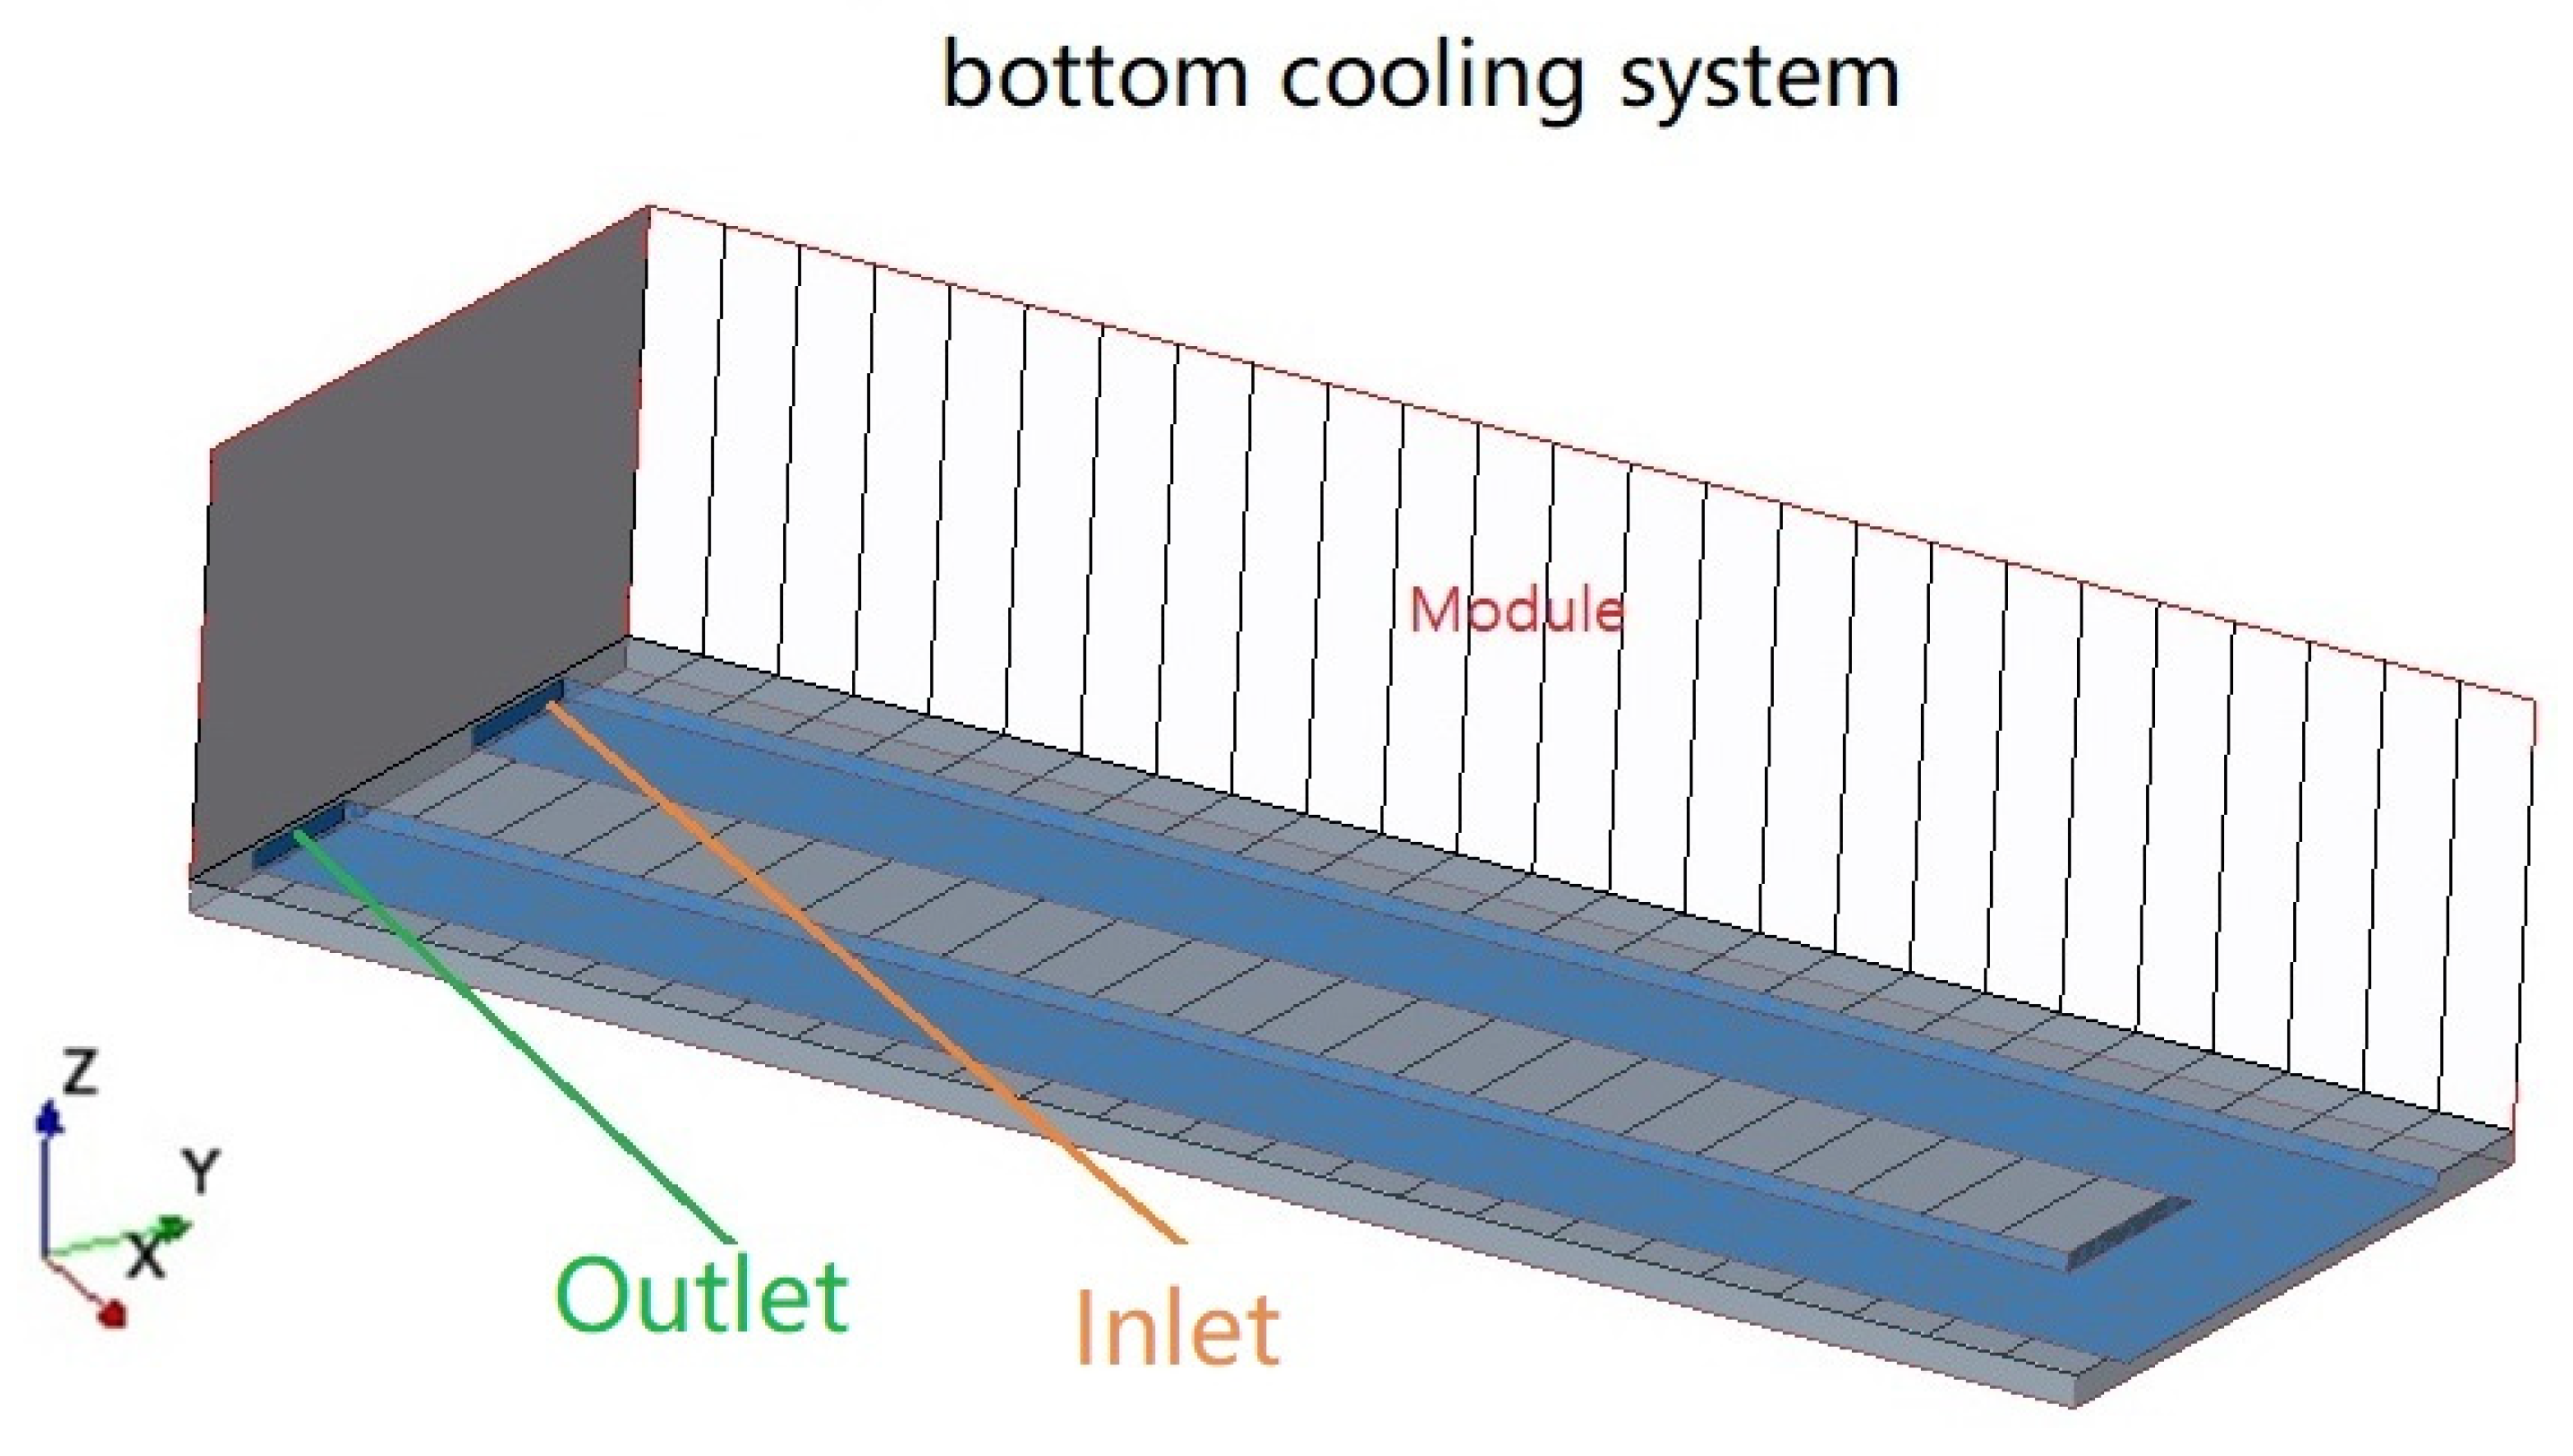
Figure 4.
Perspective view of the coolant flow path created in the battery module for the bottom cooling system.
Figure 4.
Perspective view of the coolant flow path created in the battery module for the bottom cooling system.

Figure 5.
Perspective view of the coolant flow path created in the battery module for the side cooling system.
Figure 5.
Perspective view of the coolant flow path created in the battery module for the side cooling system.

Figure 6.
Configuration of a typical numerical grid in the numerical domain.

Figure 7.
Variation in the residual fraction of the results.

Figure 8.
Temperature distributions of the three models with the bottom cooling system.

Figure 9.
Temperature distributions of the three models with the side cooling system.

Figure 10.
Temperature distributions on the cross-section area of the three modules with the bottom cooling system.
Figure 10.
Temperature distributions on the cross-section area of the three modules with the bottom cooling system.


Figure 11.
Temperature distributions on the cross-section area of the three modules with the side cooling system.
Figure 11.
Temperature distributions on the cross-section area of the three modules with the side cooling system.


Figure 12.
Max temperature and the temperature difference for the bottom (a) and side (b) cooling system.
Figure 12.
Max temperature and the temperature difference for the bottom (a) and side (b) cooling system.

Figure 13.
Heat transfer conductance for the bottom (a) and side (b) cooling systems.


Figure 14.
Contact area for the bottom (a) and side (b) cooling systems.

Figure 15.
The comparison of max temperature and the temperature difference between two cooling systems.
Figure 15.
The comparison of max temperature and the temperature difference between two cooling systems.

Figure 16.
The comparison of heat transfer conductance between two cooling systems.


Table 1.
Properties of the Coolant.
| Coolant (50% Ethylene Glycol + 50% Water) | |
|---|---|
| Thermal conductivity (W/m∙K) | 0.38 |
| Viscosity (Pa∙s) | 0.00394 |
| Density (kg/m3) | 1073.35 |
| Specific heat (J/kg∙K) | 3281.0 |
Table 2.
Properties of the Battery Cell.
| Battery Cell | |
|---|---|
| Thermal conductivity (W/m∙K) | 18 (X-direction), |
| 3 (Y-direction), | |
| 11 (Z-direction) | |
| Specific heat (J/kg∙K) | 1100.0 |
Table 3.
Boundary and Initial Conditions.
| Boundary and Initial Conditions | |
|---|---|
| Mass flow inlet (kg/s) | 0.0268337 |
| Pressure outlet (Pa) | 0 |
| Initial temperature (°C) | 20 |
| Pheat (W) | 6.8 |
| Coolant temperature (°C) | 20 |
| Calculation model | laminar, steady |
Publisher’s Note: MDPI stays neutral with regard to jurisdictional claims in published maps and institutional affiliations. |
© 2022 by the authors. Licensee MDPI, Basel, Switzerland. This article is an open access article distributed under the terms and conditions of the Creative Commons Attribution (CC BY) license (https://creativecommons.org/licenses/by/4.0/).
Share and Cite
MDPI and ACS Style
Sun, Q.-Z.; Kim, C.-H. Effect of the Size and Location of Liquid Cooling System on the Performance of Square-Shaped Li-Ion Battery Modules of an Electric Vehicle. Fluids 2022, 7, 219. https://0-doi-org.brum.beds.ac.uk/10.3390/fluids7070219
AMA Style
Sun Q-Z, Kim C-H. Effect of the Size and Location of Liquid Cooling System on the Performance of Square-Shaped Li-Ion Battery Modules of an Electric Vehicle. Fluids. 2022; 7(7):219. https://0-doi-org.brum.beds.ac.uk/10.3390/fluids7070219
Chicago/Turabian StyleSun, Qing-Zhu, and Chul-Ho Kim. 2022. "Effect of the Size and Location of Liquid Cooling System on the Performance of Square-Shaped Li-Ion Battery Modules of an Electric Vehicle" Fluids 7, no. 7: 219. https://0-doi-org.brum.beds.ac.uk/10.3390/fluids7070219