
Low-Sulphur Vacuum Gasoil of Western Siberia Oil: The Impact of Its Structural and Chemical Features on the Properties of the Produced Needle Coke


Abstract
:1. Introduction
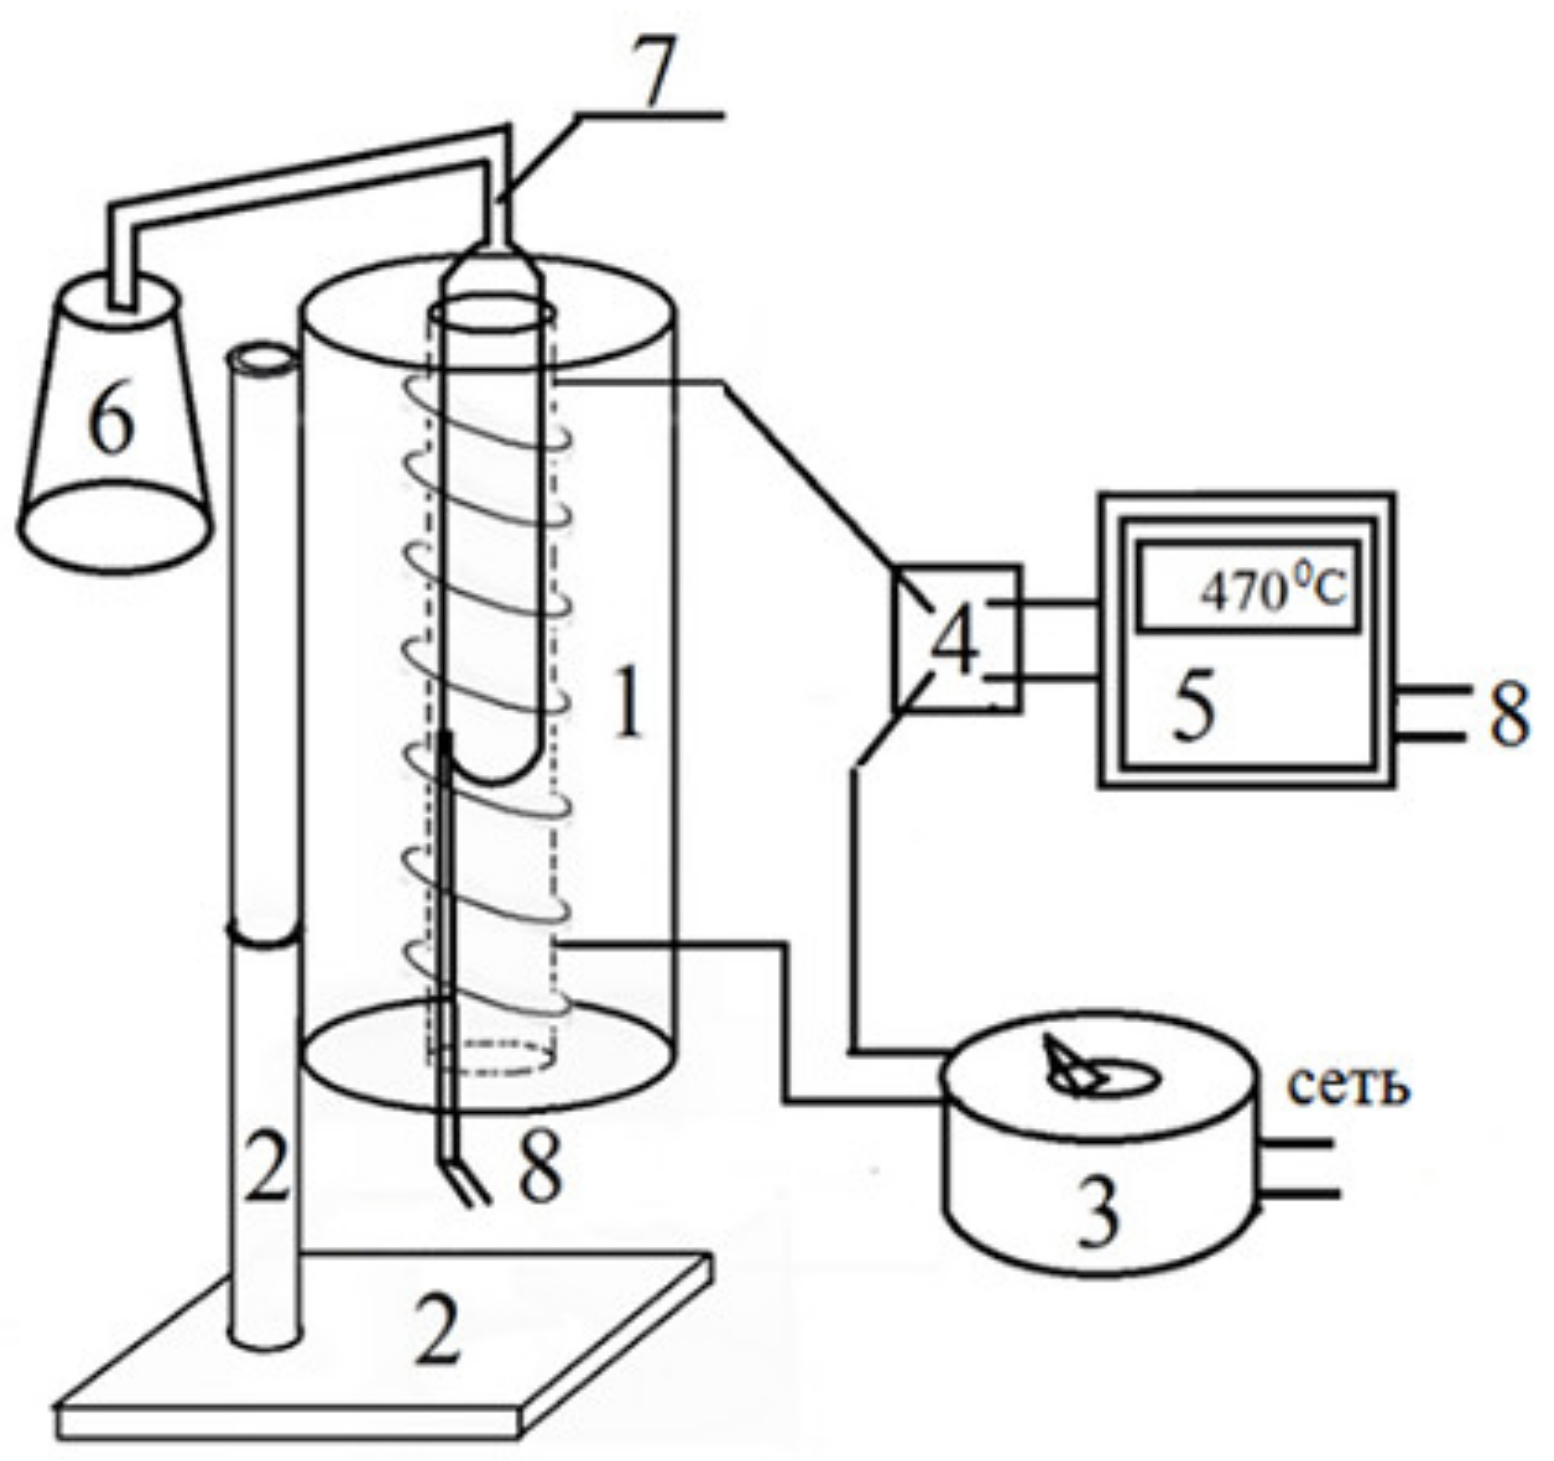
2. Experimental Part
3. Results and Discussion
4. Conclusions
Author Contributions
Funding
Data Availability Statement
Conflicts of Interest
References
- Diana, N.; Yamada, Y.; Gohda, S.; Ono, H.; Kubo, S.; Sato, S. Carbon materials with high pentagon density. J. Mater. Sci. 2020, 56, 2912–2943. [Google Scholar] [CrossRef]
- Feng, B.; Zhuang, X. Carbon-Enriched meso-Entropy Materials: From Theory to Cases. Acta Chim. Sin. 2020, 78, 833. [Google Scholar] [CrossRef]
- Ariga, K.; Shrestha, L.K. Fullerene Nanoarchitectonics with Shape-Shifting. Materials 2020, 13, 2280. [Google Scholar] [CrossRef] [PubMed]
- Shrestha, R.L.; Shrestha, T.; Tamrakar, B.M.; Shrestha, R.G.; Maji, S.; Ariga, K.; Shrestha, L.K. Nanoporous Carbon Materials Derived from Washnut Seed with Enhanced Supercapacitance. Materials 2020, 13, 2371. [Google Scholar] [CrossRef]
- Sabirov, D.S.; Terentyev, A.O.; Bulgakov, R.G. Counting the Isomers and Estimation of Anisotropy of Polarizability of the Selected C60 and C70 Bisadducts Promising for Organic Solar Cells. J. Phys. Chem. A 2015, 119, 10697–10705. [Google Scholar] [CrossRef]
- Wang, Q.-E.; Niu, H.; Wang, Y.; Li, C. Carbon nanotubes modified nanocomposites based on liquid crystalline elastomers. Mol. Cryst. Liq. Cryst. 2021, 1–39. [Google Scholar] [CrossRef]
- Sabirov, D.S.; Terentyev, A.O.; Bulgakov, R.G. Polarizability of fullerene [2+2]-dimers: A DFT study. Phys. Chem. Chem. Phys. 2014, 16, 14594–14600. [Google Scholar] [CrossRef]
- Pankratyev, E.Y.; Tukhbatullina, A.A.; Sabirov, D.S. Dipole polarizability, structure, and stability of [2+2]-linked fullerene nanostructures (C60)n (n ≤ 7). Phys. E Low Dimens. Syst. Nanostructures 2017, 86, 237–242. [Google Scholar] [CrossRef]
- Hong, I.-H.; Gao, C.-J. Large area self-ordered parallel C60 molecular nanowire arrays on Si(110) surfaces. Carbon 2016, 107, 925–932. [Google Scholar] [CrossRef]
- Huber, S.; Gatchell, M.; Zettergren, H.; Mauracher, A. A precedent of van-der-Waals interactions outmatching Coulomb explosion. Carbon 2016, 109, 843–850. [Google Scholar] [CrossRef] [Green Version]
- Cataldo, F.; García-Hernández, D.A.; Manchado, A. Asphaltenes as model compounds of the UIBs/AIBs detected in various astrophysical objects. Part 2. Natural bitumens asphaltenes carbonization. Full Nanotub. Carbon Nanostructures 2021, 1–13. [Google Scholar] [CrossRef]
- Hu, C.; Chu, H.; Zhu, Y.; Xu, Y.; Cheng, J.; Gao, L.; Lai, S.; Zhao, X. Differences and correlations between microstructure and macroscopic properties of mesophase cokes derived from the components of high temperature coal tar pitch. Fuel 2021, 310, 122330. [Google Scholar] [CrossRef]
- Zang, Z.; Lou, B.; Zhao, N.; Yu, E.; Wang, Z.; Du, H.; Chen, Z.; Liu, D. Co-carbonization behavior of the blended heavy oil and low temperature coal tar for the preparation of needle coke. Fuel 2021, 302, 121139. [Google Scholar] [CrossRef]
- Babich, A.; Senk, D. Coke in the iron and steel industry. In New Trends in Coal Conversion; Elsevier BV: Amsterdam, The Netherlands, 2019; pp. 367–404. [Google Scholar]
- Halim, H.P.; Im, J.S.; Lee, C.W. Preparation of needle coke from petroleum by-products. Carbon Lett. 2013, 14, 152–161. [Google Scholar] [CrossRef] [Green Version]
- Platon, A.; Dumbrava, A.; Iutes-Petrescu, N.; Simionescu, L. Improved technology for manufacture of carbon electrodes. J. Chem. Sci. 2000, 112, 19–26. [Google Scholar] [CrossRef] [Green Version]
- Rodríguez-Reinoso, F.; Santana, P.; Palazon, E.; Diez, M.-A.; Marsh, H. Delayed coking: Industrial and laboratory aspects. Carbon 1998, 36, 105–116. [Google Scholar] [CrossRef]
- Li, M.; Liu, D.; Du, H.; Li, Q.; Hou, X.; Ye, J. Preparation of mesophase pitch by aromatics-rich distillate of naphthenic vacuum gas oil. Appl. Petrochem. Res. 2015, 5, 339–346. [Google Scholar] [CrossRef] [Green Version]
- Gabdulkhakov, R.R.; Rudko, V.A.; Pyagay, I.N. Methods for modifying needle coke raw materials by introducing additives of various origin (review). Fuel 2021, 310, 122265. [Google Scholar] [CrossRef]
- Yuan, G.; Cui, Z. Preparation, characterization, and applications of carbonaceous mesophase: A review. In Liquid Crystals and Display Technology; IntechOpen: London, UK, 2020. [Google Scholar]
- Wang, C.Y. Theory and Application of Carbonaceous Mesophase; Science Press: Beijing, China, 2015; ISBN 978-7-03-045750-9. [Google Scholar]
- Brooks, J.D.; Taylor, G.H. Formation of Graphitizing Carbons from the Liquid Phase. Nature 1965, 206, 697–699. [Google Scholar] [CrossRef]
- White, J.L.; Price, R.J. The Formation of Mesophase Microstructures during the Pyrolysis of Selected Coker Feedstocks. Carbon 1974, 12, 321–333. [Google Scholar] [CrossRef]
- Gauglitz, G.; Moore, D.S. (Eds.) Handbook of Spectroscopy; Wiley: Weinheim, Germany, 2014. [Google Scholar]
- Dolomatov, M.Y.; Mukaeva, G.R. Electronic Spectroscopy Method for Determining the Ionization Potentials and Electron Affinities of the Molecules of Aromatic Compounds. J. Appl. Scpectrosc. 1992, 56, 570–574. (In Russian) [Google Scholar] [CrossRef]
- Dolomatov, M.Y.; Mukaeva, G.R.; Shulyakovskaya, D.O. Electron Phenomenological Spectroscopy and its Application in Investigating Complex Substances in Chemistry, Nanotechnology and Medicine. J. Mater. Sci. Eng. B 2013, 3, 183–199. [Google Scholar]
- Thomas, O.; Brogat, M. Organic constituents. In UV-Visible Spectrophotometry of Water and Wastewater; Thomas, O., Burgess, C., Eds.; Elsevier: Amsterdam, The Netherlands, 2017; pp. 73–138. [Google Scholar]
- De Proft, F.; Geerlings, P. Conceptual and Computational DFT in the Study of Aromaticity. Chem. Rev. 2001, 101, 1451–1464. [Google Scholar] [CrossRef] [PubMed]
- Sabirov, D. A correlation between the mean polarizability of the “kinked” polycyclic aromatic hydrocarbons and the number of H…H bond critical points predicted by Atoms-in-Molecules theory. Comput. Theor. Chem. 2014, 1030, 81–86. [Google Scholar] [CrossRef]


| Parameter | Value |
|---|---|
| Density (g/cm3) | 1.0379 |
| Sulfur content (% mass) | 0.15 |
| Coking capacity (% mass) | 3.6 |
| Mechanical impurities (% mass) | 0.023 |
| Viscosity (sSt) at 50 and 80 °C | 19.37 and 6.57 |
| Fractions | Contents (% Mass) |
|---|---|
| Paraffin-naphthenic | 22.3 |
| Aromatic, including: | 70.6 |
| light | 2.3 |
| medium | 6.2 |
| heavy | 62.1 |
| Resins, including: | 6.1 |
| type I | 2.6 |
| type II | 3.5 |
| Asphaltene | 1.0 |
| Fraction | Parameters | ||
|---|---|---|---|
| Yield (% Mass) | Density ρ204 | Sulfur Content (% Mass) | |
| <350 °C | 28.73 | 0.9868 | 0.090 |
| 350–400 °C | 42.77 | 1.0343 | 0.190 |
| 400–450 °C | 17.52 | 1.0792 | 0.080 |
| >450 °C | 10.98 | 1.1827 | 0.120 |
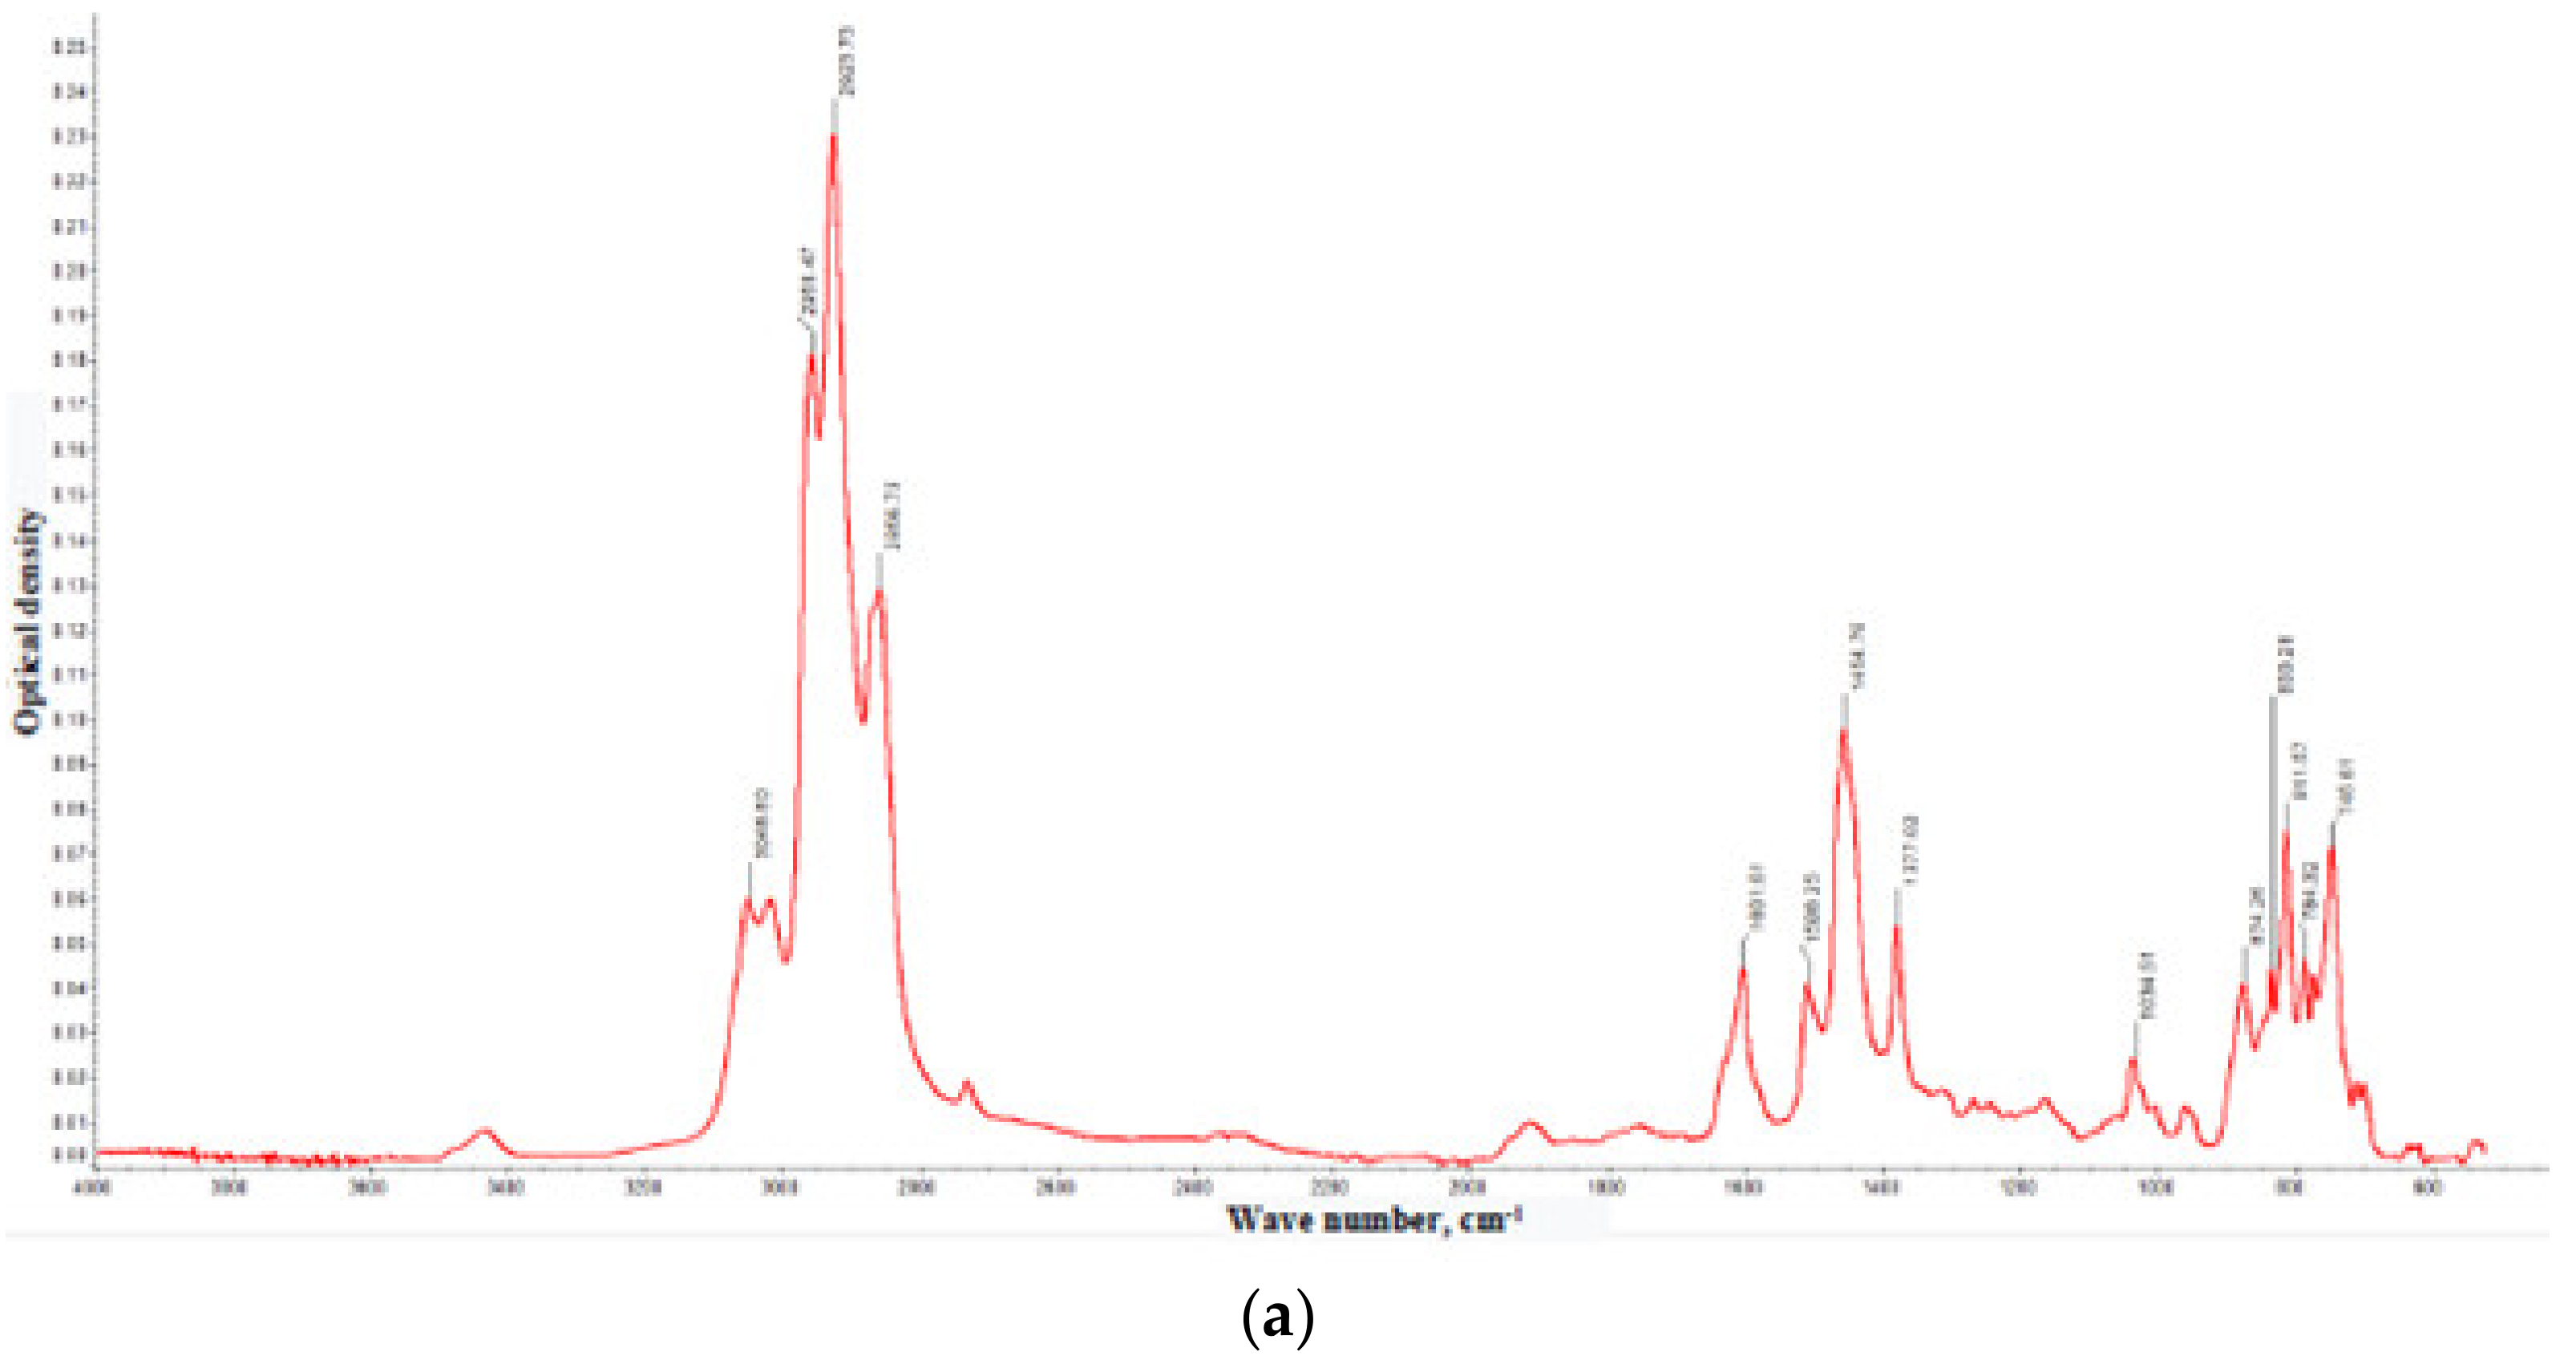
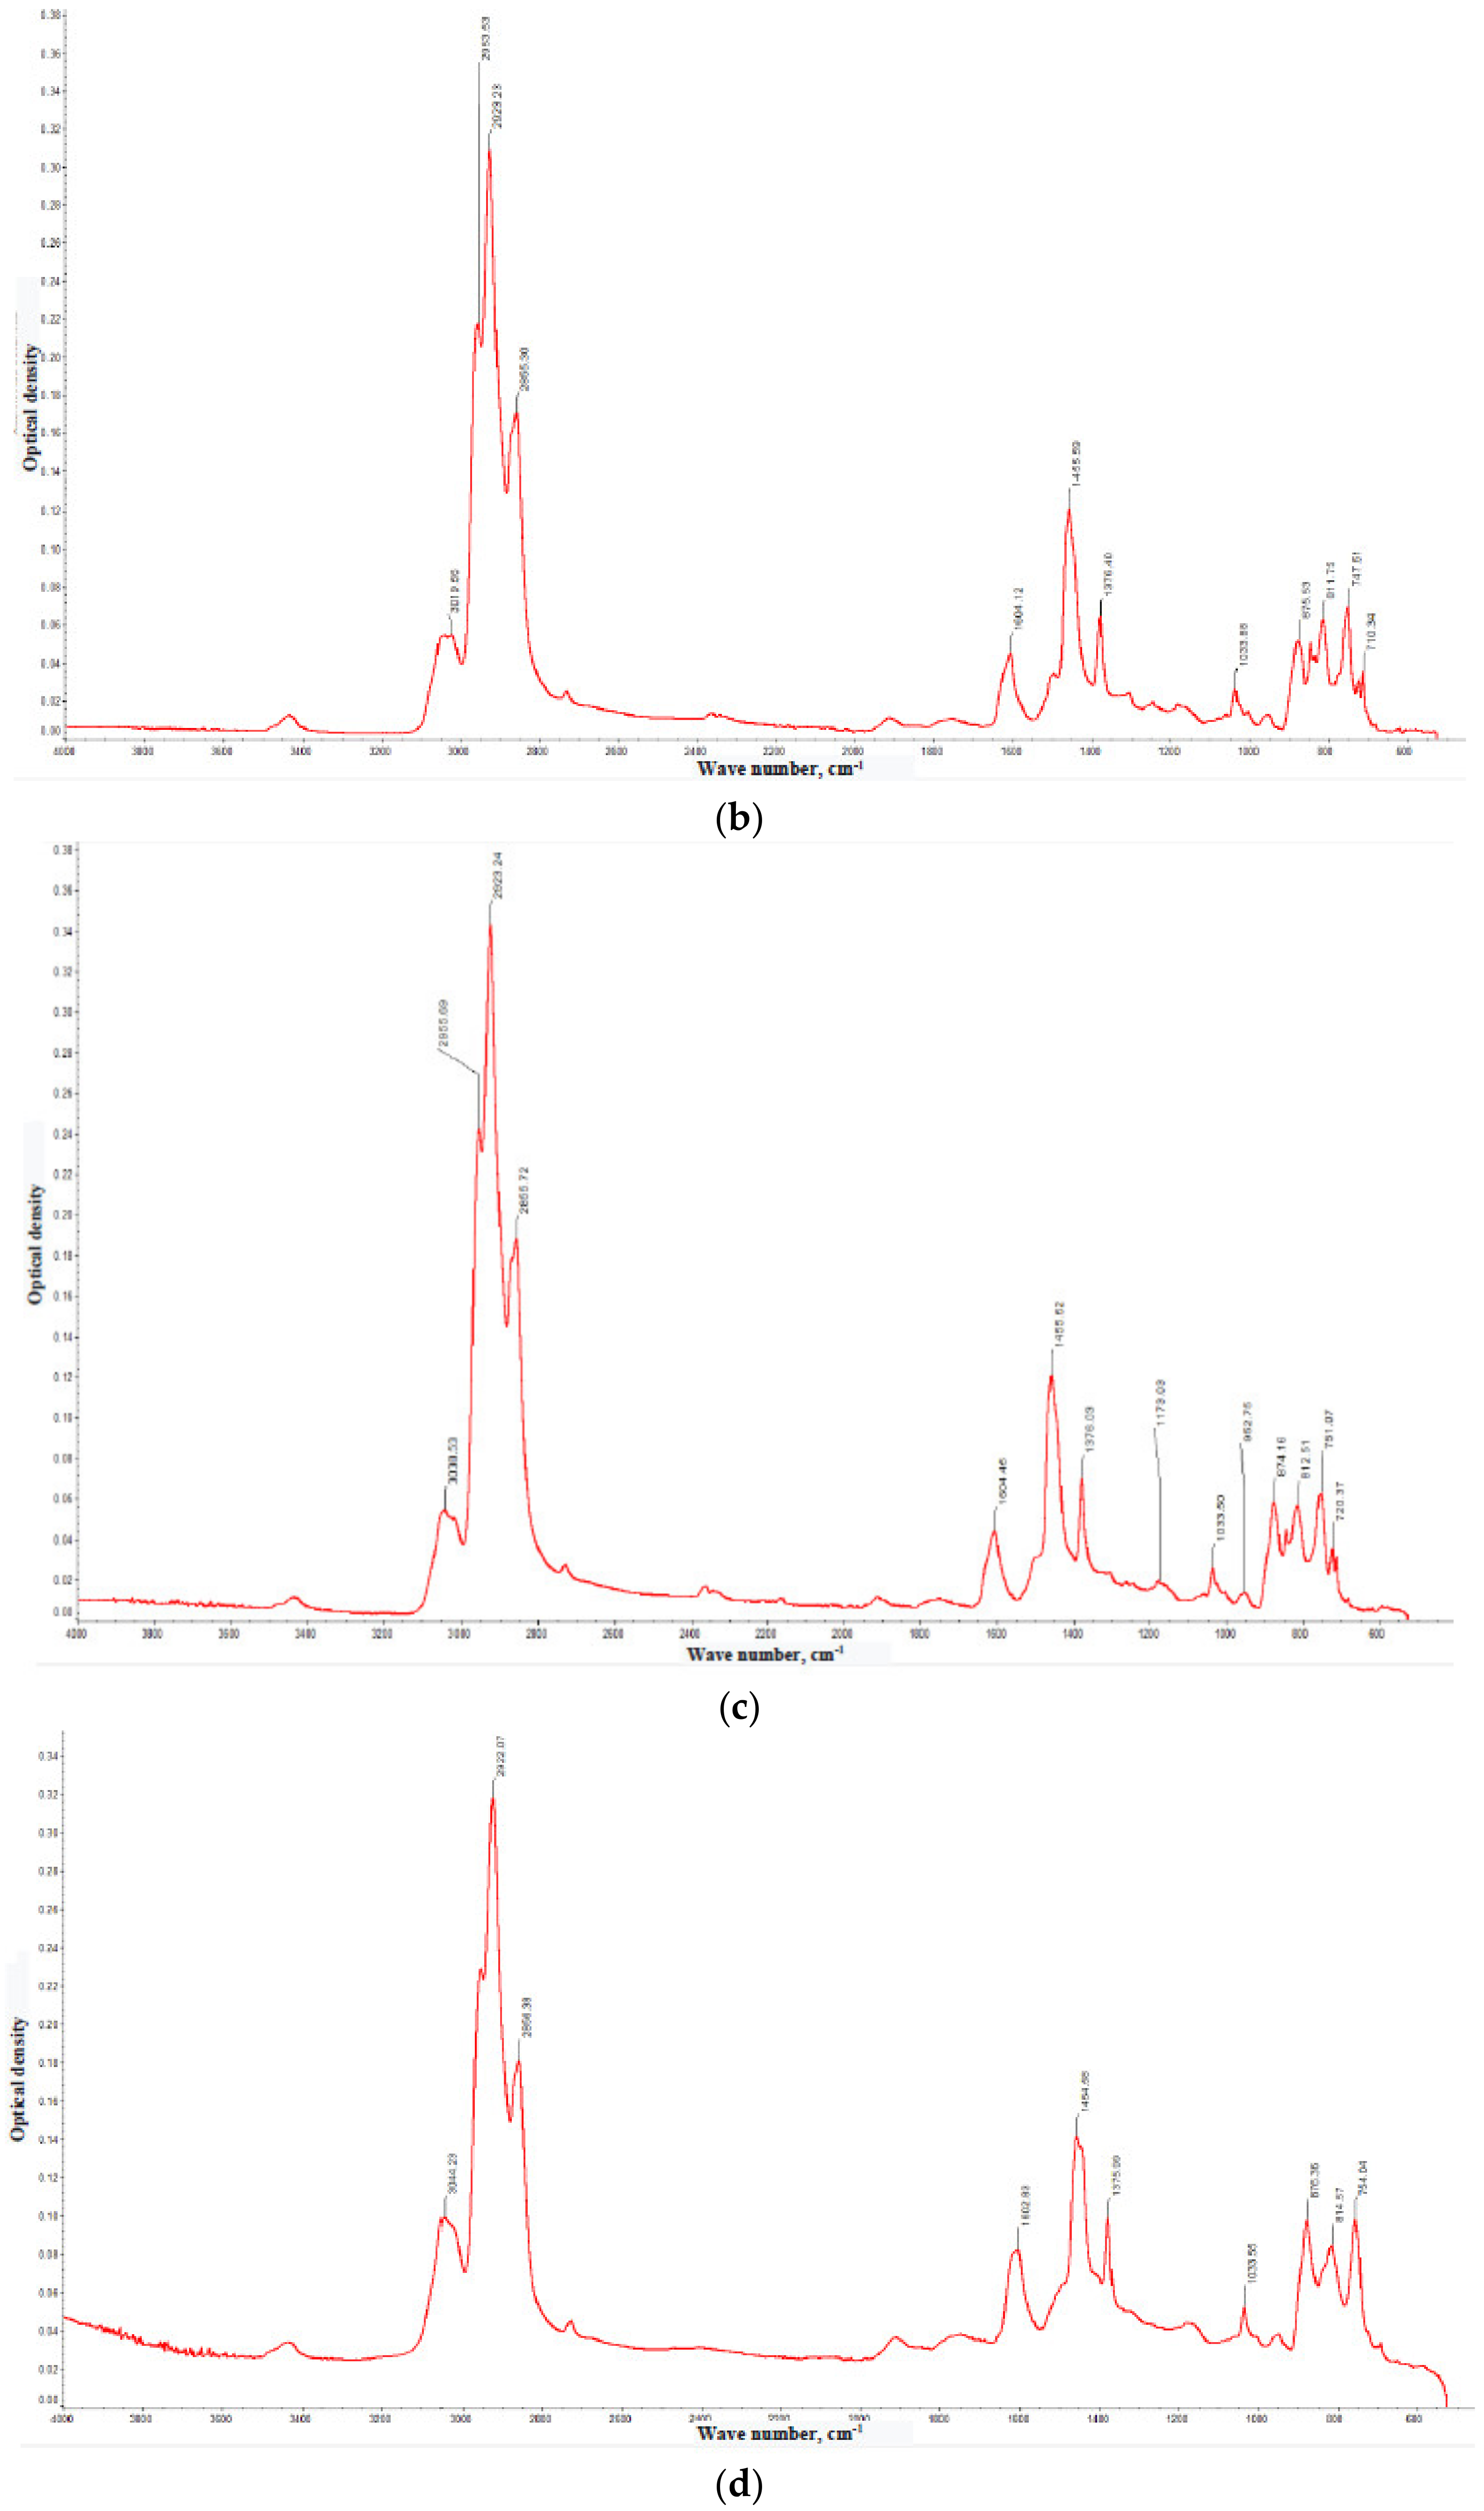
| Chemical Groups | Bands (cm−1) |
|---|---|
| Aliphatic hydrocarbons | 3000–2845 |
| Condensed aromatic hydrocarbons | 900–650 |
| Alkyl chains | 1460, 2853, 2923, 1380, and 2960 (strong peaks) |
| –CH2– | 1460 and 2920 |
| –CH3– | 1380 |
| HC–H bonds (C is the aromatic carbon atom) | 3050 |
| C–H bonds (C belongs to polycyclic aromatic system) | 870, 810, and 745 |
| Isolated benzene reings | 880 |
| Double bonds at the benzene rings | 1600 |
| ν (cm−1) | Optical Density | |||
|---|---|---|---|---|
| Fraction <350 °C | Fraction 350–400 °C | Fraction 400–450 °C | Fraction >450 °C | |
| 710–720 | – | 0.038 | 0.036 | – |
| 745–754 | 0.072 | 0.07 | 0.075 | 0.10 |
| 784 | 0.050 | – | – | – |
| 811–814 | 0.075 | 0.065 | 0.065 | 0.08 |
| 833 | 0.048 | – | – | – |
| 874–876 | 0.045 | 0.058 | 0.065 | 0.098 |
| 953 | – | – | 0.018 | – |
| 1033–1034 | 0.025 | 0.03 | 0.028 | 0.058 |
| 1173 | – | – | 0.022 | – |
| 1376–1377 | 0.056 | 0.065 | 0.078 | 0.10 |
| 1455–1456 | 0.10 | 0.12 | 0.124 | 0.14 |
| 1508 | 0.04 | – | – | – |
| 1601–1604 | 0.047 | 0.048 | 0.044 | 0.082 |
| 2855–2856 | 0.13 | 0.17 | 0.188 | 0.18 |
| 2923 | 0.23 | 0.31 | 0.34 | 0.30 |
| 2954–2956 | 0.18 | 0.22 | 0.24 | – |
| 3019–3048 | 0.58 | 0.055 | 0.055 | 0.10 |
| 3448 | 0.08 | 0.01 | 0.01 | 0.035 |
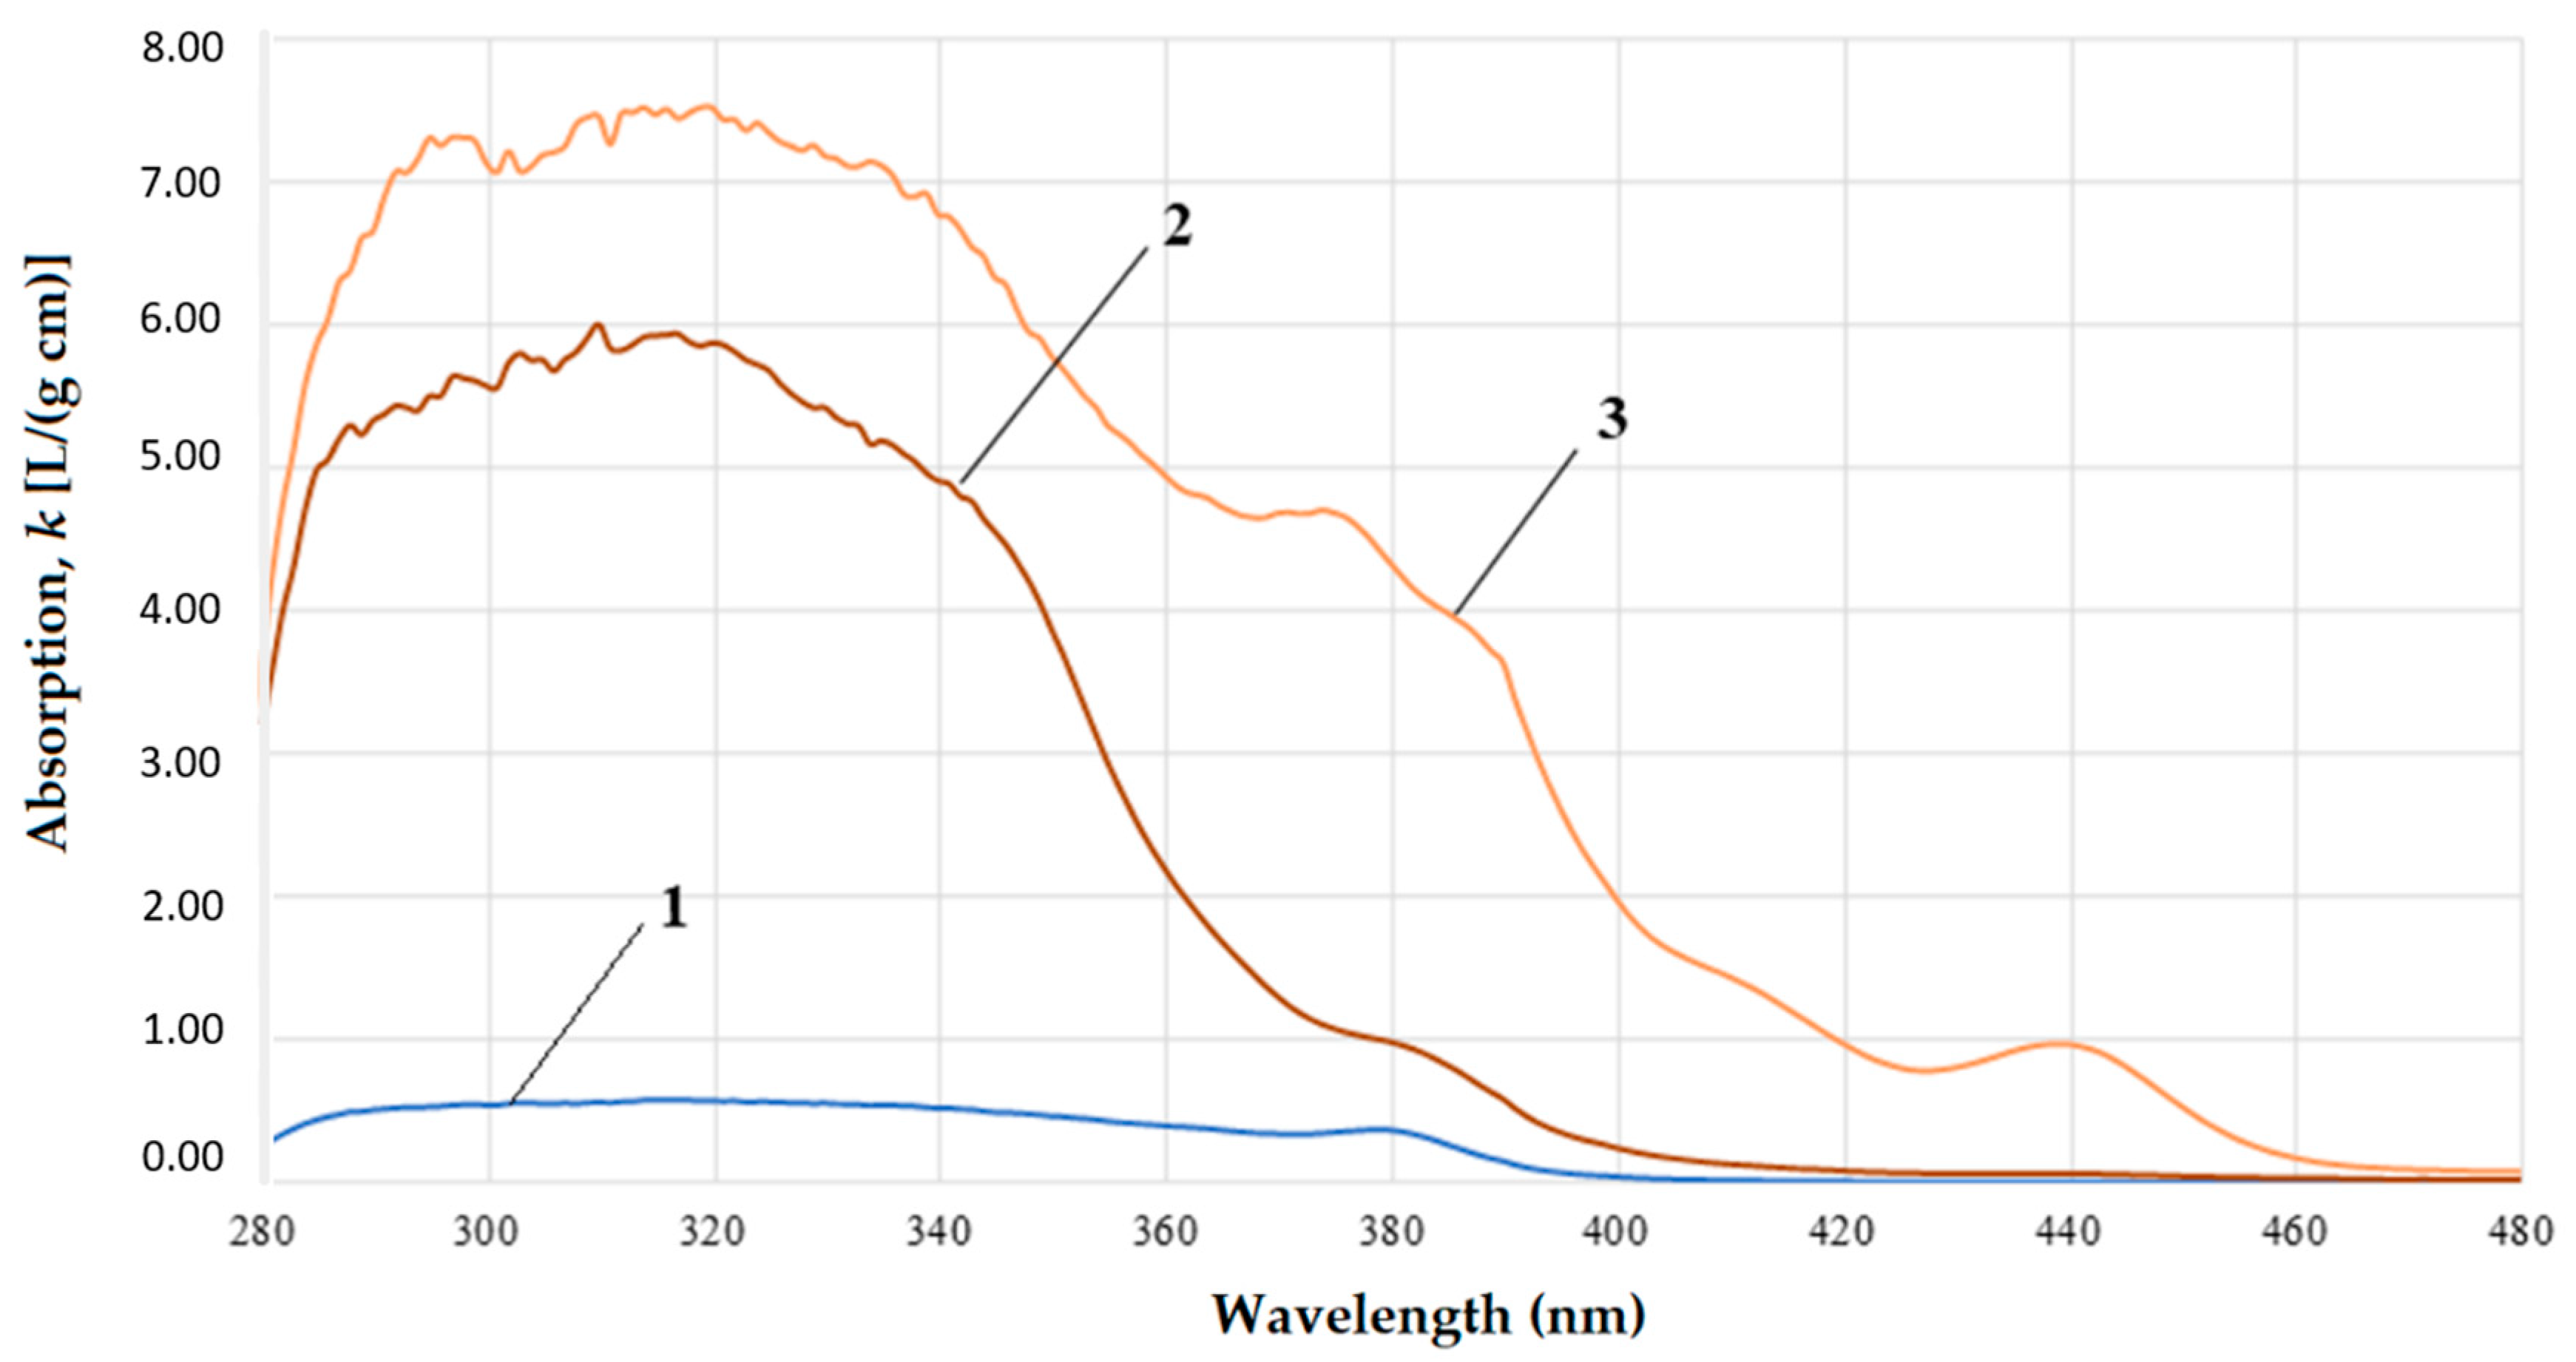
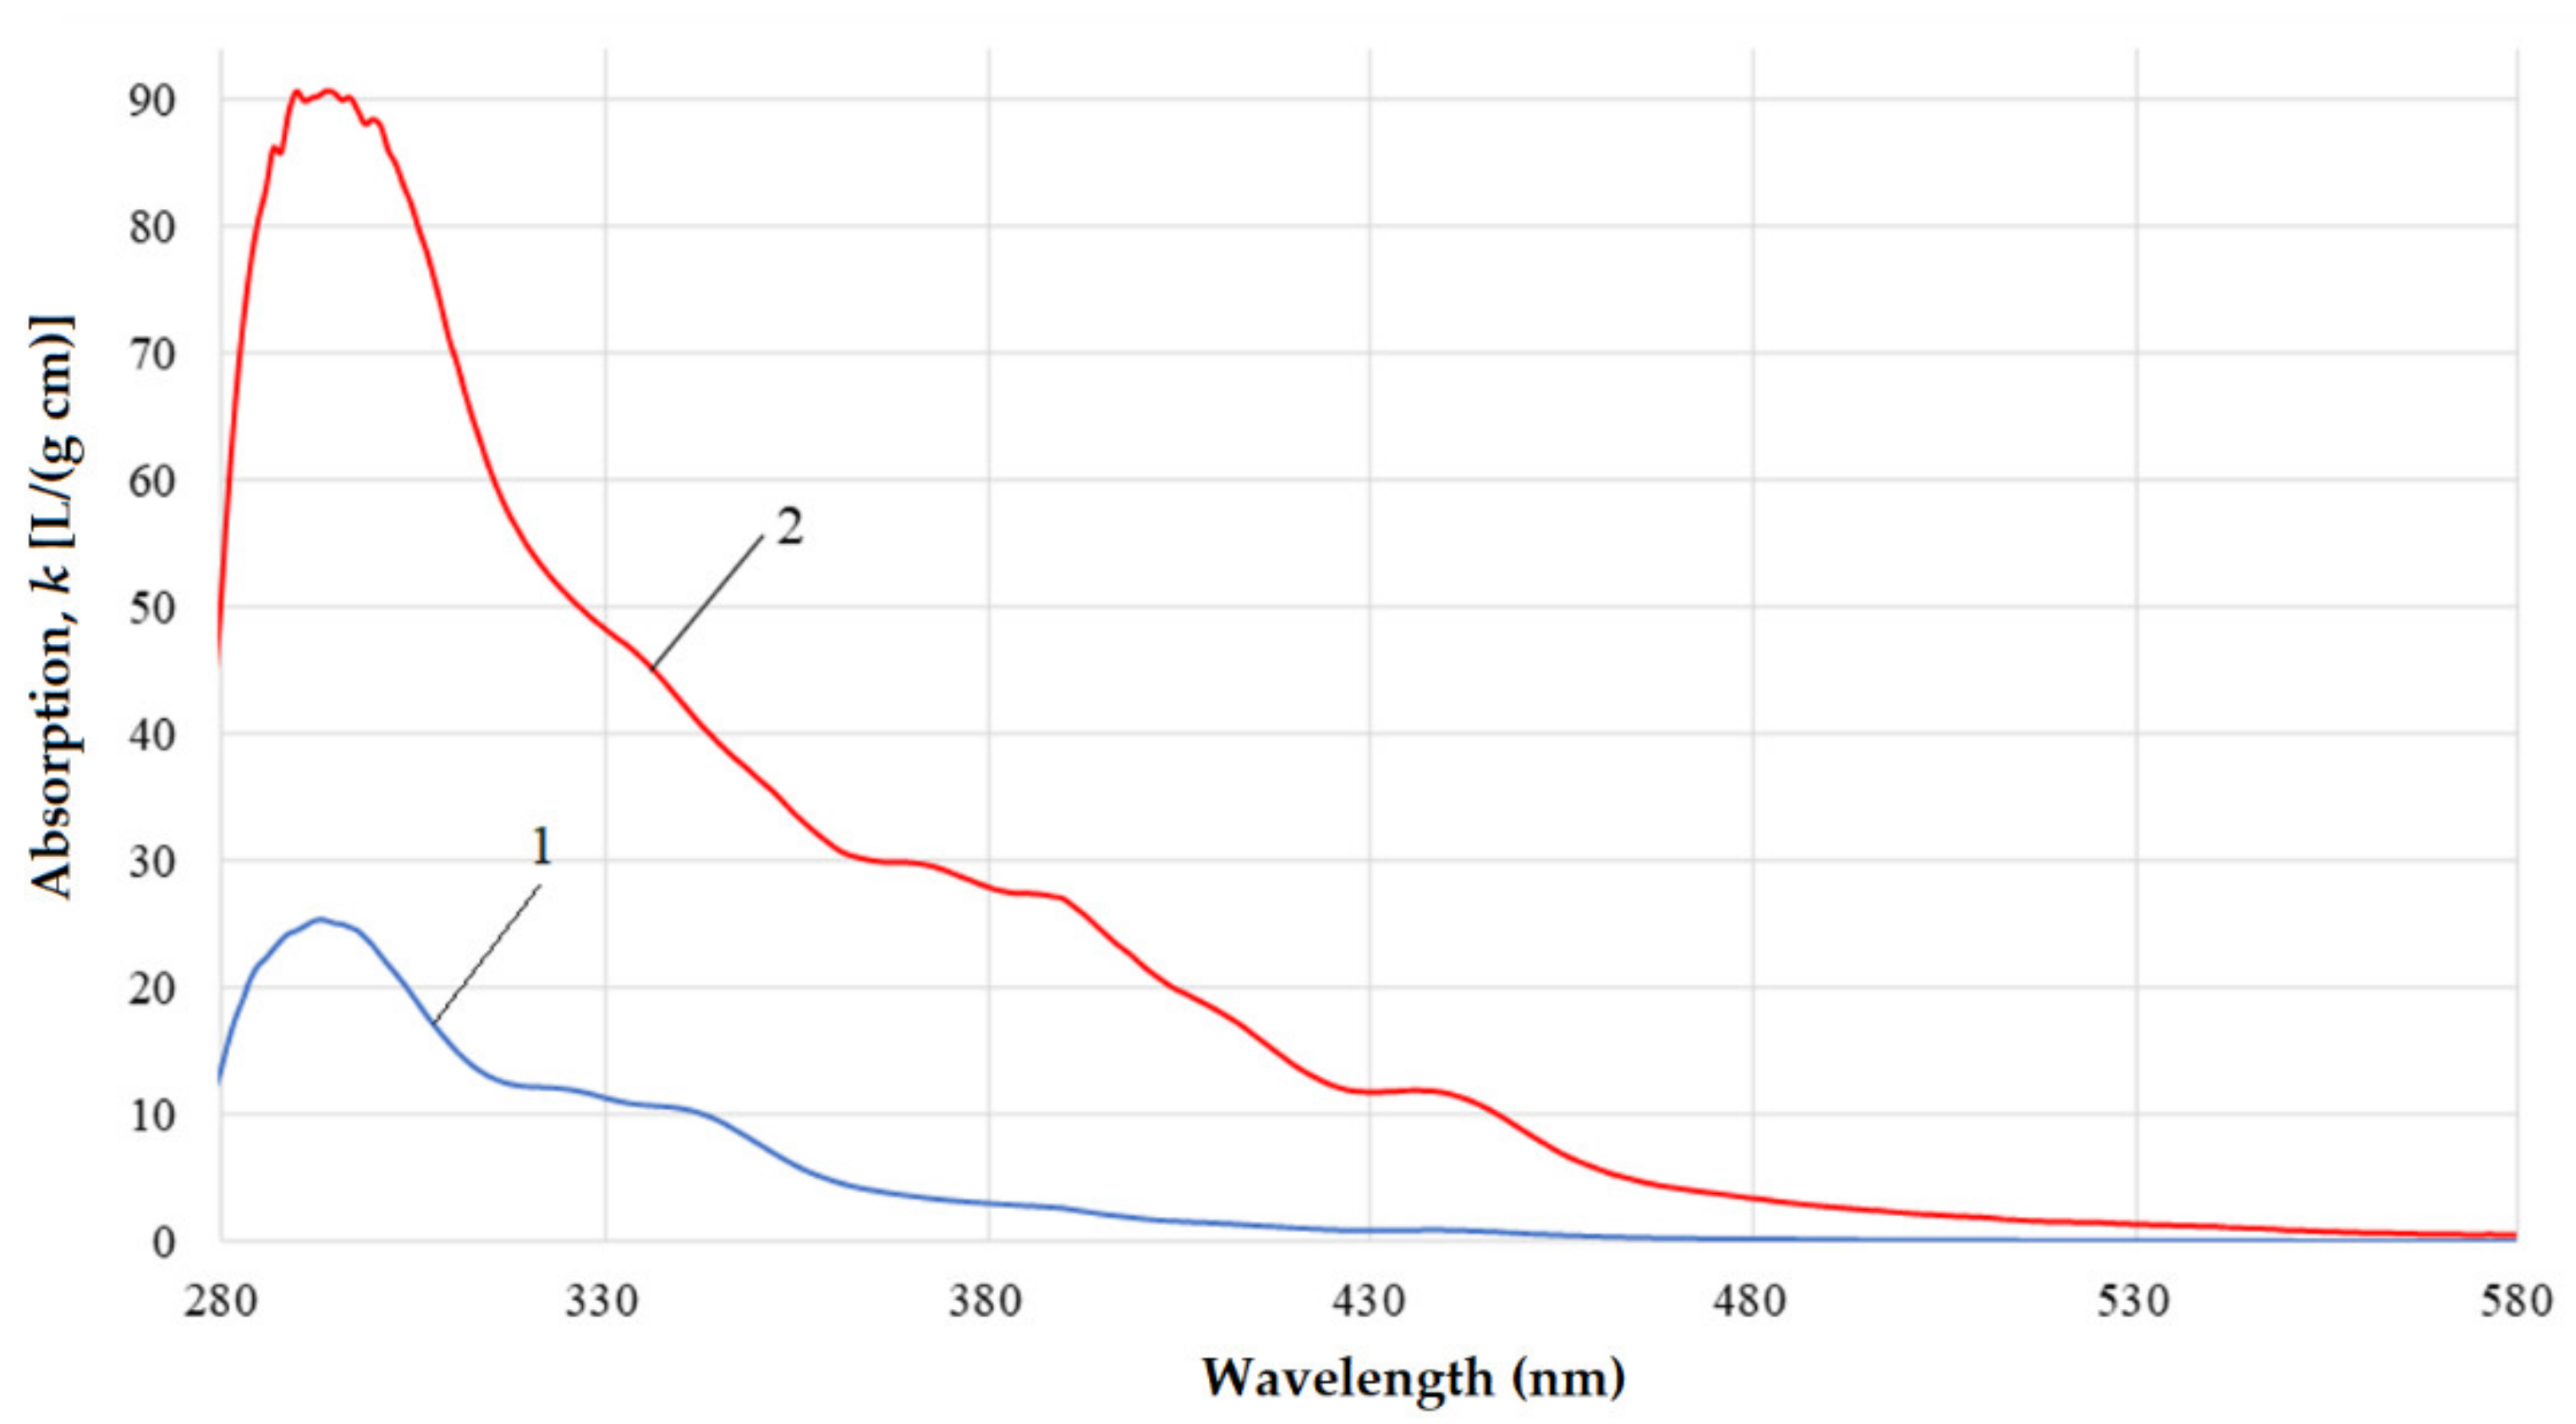
| Gasoil and Its Fractions | λmax (nm) | kmax (g cm−1 L−1) | k438 (g cm−1 L−1) | k380 (g cm−1 L−1) | λR (nm) | θk (g nm cm−1 L−1) |
|---|---|---|---|---|---|---|
| <350 °C | 378 | 0.37 | n/a | 0.37 | 455 | 3.85 |
| 350–400 °C | 310 | 6.01 | n/a | 0.97 | 450 | 14.02 |
| 400–450 °C | 312 | 9.49 | 0.81 | 3.83 | 475 | 83.15 |
| >450 °C | 289 | 91.52 | n/a | 28.23 | 550 | 883.19 |
| Gasoil | 295 | 25.36 | 0.94 | 3.04 | 480 | 79.93 |
| Fraction | Average Molecular Mass, Mav (a.u.) | Average IP (eV) | Average EA (eV) | Average Number of Aromatic Rings in the Molecules |
|---|---|---|---|---|
| <350 °C | 293 | 9.04 | 0.30 | 1 |
| 350–400 °C | 303 | 8.47 | 0.53 | 2 |
| 400–450 °C | 371 | 8.12 | 0.67 | 2–3 |
| >450 °C | n/a | 7.62 | 0.88 | 3–4 |
| Raw Material for Coking | Yield (% Mass) |
|---|---|
| Original gasoil | 24.86 |
| Fraction < 350 °C | 2.31 |
| Fraction 350–400 °C | 7.95 |
| Fraction 400–450 °C | 64.65 |
| Fraction > 450 °C | 81.86 |
Publisher’s Note: MDPI stays neutral with regard to jurisdictional claims in published maps and institutional affiliations. |
© 2022 by the authors. Licensee MDPI, Basel, Switzerland. This article is an open access article distributed under the terms and conditions of the Creative Commons Attribution (CC BY) license (https://creativecommons.org/licenses/by/4.0/).
Share and Cite
Dolomatov, M.Y.; Burangulov, D.Z.; Dolomatova, M.M.; Osipenko, D.F.; Zaporin, V.P.; Tukhbatullina, A.A.; Akhmetov, A.F.; Sabirov, D.S. Low-Sulphur Vacuum Gasoil of Western Siberia Oil: The Impact of Its Structural and Chemical Features on the Properties of the Produced Needle Coke. C 2022, 8, 19. https://0-doi-org.brum.beds.ac.uk/10.3390/c8010019
Dolomatov MY, Burangulov DZ, Dolomatova MM, Osipenko DF, Zaporin VP, Tukhbatullina AA, Akhmetov AF, Sabirov DS. Low-Sulphur Vacuum Gasoil of Western Siberia Oil: The Impact of Its Structural and Chemical Features on the Properties of the Produced Needle Coke. C. 2022; 8(1):19. https://0-doi-org.brum.beds.ac.uk/10.3390/c8010019
Chicago/Turabian StyleDolomatov, Mikhail Y., Daniyar Z. Burangulov, Milana M. Dolomatova, Danil F. Osipenko, Viktor P. Zaporin, Alina A. Tukhbatullina, Arslan F. Akhmetov, and Denis S. Sabirov. 2022. "Low-Sulphur Vacuum Gasoil of Western Siberia Oil: The Impact of Its Structural and Chemical Features on the Properties of the Produced Needle Coke" C 8, no. 1: 19. https://0-doi-org.brum.beds.ac.uk/10.3390/c8010019