Optimization of β-galactosidase Production by Batch Cultures of Lactobacillus leichmannii 313 (ATCC 7830™)


Department of Food Science, University of Otago, 9054 Dunedin, New Zealand
*
Author to whom correspondence should be addressed.
Fermentation 2020, 6(1), 27; https://0-doi-org.brum.beds.ac.uk/10.3390/fermentation6010027
Submission received: 22 December 2019
/
Revised: 12 February 2020
/
Accepted: 13 February 2020
/
Published: 15 February 2020
(This article belongs to the Special Issue Biocatalysis and Fermentation—Enzyme Production and Whole Cell Biocatalysis)
Abstract
:The endoenzyme β-galactosidase (β-d-galactoside galactohydrolase; EC 3.2.1.23) has been used at industrial scales for the preparation of lactose-free milk and for the conversion of lactose to galacto-oligosaccharides (GOS) prebiotics. In this study, using Plackett–Burman (PB) design and the response surface methodology (RSM), the batch growth conditions for the production of β-galactosidase in DeMan-Rogosa-Sharpe (MRS) media have been studied and optimized for Lactobacillus leichmannii 313 (ATCC 7830™) for the first time. The incubation temperature (30 < T < 55 °C), starting pH (5.5 < pH < 7.5), and carbon source (glucose, lactose, galactose, fructose, and sucrose) were selected as the significant variables for optimization. The maximum crude β-galactosidase production (measured by specific activity) was 4.5 U/mg proteins and was obtained after 12 h of fermentation. The results of the PB design and further optimization by RSM showed that the initial pH of 7.0 and 15.29 g/L of lactose were the levels that gave the optimum observed and predicted β-galactosidase activities of 23.13 U/mg and 23.40 U/mg, respectively. Through RSM optimization, β-galactosidase production increased significantly (over five-fold) in optimized medium (23.13 U/mg), compared with unoptimized medium (4.5 U/mg). Moreover, the crude enzyme obtained was able to hydrolyze lactose and also produce galacto-oligosaccharides. Because its ability to produce β-galactosidase was significantly improved through optimization by RSM, L. leichmannii 313 can serve as a potential source of β-galactosidase for food applications at an industrial scale.
1. Introduction
β-galactosidase (β-d-galactoside galactohydrolase; EC: 3.2.1.23) is an enzyme used in some industrial processes to hydrolyze lactose for several purposes. On the one hand, lactose hydrolysis addresses an important public health challenge, as it helps in the control of symptoms developed in individuals who suffer from lactose intolerance after consuming dairy products [1,2]. On the other hand, lactose hydrolysis helps control lactose crystallization in dairy products, and can also be used as a treatment option to reduce the levels of lactose in whey by-products of cheese manufacturing processes [3]. Interestingly, during hydrolysis reactions, β-galactosidase also has the ability to transfer galactose residues onto other lactose or galactose molecules to form galacto-oligosaccharides (GOS). GOS represent an important functional food ingredient, as they are a prebiotic which is important for gut health [4,5,6]. In human beings, the consumption of GOS has significant health benefits, including the development of anti-cancer properties in the colon, mineral absorption, lipid metabolism, anti-inflammatory and immune effects, and overall well-being [7].
Over the years, research efforts have intensified in the search for β-galactosidase for some of the aforementioned biotechnological applications [8]. Once an organism has been identified as a good source of this enzyme, statistical experimental methods are used to optimize the conditions and parameters that lead to high enzyme yields. Plackett–Burman designs and the response surface methodology (RSM) are among the widely used experimental design approaches employed to optimize the production of enzymes from microbial species [9,10,11,12]. This is because these statistical tools save time, allow the experimenter to see the single and combined effects of multivariate parameters, and provide models which explain how those parameters are related to chosen response variables [13,14].
β-galactosidase is widely distributed in plants, animals, and microorganisms. For the purpose of biotechnological applications, yeast species such as Kluyveromyces marxians, Kluyveromyces lactis, and Kluyveromyces fragilis are widely used as sources of this enzyme [15,16,17]. Bacteria belonging to the bifidobacterium (e.g., B. adolescentis, infantis, and longum) [18,19], and lactobacillus (e.g., L plantarum, crispatus, acidophilus, delbrueckiis sp. bulgaricus, etc.) [20,21,22] genera are also exploited (albeit to a lesser extent) as sources of this enzyme. However, not all lactobacilli have been studied extensively for their ability to produce this enzyme. Lactobacillus leichmannii 313 (ATCC 7830) is a food-grade lactobacillus that is used in the production of sour rye bread [23], hard cheeses [24], and yoghurt [25]. In 1986, L. leichmannii 313 was found to be a potential source of β-galactosidase [26]. However, since then, only a few studies have explored the full extent of this bacterium as a source of β-galactosidase. Aside from the works of Premi, et al. [27] and Cesca, et al. [28], who studied β-galactosidase from lactobacillus species (including ATCC 7830), we are not aware of any comprehensive attempts to optimize the production of β-galactosidase from this bacterium. Recently, we reported on the purification and catalytic properties of β-galactosidase from L. leichmannii 313 [29], but research studies aimed at identifying factors and parameters for the profuse production of this enzyme by L. leichmannii 313 are scant. Such studies are needed to help diversify the sources of β-galactosidase and make it possible for β-galactosidase from L. leichmannii 313 to be used at industrial scales in the food industry.
The objective of this study was therefore to utilize Plackett–Burman design and RSM to screen for important variables and further optimize the levels of those variables that contribute to the optimum production of β-galactosidase by L. leichmannii 313 during batch growth in MRS medium. The hydrolytic and transgalactosylation properties of crude β-galactosidase from L. leichmannii 313 on lactose as a substrate were also confirmed.
2. Materials and Methods
2.1. Lactobacillus Strain and Culture Conditions
The Lactobacillus leichmannii 313 (ATCC® 7830TM) strain was obtained from the New Zealand Reference Culture Collection: Medical Section (NZRM) of the Institute of Environmental Science and Research, New Zealand. The bacterial strain was preserved at −80 °C. Frozen cells were revived in MRS broth, followed by plating and sub-culturing in MRS agar media (BD Biosciences, Sparks, MD, USA) at 37 °C for 12 h. Following this, a single colony was inoculated in MRS broth (BD Biosciences, Sparks, MD, USA) and grown (37 °C, 12 h) until optical density at 560 nm (OD560nm) reached ~1.0. This served as inoculum for subsequent experiments.
2.2. Impact of Agitation and Fermentation Time on the Production of Crude Enzyme
To study the effect of agitation, aliquots of the inoculum were seeded in 30 mL capacity universal media glass bottles containing 20 mL of fresh MRS broth to an OD560nm of 0.1, and grown (37 °C) in either static (0 rpm) or shaken (100 rpm) conditions. Cultures were harvested at the end of 12 h and evaluated for cell growth (via OD560nm measurements) and specific enzyme (β-galactosidase) activity (U/mg proteins). To study the effect of fermentation time, aliquots of the inoculum were seeded into 20 mL of MRS broth (in a 30 mL glass vial) to an initial OD560nm of 0.1 and grown in static conditions (0 rpm, 24 h, 37 °C). The cell growth (OD560nm), specific enzyme activity (U/mg proteins), and pH were monitored at selected time points.
2.3. Description of the Bacterial Growth Curve
The experimental data of the growth curves were fitted to the Gompertz model using parameters A, μmax, λ, and ε, based on Equation (1), as derived by Zwietering, et al. [30], from the original equation of Gompertz [31]:
where Dt is the OD560nm at time t; t is the time of growth (h); D0 is the OD560nm at t = 0; A, the asymptotic value, is the increase of the optical density between D0 and ODmax; µmax is the maximum growth rate (h–1), calculated from the slope of a semi-logarithmic plot of OD560nm versus time (h); λ is the duration time of the lag phase in h; and ε is the exponential growth time, given by
Dt = A exp (–exp [(μmax e/A) (λ – t) + 1])
ε = A/μmax
These parameters were estimated by the application of the ‘grofit’ package in R [32].
2.4. Extraction of Crude Enzymes
The bacteria cells were harvested by centrifugation (4000× g, 4 °C, 10 min) and washed twice in 50 mM potassium phosphate buffer (pH 7.0) via centrifugation. The bacteria cell pellets were then suspended in ice-cold 50mM potassium phosphate buffer (pH 7.0). Glass beads (150–212 micron, acid-washed, Sigma-Aldrich, St. Louis, MO, USA) were added to the bacteria suspension at 1:3 v/v (1/3 beads and 2/3 cell suspension. Together, the container was not more than half-full). The mixture was vigorously agitated via 2 min vortexing and 2 min incubation in an ice bath, for 3 cycles. The supernatant containing the crude enzyme was collected after centrifugation (12,000× g, 10 min, 4 °C). The protein concentration in the extract was determined by the Bradford assay [33], with bovine serum albumin (BSA, Sigma-Aldrich, St. Louis, MO, USA) as the standard.
2.5. Enzyme Activity Assay
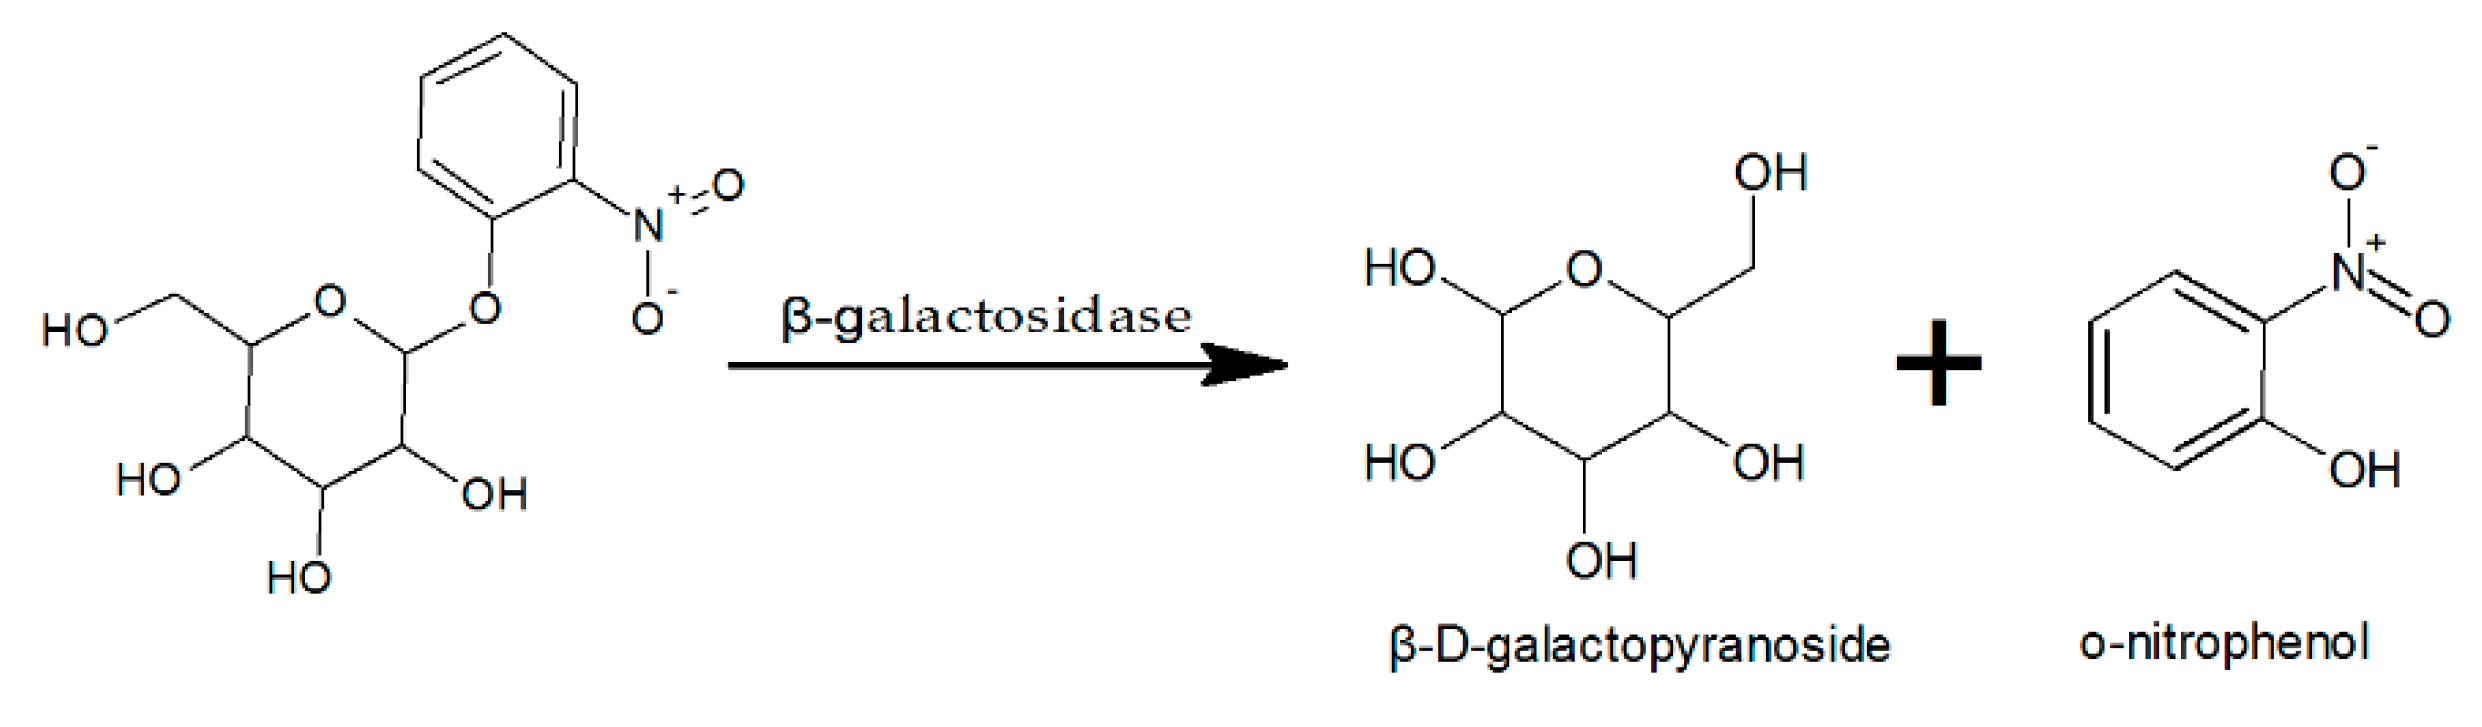
The activity of β-galactosidase was determined using chromogenic substrate o-nitrophenol-β-D-galactopyranoside (ONPG), based on the reaction shown in Figure 1.
The enzyme activity assay was based on the method described by Choonia and Lele [34]. About 15 μL of crude enzyme and 135 μL of 15 mM ONPG (Sigma-Aldrich, St. Louis, MO, USA) were reacted for 10 min and the reaction was stopped by adding 300 μL of 500 mM sodium carbonate. The amount of O-nitrophenol (ONP) generated by the reaction was measured by a Multi-mode Microplate Reader (SynergyTM 2, BioTek Instruments, Inc., Winooski, VT, USA) at 420 nm. The amount of ONP released was determined from a standard curve prepared using an ONP solution (Sigma-Aldrich, St. Louis, MO, USA). One unit of enzyme activity (U) is defined as the amount of enzyme that produces 1 mM o-nitrophenol per minute under the assay conditions.
2.6. Optimization of Fermentation Conditions
2.6.1. Independent Factor Analysis
In order to select significant variables for β-galactosidase production, independent factor analysis was employed, where one independent factor was altered while keeping the others constant. The factors studied were the incubation temperature (30 < T < 55 °C), starting pH (5.5 < pH < 7.5), and carbon source (20 g/L; glucose, lactose, galactose, fructose, and sucrose).
2.6.2. Factor Screening Experiments
Minitab version 18 Statistical Software (Minitab®, State College PA, USA) was used to generate a Plackett–Burman design to identify the effects of the three independent factors and the interaction(s) among them for β-galactosidase synthesis. The center point (0 level) and two levels of independent factors (+1/−1) (see Table 1) were set based on the optimum conditions identified from the independent factor analysis. The design required 12 runs, as shown in Table 2.
2.6.3. Central Composite Design (CCD) and Response Surface Methodology (RSM) Analysis
Following the screening experiments, the incubation temperature (30 to 55 °C), initial pH (5.0 to 7.5), and carbon source (glucose, galactose, lactose, fructose, and sucrose), as independent factors, were studied for their effect on specific β-galactosidase production by L. leichmannii 313 in MRS medium. The components in the modified MRS broth were as follows: 10 g/L proteose peptone, 10 g/L beef extract, and 5 g/L yeast extract (BD Biosciences, Sparks, MD, USA); carbon sources (glucose, galactose, lactose, fructose, and sucrose) (BDH Laboratory Supplies, Poole, UK); 1 g/L polysorbate (Tween-80) (Sigma-Aldrich, St. Louis, MO, USA); and 2 g/L ammonium citrate, 5 g/L sodium acetate, 0.1 g/L magnesium sulfate, 0.05 g/L manganese sulfate, and 2 g/L dipotassium phosphate (Ajax Finechem, Taren Point, NSW, Australia). Minitab version 18 was used to generate a central composite design (CCD) based on the center points and levels shown in Table 3. The design required 13 runs, as shown in Table 4. Response surface fitting was employed to identify and illustrate the values of the medium components that gave the optimum enzyme production levels (based on specific enzyme activity).
2.7. High-Performance Liquid Chromatography (HPLC) of β-Galactosidase Reaction Products
The derivatization and HPLC methods used to analyze the products from lactose hydrolysis and transgalactosylation by β-galactosidase are similar to what has been reported in our previous work [29]. About 100 µL of crude β-galactosidase was added to 500 µL of 600 mM lactose solution in 50 mM McIlvaine buffer (pH 5.5). After 4 h of incubation at 37 °C, this reaction was stopped by adding 50 µL of 0.33 N barium hydroxide solution and 50 µL of 5% zinc sulphate solution (w/v) to precipitate the proteins. The resulting solution was subsequently centrifuged for 10 min (2000× g, 4 °C) to remove the precipitated proteins. About 10 µL of the supernatant was diluted 10 times with water, and then derivatized by adding 100 µL of 500 mM PMP (1-Phenyl-3-methyl-5-pyrazolone, Sigma-Aldrich, St. Louis, MO, USA) solution and 100 µL of 300 mM sodium hydroxide solution, followed by incubation at 70 °C for 30 min. After cooling down to room temperature, 100 μL of 300 mM hydrochloric acid was added for neutralization. The resulting solution was extracted with chloroform three times. After removing the organic layer, the aqueous layer of the resulting mixture was diluted five times. The diluted samples were analyzed by HPLC using the Agilent 1126 system (Agilent Technologies Inc, Santa Clara, CA, USA) with a Phenomenex® Luna® C18(2) 100Å Column. The mobile phase was isocratic and consisted of 78% of 0.01 M sodium acetate buffer (pH 5.5) and 22% of acetonitrile. The flow rate of the mobile phase was 1 mL/min, with the column temperature set to 30 °C. The injection volume was 10 µL and the detection wavelength was set to 245 nm.
2.8. Statistical Analysis
Unless otherwise stated, all experiments were carried out as three independent replicates. The results were presented as means ± standard deviation. Regression analysis and the significance of the regression coefficient, as well as significant differences between means and multiple comparisons between means, were analyzed by one-way analysis of variance (ANOVA) and post-hoc Tukey’s honestly significant difference (HSD) test using Minitab 18 Statistical Software. A p-value < 0.05 and 95% confidence level were used to indicate statistical differences.
3. Results and Discussion
3.1. Optimization of Fermentation Conditions
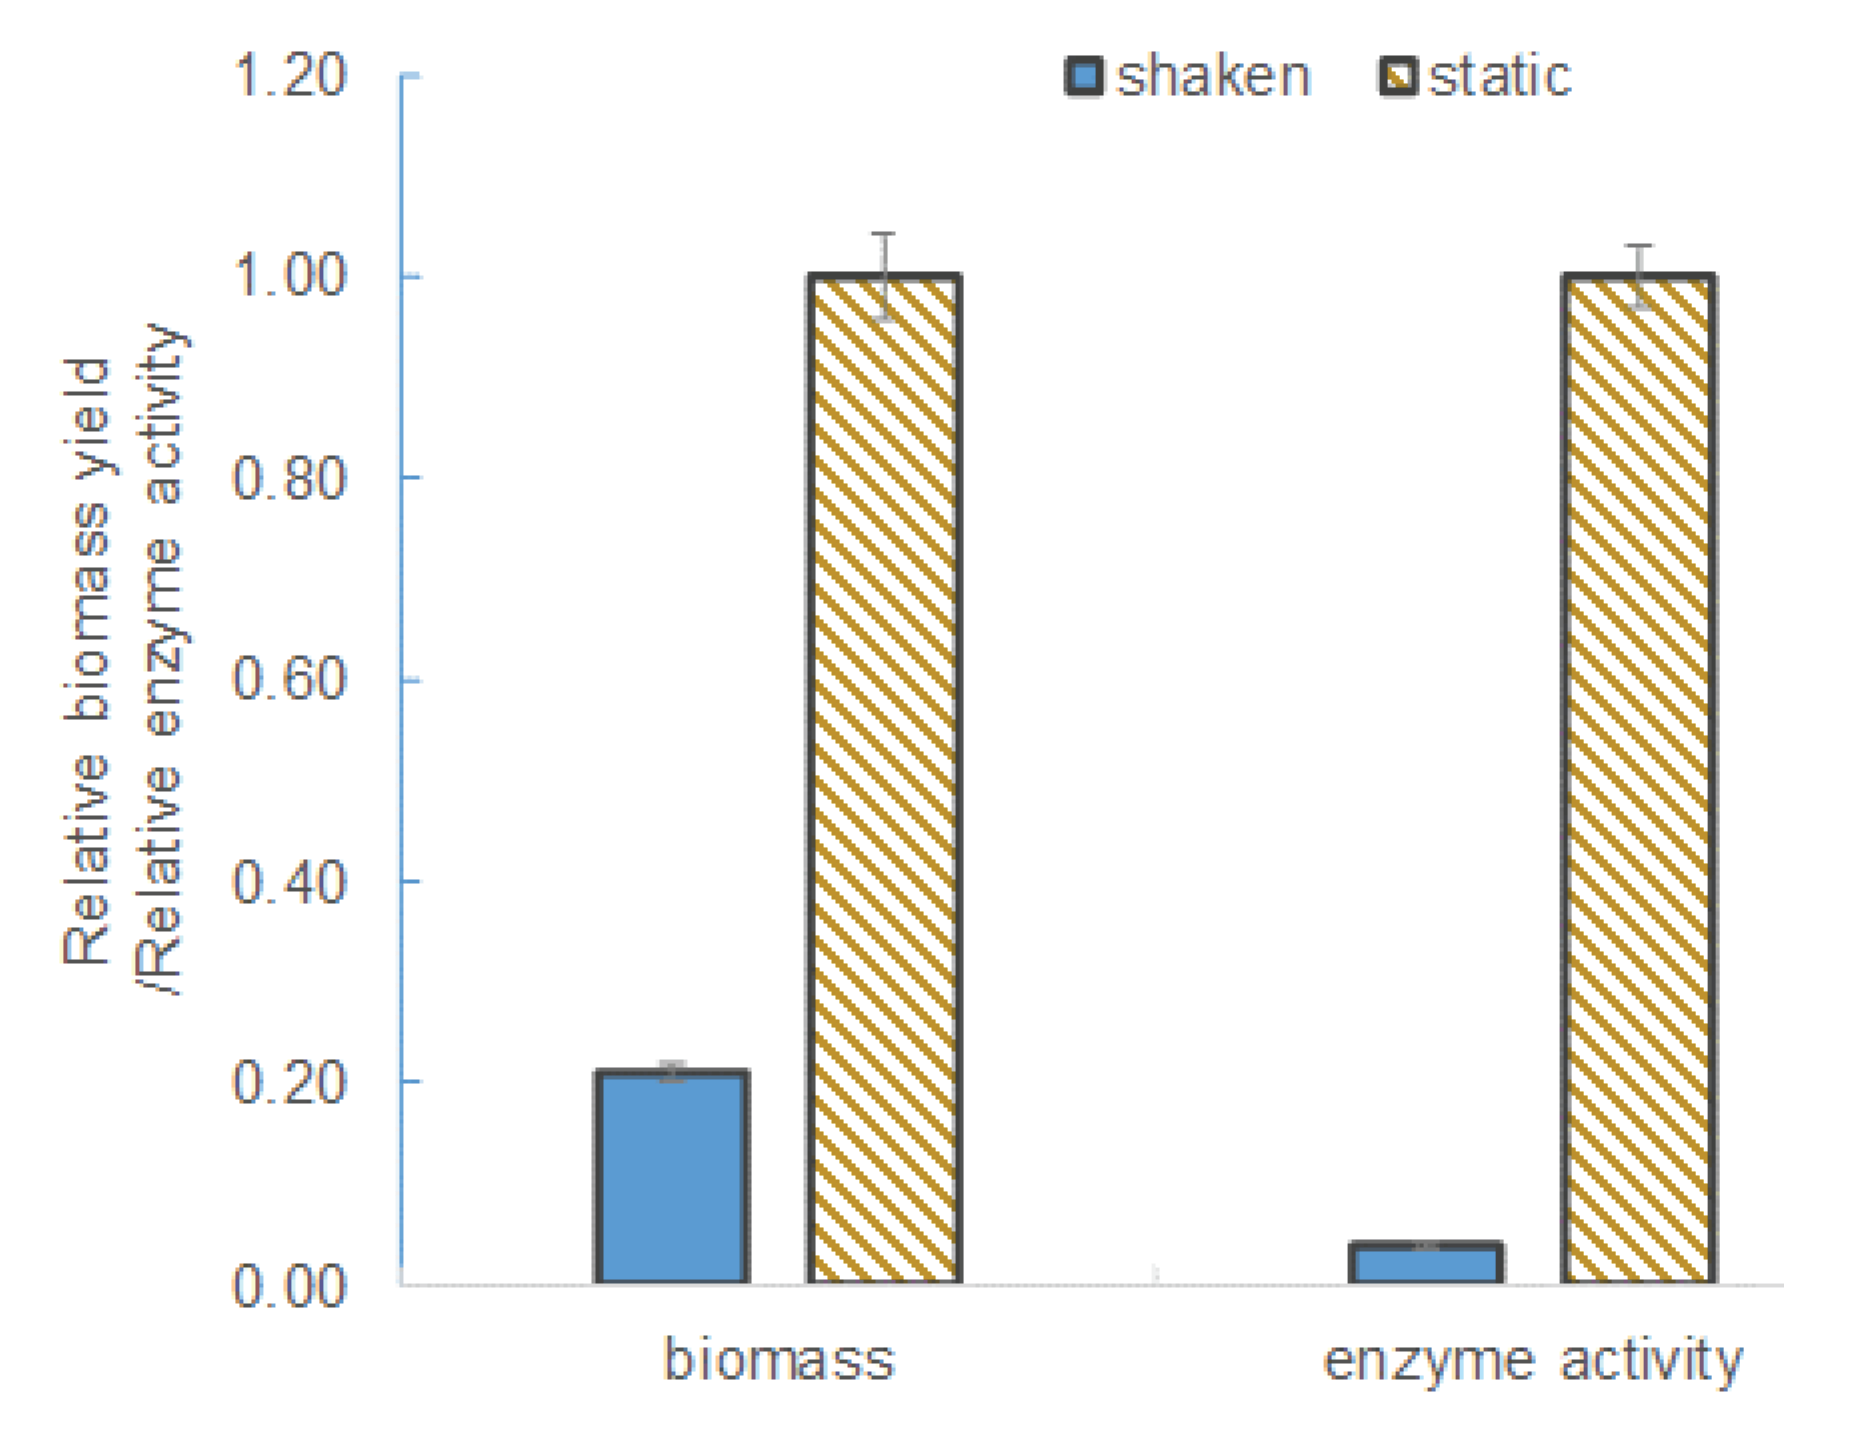
L. leichmannii 313 is classified by ATCC as a microaerophilic organism. Therefore, unlike strict anaerobes, this species is able to survive in the presence of low levels of oxygen. In this study, culture media grown under agitation (shaken at 100 rpm) conditions yielded significantly lower levels of β-galactosidase and biomass (see Figure 2). The biomass yield and enzyme activity levels in static culture (i.e., those grown without shaking) were ~ 5-fold and 30-fold higher, respectively, than in the shaken cultures. This observation can be attributed to the effect of oxygen or aeration on the growth and metabolism of L. leichmannii 313. Factors that promote aerobic conditions (including intense agitation) have been shown to significantly inhibit the growth of lactobacilli [25,35]. Moreover, previous studies have shown that aerobic conditions inhibit cell growth and the production of certain enzymes (e.g., cell-envelope proteinases) by L. leichmannii 313 [36]. This is due to a switch in the usual homolactic fermentation that results in a lower ATP yield per glucose consumed, as well as activation of the enzyme pyruvate oxidase, which converts the oxygen in the media to hydrogen peroxide [36]. Hydrogen peroxide is a bacteriostatic compound that inhibits cell growth, and this accounts for the low levels of biomass. Static cultures, on the other hand, preserve a near anaerobic condition in the culture, resulting in higher biomass and enzyme yields. The higher biomass yields can be attributed to an efficient utilization of the carbon (i.e., glucose) [37]. Typically, anaerobic conditions activate the pyruvate-formate lyase system, which, by the actions of acetyl phosphate and acetyl kinase, increases the efficiency of ATP generation per glucose consumed. The efficient sugar utilization and higher levels of ATP produced lead to higher biomass levels [35,38]. This phenomenon has been demonstrated in Streptococcus mutans [39], as well as in some lactobacilli, such as L. johnsonii and L. gasseri [40], L. plantarum [41], and L. leichmannii 313 [36]. Based on these findings (shown in Figure 2), subsequent experiments in this study were carried out under static conditions.
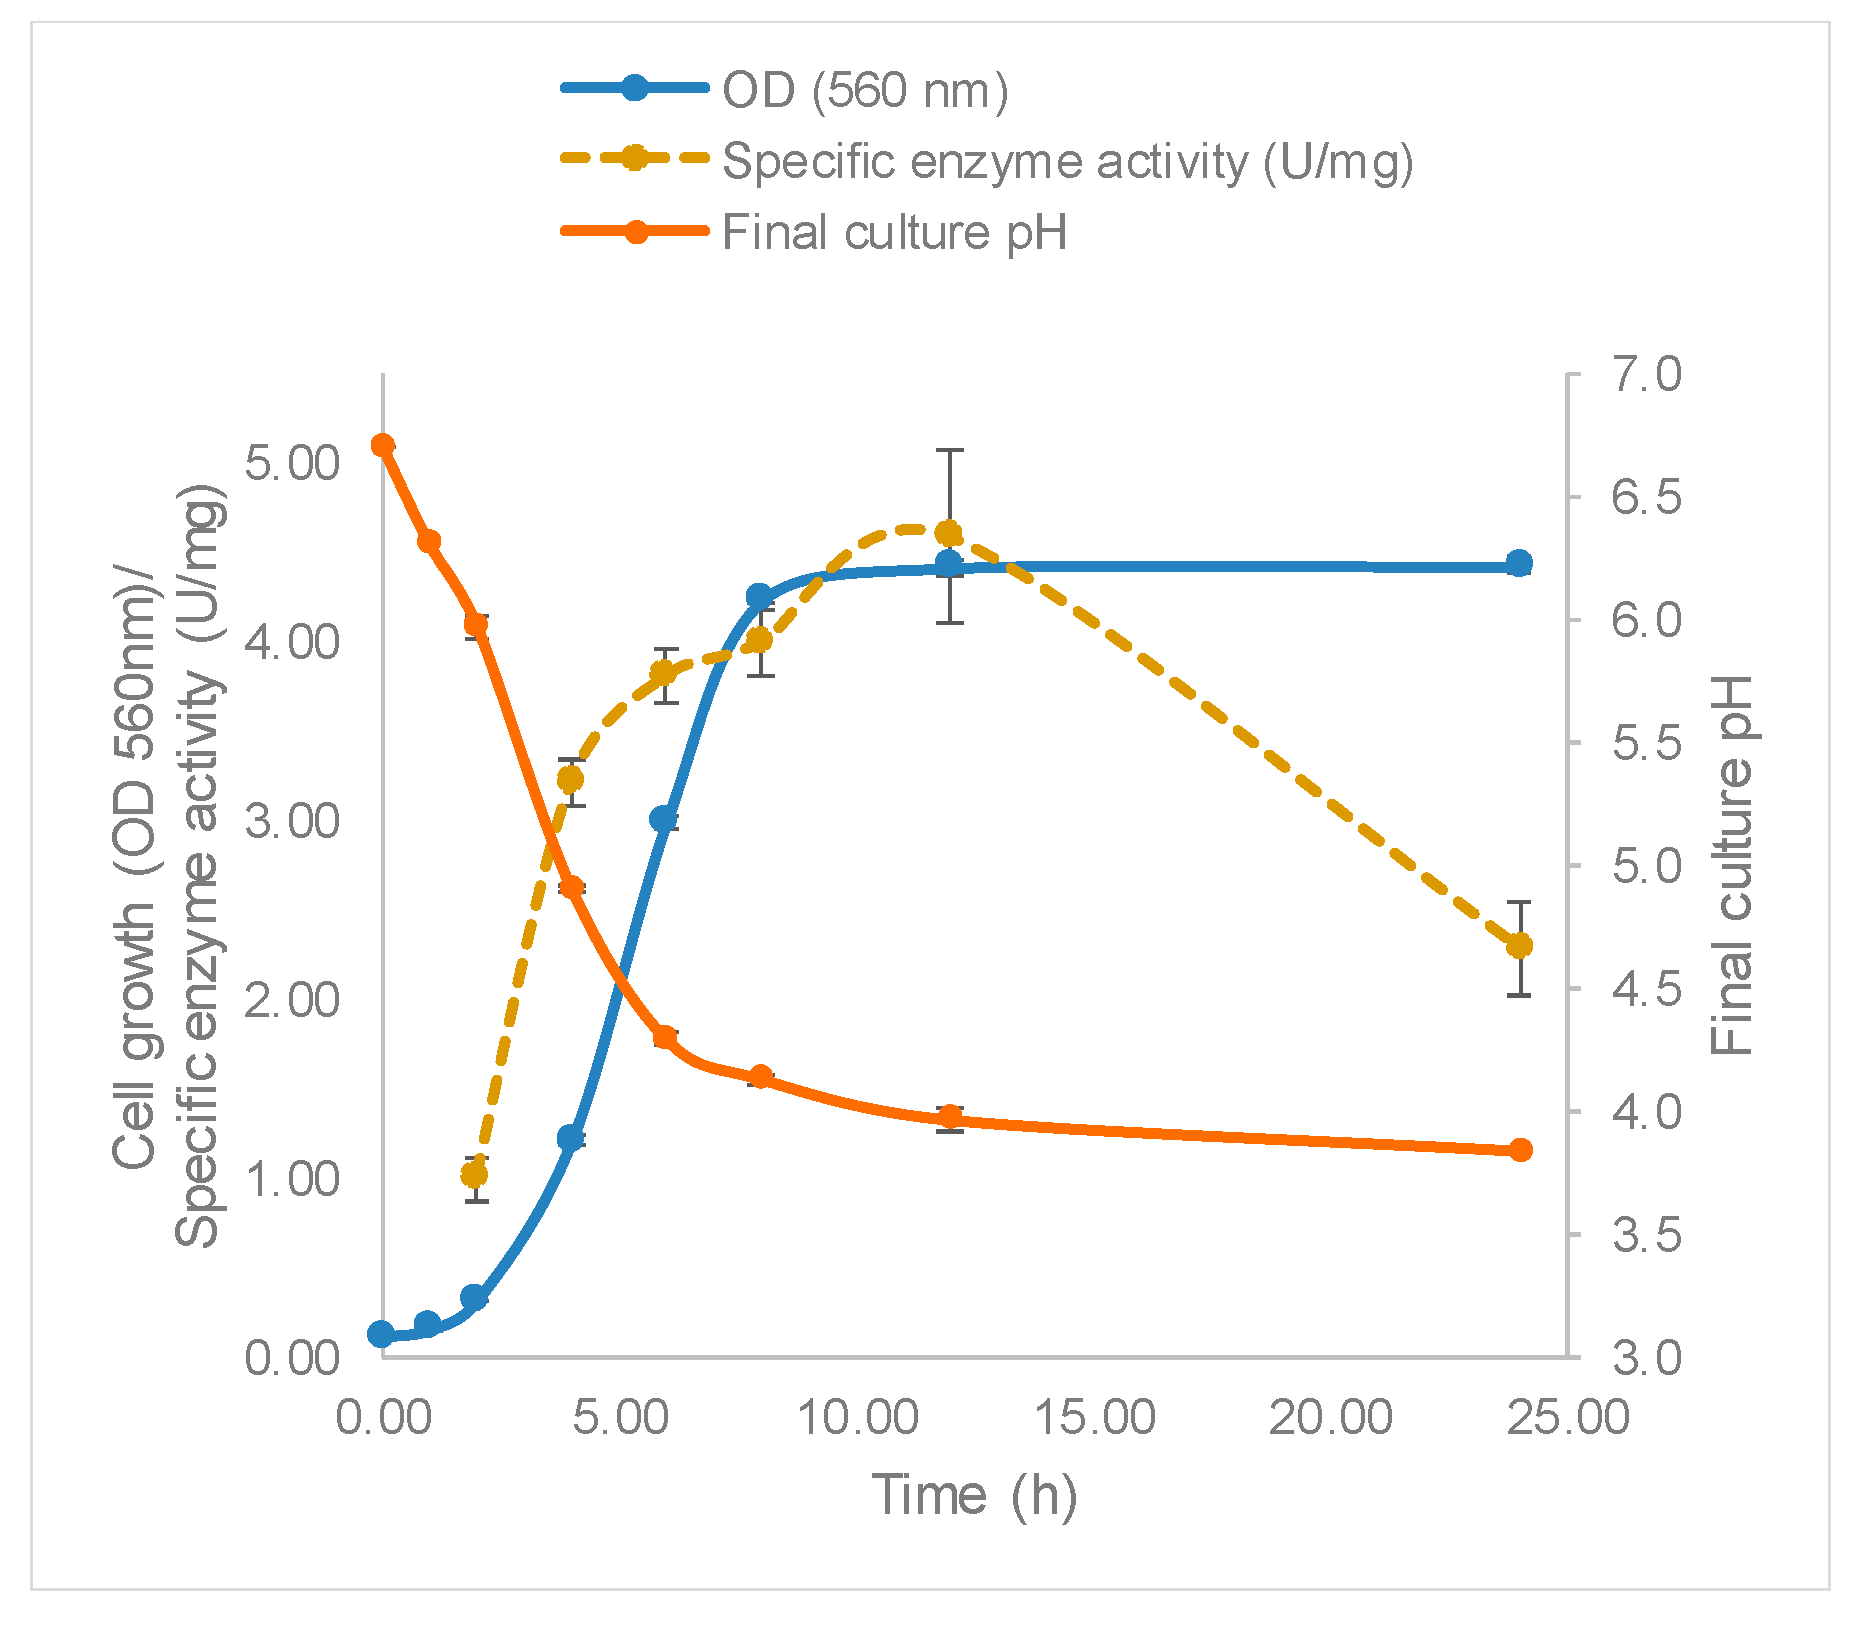
The growth of L. leichmannii 313 and profile of β-galactosidase production are shown in Figure 3. The Gompertz model showed that the lag phase was about 2.8 h, after which the bacteria proliferated rapidly at a growth rate of 1.0 per hour, until a maximum OD of 4.5 was attained after 10 h. Accompanying the increasing biomass was the specific enzyme activity, which reached a maximum of 4.58 U/mg after 12 h of growth. This time point that corresponds to the early stationary phase of bacteria growth. The fact that the β-galactosidase levels were highest in the early stationary phase is consistent with reports of other studies involving lactobacilli [42]. Enzyme activity declined after 12 h, perhaps corresponding to the using up of substrates required for growth, or the production of organic acids leading to the lowering of media pH to levels that inhibit bacteria growth. The pH of the growth medium decreased and reached~3.9 after 24 h (Figure 3, Table 5).
3.1.1. Independent Factor Analysis
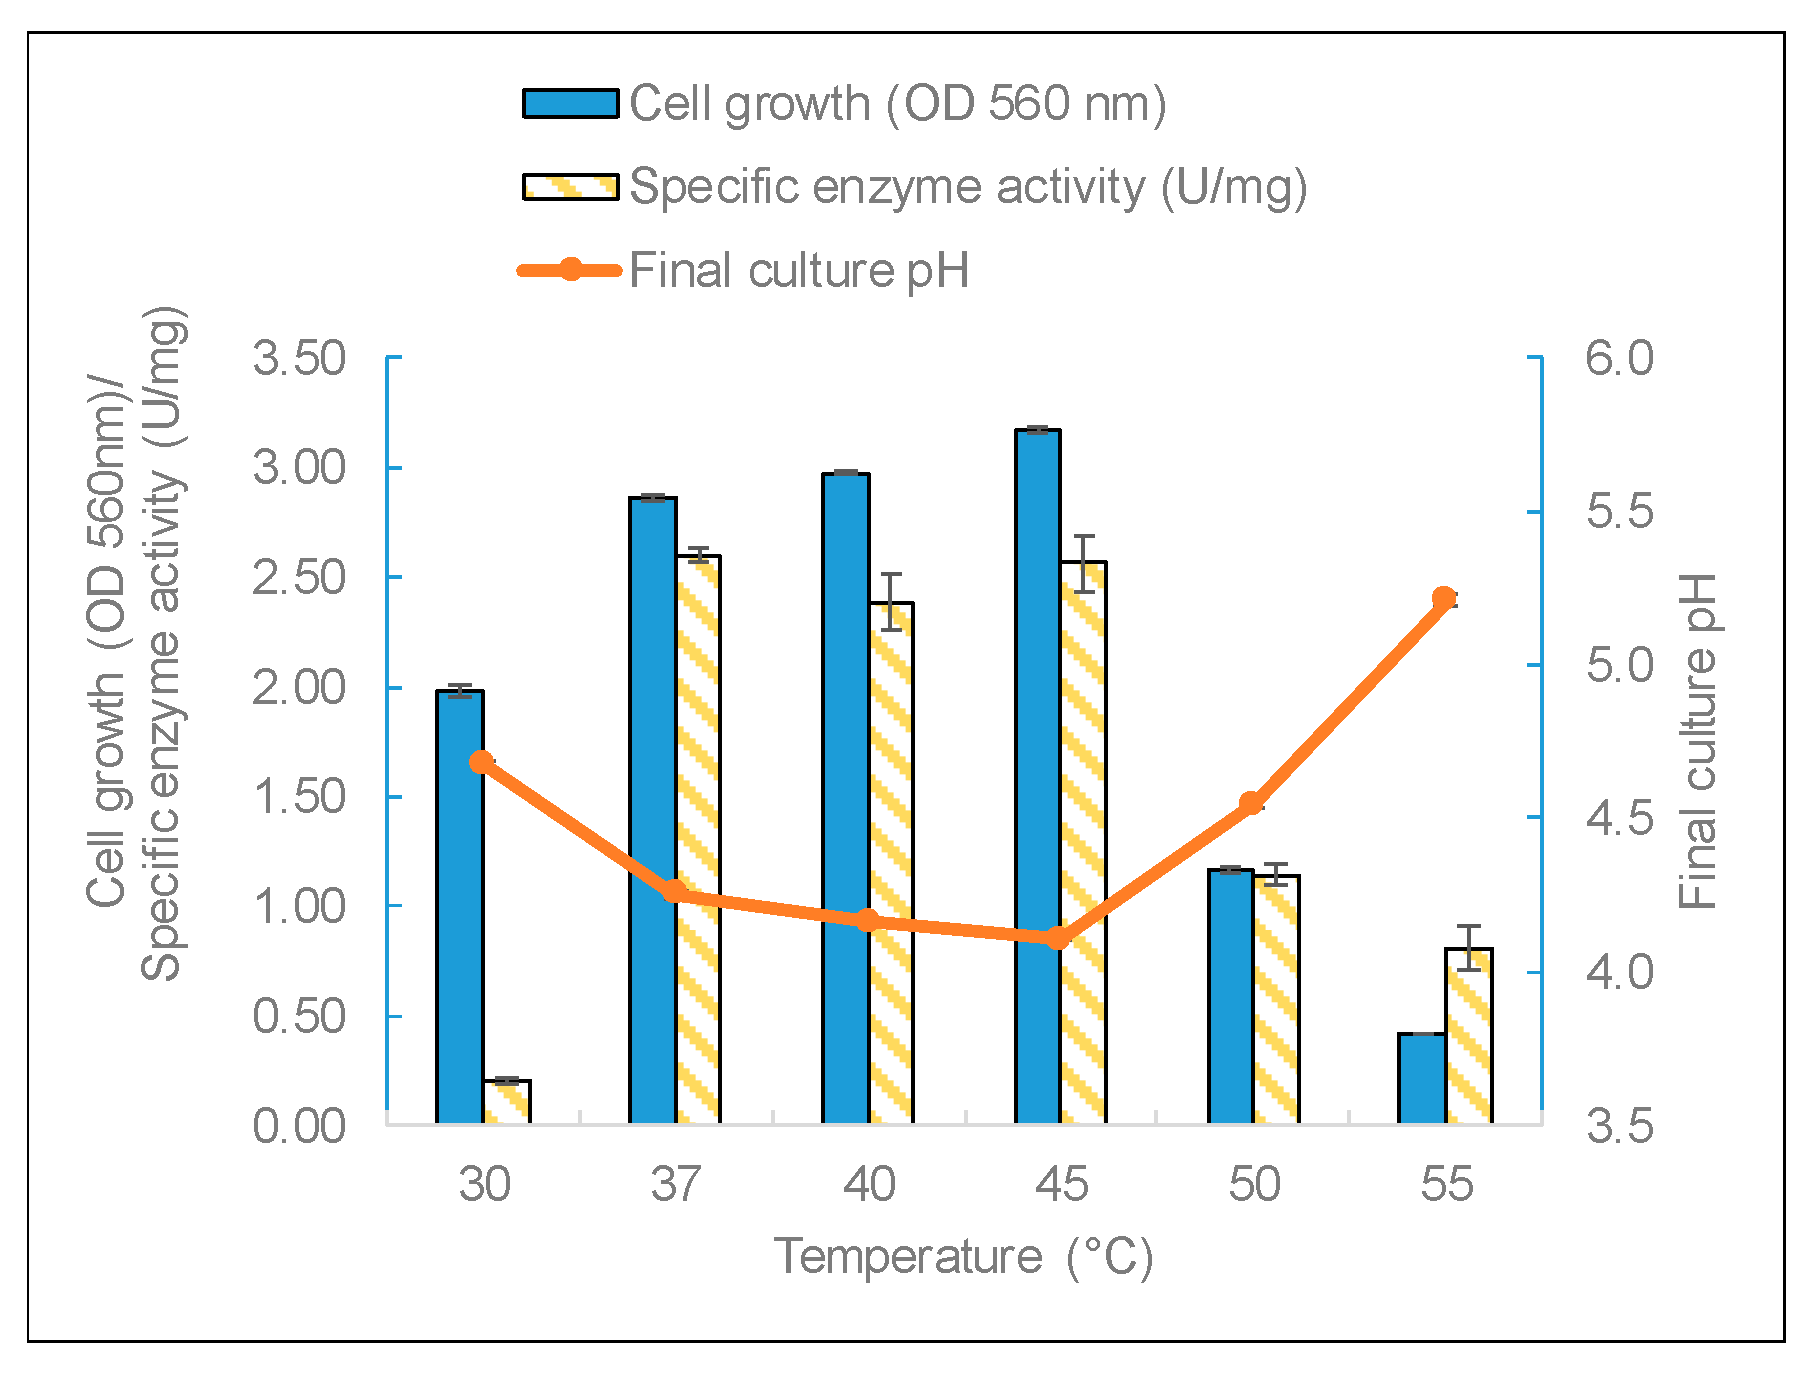
The three factors of temperature, pH, and carbon source were studied to identify the most important growth conditions that affect enzyme production. Temperature is a critical factor for bacteria growth. L. leichmannii 313 had almost the same yield of biomass and enzymes between 37 and 45 °C (Figure 4). The biomass yields (measured by OD at 560 nm) and final pH corroborated the results of the specific enzyme yields; that is to say, cell growth in the mesophilic temperature range of 37 to 45 °C recorded significantly higher levels of biomass (and a lower final pH) than at temperatures below 37 °C and above 45 °C. This indicates that temperature has a growth-dependent effect on β-galactosidase production by L. leichmannii 313. Additionally, compared with other lactic acid bacteria, such as Bifidobacterium longum [43], L. leichmannii 313 has a wider range of temperatures for β-galactosidase production. This optimum growth range is to be expected for a mesophilic lactobacillus. Moreover, considering that most dairy products are processed in this temperature range, it is an indication that L. leichmannii 313 has the potential to be used as a starter that can withstand conditions employed in the processing of dairy products. The sharp decline in enzyme activity over 45 °C could be due to cell growth impairment at high temperatures. This is demonstrated by the low OD values and the corresponding high final culture pH. Moreover, temperatures below 37 °C were not optimum for the production and specific activity of β-galactosidase by L. leichmannii 313.
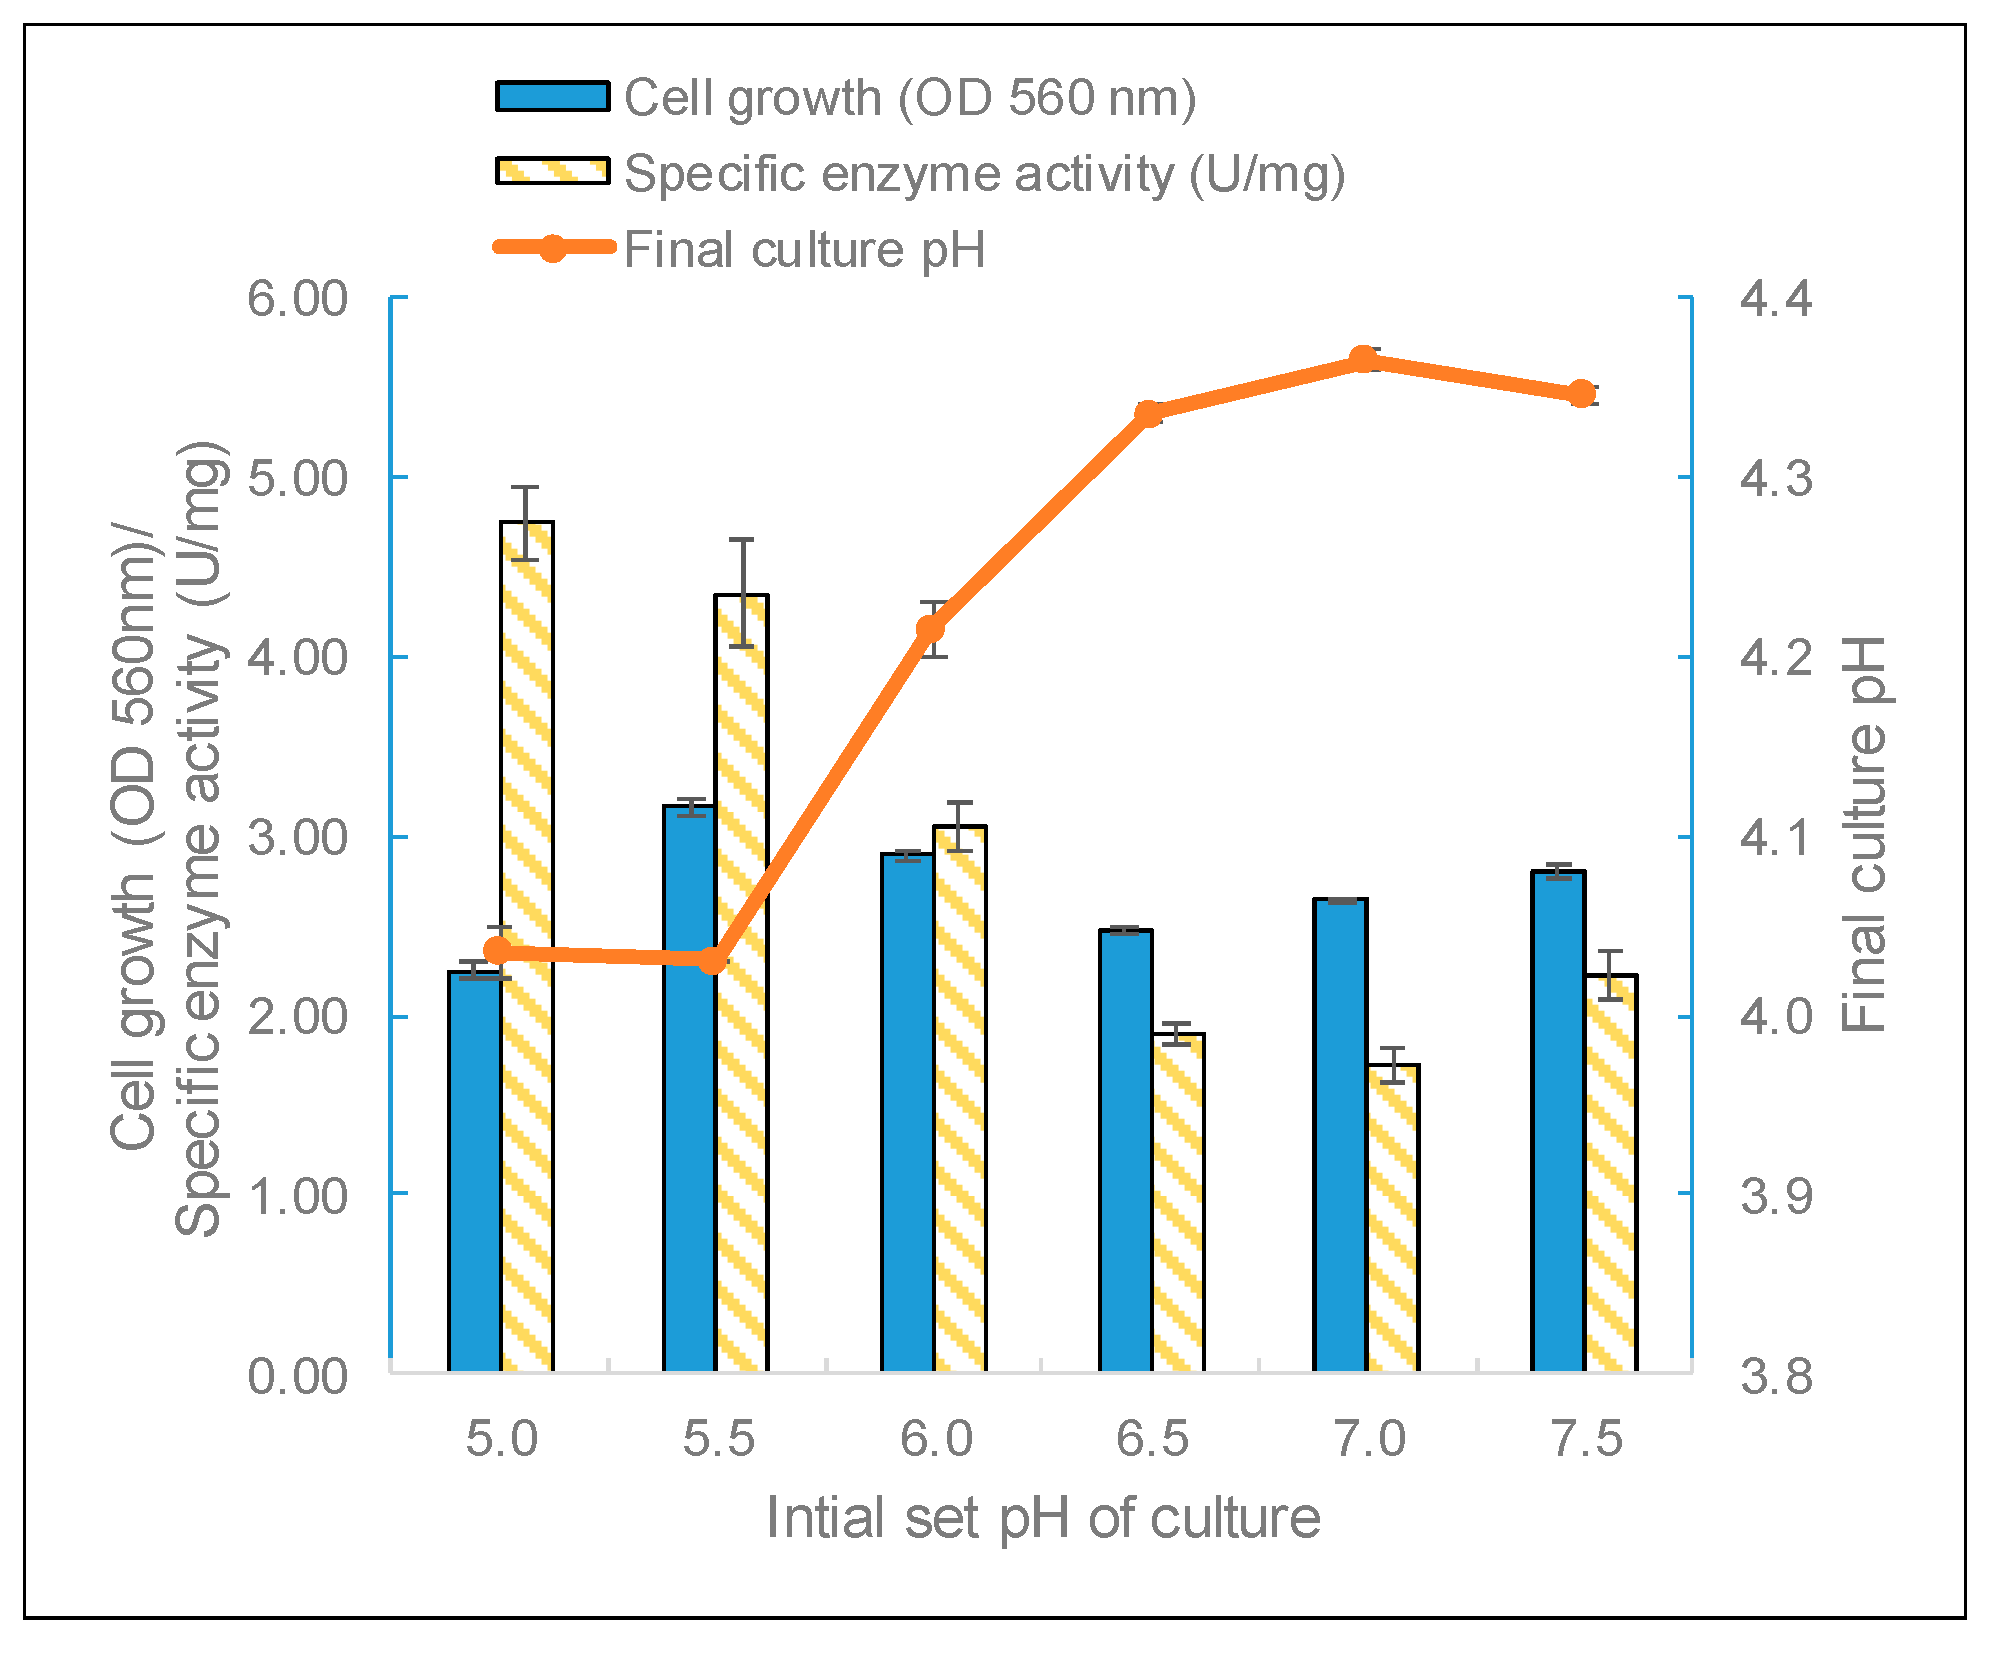
Biomass and β-galactosidase production by L. leichmannii 313 were significantly affected by the extracellular pH. This is to be expected since many enzymatic processes and the transport of components across cell membranes depend on the culture pH [44,45]. For example, the transport of sugars, such as lactose and galactose, by the action of lactose permease work via a symport mechanism where protons and sugar molecules are simultaneously translocated across the cell membrane [46]. This suggests that a lower pH (i.e., abundance of protons) will favor the effective transport and metabolism of sugars. pH has also been shown to play a crucial role in the metabolism and microbial diversity of gut bacteria, and cultures grown at a lower starting pH (i.e., pH 6 rather than 6.9) experienced large pH drops at the end of the growth phase [47]. In this study, L. leichmannii 313 had the highest biomass yield when grown at a starting pH of 5.5, but the highest enzyme activity was observed for cultures grown at a starting pH of 5.0 (Figure 5). Moreover, although L. leichmannii 313 was cultured in different initial pH values (pH 5 to 7.5), the final pH values of cultures were very similar (between 4.0 and 4.3) (Figure 4). L. leichmannii 313 is a lactic acid bacterium, and a suitable pH for its cell growth is between 5.5 and 7.0 [36]. However, in most bacteria, the optimum pH for cell growth and that for enzyme production could be different [48], as has been observed in the growth and cell envelope proteinase production profile of L. leichmannii 313 [37]. Furthermore, another study involving the expression of recombinant β-galactosidase in L. reuteri showed that pH was one of the most important factors for the production of β-galactosidase in this lactobacillus [49].
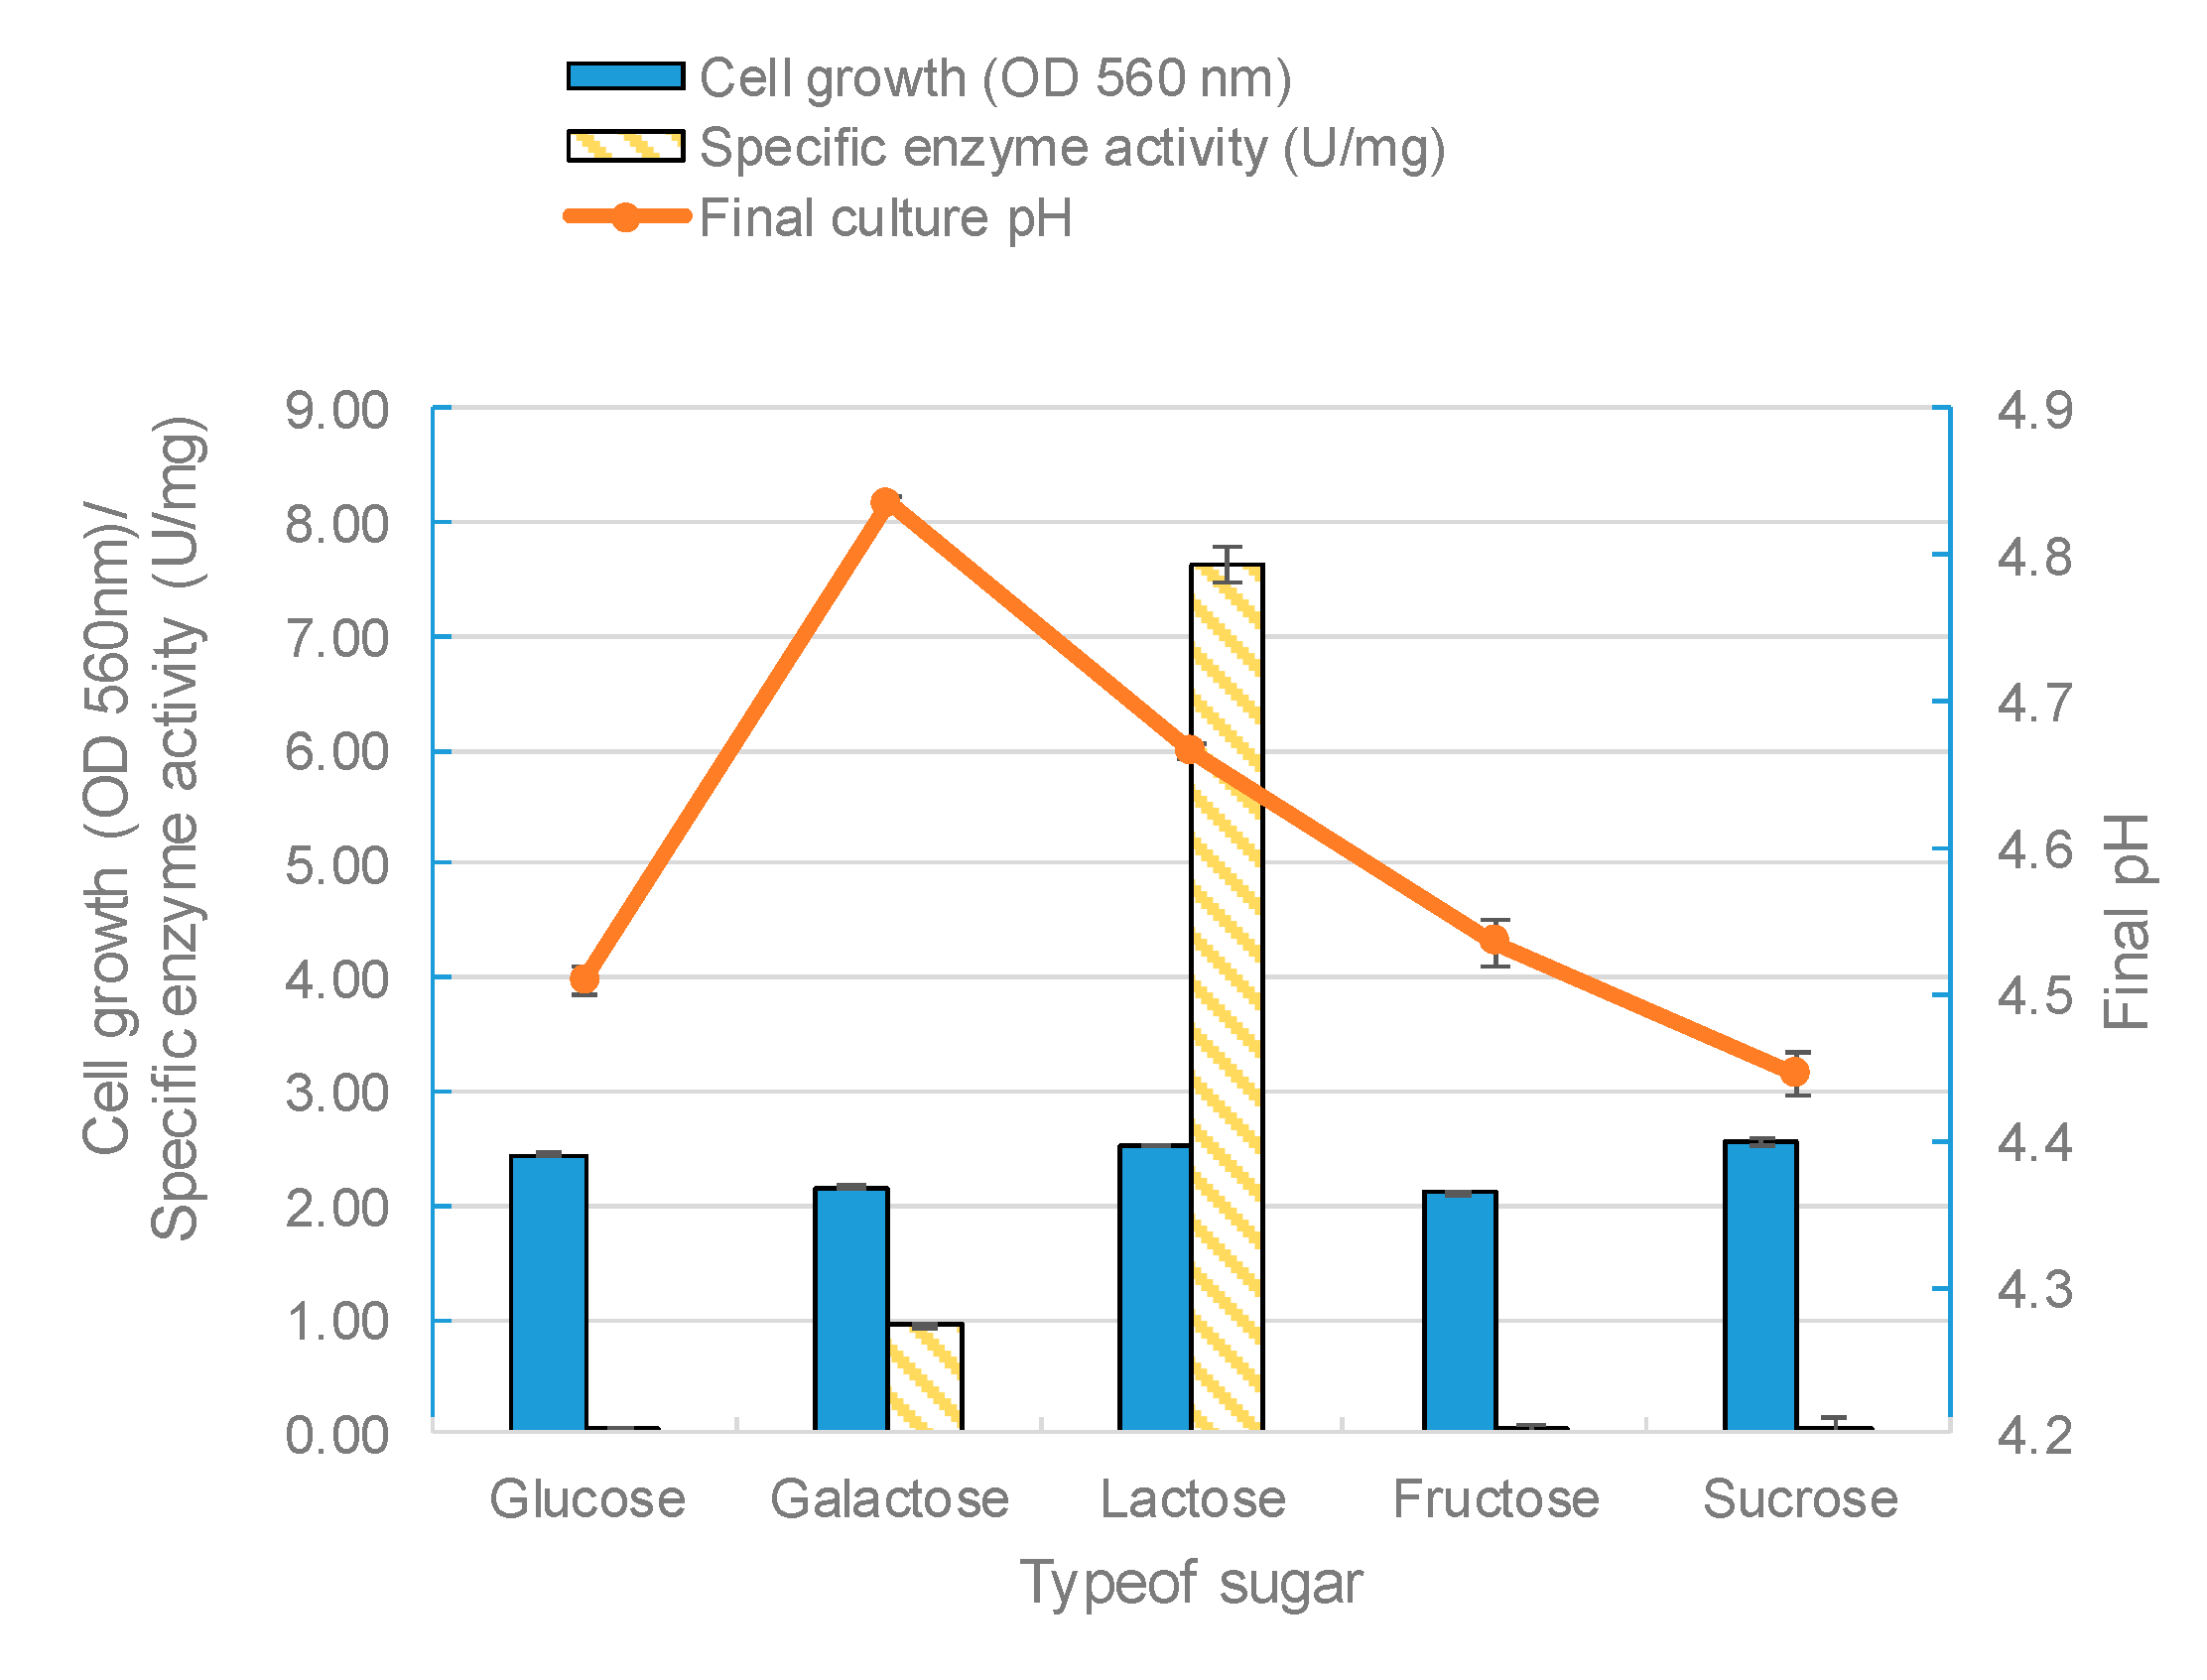
The effect of the carbon source on enzyme biosynthesis depends on the microbial species being studied [50]. In fact, the carbon substrate type and concentration are two of the most important factors for the production of β-galactosidase in lactobacilli [49]. In this study, five kinds of sugars (glucose, galactose, lactose, fructose, and sucrose) were used as carbon sources in the growth medium to find the optimum sugar for β-galactosidase synthesis. The modified MRS broth was prepared using each carbon substrate at a 2% (w/v) concentration. All sugars used could support the growth of L. leichmannii 313. However, lactose as the sole carbon significantly promoted the activity of β-galactosidase. This was followed by galactose, with glucose giving the lowest enzyme activity (Figure 6). These results are compatible with previous studies [43,50], and also those of Kluyveromyces fragilis and Rhizomucor sp [15,51]. Furthermore, our results showed that fructose and sucrose, when used as sole carbon sources, generated biomasses with low specific enzyme activities. Lactose was the optimum carbon source that stimulated the profuse synthesis of β-galactosidase. This is because lactose (particularly in the form of the allolactose isomer) promotes the expression of the lacZ gene by binding to the Lac repressor protein, preventing this protein from engaging the operator region of the lac operon [52,53]. In most L. delbrueckii species, the expression of β-galactosidase has been shown to be constitutive [54]. However, in L. delbrueckii subsp. lactis strains (which includes L. leichmannii 313), β-galactosidase production is inducible, through the presence of lactose (and to a lesser extent galactose) in the growth media [55]. Glucose, on the other hand, inhibits the expression of β-galactosidase via catabolite repression mechanisms. During catabolite repression, the presence of glucose leads to the production of lower levels of cyclic adenosine monophosphates (cAMPs) and activation of catabolite activator proteins that bind to and turn off the lac operon [56,57].
3.1.2. Results of Factor Screening Experiments
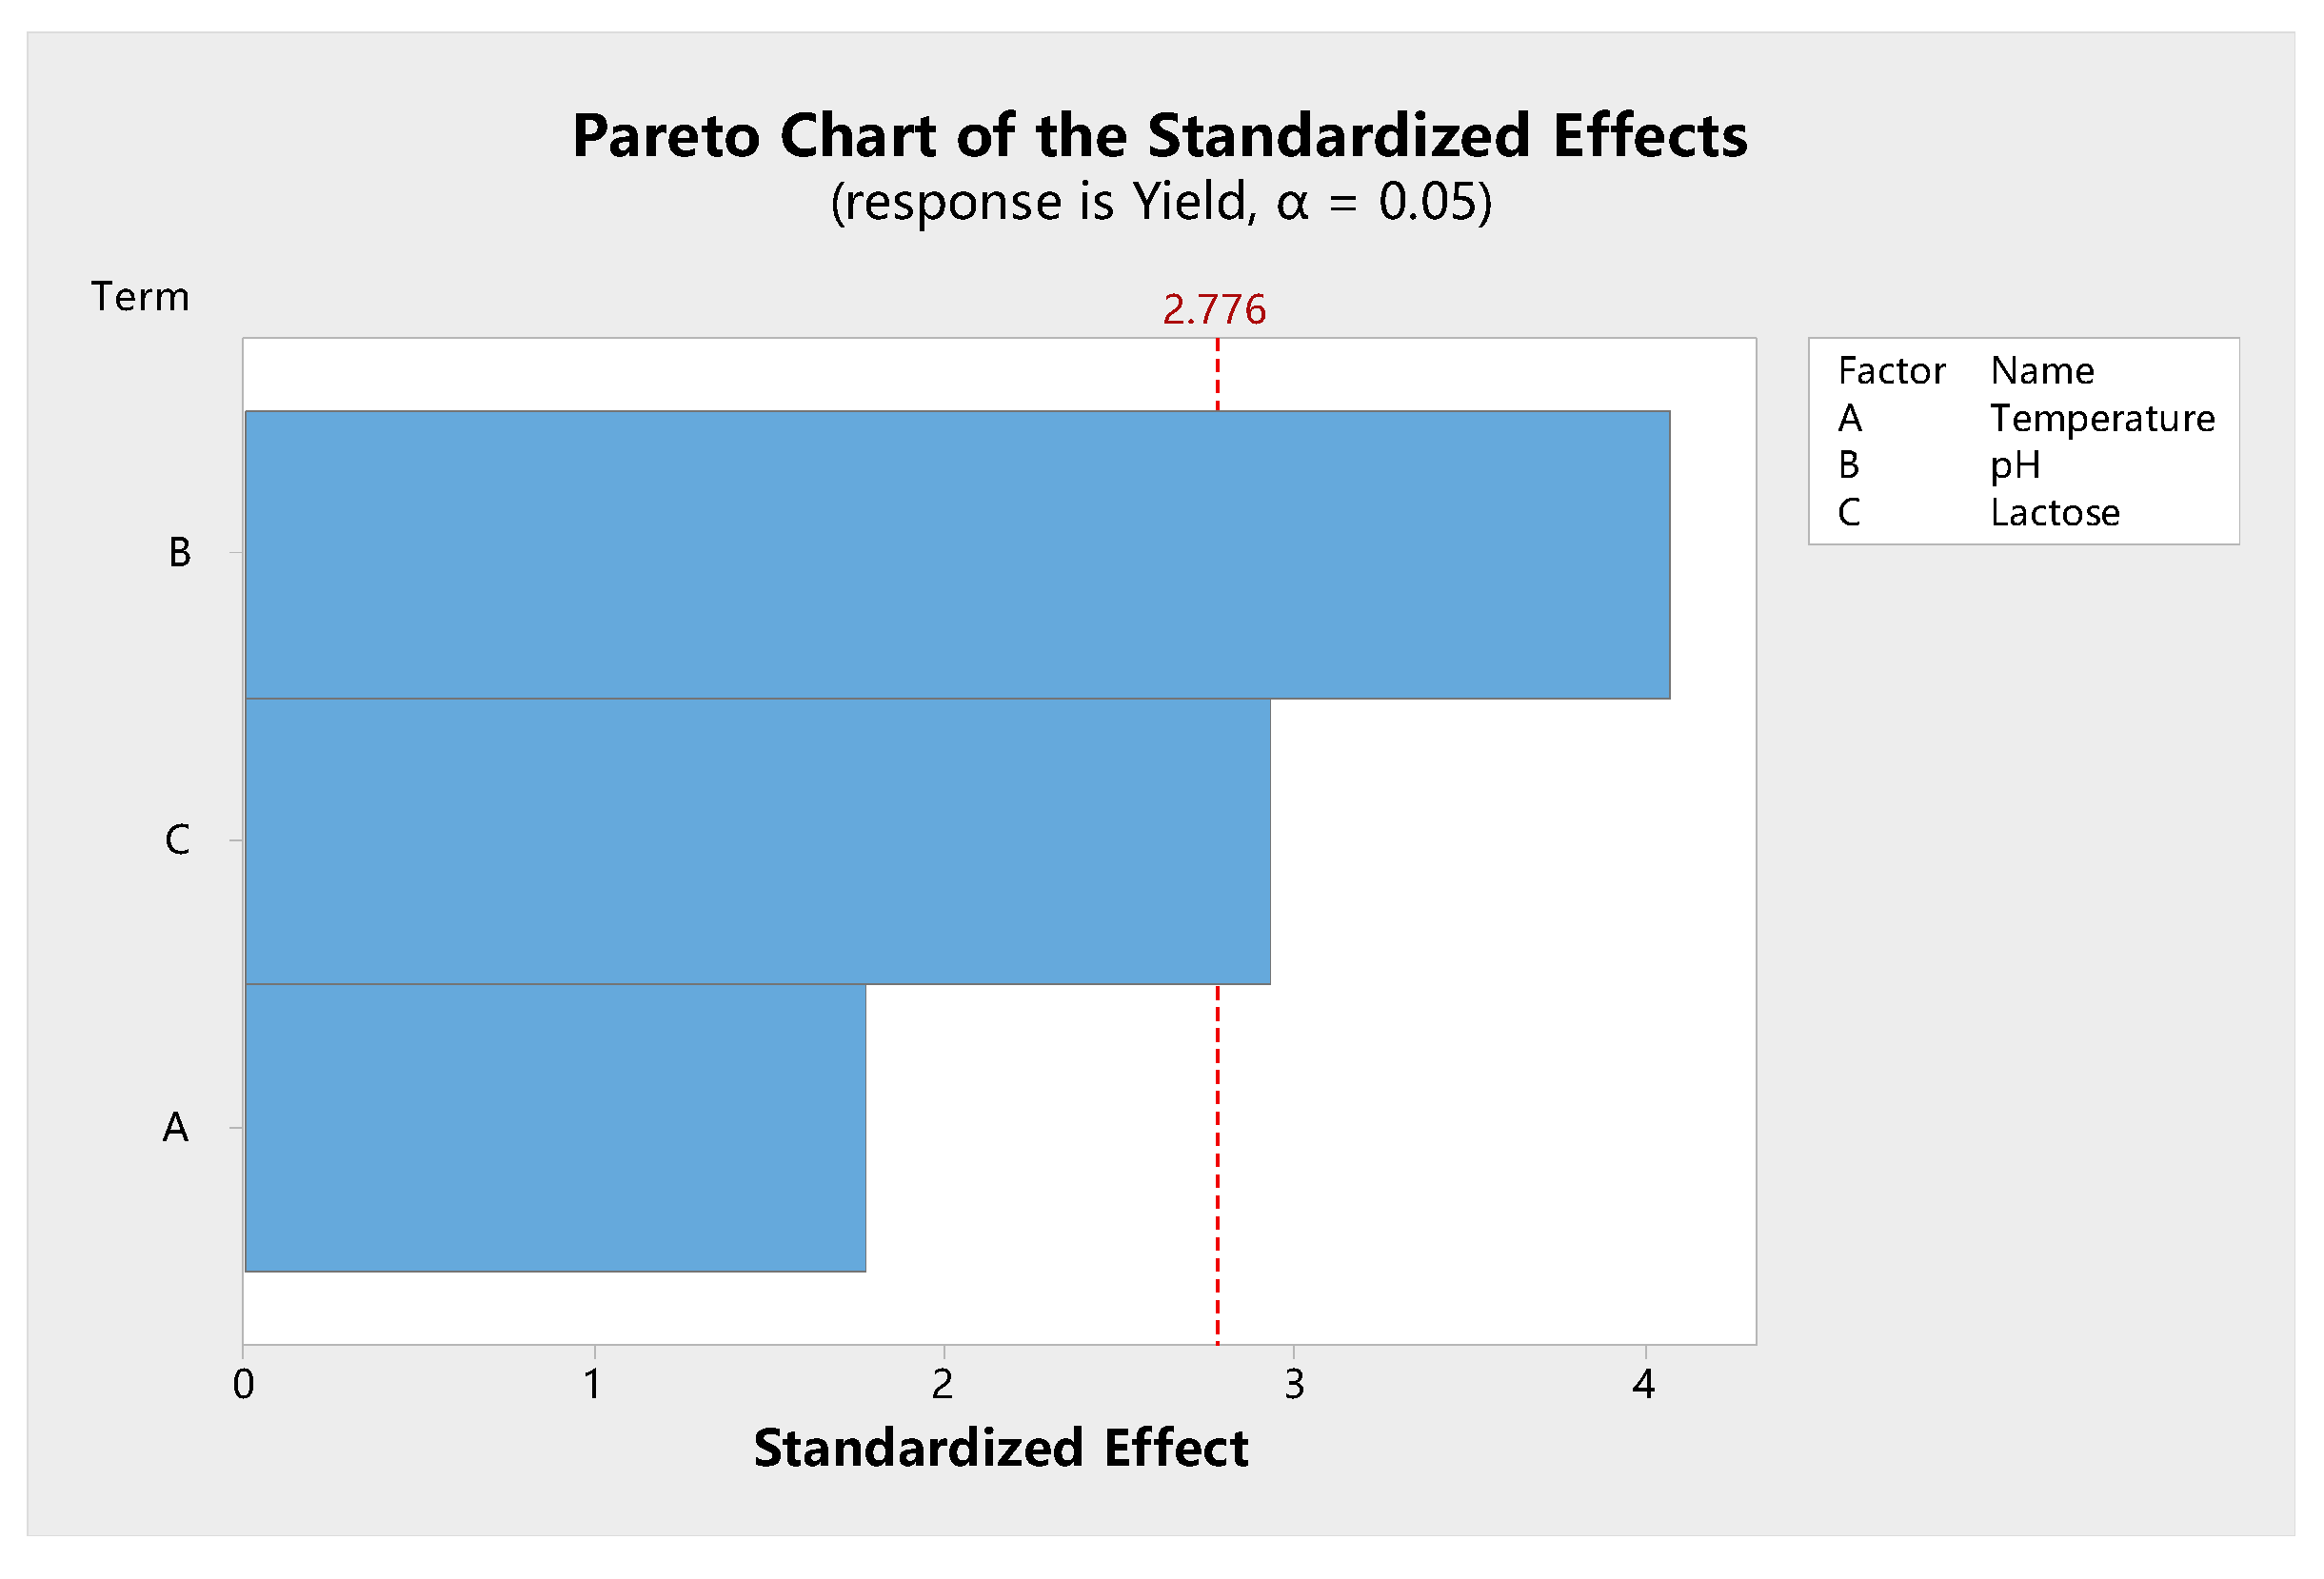
Shown in Figure 7 is the Pareto chart of the effect and level of significance of various factors that influence β-galactosidase synthesis. The Pareto chart showed that the temperature, initial pH, and lactose concentration had a positive effect on specific enzyme activity. However, temperature did not cause a significant effect. The trends for pH and carbon source were different from those of the independent factor analysis. For example, the trend for lactose concentration agreed with those of other studies that have shown that an increased production/activity of β-galactosidase is observed as the concentration of lactose in the medium is increased up to 2.5% [50] or 4.0% [43]. In this study, temperature had no significant effect on enzyme activity (p = 0.056). Our independent factor analysis also showed that there was no significant difference for enzyme activity between 37 and 45 °C. This indicates that L. leichmannii 313 has a wide range of temperatures for β-galactosidase production, compared with other lactobacilli [43]. In subsequent experiments, 37 °C was used for bacteria growth, as it is a common temperature for the growth of most microorganisms.
3.1.3. Central Composite Design (CCD) and Response Surface Methodology (RSM) Analysis
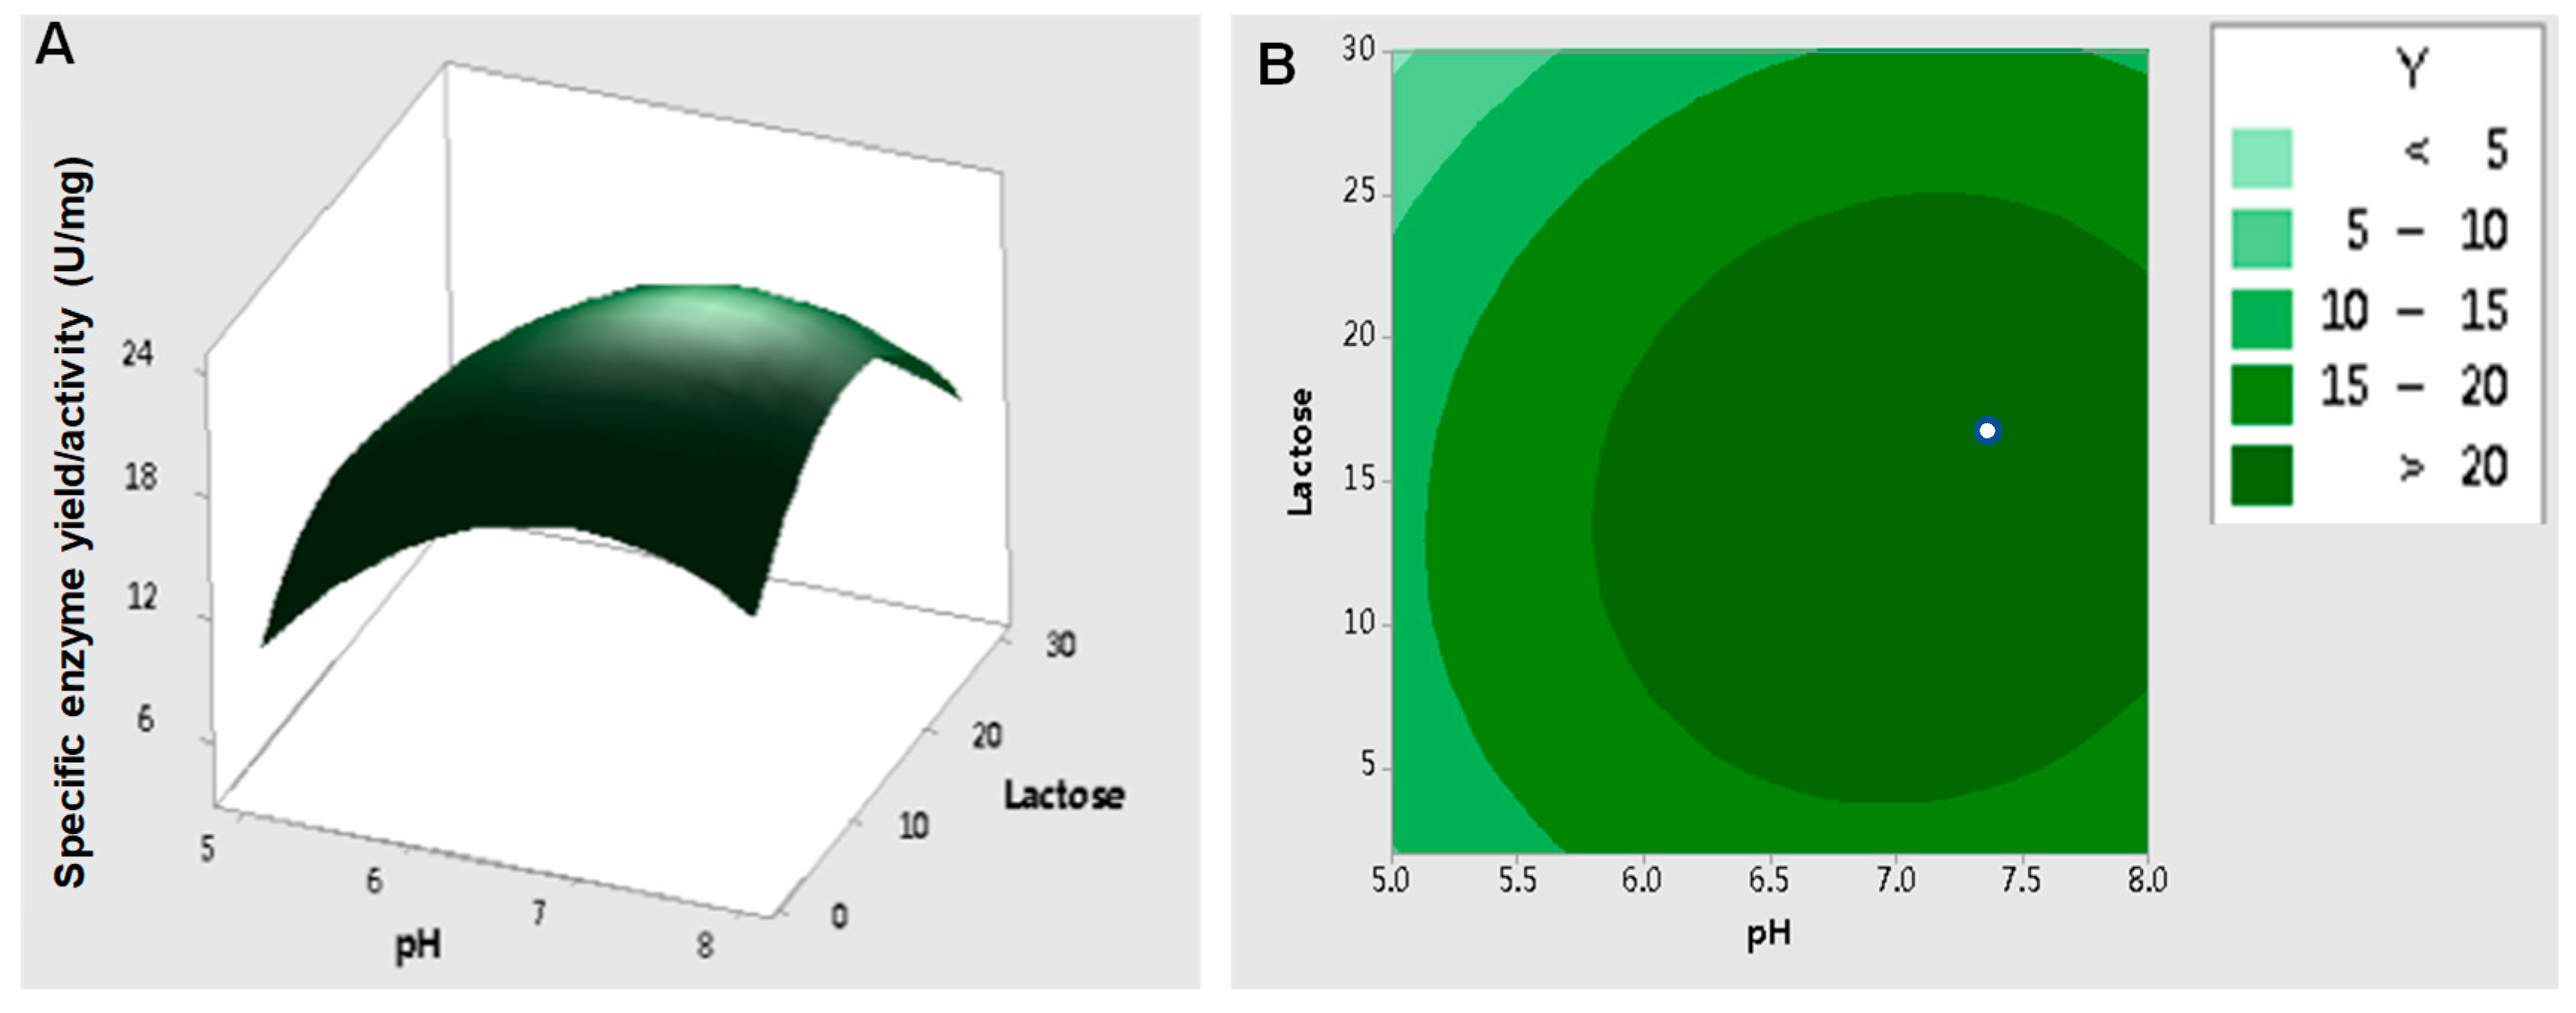
Central composite design (CCD) is one of the most frequently used approaches for RSM design employed to determine the key factors and interactive components in a system [14]. In this case, it was critical to set the center point of the variables to make sure that no convergence appeared, since the converged values may have been out of range [58]. Factor values of pH 6.5 and 15 g/L lactose were set as the center points based on the results of Plackett–Burman analysis. These values were assumed to be close to the optimum point for enzyme activity for RSM analysis. A three-dimensional response surface plot and contour plot were used to display the effects of pH and lactose concentration on the specific β-galactosidase activity (Figure 8). The predicted optimum pH and lactose concentration were 7.06 and 15.3 g/L, respectively, and the corresponding maximum specific enzyme activity of β-galactosidase was 23.4 ± 1.49 U/mg.
Table 8 shows the specific enzyme activity and model predictions for the central composite design for each experimental run. Moreover, a regression analysis of data produced the following quadratic polynomial equation (Equation (4)):
where Y is the specific enzyme activity (predicted) of β-galactosidase in U/mg, and pH and lactose are the values of the pH and concentration of lactose, respectively. As shown in Table 9, the coefficient of determination (R2) was 0.98 when the goodness of fit of the model was tested. ANOVA for the CCD showed a very high fitting of experimental data to the model (R2 = 0.99).
3.1.4. Experimental Validation of Optimized Conditions and Factors
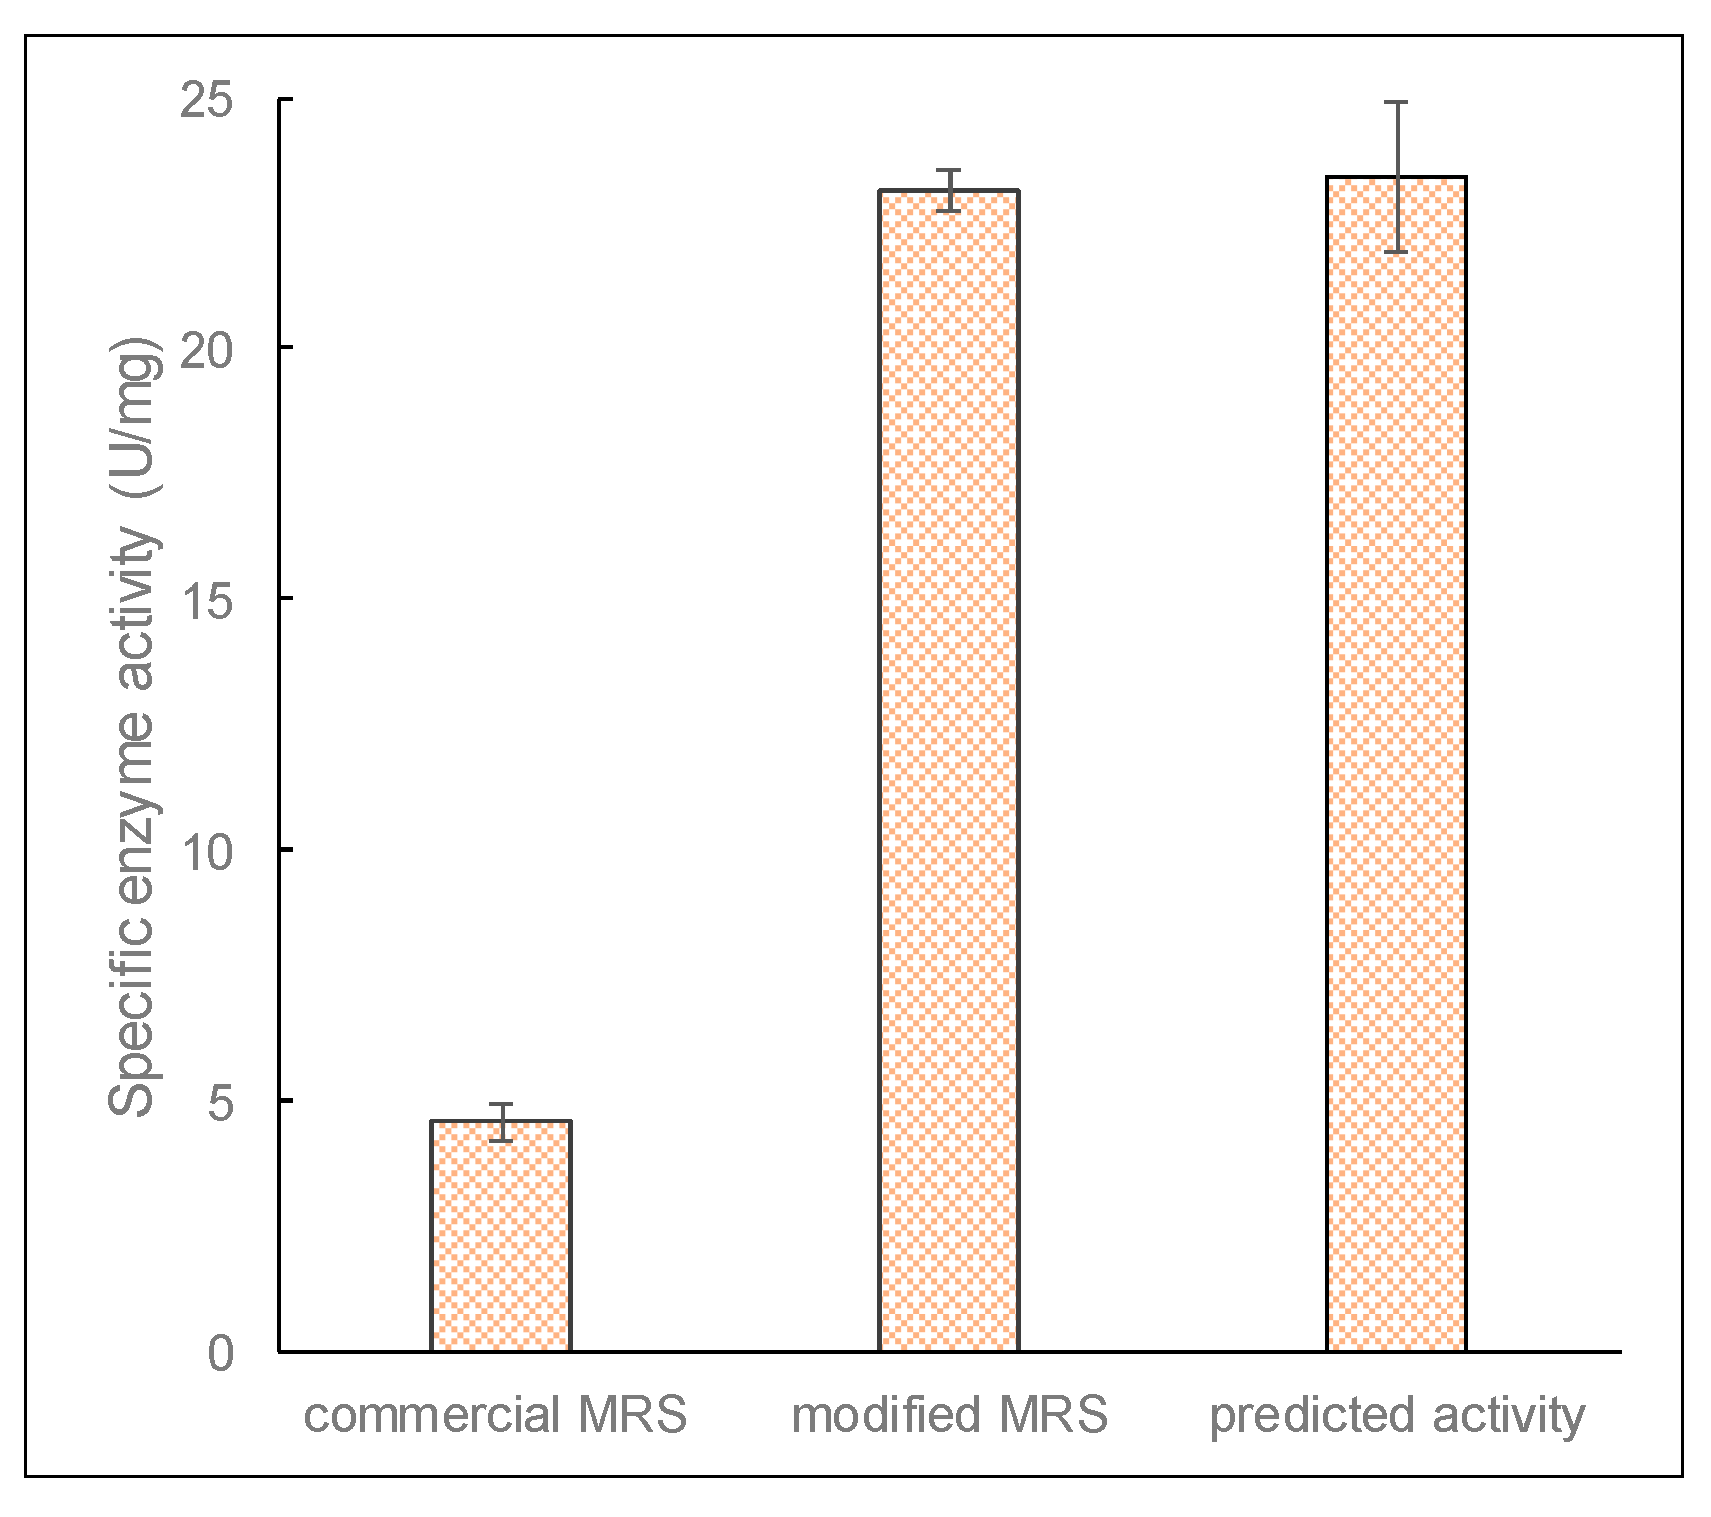
The accuracy of the optimized model for enzyme production was verified by performing microbial growth using conditions identified from the optimized factors and in a modified growth medium. Figure 9 shows that the specific enzyme activity of β-galactosidase after optimization was 23.13 ± 0.42 U/mg, which is comparable to the predicted activity of 23.4 ± 1.49 U/mg proteins. This shows a significant improvement (over five times) in enzyme production after optimization. It also indicates that the RSM model was reliable and accurate for the optimization of β-galactosidase production by L. leichmannii 313.
3.2. β-galactosidase Enzyme Activity with Lactose as a Substrate
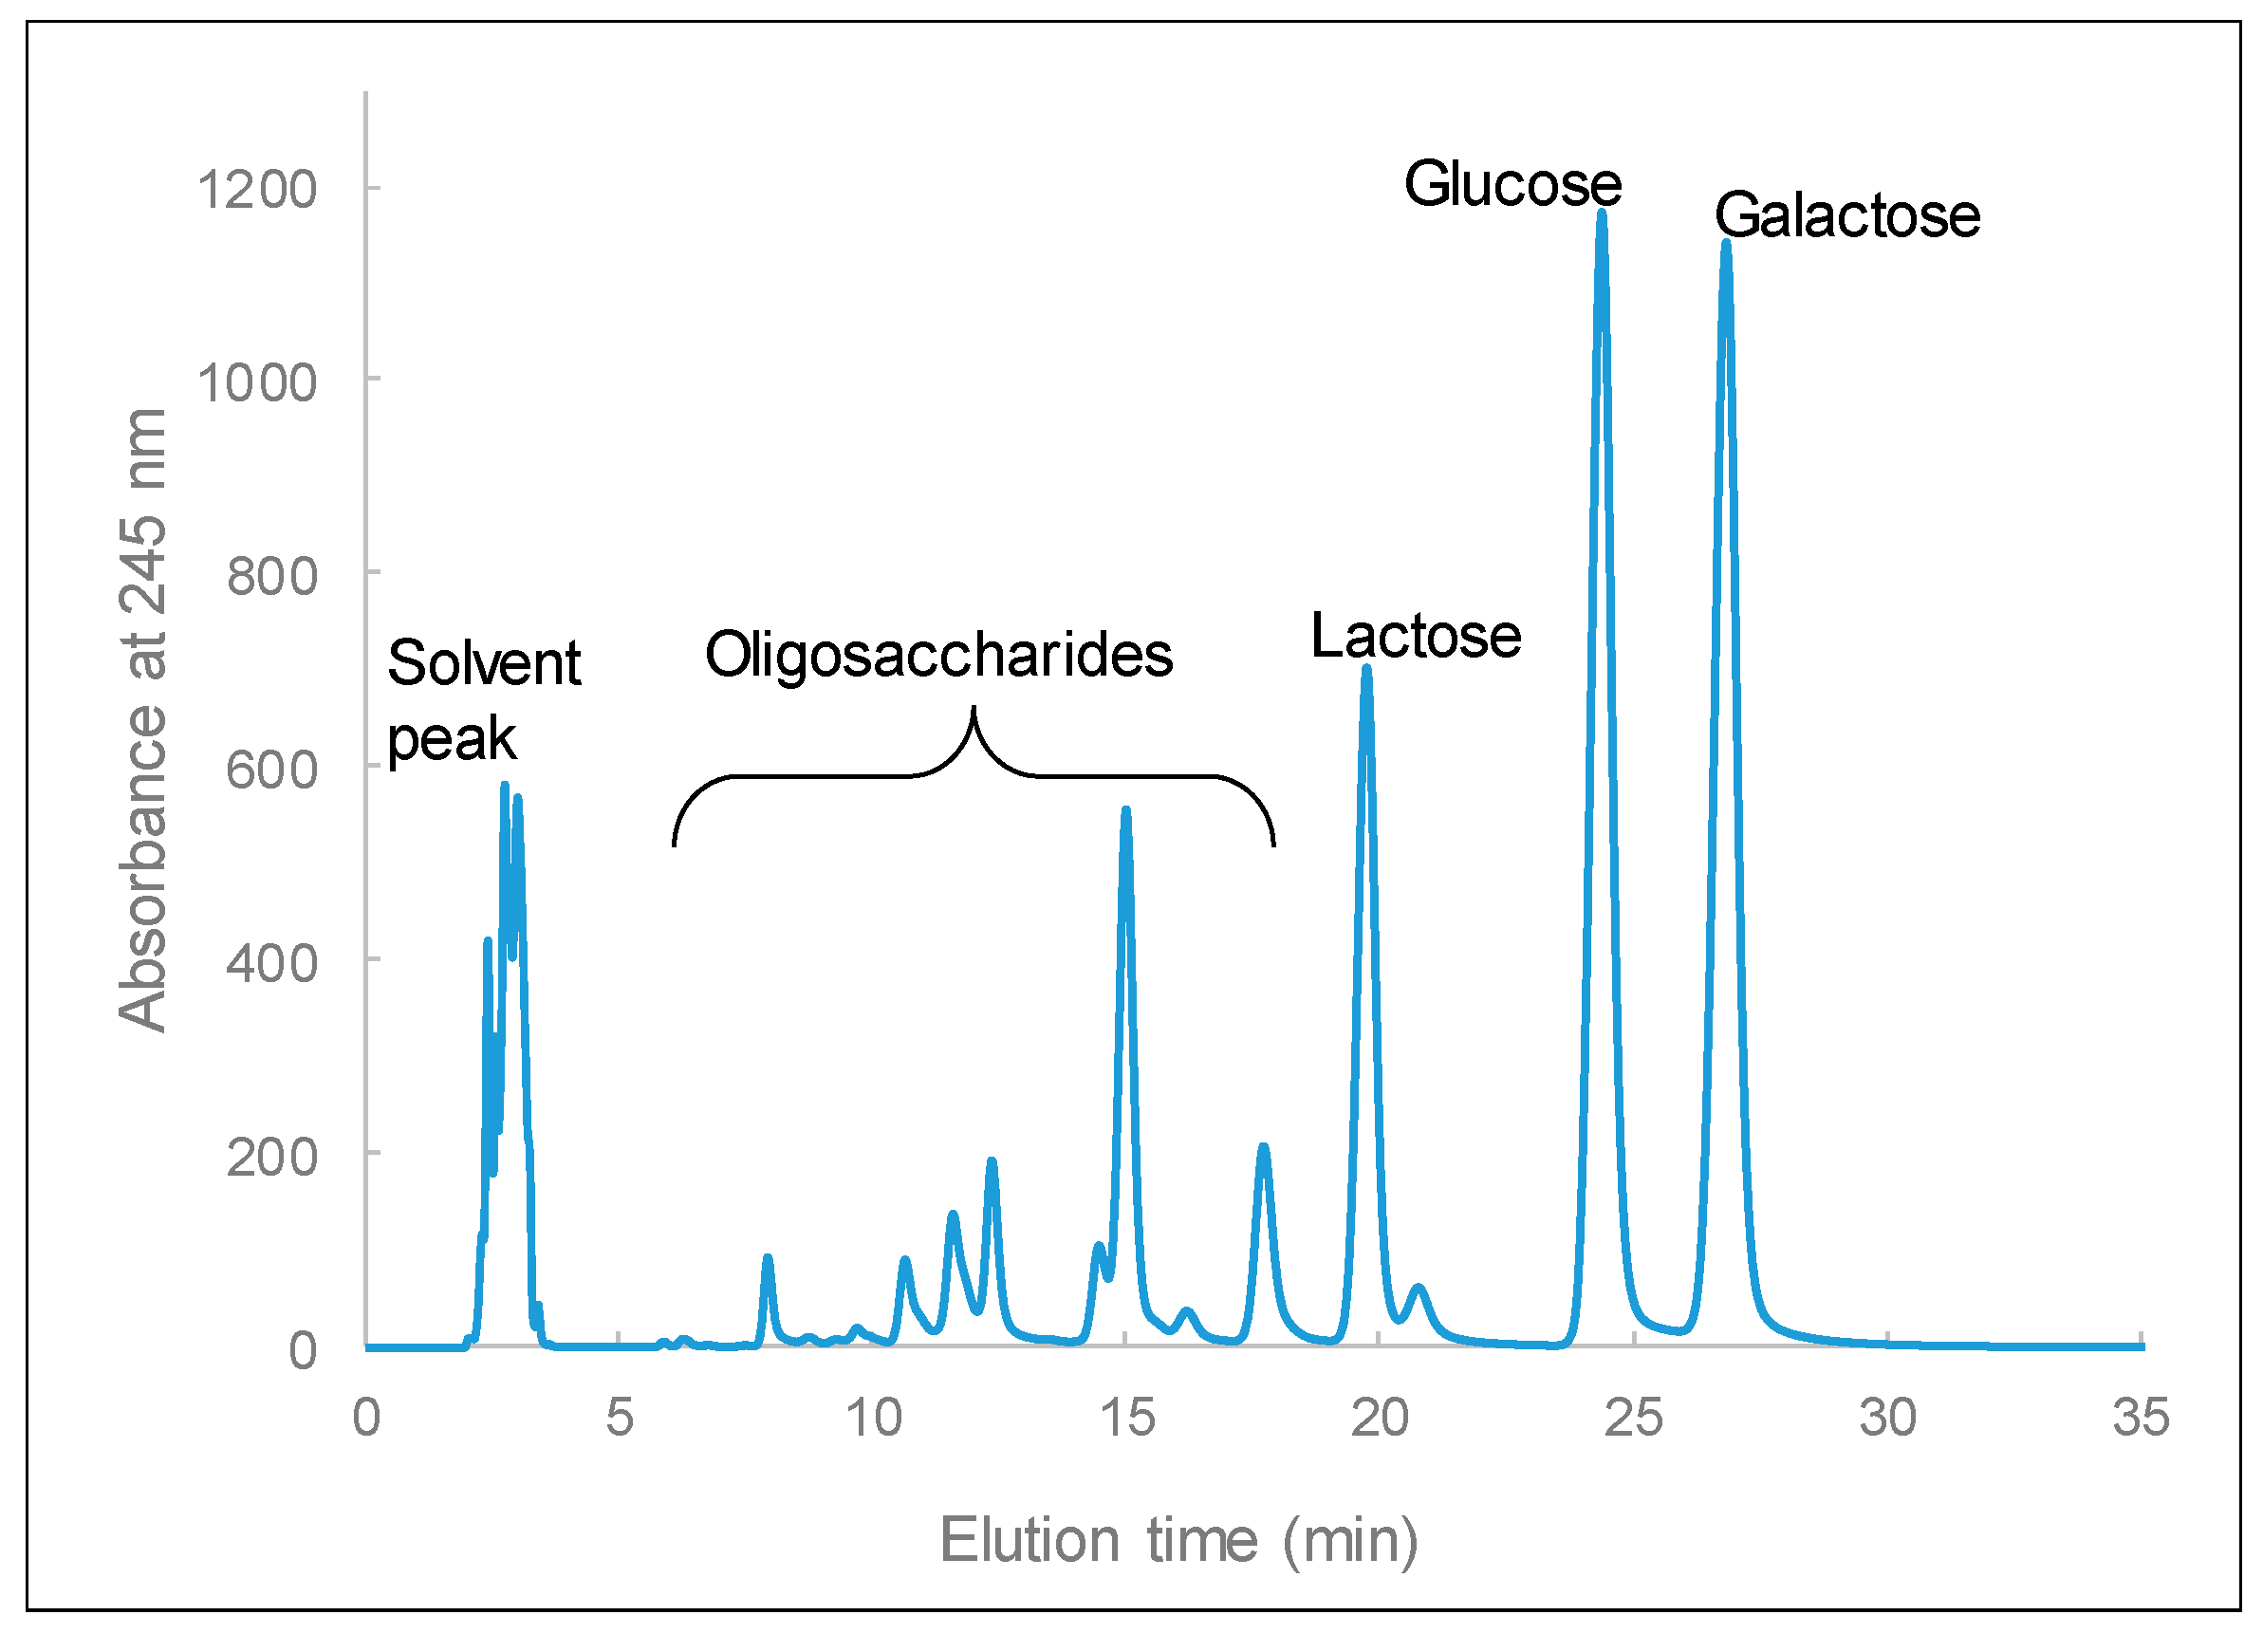
In the food industry, β-galactosidases are utilized for the preparation of lactose-free milk, to control lactose crystallization, and in the production of galacto-oligosaccharides. In our previous study, we demonstrated that purified β-galactosidase from L. leichmannii 313 can simultaneously hydrolyze lactose and generate oligosaccharides from lactose [29]. Therefore, to demonstrate the catalytic efficiency of crude β-galactosidase in lactose, -sugar samples derivatized with 1-phenyl-3-methyl-5-pyrazolone were measured by HPLC. The peaks appearing at elution times of 19.8, 24.4, and 26.8 min are lactose, glucose, and galactose, respectively, and the peaks that appear between 7 and 18 min are galacto-oligosaccharides (GOS) (Figure 10). This shows that the crude β-galactosidase from L. leichmannii 313 has both hydrolytic and transgalactosylation properties, as it was able to hydrolyze lactose and produce GOS products. Crude β-galactosidase from L. leichmannii 313 therefore has the potential to be utilized in the production of GOS prebiotics for the food industry. This property will be further investigated in follow-up studies on this enzyme.
4. Conclusions
The production of β-galactosidase by L. leichmannii 313 was first studied and optimized in MRS media by using the response surface methodology (RSM). The maximum production (measured by specific activity) of crude β-galactosidase was obtained after 12 h of incubation (4.5 U/mg). The carbon source (glucose, lactose, galactose, fructose, and sucrose), incubation temperature, and starting pH can affect the yield of β-galactosidase enzymes. Using lactose as the carbon source, an incubation temperature between 37 and 45 °C, and the starting pH (5.5) was optimal for crude β-galactosidase production. The RSM results showed that an initial pH of 7.0 and 15.29 g/L of lactose gave the highest relative activity of β-galactosidase (23.13 U/mg and 23.40 U/mg, respectively). Moreover, crude β-galactosidase from L. leichmannii 313 was able to hydrolyze lactose and produce GOS. This study shows that L. leichmannii 313 can be used as a potential source of β-galactosidase enzyme that possesses transgalactosylation properties and can therefore be used for GOS production in the food industry.
Author Contributions
Y.D. performed the experiments and wrote an initial draft. D.J. and M.X. assisted with the writing of the manuscript, as well as the analysis and presentation of data. D.A. conceived the project, and contributed to writing and reviewing the manuscript. All authors read and approved the final manuscript.
Funding
This research was funded with a University of Otago Research Grant (ORG 0118-1219).
Acknowledgments
D.A. acknowledges a University of Otago Research Grant that funded this study.
Conflicts of Interest
The authors declare no conflict of interest.
References
- Schaafsma, G. Lactose and lactose derivatives as bioactive ingredients in human nutrition. Int. Dairy J. 2008, 18, 458–465. [Google Scholar] [CrossRef]
- Paige, D.M. Lactose intolerance. In Encyclopedia of Human Nutrition; Elsevier: Amsterdam, The Netherlands, 2013; pp. 67–73. [Google Scholar]
- Lifran, E.V.; Hourigan, J.A.; Sleigh, R.W. Lactose derivatives: Turning waste into functional foods. Aust. J. Dairy Technol. 2009, 64, 89–93. [Google Scholar]
- Roberfroid, M. Prebiotics: The concept revisited.(author abstract). J. Nutr. 2007, 137, 830S. [Google Scholar] [CrossRef] [PubMed] [Green Version]
- Knol, J.; Scholtens, P.; Kafka, C.; Steenbakkers, J.; Gro, S.; Helm, K.; Klarczyk, M.; Schopfer, H.; Bockler, H.M.; Wells, J. Colon microflora in infants fed formula with galacto- and fructo-oligosaccharides: More like breast-fed infants. J. Pediatr. Gastroenterol. Nutr. 2005, 40, 36–42. [Google Scholar] [CrossRef] [PubMed]
- Mayer, E.A.; Tillisch, K.; Gupta, A. Gut/brain axis and the microbiota. J. Clin. Invest. 2015, 125, 926–938. [Google Scholar] [CrossRef] [PubMed]
- Macfarlane, G.T.; Steed, H.; Macfarlane, S. Bacterial metabolism and health-related effects of galacto-oligosaccharides and other prebiotics. J. Appl. Microbiol. 2008, 104, 305–344. [Google Scholar] [CrossRef] [PubMed]
- Saqib, S.; Akram, A.; Halim, S.A.; Tassaduq, R. Sources of beta-galactosidase and its applications in food industry. 3 Biotech 2017, 7, 79. [Google Scholar] [CrossRef] [Green Version]
- Vijayaraghavan, P.; Arasu, M.V.; Anantha Rajan, R.; Al-Dhabi, N.A. Enhanced production of fibrinolytic enzyme by a new xanthomonas oryzae ind3 using low-cost culture medium by response surface methodology. Saudi J. Biol. Sci. 2019, 26, 217–224. [Google Scholar] [CrossRef]
- Raol, G.G.; Prajapati, V.S.; Raol, B.V. Formulation of low-cost, lactose-free production medium by response surface methodology for the production of β-galactosidase using halotolerant aspergillus tubengensis gr-1. Biocatal. Agric. Biotechnol. 2014, 3, 181–187. [Google Scholar] [CrossRef]
- Tari, C.; Ustok, F.I.; Harsa, S. Optimization of the associative growth of novel yoghurt cultures in the production of biomass, β-galactosidase and lactic acid using response surface methodology. Int. Dairy J. 2009, 19, 236–243. [Google Scholar] [CrossRef] [Green Version]
- Kumari, V.; Kumar, V.; Chauhan, R.; Asif, M.; Bhalla, T.C. Optimization of medium parameters by response surface methodology (rsm) for enhanced production of cutinase from aspergillus sp. Rl2ct. 3 Biotech 2016, 6, 149. [Google Scholar] [CrossRef] [Green Version]
- Del Castillo, E. Process Optimization: A Statistical Approach; Springer: New York, NY, USA, 2007. [Google Scholar]
- Iyer, R.; Tomar, S.K.; Singh, A.K. Response surface optimization of the cultivation conditions and medium components for the production of folate by streptococcus thermophilus. J. Dairy Res. 2010, 77, 350–356. [Google Scholar] [CrossRef] [PubMed]
- Fiedurek, J.; Szczodrak, J. Selection of strain, culture conditions and extraction procedures for optimum production of beta-galactosidase from kluyveromyces fragilis. Acta Microbiol. Pol. 1994, 43, 57–65. [Google Scholar] [PubMed]
- Inchaurrondo, V.A.; Flores, M.V.; Voget, C.E. Growth and β-galactosidase synthesis in aerobic chemostat cultures of kluyveromyces lactis. J. Ind. Microbiol. Biotechnol. 1998, 20, 291–298. [Google Scholar] [CrossRef]
- Topete, M.; Casas, L.T.; Galindo, E. Beta-galactosidase production by kluyveromyces marxianus cultured in shake flasks. Rev. Latinoam. Microbiol. 1997, 39, 101–107. [Google Scholar] [PubMed]
- Venkateswarulu, T.C.; Prabhakar, K.V.; Kumar, R.B. Optimization of nutritional components of medium by response surface methodology for enhanced production of lactase. 3 Biotech 2017, 7, 202. [Google Scholar] [CrossRef]
- Han, Y.R.; Youn, S.Y.; Ji, G.E.; Park, M.S. Production of alpha- and beta-galactosidases from bifidobacterium longum subsp. Longum rd47. J. Microbiol. Biotechnol. 2014, 24, 675–682. [Google Scholar] [CrossRef]
- Gobinath, D.; Prapulla, S.G. Transgalactosylating β-galactosidase from probiotic lactobacillus plantarum mcc2156: Production and permeabilization for use as whole cell biocatalyst. J. Food Sci. Technol. 2015, 52, 6003–6009. [Google Scholar] [CrossRef] [Green Version]
- Kim, J.W.; Rajagopal, S.N. Isolation and characterization of β-galactosidase from lactobacillus crispatus. Folia Microbiol. 2000, 45, 29–34. [Google Scholar] [CrossRef]
- Sasaki, K.; Samant, S.K.; Suzuki, M.; Toba, T.; Itoh, T. Β-galactosidase and 6-phospho-β-galactosidase activities in strains of the lactobacillus acidophilus complex. Letters in Applied Microbiology 1993, 16, 97–100. [Google Scholar] [CrossRef]
- Vogel, R.F.; Ehrmann, M.A. Sourdough fermentations. In Molecular techniques in the microbial ecology of fermented foods; Cocolin, L., Ercolini, D., Eds.; Springer: New York, NY, USA, 2008; pp. 119–144. [Google Scholar]
- Espeche Turbay, M.a.B.; Savoy de Giori, G.; Hebert, E.M. Release of the cell-envelope-associated proteinase of lactobacillus delbrueckii subspecies lactis crl 581 is dependent upon ph and temperature. J. Agric. Food Chem. 2009, 57, 8607–8611. [Google Scholar] [CrossRef] [PubMed]
- Batdorj, B.; Trinetta, V.; Dalgalarrondo, M.; Prévost, H.; Dousset, X.; Ivanova, I.; Haertlé, T.; Chobert, J.M. Isolation, taxonomic identification and hydrogen peroxide production by lactobacillus delbrueckii subsp. Lactis t31, isolated from mongolian yoghurt: Inhibitory activity on food-borne pathogens. J. Appl. Microbiol. 2007, 103, 584–593. [Google Scholar] [CrossRef] [PubMed]
- de Macías, M.E.N.; Perdigon, G.; Oliver, G.; de Ruiz Holgado, A.P. Enzyme-linked immunosorbent assay (elisa) for determining immunological relationships among β-galactosidases from lactobacilli. Syst. Appl. Microbiol. 1986, 8, 28–31. [Google Scholar] [CrossRef]
- Premi, L.; Sandine, W.E.; Elliker, P.R. Lactose-hydrolyzing enzymes of lactobacillus species. Appl. Microbiol. 1972, 24, 51–57. [Google Scholar] [CrossRef] [Green Version]
- Cesca, B.; Manca de Nadra, M.C.; Strasser de Saad, A.M.; Pesce de Ruiz Holgado, A.; Oliver, G. Beta-d-galactosidase of lactobacillus species. Folia Microbiol. (Praha) 1984, 29, 288–294. [Google Scholar] [CrossRef]
- Ji, D.; Oey, I.; Agyei, D. Purification, characterization and thermal inactivation kinetics of β-galactosidase from lactobacillus leichmannii 313. LWT 2019, 116, 108545. [Google Scholar] [CrossRef]
- Zwietering, M.H.; Jongenburger, I.; Rombouts, F.M.; van ’t Riet, K. Modeling of the bacterial growth curve. Appl. Environ. Microbiol. 1990, 56, 1875–1881. [Google Scholar] [CrossRef] [Green Version]
- Gompertz, B. On the nature of the function expressive of the law of human mortality, and on a new mode of determining the value of life contingencies. In a letter to francis baily, esq. F. R. S. &c. By benjamin gompertz, esq. F. R. S. Abstr. Pap. Print. Philos. Trans. R. Soc. Lond. 1833, 2, 252–253. [Google Scholar]
- Kahm, M.; Hasenbrink, G.; Lichtenberg-Fraté, H.; Ludwig, J.; Kschischo, M. Grofit: Fitting biological growth curves withr. J. Stat. Softw. 2010, 33. [Google Scholar] [CrossRef] [Green Version]
- Bradford, M.M. A rapid and sensitive method for the quantitation of microgram quantities of protein utilizing the principle of protein-dye binding. Anal. Biochem. 1976, 72, 248–254. [Google Scholar] [CrossRef]
- Choonia, H.S.; Lele, S.S. Β-galactosidase release kinetics during ultrasonic disruption of lactobacillus acidophilus isolated from fermented eleusine coracana. Food Bioprod. Process. 2011, 89, 288–293. [Google Scholar] [CrossRef]
- Axelsson, L. Lactic acid bacteria: Classification and physiology. In Lactic Acid Bacteria. Microbiological and Functional Aspects, 3rd ed.; Salminen, S., von Wright, A., Ouwehand, A., Eds.; Marcel Dekker: New York, NY, USA, 2004; pp. 1–66. [Google Scholar]
- Agyei, D.; Danquah, M.K. In-depth characterization of lactobacillus delbrueckii subsp. Lactis 313 for growth and cell-envelope-associated proteinase production. Biochem. Eng. J. 2012, 64, 61–68. [Google Scholar] [CrossRef]
- Agyei, D.; Potumarthi, R.; Danquah, M.K. Optimisation of batch culture conditions for cell-envelope-associated proteinase production from lactobacillus delbrueckii subsp. Lactis atcc® 7830™. Appl. Biochem. Biotechnol. 2012, 168, 1035–1050. [Google Scholar] [CrossRef] [PubMed]
- Murphy, M.G.; Condon, S. Comparison of aerobic and anaerobic growth of lactobacillus plantarum in a glucose medium. Arch. Microbiol. 1984, 138, 49–53. [Google Scholar] [CrossRef]
- Takahashi-Abbe, S.; Abe, K.; Takahashi, N. Biochemical and functional properties of a pyruvate formate-lyase (pfl)-activating system in streptococcus mutans. Oral Microbiol. Immunol. 2003, 18, 293–297. [Google Scholar] [CrossRef]
- Maresca, D.; Zotta, T.; Mauriello, G. Adaptation to aerobic environment of lactobacillus johnsonii/gasseri strains. Front. Microbiol. 2018, 9, 157. [Google Scholar] [CrossRef]
- Hwang, C.-F.; Chang, J.-H.; Houng, J.-Y.; Tsai, C.-C.; Lin, C.-K.; Tsen, H.-Y. Optimization of medium composition for improving biomass production of lactobacillus plantarum pi06 using the taguchi array design and the box-behnken method. Biotechnol. Bioprocess Eng. 2012, 17, 827–834. [Google Scholar] [CrossRef]
- Vasiljevic, T.; Jelen, P. Production of β-galactosidase for lactose hydrolysis in milk and dairy products using thermophilic lactic acid bacteria. Innov. Food Sci. Emerg. Technol. 2001, 2, 75–85. [Google Scholar] [CrossRef]
- Hsu, C.A.; Yu, R.C.; Chou, C.C. Production of beta-galactosidase by bifidobacteria as influenced by various culture conditions. Int. J. Food Microbiol. 2005, 104, 197–206. [Google Scholar] [CrossRef]
- Kistler, H.C.; Broz, K. Cellular compartmentalization of secondary metabolism. Front. Microbiol. 2015, 6, 6. [Google Scholar] [CrossRef] [Green Version]
- Vezzoli, A.; Gussoni, M.; Greco, F.; Zetta, L. Effects of temperature and extracellular ph on metabolites: Kinetics of anaerobic metabolism in resting muscle by 31p-and 1h-nmr spectroscopy. J. Exp. Biol. 2003, 206, 3043–3052. [Google Scholar] [CrossRef] [PubMed] [Green Version]
- Guan, L.; Kaback, H.R. Lessons from lactose permease. Annu. Rev. Biophys. Biomol. Struct. 2006, 35, 67–91. [Google Scholar] [CrossRef] [PubMed] [Green Version]
- Ilhan, Z.E.; Marcus, A.K.; Kang, D.-W.; Rittmann, B.E.; Krajmalnik-Brown, R. Ph-mediated microbial and metabolic interactions in fecal enrichment cultures. mSphere 2017, 2, e00047-17. [Google Scholar] [CrossRef] [PubMed] [Green Version]
- Das Mohapatra, P.K.; Maity, C.; Rao, R.S.; Pati, B.S.; Mondal, K.C. Tannase production by bacillus licheniformis kbr6: Optimization of submerged culture conditions by taguchi doe methodology. Food Res. Int. 2009, 42, 430–435. [Google Scholar] [CrossRef]
- Nguyen, T.-T.; Nguyen, H.-M.; Geiger, B.; Mathiesen, G.; Eijsink, V.G.H.; Peterbauer, C.K.; Haltrich, D.; Nguyen, T.-H. Heterologous expression of a recombinant lactobacillal β-galactosidase in lactobacillus plantarum: Effect of different parameters on the sakacin p-based expression system. Microb. Cell Factories 2015, 14, 30. [Google Scholar] [CrossRef] [Green Version]
- Carevic, M.; Vukasinovic-Sekulic, M.; Grbavcic, S.; Stojanovic, M.; Mihailovic, M.; Dimitrijevic, A.; Bezbradica, D. Optimization of β-galactosidase production from lactic acid bacteria. Hem. Ind. 2015, 69, 305–312. [Google Scholar] [CrossRef]
- Shaikh, S.A.; Khire, J.M.; Khan, M.I. Production of β-galactosidase from thermophilic fungus rhizomucor sp. J. Ind. Microbiol. Biotechnol. 1997, 19, 239–245. [Google Scholar] [CrossRef]
- Wheatley, R.W.; Lo, S.; Jancewicz, L.J.; Dugdale, M.L.; Huber, R.E. Structural explanation for allolactose (lac operon inducer) synthesis by lacz β-galactosidase and the evolutionary relationship between allolactose synthesis and the lac repressor. J. Biol. Chem. 2013, 288, 12993–13005. [Google Scholar] [CrossRef] [Green Version]
- Ullmann, A. Escherichia coli lactose operon; Wiley: Hoboken, NJ, USA, 2009. [Google Scholar]
- Leong-Morgenthaler, P.; Zwahlen, M.C.; Hottinger, H. Lactose metabolism in lactobacillus bulgaricus: Analysis of the primary structure and expression of the genes involved. J. Bacteriol. 1991, 173, 1951–1957. [Google Scholar] [CrossRef] [Green Version]
- Germond, J.-E.; Lapierre, L.; Delley, M.l.; Mollet, B.; Felis, G.E.; Dellaglio, F. Evolution of the bacterial species lactobacillus delbrueckii: A partial genomic study with reflections on prokaryotic species concept. Mol. Biol. Evol. 2003, 20, 93–104. [Google Scholar] [CrossRef] [Green Version]
- Deutscher, J. The mechanisms of carbon catabolite repression in bacteria. Curr. Opin. Microbiol. 2008, 11, 87–93. [Google Scholar] [CrossRef] [PubMed]
- Görke, B.; Stülke, J. Carbon catabolite repression in bacteria: Many ways to make the most out of nutrients. Nat. Rev. Microbiol. 2008, 6, 613–624. [Google Scholar] [CrossRef] [PubMed]
- Ma, F.-X.; Kim, J.H.; Kim, S.B.; Seo, Y.-G.; Chang, Y.K.; Hong, S.-K.; Kim, C.-J. Medium optimization for enhanced production of rifamycin b by amycolatopsis mediterranei s699: Combining a full factorial design and a statistical approach. Process Biochem. 2008, 43, 954–960. [Google Scholar] [CrossRef]
Figure 1.
Catalytic reaction of β-galactosidase.

Figure 2.
The biomass yield and enzyme activity in shaken and static cultures. The bacteria were grown for 12 h at 37 °C in 20 mL of modified MRS broth placed in 30 mL capacity universal media glass bottles. The agitation speed was 100 rpm in a shaken culture condition. Results are shown as the mean ± standard deviation of three independent experiments, and normalized to 1.

Figure 3.
Lactobacillus leichmannii 313 growth and enzyme activity. Bacteria were grown at 37 °C and 0 rpm, in 20 mL of MRS broth placed in 30 mL capacity universal media glass bottles. Results are shown as the mean ± standard deviation of three independent experiments.
Figure 3.
Lactobacillus leichmannii 313 growth and enzyme activity. Bacteria were grown at 37 °C and 0 rpm, in 20 mL of MRS broth placed in 30 mL capacity universal media glass bottles. Results are shown as the mean ± standard deviation of three independent experiments.

Figure 4.
The effect of growth temperature on biomass and enzyme production. The bacteria were grown statically (0 rpm) in 20mL of MRS broth placed in 30 mL capacity universal media glass bottles. Results are shown as the mean ± standard deviation of three independent experiments.
Figure 4.
The effect of growth temperature on biomass and enzyme production. The bacteria were grown statically (0 rpm) in 20mL of MRS broth placed in 30 mL capacity universal media glass bottles. Results are shown as the mean ± standard deviation of three independent experiments.

Figure 5.
The effect of the initial pH on the biomass, enzyme activity, and pH. The bacteria were grown statically (0 rpm) at 37 °C in 20 mL of MRS broth placed in 30 mL capacity universal media glass bottles. Results are shown as the mean ± standard deviation of three independent experiments.
Figure 5.
The effect of the initial pH on the biomass, enzyme activity, and pH. The bacteria were grown statically (0 rpm) at 37 °C in 20 mL of MRS broth placed in 30 mL capacity universal media glass bottles. Results are shown as the mean ± standard deviation of three independent experiments.

Figure 6.
The effect of different carbon sources on the biomass, enzyme activity, and pH. The bacteria were grown statically (0 rpm) at 37 °C with different sole carbon sources (glucose, galactose, lactose, fructose, and sucrose) used at 2% (w/v) in 20 mL of modified MRS broth placed in 30 mL capacity universal media glass bottles. Results are shown as the mean ± standard deviation of three independent experiments.

Figure 7.
Pareto chart showing the significance of the various factors of models for β-galactosidase activity. Each trial was carried out with three independent experiments, with the results being presented as the mean ± standard deviation. The data were analyzed by Minitab and shown as a Pareto chart. The Pareto chart was determined with 95% confidence from an analysis of variance (ANOVA).

Figure 8.
Response surface effects of the pH and concentration of lactose on the specific enzyme activity of β-galactosidase. (A) Three-dimensional response surface plots; (B) contour plots showing the predicted optimal response. The data were analyzed by Minitab and determined with 95% confidence from an analysis of variance (ANOVA).

Figure 9.
The specific enzyme activity of β-galactosidase before and optimization, and activity predicted by the response surface methodology (RSM). Cultures were grown in 20 mL of modified MRS broth placed in 30 mL capacity universal media glass bottles. Results are shown as the mean ± standard deviation of three independent experiments.

Figure 10.
Chromatographic profile of products from lactose hydrolyzed by crude β-galactosidase, for 4 h under the following conditions: using 500 µL of 20% (w/v) lactose and 100 µL of crude enzyme sample (23.13 U/mg specific activity with o-nitrophenol-β-d-galactopyranoside (ONPG) as the substrate), pH = 5.5, and 37 °C.


Table 1.
Levels of independent factors used for full-factorial analysis.
| Levels | Temperature (°C) | pH | Lactose (g/L) |
|---|---|---|---|
| 1 | 45 | 6.5 | 30 |
| 0 | 37 | 5.5 | 20 |
| −1 | 30 | 4.5 | 10 |
Table 2.
The Plackett–Burman design for two levels of the three independent factors.
| No. | Temperature | pH | Lactose (g/L) |
|---|---|---|---|
| 1 | 1 | −1 | 1 |
| 2 | 1 | 1 | −1 |
| 3 | 1 | 1 | 1 |
| 4 | −1 | −1 | 1 |
| 5 | −1 | 1 | −1 |
| 6 | −1 | −1 | −1 |
| 7 | 1 | −1 | −1 |
| 8 | −1 | 1 | 1 |
Table 3.
Levels of independent factors used for central composite design.
| Factor | −1.414 | −1 | 0 | 1 | 1.414 |
| pH | 5 | 5.5 | 6.5 | 7.5 | 8 |
| Lactose (g/L) | 2 | 5 | 15 | 25 | 30 |
Table 4.
The experimental runs for the central composite design for five levels of independent factors.
Table 4.
The experimental runs for the central composite design for five levels of independent factors.
| No. | pH | Lactose |
|---|---|---|
| 1 | 1.414 | 0 |
| 2 | 0 | −1.414 |
| 3 | −1 | -1 |
| 4 | 1 | -1 |
| 5 | −1 | 1 |
| 6 | 0 | 0 |
| 7 | 0 | 1.414 |
| 8 | 1 | 1 |
| 9 | 0 | 0 |
| 10 | 0 | 0 |
| 11 | 0 | 0 |
| 12 | 0 | 0 |
| 13 | −1.414 | 0 |
Table 5.
Bacterial growth curve parameters *.
| Parameter | Value |
|---|---|
| A | 4.49 |
| μmax (h−1) | 1.02 |
| Doubling time (h) | 0.68 |
| λ (h) | 2.79 |
| ε (h) | 4.42 |
| Initial pH | 6.7 |
| Final pH | 3.84 |
* Values were obtained by applying the Gompertz model to the average optical density of independent experimental data (n = 2).
Table 6.
The results of Plackett–Burman design for two levels of independent factors.
| No. | Temperature (°C) | pH | Lactose (g/L) | Specific Enzyme Activity (U/mg) | |
|---|---|---|---|---|---|
| Actual* | Predicted | ||||
| 1 | 30 | 6.5 | 10 | 15.12 ± 1.19 | 14.68 |
| 2 | 30 | 6.5 | 30 | 10.17 ± 0.21 | 11.18 |
| 3 | 45 | 6.5 | 30 | 7.80 ± 0.16 | 9.06 |
| 4 | 45 | 4.5 | 10 | 6.34 ± 0.54 | 7.70 |
| 5 | 45 | 6.5 | 10 | 14.33 ± 0.42 | 12.56 |
| 6 | 45 | 4.5 | 30 | 5.06 ± 0.57 | 4.20 |
| 7 | 30 | 4.5 | 30 | 7.74 ± 0.31 | 6.32 |
| 8 | 30 | 4.5 | 10 | 8.92 ± 1.02 | 9.82 |
*Each run was carried out as three independent experiments, and the results are shown as the mean ± standard deviation.
Table 7.
ANOVA for the response surface quadratic model from Plackett–Burman design (for specific enzyme activity).
Table 7.
ANOVA for the response surface quadratic model from Plackett–Burman design (for specific enzyme activity).
| Source | Degrees of Freedom | Adjusted Sum of Squares | Adjusted Mean Square | F Value | p-Value |
|---|---|---|---|---|---|
| Model | 3 | 119.672 | 39.8905 | 18.43 | 0.001 |
| Linear | 3 | 119.672 | 39.8905 | 18.43 | 0.001 |
| Temperature | 1 | 7.792 | 7.7924 | 3.6 | 0.094 |
| pH | 1 | 67.45 | 67.4502 | 31.17 | 0.001 |
| Lactose | 1 | 44.429 | 44.429 | 20.53 | 0.002 |
| Error | 8 | 17.314 | 2.1642 | ||
| Lack-of-Fit | 4 | 14.621 | 3.6552 | 5.43 | 0.065 |
| Pure Error | 4 | 2.693 | 0.6733 | ||
| Total | 11 | 136.986 |
R2 = 0.87; Adj R2 = 0.82; Pred R2 = 0.71. ANOVA, analysis of variance.
Table 8.
The central composite design for five levels of independent factors. *Results are shown as the mean ± standard deviation of three independent experiments.
Table 8.
The central composite design for five levels of independent factors. *Results are shown as the mean ± standard deviation of three independent experiments.
| No. | pH | Lactose | Specific Enzyme Activity (U/mg) | |
|---|---|---|---|---|
| Actual* | Predicted | |||
| 1 | 8.0 | 15.0 | 21.33 ± 0.54 | 21.19 |
| 2 | 6.5 | 2.0 | 18.59 ± 0.88 | 18.59 |
| 3 | 5.5 | 5.0 | 15.79 ± 0.49 | 15.63 |
| 4 | 7.5 | 5.0 | 20.26 ± 0.80 | 20.40 |
| 5 | 5.5 | 25.0 | 13.87 ± 0.12 | 13.65 |
| 6 | 6.5 | 15.0 | 22.16 ± 0.30 | 22.60 |
| 7 | 6.5 | 30.0 | 14.79 ± 0.49 | 14.88 |
| 8 | 7.5 | 25.0 | 19.36 ± 0.59 | 19.43 |
| 9 | 6.5 | 15.0 | 22.87 ± 0.42 | 22.60 |
| 10 | 6.5 | 15.0 | 22.93 ± 0.34 | 22.60 |
| 11 | 6.5 | 15.0 | 22.87 ± 0.42 | 22.60 |
| 12 | 6.5 | 15.0 | 22.16 ± 0.30 | 22.60 |
| 13 | 5.0 | 15.0 | 13.04 ± 0.61 | 13.28 |
Table 9.
ANOVA for the response surface quadratic model from central composite design (based on specific enzyme activity).
Table 9.
ANOVA for the response surface quadratic model from central composite design (based on specific enzyme activity).
| Source | Degrees of Freedom | Adjusted Sum of Squares | Adjusted Mean Square | F Value | p-Value |
|---|---|---|---|---|---|
| Model | 5 | 160.922 | 32.1844 | 273.52 | 0 |
| Linear | 2 | 72.751 | 36.3756 | 309.14 | 0 |
| pH | 1 | 58.914 | 58.914 | 500.69 | 0 |
| Lactose | 1 | 13.837 | 13.8372 | 117.6 | 0 |
| Square | 2 | 92.243 | 46.1214 | 391.97 | 0 |
| pH*pH | 1 | 47.684 | 47.6843 | 405.25 | 0 |
| Lactose*Lactose | 1 | 58.518 | 58.518 | 497.32 | 0 |
| 2-Way Interaction | 1 | 0.255 | 0.2553 | 2.17 | 0.184 |
| pH*Lactose | 1 | 0.255 | 0.2553 | 2.17 | 0.184 |
| Error | 7 | 0.824 | 0.1177 | ||
| Lack-of-Fit | 3 | 0.179 | 0.0596 | 0.37 | 0.78 |
| Pure Error | 4 | 0.645 | 0.1612 | ||
| Total | 12 | 161.745 |
R2 = 0.99; Adj R2 = 0.99; Pred R2 = 0.98. ANOVA, analysis of variance.
© 2020 by the authors. Licensee MDPI, Basel, Switzerland. This article is an open access article distributed under the terms and conditions of the Creative Commons Attribution (CC BY) license (http://creativecommons.org/licenses/by/4.0/).
Share and Cite
MDPI and ACS Style
Deng, Y.; Xu, M.; Ji, D.; Agyei, D. Optimization of β-galactosidase Production by Batch Cultures of Lactobacillus leichmannii 313 (ATCC 7830™). Fermentation 2020, 6, 27. https://0-doi-org.brum.beds.ac.uk/10.3390/fermentation6010027
AMA Style
Deng Y, Xu M, Ji D, Agyei D. Optimization of β-galactosidase Production by Batch Cultures of Lactobacillus leichmannii 313 (ATCC 7830™). Fermentation. 2020; 6(1):27. https://0-doi-org.brum.beds.ac.uk/10.3390/fermentation6010027
Chicago/Turabian StyleDeng, Yongjin, Min Xu, Dawei Ji, and Dominic Agyei. 2020. "Optimization of β-galactosidase Production by Batch Cultures of Lactobacillus leichmannii 313 (ATCC 7830™)" Fermentation 6, no. 1: 27. https://0-doi-org.brum.beds.ac.uk/10.3390/fermentation6010027
Note that from the first issue of 2016, this journal uses article numbers instead of page numbers. See further details here.