Article

Control of N-Propanol Production in Simulated Liquid State Fermentation of Chinese Baijiu by Response Surface Methodology

1
Hubei Key Laboratory of Edible Wild Plants Conservation Utilization, College of Life Sciences, Hubei Normal University, Huangshi 435000, China
2
Beijing Laboratory for Food Quality and Safety, Beijing Technology and Business University, Beijing 100048, China
3
State Key Laboratory of Agricultural Microbiology, College of Life Science and Technology, Huazhong Agricultural University, Wuhan 430070, China
*
Author to whom correspondence should be addressed.
These authors contributed equally to this study.
Submission received: 30 April 2021 / Revised: 23 May 2021 / Accepted: 30 May 2021 / Published: 31 May 2021
(This article belongs to the Special Issue Advances in Beverages, Food, Yeast and Brewing Research)

Abstract

:
N-propanol is a vital flavor compound of Chinese baijiu, and the proper n-propanol contents contribute to the rich flavor of Chinese baijiu. However, the excessive content of n-propanol in liquor will reduce the drinking comfort. Based on the Box–Behnken design principle, the response surface test was used to optimize the factors affecting the production of n-propanol in a simulated liquid state fermentation of Chinese baijiu, and the best combination of factors to reduce n-propanol content was determined. Results showed that the content ratio of additional glucose to threonine and temperature had a significant effect on the production of n-propanol (p = 0.0009 < 0.01 and p = 0.0389 < 0.05, respectively). The best combination of fermentation parameters obtained was: the ratio of additional glucose to threonine content was 6:4, the temperature was 32 °C, and the initial pH was 4.40. Under these conditions, the production of n-propanol was 53.84 ± 0.12 mg/L, which was close to the theoretical value. Thus, the fermentation parameter model obtained through response surface optimization is reliable and can provide technical guidance for regulating the production of n-propanol and realizing high-quality baijiu brewing.

1. Introduction

Chinese baijiu is one of the world’s six major distilled liquors. In 2020, the output of Chinese liquor was 7.41 million kiloliters, with a market value of approximately USD 89.8 billion. Chinese baijiu is popular among consumers worldwide because of its unique flavor and rich taste [1,2]. The flavor substances only account for about 2% of baijiu, but their type and content determine the flavor and quality of the baijiu [3,4]. N-propanol is one of the important flavor substances of liquor. A moderate amount of n-propanol forms a refreshing and mellow taste in baijiu. However, if its content is too high, the baijiu will have an ethereal odor and bitter taste, which makes it unpleasant to drink and can even cause poisoning [5,6,7,8]. It is very important to control the content of n-propanol in the process of Chinese baijiu brewing to realize high-quality liquor brewing.
N-propanol is mainly the primary metabolite produced through the reproduction and metabolism of Saccharomyces cerevisiae, and it is synthesized via the amino acid metabolism pathway [9,10] and pyruvate synthesis pathway [11,12] in the fermentation process. The main method to control the content of n-propanol in liquor is to select good S. cerevisiae, having a low-yield of n-propanol [13,14], and transform the key genes that affect n-propanol production in yeast cells [15,16]. However, the modification of yeasts through molecular means for reducing the production of n-propanol is still in the laboratory stages and has safety problems when applied in food production. In addition, the production of n-propanol can also be controlled by changing the brewing raw materials [17]; adjusting the fermentation conditions, such as temperature, dissolved oxygen, and α-amino nitrogen [18,19,20]; adding additional enzymes during liquor fermentation [5]; and using nanofiltration membranes to filter the new brewing base baijiu [21]. Although these control methods reduce n-propanol content, they also reduce ethanol content, and these methods are aimed at a certain type of liquor. However, the process of Chinese baijiu production is complicated, and the same control method is not suitable for different liquor brewing processes, increasing the difficulty in regulating n-propanol content in Chinese baijiu brewing.
Chinese baijiu usually uses solid state fermentation technology, which has a complicated process and a long-fermentation cycle. Simulating the solid state fermentation process of baijiu in the laboratory has the problems of unevenness in fermentation and production of metabolites among others, which increases the difficulty of the experiment [22]. There is also a certain market for baijiu fermented by liquid state fermentation. Liquor obtained from cereals as the raw material, using a liquid fermentation process and liquid distillation, has the characteristics of being low cost, a short fermentation cycle, and a high degree of mechanization [23,24]. In the laboratory, the mechanisms of n-propanol production in baijiu brewing can be quickly explored by using the liquid fermentation process to guide the brewing and production of Chinese baijiu [25].
Response surface analysis is a statistical experimental design that can continuously analyze all levels of the experiment. It has the characteristics of simple calculation, small number of experiments, and reasonable and reliable results, and it is widely used in process, such as optimization and experimental optimization [26]. Therefore, this study selected three factors, namely the content ratio of additional glucose to threonine, temperature, and initial pH. Using the Box–Behnken design of single factor experiment and response surface test, the production of n-propanol was used as a response surface for optimization, and the parameter combination model with the lowest production of alcohol was established to provide guidance for regulating the production of n-propanol in liquor production.

2. Material and Methods

2.1. Raw Materials and Strains

The raw material was sorghum, which was procured from Anhui Wenwang Brewing Co., Ltd. The starter used in liquid state fermentation was commercial high-temperature-resistant alcohol fermentation active dry yeast (1 × 10⁸ CFU/g). Before useglucose, accounting for 2% of the amount of yeast used, was weighed to prepare a glucose–water solution diluted 20-fold to activate S. cerevisiae in a water bath at 30 °C for 30 min.

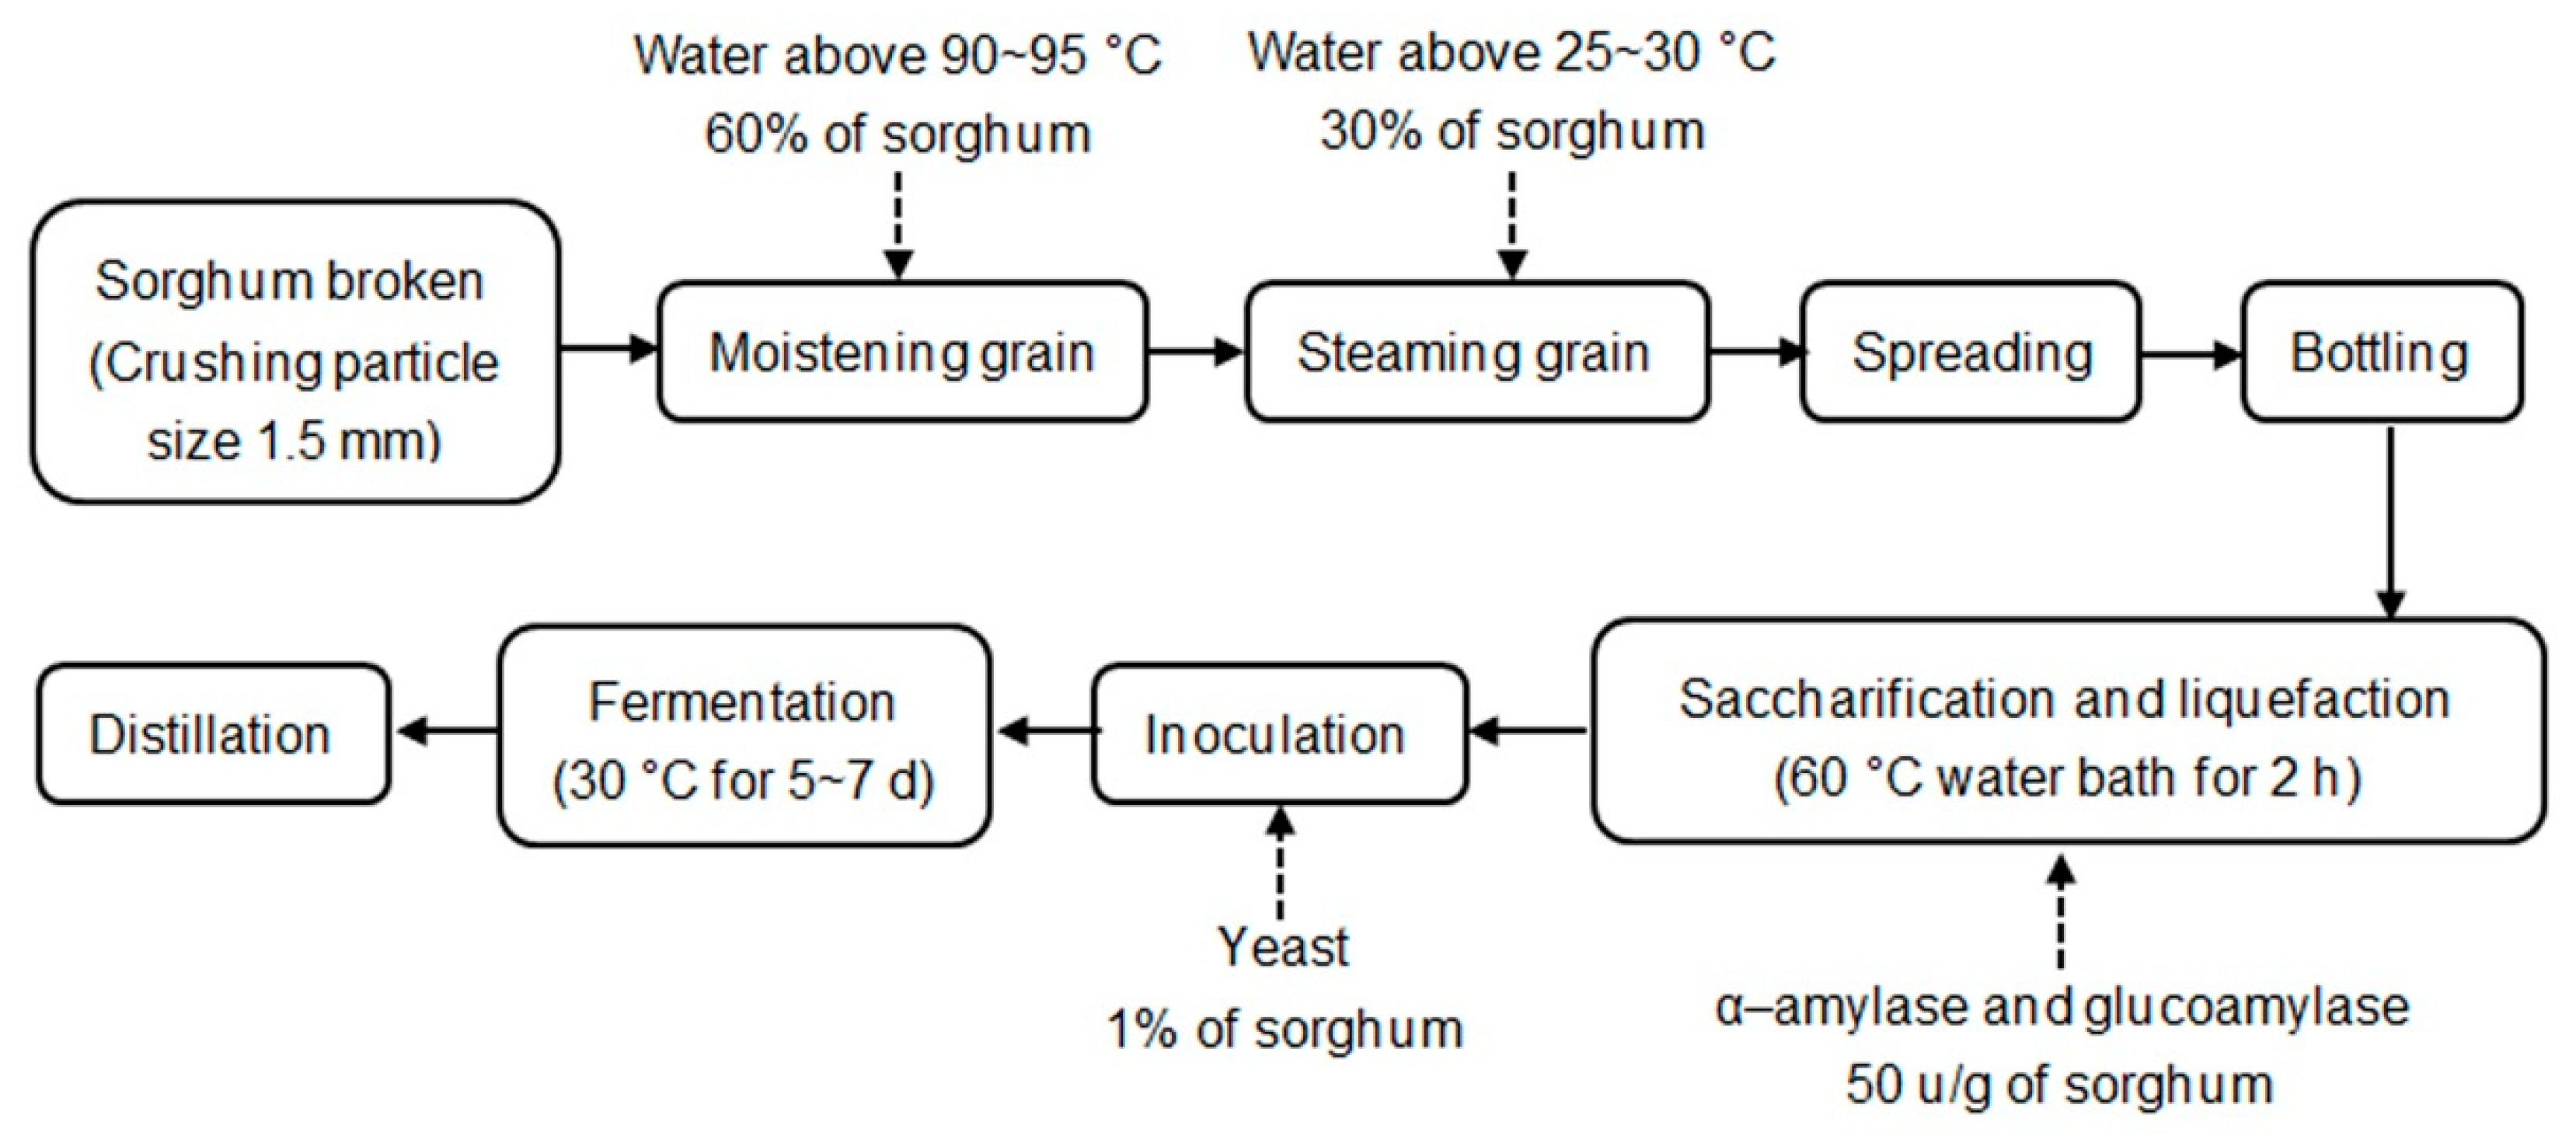
2.2. Liquid Fermentation Process

The liquid state fermentation process of baijiu is shown in Figure 1. A total of 100 g of crushed sorghum (particle size 1.5 mm) was weighed and 60 mL of hot water (90–95 °C) was added to moisten the grain for 20 h, and then, it was steamed for 90 min after adding 30 mL of cold water (25–30 °C). Next, the solution was left to cool. After the sorghum cooled down to 25–30 °C, it was put into a 500 mL Erlenmeyer flask and 300 mL of cold water, α-amylase (50 U/g sorghum; 3700 U/g; AOBOX, Beijing, China), and glucoamylase (50 U/g sorghum; 100,000 U/g; AOBOX, Beijing, China) were added. The solution was stirred well, put in 60 °C water bath for 2 hours, then cooled to 25–30 °C. S. cerevisiae, accounting for 1% of the amount of sorghum used, was used for inoculation, and the solution was allowed to stand and ferment at 30 °C for 5–7 days, and then distilled. Distillate of 100 mL was taken for analysis. Each experiment was repeated 3 times.

2.3. Optimization of Fermentation Parameters

Considering many factors, from the point of view of controllable fermentation process, three factors (the content ratio of additional glucose to threonine, temperature, and initial pH) that have great influence on the n-propanol production were selected to study. Before inoculating the starter, glucose and threonine accounting for 1% of the amount of sorghum used were added to the Erlenmeyer flask, the ratio of glucose to threonine was set to 10:0, 8:2, 6:4, 4:6, 2:8, 0:10, and the effect of the content ratio of additional glucose to threonine on the production of n-propanol was studied. Under the conditions of optimized glucose and threonine, the effect of different temperatures (23 °C, 28 °C, 32 °C, 37 °C, 40 °C) on the production of n-propanol was studied. Based on the above, the initial pH of the fermentation system was adjusted to 4.00, 4.50, 5.00, 5.50, 6.00 with acetic acid solution, and the effects of different initial pH on the production of n-propanol were compared.

2.4. Box–Behnken Design

According to Box–Behnken design principle, taking n-propanol production content as the response surface, a three-factor and three-level response surface optimization experiment was designed to determine the best combination of fermentation parameters to reduce the production of n-propanol. Among them, the three independent factors were the content ratio of additional glucose to threonine, temperature, and initial pH. To make the impact of each parameter on the response surface consistent, each independent variable was coded into three levels, namely low (−1), medium (0), and high (+1). The experimental design factors and levels are shown in Table 1, and the actual level of each factor was calculated with the following formula [27]:
Actual   level = coaded   value × High   level low   level 2 + High   level + low   level 2
A total of 17 sets of experiments were designed, comprising 12 sets of factorial point experiments and 5 sets of zero-point experiments. To estimate the error in the experiment, the zero-point test was repeated 5 times. The response surface design results are shown in Table 2. Using the response surface software, the response surface 3D map and two-dimensional contour map were drawn for the model, and the best combination of parameters of factors was predicted.
The model between the response variable and the parameter is represented by the following second-order polynomial [28]:
Y = b 0 + b 1 A + b 2 B + b 3 C + b 4 AB + b 5 AC + b 6 BC + b 7 A 2 + b 8 B 2 + b 9 C 2
where Y is the response variable; A, B, and C are the parameters that affect the response variable; and b0–b9 are the regression coefficients of the intercept term, linear term, quadratic term, and inter-factor interaction term.

2.5. Determination of N-Propanol Concentration

After the fermentation was completed, the fermentation broth was filtered, 300 mL of the boiled and distilled fermentation broth was put into a 1000-mL distillation flask, and 100 mL of the distillate was stored at −4 °C for use. Gas chromatography (Auto System XL; PerkinElmer; Waltham, MA, USA) was used to detect the content of n-propanol in the distillate. The sample solution was analyzed using a CP-Wax 57CB capillary column (50 m × 0.25 mm × 0.2 μm). The detection conditions were as follows: column temperature program was with an initial temperature of 30 °C, which was constant for 5 min, heated at 5 °C/min to 60 °C, heated at 6 °C/min to 120 °C, which remained constant for 5 min, and then heated according to program at 8 °C/min to 210 °C, which remained constant for 5 min. High purity N2 was the carrier gas, with a flow rate of 1 mL/min and split ratio of 10:1. H2 flow rate was 45 mL/min, air flow rate was 450 mL/min, detector temperature was 260 °C, sampler temperature was 240 °C, and injection volume was 1 μL.

2.6. Data Analysis

Microsoft Excel was used to summarize all data and each group of the experimental set was repeated 3 times. Origin 8.5 software was used for drawing; Design-Expert software (version 8.0.6.1) was used for response surface analysis; ANOVA, R2, and Adj-R2 were used to evaluate the rationality of the model. p < 0.05 indicated significance and p < 0.01 indicated extreme significance.

3. Results and Discussion

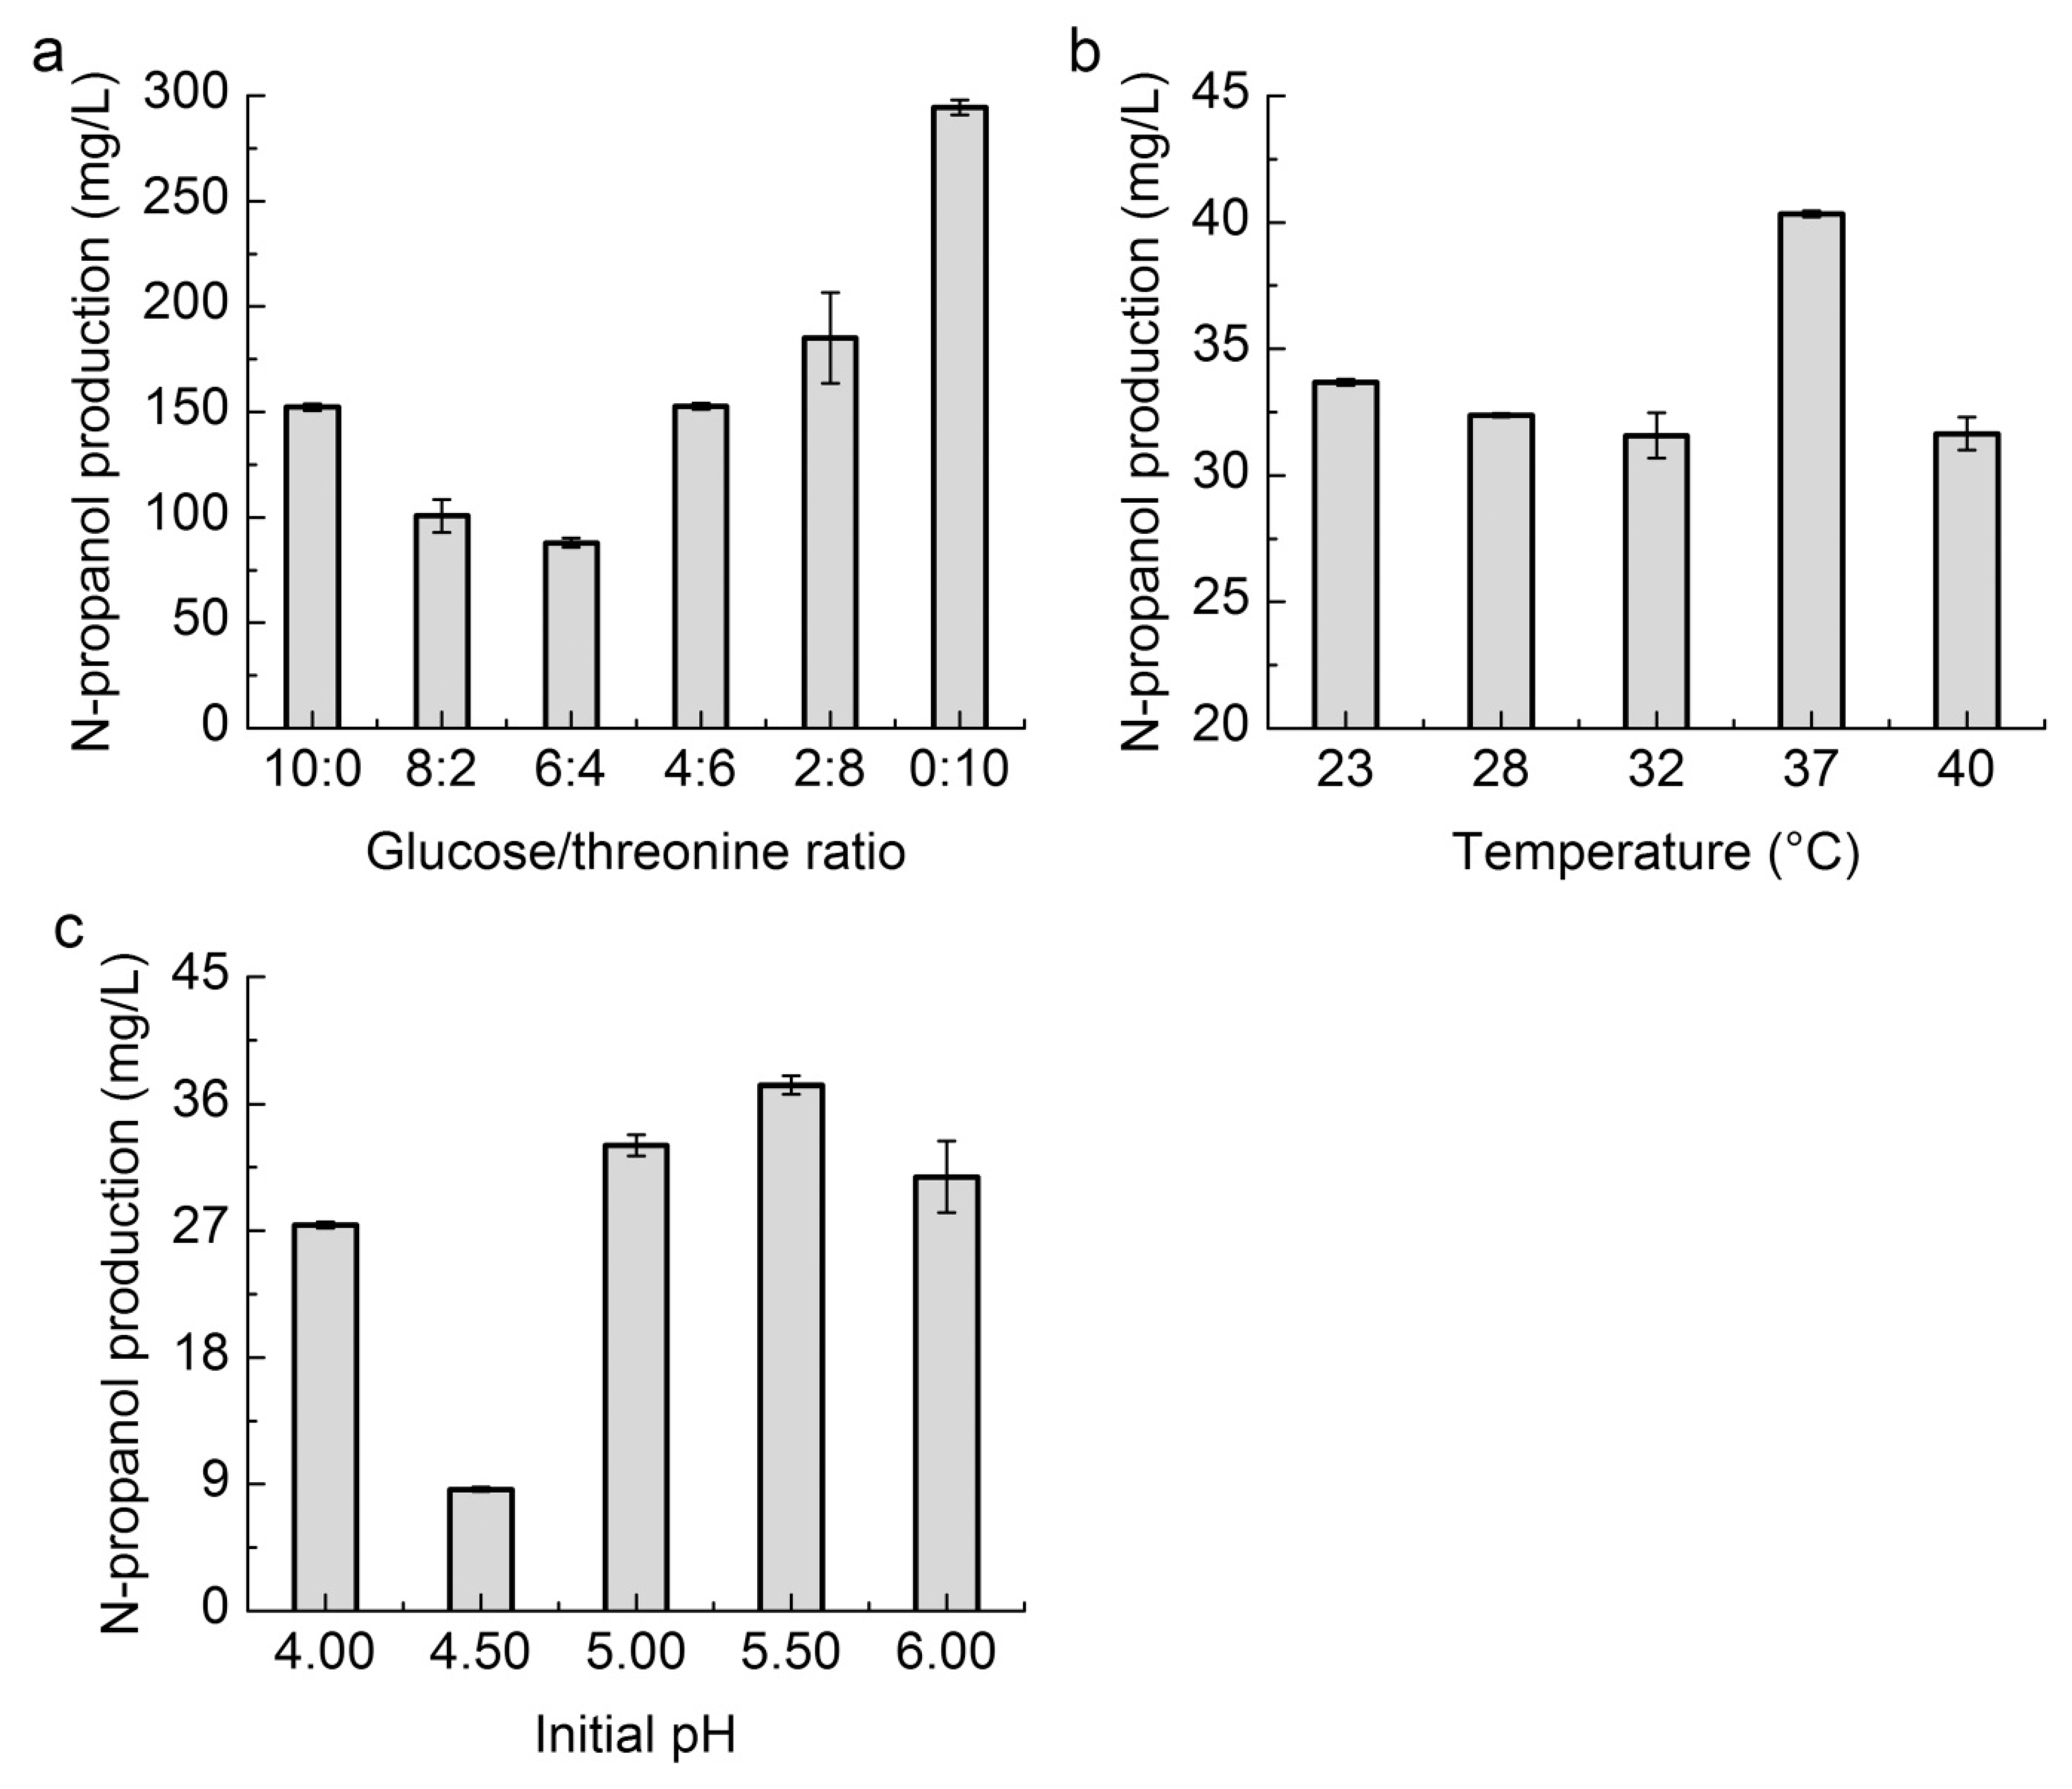
3.1. Effect of Glucose to Threonine Ratio on N-Propanol Production

When there are insufficient amino acids in the fermentation system, yeast cells use soluble sugars to synthesize excessive n-propanol. When there are sufficient amino acids in the fermentation system, yeast cells do not need to synthesize their own amino acids, and sufficient amino acids will inhibit the occurrence of pyruvate synthesis pathway. Yeast cells synthesize n-propanol mainly through amino acid metabolism [29]. Maintaining an appropriate ratio of carbon to nitrogen sources is very important in regulating the production of n-propanol. In the baijiu brewing system, the carbon and nitrogen sources are mainly sorghum. Additional glucose is added as the available carbon source, and additional amino acids are added as the available nitrogen source, among which threonine is the precursor of n-propanol [30,31]. Therefore, this study determined the effect of carbon and nitrogen metabolism on the production of n-propanol by adding additional glucose and threonine. The results are shown in Figure 2a. When the content ratio of additional glucose to threonine in the fermentation system is in the range of 10:0–6:4, the production of n-propanol gradually decreases. When the content ratio of additional glucose to threonine is 6:4, the production of n-propanol is the lowest, which is 87.94 mg/L. Thereafter, with the increase in threonine content, the production of n-propanol increases rapidly. In addition, the same rule was found when studying inorganic nitrogen sources (Figure S1). It shows that when the content of carbon and nitrogen sources in the fermentation system reaches a certain ratio, the production of n-propanol can be effectively reduced. Therefore, the ratios of additional glucose to threonine contents of 8:2, 6:4, and 4:6 were selected as the response surface optimization levels. There are few studies on the effect of yeast carbon and nitrogen source metabolism on the regulation of the production of n-propanol. This article is the first to study the effect of the ratio of carbon to nitrogen sources on the production of n-propanol. The final concentration of n-propanol is significantly and positively affected by the initial nitrogen content (p < 0.001) using the response surface methodology [27]. The results of this study are similar, when the initial threonine content of the fermentation system increases, the production of n-propanol increases. The difference is that the former study was conducted in a single nitrogen source environment, whereas carbon and nitrogen sources were used in this study.

3.2. Effect of Temperature on N-Propanol Production

Temperature is an important parameter in regulating the brewing process [32]. When the temperature is too high, the microorganisms grow rapidly, accelerating the utilization of soluble sugars and free amino acids and generating more n-propanol [33]. As shown in Figure 2b, the amount of n-propanol produced at 23–−32 °C gradually decreases. It is the lowest at 32 °C, which is 31.57 mg/L. Thereafter, as the temperature increases, the production of n-propanol increases rapidly, but when the temperature is 40 °C, the production of n-propanol decreases rapidly. It might be due to the inactivation of some yeast cells caused by the high temperature. Therefore, 28 °C, 32 °C, and 37 °C were selected as the optimized temperature of the response surface. Research by Ough et al. [34] showed that n-propanol was produced at the lowest amount at 35 °C. In this study, the content of n-propanol was low when the temperature was 32 °C. Yamamoto et al. [19] studied the effect of 20 °C, 28 °C, and 38 °C temperatures on the production of n-propanol by yeast and found that the n-propanol content was low when the temperature was 38 °C, whereas the amount of n-propanol produced was high when the temperature reached 37 °C. It may be that the research subjects were different, which was beer in their study and liquor in the present study.

3.3. Effect of Initial pH on N-Propanol Production

pH has an impact on the production of n-propanol in liquor brewing. Low-pH values inhibit the growth and metabolism of microorganisms, whereas high-pH values are not conducive for the formation of other flavors in Chinese baijiu [35]. Because the adjustment of pH in liquor mainly relies on organic acids, such as acetic acid and lactic acid, we used acetic acid to adjust the initial pH of the fermentation system. The results are shown in Figure 2c. The production of n-propanol showed, at first, a decreasing and then an increasing trend. When the pH was 4.50, the production of n-propanol was the lowest, which was 8.63 mg/L. When the pH in the fermentation system exceeded 5.50, the production of n-propanol decreased slightly. When the pH was lower than 4.00, the fermentation environment had high acidity. Thus, the microorganisms could not grow or reproduce, and n-propanol was not detected. Therefore, pH 4.00, 4.50, and 5.00 were selected as the response surface optimization levels.

3.4. Prediction Model for Regulation of N-Propanol Content

Through the multiple regression fitting analysis of the data in Table 2, the regression equation with the production of n-propanol as the response value is obtained as:
Y ( mg / L ) = 58.93 + 17.47 A 8.02 B + 1.81 C 1.96 AB 2.74 AC + 6.19 BC + 15.76 A 2 + 15.55 B 2 + 38.89 C 2 ,
where A is the content ratio of additional glucose to threonine, B is the temperature, and C is the initial pH. The analysis of variance and the significance verification of regression coefficients were performed on the above models, and the results are shown in Table 3. Model p = 0.0006 (p < 0.01) indicates that the model has reached a very significant level. Concurrently, the lack-of-fit term p = 0.0511 (p > 0.05) is not significant, indicating that the model is reasonable and the experimental method is accurate and feasible within the range of experimental parameters, and it can be used to speculate and analyze the process experiment for regulating the content of n-propanol. In addition, the negative correlation coefficient R2 = 0.9566 of the model indicates that the model can predict 95.66% of the data, and the determination coefficient Radj2 = 0.9009 of the equation indicates that the experimental value is closely related to the predicted value and the model is reliable [36].
It can be seen from Table 3 that the linear terms, glucose to threonine ratio, and temperature, have a significant effect on the production of n-propanol (p = 0.0009 < 0.01 and p = 0.0389 < 0.05, respectively), whereas the initial pH has no significant effect on the production of n-propanol (p = 0.5844), and the interaction between the factors is also not significant (p > 0.05). In the quadratic terms, A2, B2, and C2 have extremely significant effects on the production of n-propanol (p < 0.01). From the F value and p value, it can be seen that the factors affecting the production of n-propanol, from large to small, are the content ratio of additional glucose to threonine (A) > temperature (B) > initial pH (C).

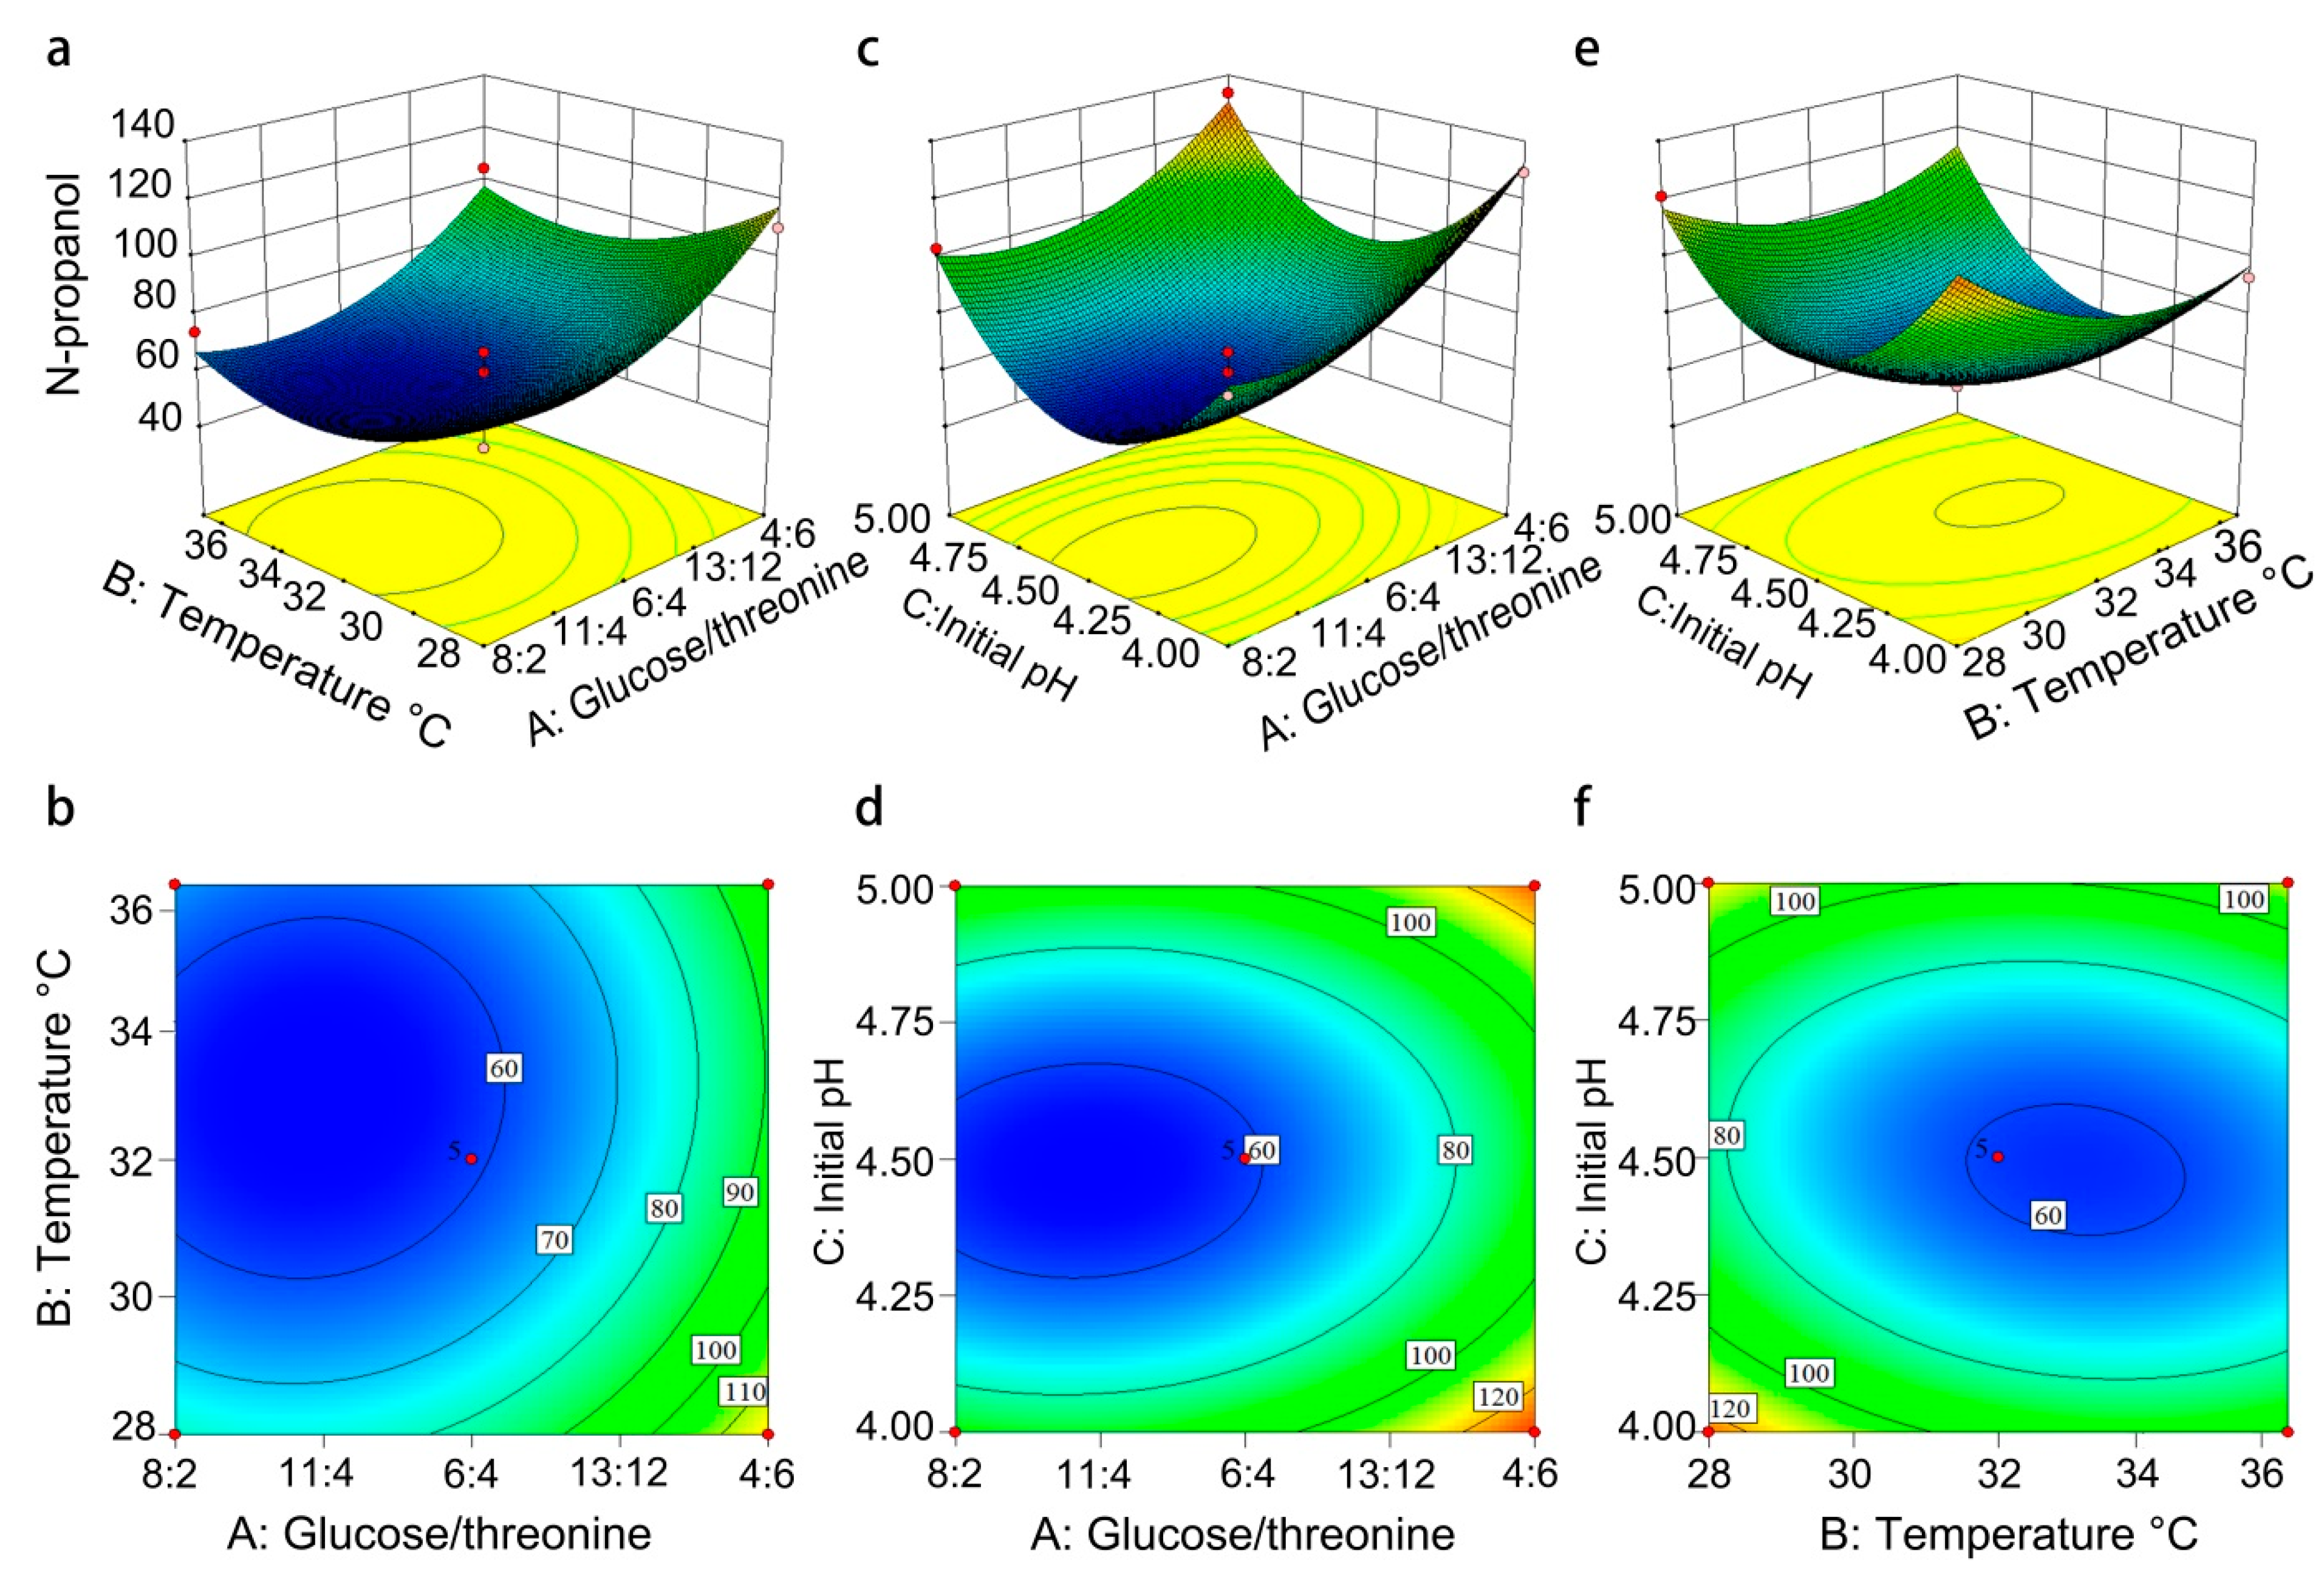
3.5. Analysis of Response Surface (3D) and Corresponding Contour (2D) on N-Propanol

The response surface and contour map can directly reflect the influence of the interaction between the two factors on the response surface. When the slope of the response surface is steeper, the contour is denser and the contour ellipse is more obvious, then the interaction between the two factors is stronger [37,38]. The results of the interaction between the three factors and their influence on the production of n-propanol are shown in Figure 3. The response surface openings are all upward. The response surface graph obtained by the interaction between the content ratio of additional glucose to threonine and the initial pH (Figure 3c,d) and the influence surface graph obtained by the interaction between temperature and initial pH (Figure 3e,f) have steep slopes, but the difference is not significant. Therefore, the interaction between any two of the three factors of content ratio of additional glucose to threonine, temperature, and initial pH is not significant. This result is consistent with Table 3.

3.6. Model Verification Test Results

The optimal conditions obtained by the response surface optimization design are as follows: the content ratio of additional glucose to threonine is 113:100, the temperature is 31.24 °C, and the initial pH is 4.46. Under these conditions, the theoretical production of n-propanol is 53.92 mg/L. Considering the feasibility of the actual operation, the actual experimental conditions are as follows: the content ratio of additional glucose to threonine is 6:4, the temperature is 32 °C, and the initial pH is 4.40, and the experiment is repeated thrice. The average production of n-propanol under this condition is 53.84 ± 0.12 mg/L, which is close to the theoretical value, indicating that the regression model is reasonable and can effectively reflect the influence of various factors on the production of n-propanol in the simulated liquid state fermentation of Chinese baijiu. In addition, before optimization, the content of n-propanol in the fermentation of liquid simulated baijiu was 93.54 ± 2.87 mg/L. The optimized fermentation process in this study reduced the content of n-propanol by 42.44%.

4. Conclusions

To the best of our knowledge, this is the first study to determine the influence of glucose to threonine ration on the production of n-propanol during liquor fermentation from the perspective of the ratio of carbon to nitrogen sources. The single factor test results showed that the most suitable conditions for reducing the content of n-propanol were as follows: the ratio of additional glucose to threonine was 6:4, the temperature was 32 °C, and the initial pH was 4.50. The Box–Behnken design of the response surface test was used to optimize the above conditions, and the optimal process conditions for regulating the production of n-propanol were obtained as follows: the content ratio of additional glucose to threonine was 6:4, the temperature was 32 °C, and the initial pH was 4.40. Under these conditions, the production of n-propanol was 53.84 ± 0.12 mg/L, which is close to the theoretical value. Compared to before the optimization, the content of n-propanol was reduced by 42.44%. The regression model obtained through the response surface optimization experiment was reasonable, which can effectively reduce the content of n-propanol during the fermentation process of the liquor, and provide a reference for regulating the content of n-propanol in Chinese baijiu during brewing.

Supplementary Materials

The following are available online at https://0-www-mdpi-com.brum.beds.ac.uk/article/10.3390/fermentation7020085/s1, Figure S1: Effect of glucose to ammonium phosphate ratio on n-propanol.

Author Contributions

Conceptualization, Y.Y. and X.H.; methodology, X.H.; software, Y.L. (Yifan Lu), Z.Z.; resources, Y.Y.; formal analysis, Y.L. (Yunxiang Liang) and B.S.; investigation, Z.Z., J.L. and X.X.; data curation, Y.Y.; writing—original draft preparation, Y.Y.; writing—review and editing, X.H. and Y.H.; visualization, supervision, S.Z., Y.L. (Yunxiang Liang), and B.S.; project administration, funding acquisition, Y.H. All authors have read and agreed to the published version of the manuscript.

Funding

This work was supported by grant 2020CFB527 of the Natural Science Foundation of Hubei Province, grant 2020BAB095 of the Key Research and Development program of Hubei Province, and grant EWPL201715 of the Hubei Key Laboratory of Edible Wild Plants Conservation and Utilization.

Institutional Review Board Statement

Not applicable.

Informed Consent Statement

Informed consent was obtained from all subjects involved in the study.

Data Availability Statement

Not applicable.

Acknowledgments

The authors would like to thank Center of Quality and Safety of Alcoholic Beverages of China National Research Institute of Food and Fermentation Industries for their technical support during this work.

Conflicts of Interest

The authors declare that there are no competing interests.

References

  1. Liu, H.; Sun, B. Effect of Fermentation Processing on the Flavor of Baijiu. J. Agric. Food Chem. 2018, 66, 5425–5432. [Google Scholar] [CrossRef] [PubMed]
  2. Wei, Y.; Zou, W.; Shen, C.; Yang, J. Basic flavor types and component characteristics of Chinese traditional liquors: A review. J. Food Sci. 2020, 85, 4096–4107. [Google Scholar] [CrossRef]
  3. Zhu, J.; Wang, L.; Xiao, Z.; Niu, Y. Characterization of the key aroma compounds in mulberry fruits by application of gas chromatography–olfactometry (GC-O), odor activity value (OAV), gas chromatography-mass spectrometry (GC–MS) and flame photometric detection (FPD). Food Chem. 2018, 245, 775–785. [Google Scholar] [CrossRef] [PubMed]
  4. Jin, G.; Zhu, Y.; Xu, Y. Mystery behind Chinese liquor fermentation. Trends Food Sci. Technol. 2017, 63, 18–28. [Google Scholar] [CrossRef]
  5. Qi’an, H.; Junling, S.; Jing, Z.; Hongliang, L.; Shuangkui, D. Enzymes extracted from apple peels have activity in reducing higher alcohols in Chinese liquors. J. Agric. Food Chem. 2014, 62, 9529–9538. [Google Scholar]
  6. Genovese, A.; Piombino, P.; Gambuti, A.; Moio, L. Simulation of retronasal aroma of white and red wine in a model mouth system. Investigating the influence of saliva on volatile compound concentrations. Food Chem. 2009, 114, 100–107. [Google Scholar] [CrossRef]
  7. Zhong, X.; Wang, A.; Zhang, Y.; Wu, Z.; Li, B.; Lou, H.; Huang, G.; Wen, H. Reducing higher alcohols by nitrogen compensation during fermentation of Chinese rice wine. Food Sci. Biotechnol. 2020, 29, 805–816. [Google Scholar] [CrossRef]
  8. Yang, D.; Luo, X.; Wang, X. Characteristics of traditional Chinese shanlan wine fermentation. J. Biosci. Bioeng. 2014, 117, 203–207. [Google Scholar] [CrossRef]
  9. Hazelwood, L.A.; Daran, J.M.; Maris, A.; Pronk, J.T.; Dickinson, J.R. The Ehrlich Pathway for Fusel Alcohol Production: A Century of Research on Saccharomyces cerevisiae Metabolism. Appl. Environ. Microbiol. 2008, 74, 2259–2266. [Google Scholar] [CrossRef] [Green Version]
  10. Procopio, S.; Krause, D.; Hofmann, T.; Becker, T. Significant amino acids in aroma compound profiling during yeast fermentation analyzed by PLS regression. LWT-Food Sci. Technol. 2013, 51, 423–432. [Google Scholar] [CrossRef]
  11. Avalos, J.L.; Fink, G.R.; Stephanopoulos, G. Compartmentalization of metabolic pathways in yeast mitochondria improves the production of branched-chain alcohols. Nat. Biotechnol. 2013, 31, 335–341. [Google Scholar] [CrossRef] [PubMed] [Green Version]
  12. Yuan, J.; Chen, X.; Mishra, P.; Ching, C. Metabolically engineered Saccharomyces cerevisiae for enhanced isoamyl alcohol production. Appl. Microbiol. Biotechnol. 2017, 101, 465–474. [Google Scholar] [CrossRef]
  13. Molina, A.M.; Guadalupe, V.; Varela, C.; Swiegers, J.H.; Pretorius, I.S.; Agosin, E. Differential synthesis of fermentative aroma compounds of two related commercial wine yeast strains. Food Chem. 2009, 117, 189–195. [Google Scholar] [CrossRef]
  14. Carrau, F.; Medina, K.; Farina, L.; Boido, E.; Dellacassa, E. Effect of Saccharomyces cerevisiae inoculum size on wine fermentation aroma compounds and its relation with assimilable nitrogen content. Int. J. Food Microbiol. 2010, 143, 81–85. [Google Scholar] [CrossRef]
  15. Wei, L.; ShiJia, C.; JianHui, W.; CuiYing, Z.; Yu, S.; XueWu, G.; YeFu, C.; DongGuang, X. Genetic engineering to alter carbon flux for various higher alcohol productions by Saccharomyces cerevisiae for Chinese Baijiu fermentation. Appl. Microbiol. Biotechnol. 2018, 102, 1783–1795. [Google Scholar] [CrossRef]
  16. Wang, Y.P.; Sun, Z.G.; Wei, X.Q.; Guo, X.W.; Xiao, D.G. Identification of Core Regulatory Genes and Metabolic Pathways for the n -Propanol Synthesis in Saccharomyces cerevisiae. J. Agric. Food Chem. 2021, 69, 1637–1646. [Google Scholar] [CrossRef] [PubMed]
  17. XingLin, H.; DeLiang, W.; WuJiu, Z.; ShiRu, J. The production of the Chinese baijiu from sorghum and other cereals. J. Inst. Brew. 2017, 123, 600–604. [Google Scholar] [CrossRef] [Green Version]
  18. Varela, C.; Torrea, D.; Schmidt, S.A.; Ancin-Azpilicueta, C.; Henschke, P.A. Effect of oxygen and lipid supplementation on the volatile composition of chemically defined medium and Chardonnay wine fermented with Saccharomyces cerevisiae. Food Chem. 2012, 135, 2863–2871. [Google Scholar] [CrossRef] [PubMed]
  19. Yamamoto, H.; Mizutani, M.; Yamada, K.; Iwaizono, H.; Takayama, K.; Hino, M.; Kudo, T.; Ohta, H.; Kida, K.; Morimura, S. Characteristics of aromatic compound production using new shochu yeast MF062 isolated from shochu mash. J. Inst. Brew. 2012, 118, 406–411. [Google Scholar] [CrossRef]
  20. Barbosa, C.; Mendes-Faia, A.; Mendes-Ferreira, A. The nitrogen source impacts major volatile compounds released by Saccharomyces cerevisiae during alcoholic fermentation. Int. J. Food Microbiol. 2012, 160, 87–93. [Google Scholar] [CrossRef] [PubMed]
  21. Hsieh, C.W.; Huang, Y.H.; Lai, C.H.; Ho, W.J.; Ko, W.C. Develop a Novel Method for Removing Fusel Alcohols from Rice Spirits Using Nanofiltration. J. Food Sci. 2010, 75, N25–N29. [Google Scholar] [CrossRef]
  22. Tang, J.; Wang, H.Y.; Xu, Y. Effect of mixed culture of Saccharomyces cerevisiae and Pichia anomala on fermentation efficiency and flavor compounds in Chinese Liquor. Microbiol. China 2012, 39, 921–930. [Google Scholar]
  23. Yaping, W.; Shuang, X.; Zhongguan, S.; Dongguang, X. Factors Influencing Higher Alcohol in the Liquid Fermentation of Daqu Baijiu. J. Tianjin Univ. Sci. Technol. 2019, 34, 39–44. [Google Scholar] [CrossRef]
  24. Xiao, R.; Chen, X.; Guo, Y.; Huang, X.; Wu, Y. Fermentation of Xiaoqu Fen-flavor Baijiu using Amaranthus tricolor seeds. China Brew. 2018, 37, 127–131. [Google Scholar]
  25. Rufei, M.A.; Yubo, M.A.; Tong, S.; Liu, P. Optimization of Liquid-State Fermentation of Qingxiang Baijiu with Corn as Main Raw Material. Liquor-Mak. Sci. Technol. 2018, 11, 80–84. [Google Scholar] [CrossRef]
  26. Alenyorege, E.A.; Ma, H.; Aheto, J.H.; Ishmael, A.; Zhou, C. Response surface methodology centred optimization of mono-frequency ultrasound reduction of bacteria in fresh-cut Chinese cabbage and its effect on quality. LWT-Food Sci. Technol. 2020, 122, 108991. [Google Scholar] [CrossRef]
  27. Rollero, S.; Bloem, A.; Camarasa, C.; Sanchez, I.; Mouret, J.R. Combined effects of nutrients and temperature on the production of fermentative aromas by Saccharomyces cerevisiae during wine fermentation. Appl. Microbiol. Biotechnol. 2014, 99, 2291–2304. [Google Scholar] [CrossRef] [PubMed]
  28. Uysal, S.; Cvetanović, A.; Zengin, G.; Đurović, S.; Aktumsek, A. Optimization of the extraction process of antioxidants from loquat leaves using response surface methodology. J. Food Process. Preserv. 2017, 41, e13185. [Google Scholar] [CrossRef]
  29. Sun, Z.; Liu, L.; Wang, Y.; Wang, X.; Xiao, D. Higher alcohols metabolism by Saccharomyces cerevisiae: A mini review. Chin. J. Biotechnol. 2021, 37, 429–447. [Google Scholar] [CrossRef]
  30. Sun, Z.; Wang, M.; Wang, Y.; Xing, S.; Hong, K.; Chen, Y.; Guo, X.; Xiao, D. Identification by comparative transcriptomics of core regulatory genes for higher alcohol production in a top-fermenting yeast at different temperatures in beer fermentation. Appl. Microbiol. Biotechnol. 2019, 103, 4917–4929. [Google Scholar] [CrossRef]
  31. Graham, S. The Production of Secondary Metabolites with Flavour Potential during Brewing and Distilling Wort Fermentations. Fermentation 2017, 3, 63. [Google Scholar] [CrossRef] [Green Version]
  32. Zhang, H.; Wang, L.; Wang, H.; Yang, F.; Xu, Y. Effects of initial temperature on microbial community succession rate and volatile flavors during Baijiu fermentation process. Food Res. Int. 2020, 141, 109887. [Google Scholar] [CrossRef]
  33. Lingling, P.; Mingyou, L.; Mei, W.; Shidong, B.; Shuyi, Q.; Xueyu, F. Effect of fermentation temperature on fusel oil content in strong-flavor Baijiu. China Brew. 2021, 40, 106–110. [Google Scholar]
  34. Ough, C.S.; Guymon, J.F.; Crowell, E.A. Formation of Higher Alcohols during Grape Juice Fermentations at Various Temperatures. J. Food Sci. 2010, 31, 620–625. [Google Scholar] [CrossRef]
  35. Zhao, C.; Yan, X.; Yang, S.; Chen, F. Screening of Bacillus strains from Luzhou-flavor liquor making for high-yield ethyl hexanoate and low-yield propanol. LWT Food Sci. Technol. 2017, 77, 60–66. [Google Scholar] [CrossRef]
  36. Oo, K.S.; Than, S.S.; Oo, T.H. Osmotic Dehydration of Toddy Fruit Cubes in Sugar Solution Using Response Surface Methodology. Am. J. Food Sci. Technol. 2019, 7, 175–181. [Google Scholar] [CrossRef]
  37. Dobladomaldonado, A.F.; Janssen, F.; Gomand, S.; Ketelaere, B.D.; Goderis, B.; Delcour, J.A. A response surface analysis of the aqueous leaching of amylose from maize starch. Food Hydrocoll. 2017, 63, 265–272. [Google Scholar] [CrossRef]
  38. Bezerra, M.A.; Santelli, R.E.; Oliveira, E.P.; Villar, L.S.; Escaleira, L.A. Response surface methodology (RSM) as a tool for optimization in analytical chemistry. Talanta 2008, 76, 965–977. [Google Scholar] [CrossRef]
Figure 1. The process of simulated liquid state fermentation of Chinese baijiu.
Fermentation 07 00085 g001
Figure 2. Effects of several factors on n-propanol production. (a), ratio of additional glucose to threonine; (b), temperature; (c), initial pH. Each parameter was tested at least in triplicate. Error bars represent the standard deviation of the mean. The optimum conditions were (a) 6:4; (b) 32 °C; and (c) pH 4.50.
Fermentation 07 00085 g002
Figure 3. Response surface (3D) and corresponding contour (2D) of n-propanol production affected by the interaction of two factors. (a,b) Effect of the interaction of glucose/threonine ratio and temperature on the n-propanol production. (c,d) Effect of the interaction of glucose/threonine ratio and pH on the n-propanol production. (e,f) Effect of the interaction of temperature and pH on the n-propanol production.
Fermentation 07 00085 g003
Table 1. The factor and level of Box–Behnken experiment for n-propanol.
VariablesSymbol CodedLevels
−101
Glucose/ThreonineA8:26:44:6
TemperatureB28 °C32 °C37 °C
Initial pHC4.004.505.00
Table 2. Results of response surface design.
NumberVariablesY N-Propanol Production (mg/L)
ABC
1−1−1071.99
21−10110.41
3−11073.99
4110104.58
5−10−188.49
610−1129.34
7−101103.30
8101133.19
90−1−1135.69
1001−193.14
110−11121.23
12011103.44
1300058.61
1400055.30
1500059.54
1600066.765
1700054.43
Table 3. ANOVA for the response surface quadratic model.
SourceSum of SquaresDf aMean SquaredF Valuep Value
Model12,352.0291372.4517.160.0006Significant
A-Glucose/Threonine2441.2612441.2630.520.0009**
B-Temperature514.721514.726.430.0389*
C-Initial pH26.28126.280.330.5844
AB15.33115.330.190.6748
AC30.03130.030.380.5594
BC153.261153.261.920.2088
A21045.7011045.7013.070.0086**
B21018.6711018.6712.740.0091**
C26368.7116368.7179.62<0.0001**
Residual559.93779.99
Lack of Fit464.643154.886.500.0511Not significant
Pure Error95.29423.82
Cor Total12,911.9516
R2 = 0.9566 b   Radj2 = 0.9009 c
Note: * was significant (p < 0.05); ** was extremely significant (p < 0.01); a, df, degree of freedom; b, R2, R-Squares; c, Radj2, Adj. R-Squared.
Publisher’s Note: MDPI stays neutral with regard to jurisdictional claims in published maps and institutional affiliations.

