Article

Growth Enhancement Facilitated by Gaseous CO2 through Heterologous Expression of Reductive Tricarboxylic Acid Cycle Genes in Escherichia coli

1
Department of Life Sciences, National Chung Hsing University, Taichung 402, Taiwan
2
Department of Food Science and Biotechnology, National Chung Hsing University, Taichung 402, Taiwan
3
Ph.D. Program in Microbial Genomics, National Chung Hsing University, Taichung 402, Taiwan
4
Ph.D. Program in Microbial Genomics, Academia Sinica, Taipei 115, Taiwan
5
Innovation and Development Center of Sustainable Agriculture, National Chung Hsing University, Taichung 402, Taiwan
6
Department of Electrical Engineering, National Tsing Hua University, Hsinchu 30013, Taiwan
7
Department of Chemical Engineering, National Chung Hsing University, Taichung 402, Taiwan
8
Graduate School of Science, Technology and Innovation, Kobe University, Kobe 657-8501, Japan
*
Author to whom correspondence should be addressed.
Submission received: 30 April 2021 / Revised: 11 June 2021 / Accepted: 15 June 2021 / Published: 18 June 2021
(This article belongs to the Special Issue Carboxylic Acid Production 2.0)

Abstract

:
The enzymatic mechanisms of carbon fixation by autotrophs, such as the reductive tricarboxylic acid cycle (rTCA), have inspired biotechnological approaches to producing bio-based chemicals directly through CO2. To explore the possibility of constructing an rTCA cycle in Escherichia coli and to investigate their potential for CO2 assimilation, a total of ten genes encoding the key rTCA cycle enzymes, including α-ketoglutarate:ferredoxin oxidoreductase, ATP-dependent citrate lyase, and fumarate reductase/succinate dehydrogenase, were cloned into E. coli. The transgenic E. coli strain exhibited enhanced growth and the ability to assimilate external inorganic carbon with a gaseous CO2 supply. Further experiments conducted in sugar-free medium containing hydrogen as the electron donor and dimethyl sulfoxide (DMSO) as the electron acceptor proved that the strain is able to undergo anaerobic respiration, using CO2 as the major carbon source. The transgenic stain demonstrated CO2-enhanced growth, whereas the genes involved in chemotaxis, flagellar assembly, and acid-resistance were upregulated under the anaerobic respiration. Furthermore, metabolomic analysis demonstrated that the total concentrations of ATP, ADP, and AMP in the transgenic strain were higher than those in the vector control strain and these results coincided with the enhanced growth. Our approach offers a novel strategy to engineer E. coli for assimilating external gaseous CO2.

1. Introduction

Global climate change as a consequence of anthropogenic carbon dioxide emissions has motivated approaches to reducing those emissions through the recycling of carbon dioxide directly into desirable metabolites or existing platform chemicals [1,2,3]. To achieve carbon neutrality through a biological route, the autotrophic life of microbes has enabled the development of engineered microbes and bioprocesses for carbon dioxide fixation and bio-based chemical production. Aside from engineering native autotrophic organisms, E. coli is the most widely used prokaryotic model for re-wiring metabolic pathways since it is known as the workhorse of modern biotechnology. Construction of an autotrophic metabolic pathway in E. coli has been recently achieved through chemostat-based directed evolution and the heterologous expression of ribulose-1,5-bisphosphate carboxylase/oxygenase, phosphoribulokinase, and formate dehydrogenase [4]. Biomass synthesis from CO2 was performed by means of a non-native Calvin–Benson–Bassham cycle and the energy source came from the catalysis of formate. To explore other routes for carbon fixation in E. coli, we focused on the rTCA cycle. The rTCA cycle is considered to be an ancient core metabolic process in the reducing environment of the early Earth that provided precursors of organic compounds for the synthesis of all major classes of biomolecules [5]. It is basically the reverse of the oxidative tricarboxylic acid cycle and leads to fixation of CO2 for autotrophic growth [6]. Among six known kinds of CO2 fixation pathways, the rTCA cycle is considered the most energy efficient [7]. Notably, both oxidative and reductive TCA cycles operate in these microorganisms under mixotrophic (heterotrophic and autotrophic at the same time) growth [8]. On the other hand, the oxidative TCA cycle mostly occurs among heterotrophic organisms, and the metabolic pathway has already been driven to replenish metabolites in the cycle through reactions known as anaplerotic reactions [9]. These characteristics give the machinery of the reductive TCA cycle great potential for carbon fixation in heterotrophic host cells.
To examine the possibility of utilizing the synthetic rTCA cycle machinery, genes for major rTCA cycle enzymes from the photoautotrophic green sulfur bacterium Chlorobaculum tepidum were cloned into E. coli to explore the potential for CO2 assimilation. Since several enzymatic reactions of the oxidative TCA cycle are reversible and used in the reductive TCA cycle, specific enzymes, such as α-ketoglutarate:ferredoxin oxidoreductase [6] and citrate lyase [10], are considered crucial in running the TCA cycle in the reverse direction (Figure 1a). In addition, fumarate reductase and succinate dehydrogenase are regulated to adapt to both autotrophic and mixotrophic conditions to moderate energy and metabolic balance [8]. Both of the gene clusters encoding fumarate reductase/succinate dehydrogenase were expressed during the autotrophic growth of C. tepidum strain TLS [8]. Therefore, α-ketoglutarate:ferredoxin oxidoreductase, ATP-dependent citrate lyase, and fumarate reductase/succinate dehydrogenase, encoded by ten genes, were simultaneously coexpressed within the E. coli host by a synthetic biological technique, the Ordered Gene Assembly in Bacillus subtilis [11] (OGAB) method. The resulting transgenic E. coli strain was characterized to confirm the expression of those heterologous genes and its ability to assimilate CO2. Transcriptomic and metabolomic analyses were employed to reveal the living dynamics of the transgenic strain.

2. Results

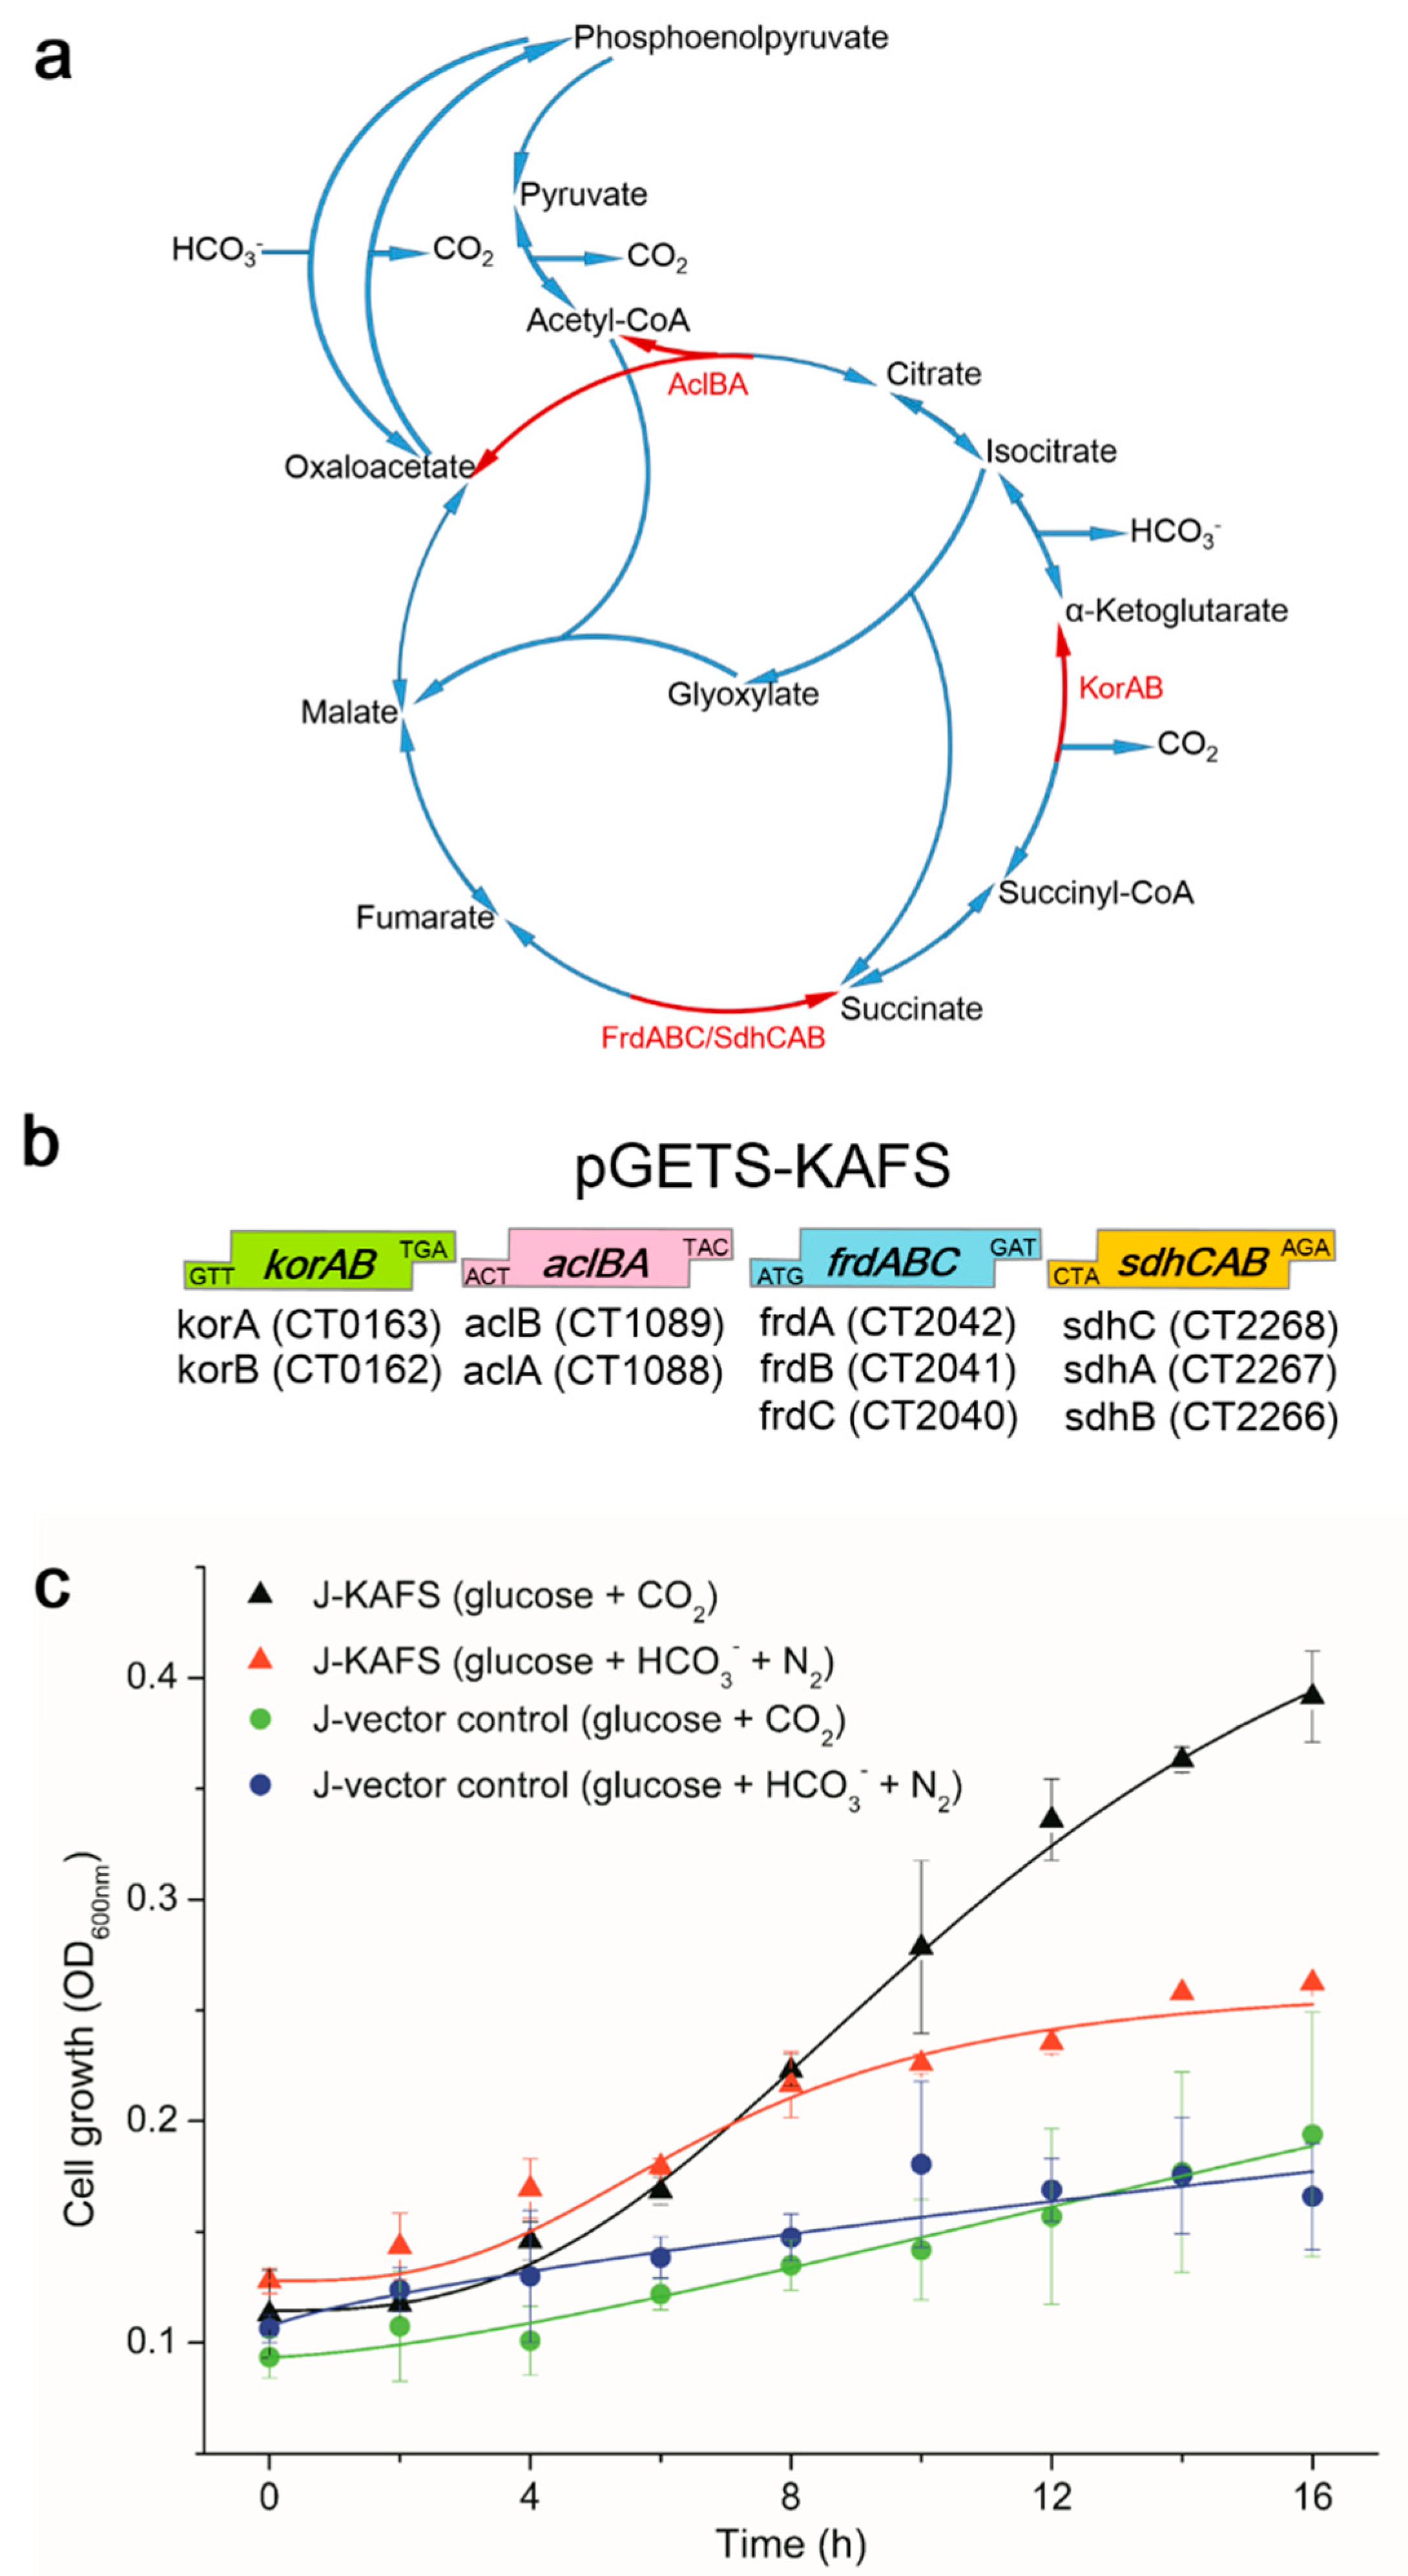
2.1. Genetic Cloning and Cell Growth

To construct an expression vector containing the genes korAB (CT0163 and CT0162 (GenBank), total 2.9 kb); aclAB (CT1088 and CT1089, total 3.1 kb); frdCBA; and sdhBAC (CT2040 to CT2042, total 3.6 kb and CT2266 to CT2268, total 3.4 kb), these genes were amplified from C. tepidum TLS cellular DNA as gene cassettes with designed OGAB primer pairs (Extended Data Table 1). Each cassette had been cloned and sequenced before the ligation reaction was conducted through OGAB method. The key to CO2 assimilation is the expression of korAB; therefore, the gene cassette was designed at the most strong transcriptional position in the constructed plasmids [12]. The designed DNA cassettes were cloned into plasmid pGETS118 to form pGETS-KAFS (K, α-ketoglutarate:ferredoxin oxidoreductase; A, ATP-dependent citrate lyase; F, fumarate reductase; S, succinate dehydrogenase) in B. subtilis, and then the plasmid was transformed into the regular E. coli cloning host strain JM109 via heat shock transformation (Figure 1b). As anaerobic environments are generally the natural niches for the rTCA cycle of autotrophic microorganisms [13], anaerobic metabolism was engaged to mimic the bioprocess.
Anaerobic cell growth, depending on the cloned enzymatic function, was examined after the addition of either gaseous CO2 or bicarbonate as an extra carbon source in addition to glucose. Since E. coli could not perform nitrogen fixation, gaseous N2 was added to create anaerobic conditions in the presence of bicarbonate. Gaseous CO2 or bicarbonate was used as an essential element for the synthesis of purine, pyrimidine and fatty acids in E. coli [14]. No difference was found between gaseous CO2 and bicarbonate in the growth curves of the control strain (Figure 1c). In contrast, the J-KAFS strain (the JM109 strain contained plasmid pGETS-KAFS) with gaseous CO2 showed better growth after 8 hours than the bicarbonate-supplemented medium (Figure 1c). The results suggested that J-KAFS could use gaseous CO2 directly through the expression of the cloned enzymes. On the other hand, resequencing of the pGETS-KAFS plasmid indicated that there was a single base deletion (the 717th nucleotide had an A-deleted mutation) of the korA open reading frame on the plasmid extracted from E. coli JM109, whereas korB was intact. However, as α-ketoglutarate:ferredoxin oxidoreductase was the only heterologous enzyme involved in CO2 assimilation in our construction, these results suggest that our α-ketoglutarate:ferredoxin oxidoreductase could still offer the function of assimilating external gaseous inorganic carbon (Figure 1c).

2.2. Transcriptome Analysis of Glucose Fermentation

To understand the mechanism by which heterologously expressed enzymes effect the metabolism of E. coli, the E. coli J-KAFS and J-vector control strains were cultured in minimal medium with 0.2% glucose and CO2 gas in rubber sealed tubes for 12 h, and then transcriptome analysis was performed as described in the Materials and Methods. The results shown in Table 2 confirmed that the transformed genes were expressed. On the other hand, only a few genes of E. coli presented differential expression between the J-KAFS and J-vector control strains (Table 2). The noticeable downregulation of pyrimidine synthesis genes suggests an increase in uracil synthesis in the J-KAFS strain (Table 2).

2.3. Carbon Balance of Transgenic Strains under Glucose Fermentation Conditions

To confirm CO2 assimilation by the E. coli strains, the carbon balances were calculated after glucose fermentation culturing (Table 3). The J-KAFS strain consumed more glucose and produced more biomass than the J-vector control strain. Noticeable CO2 absorption was observed for the J-KAFS strain (Table 3). On the other hand, the fermentation product per biomass indicated that the heterologously expressed rTCA genes helped E. coli synthesize biomass but not produce fermentation products (Table 3).

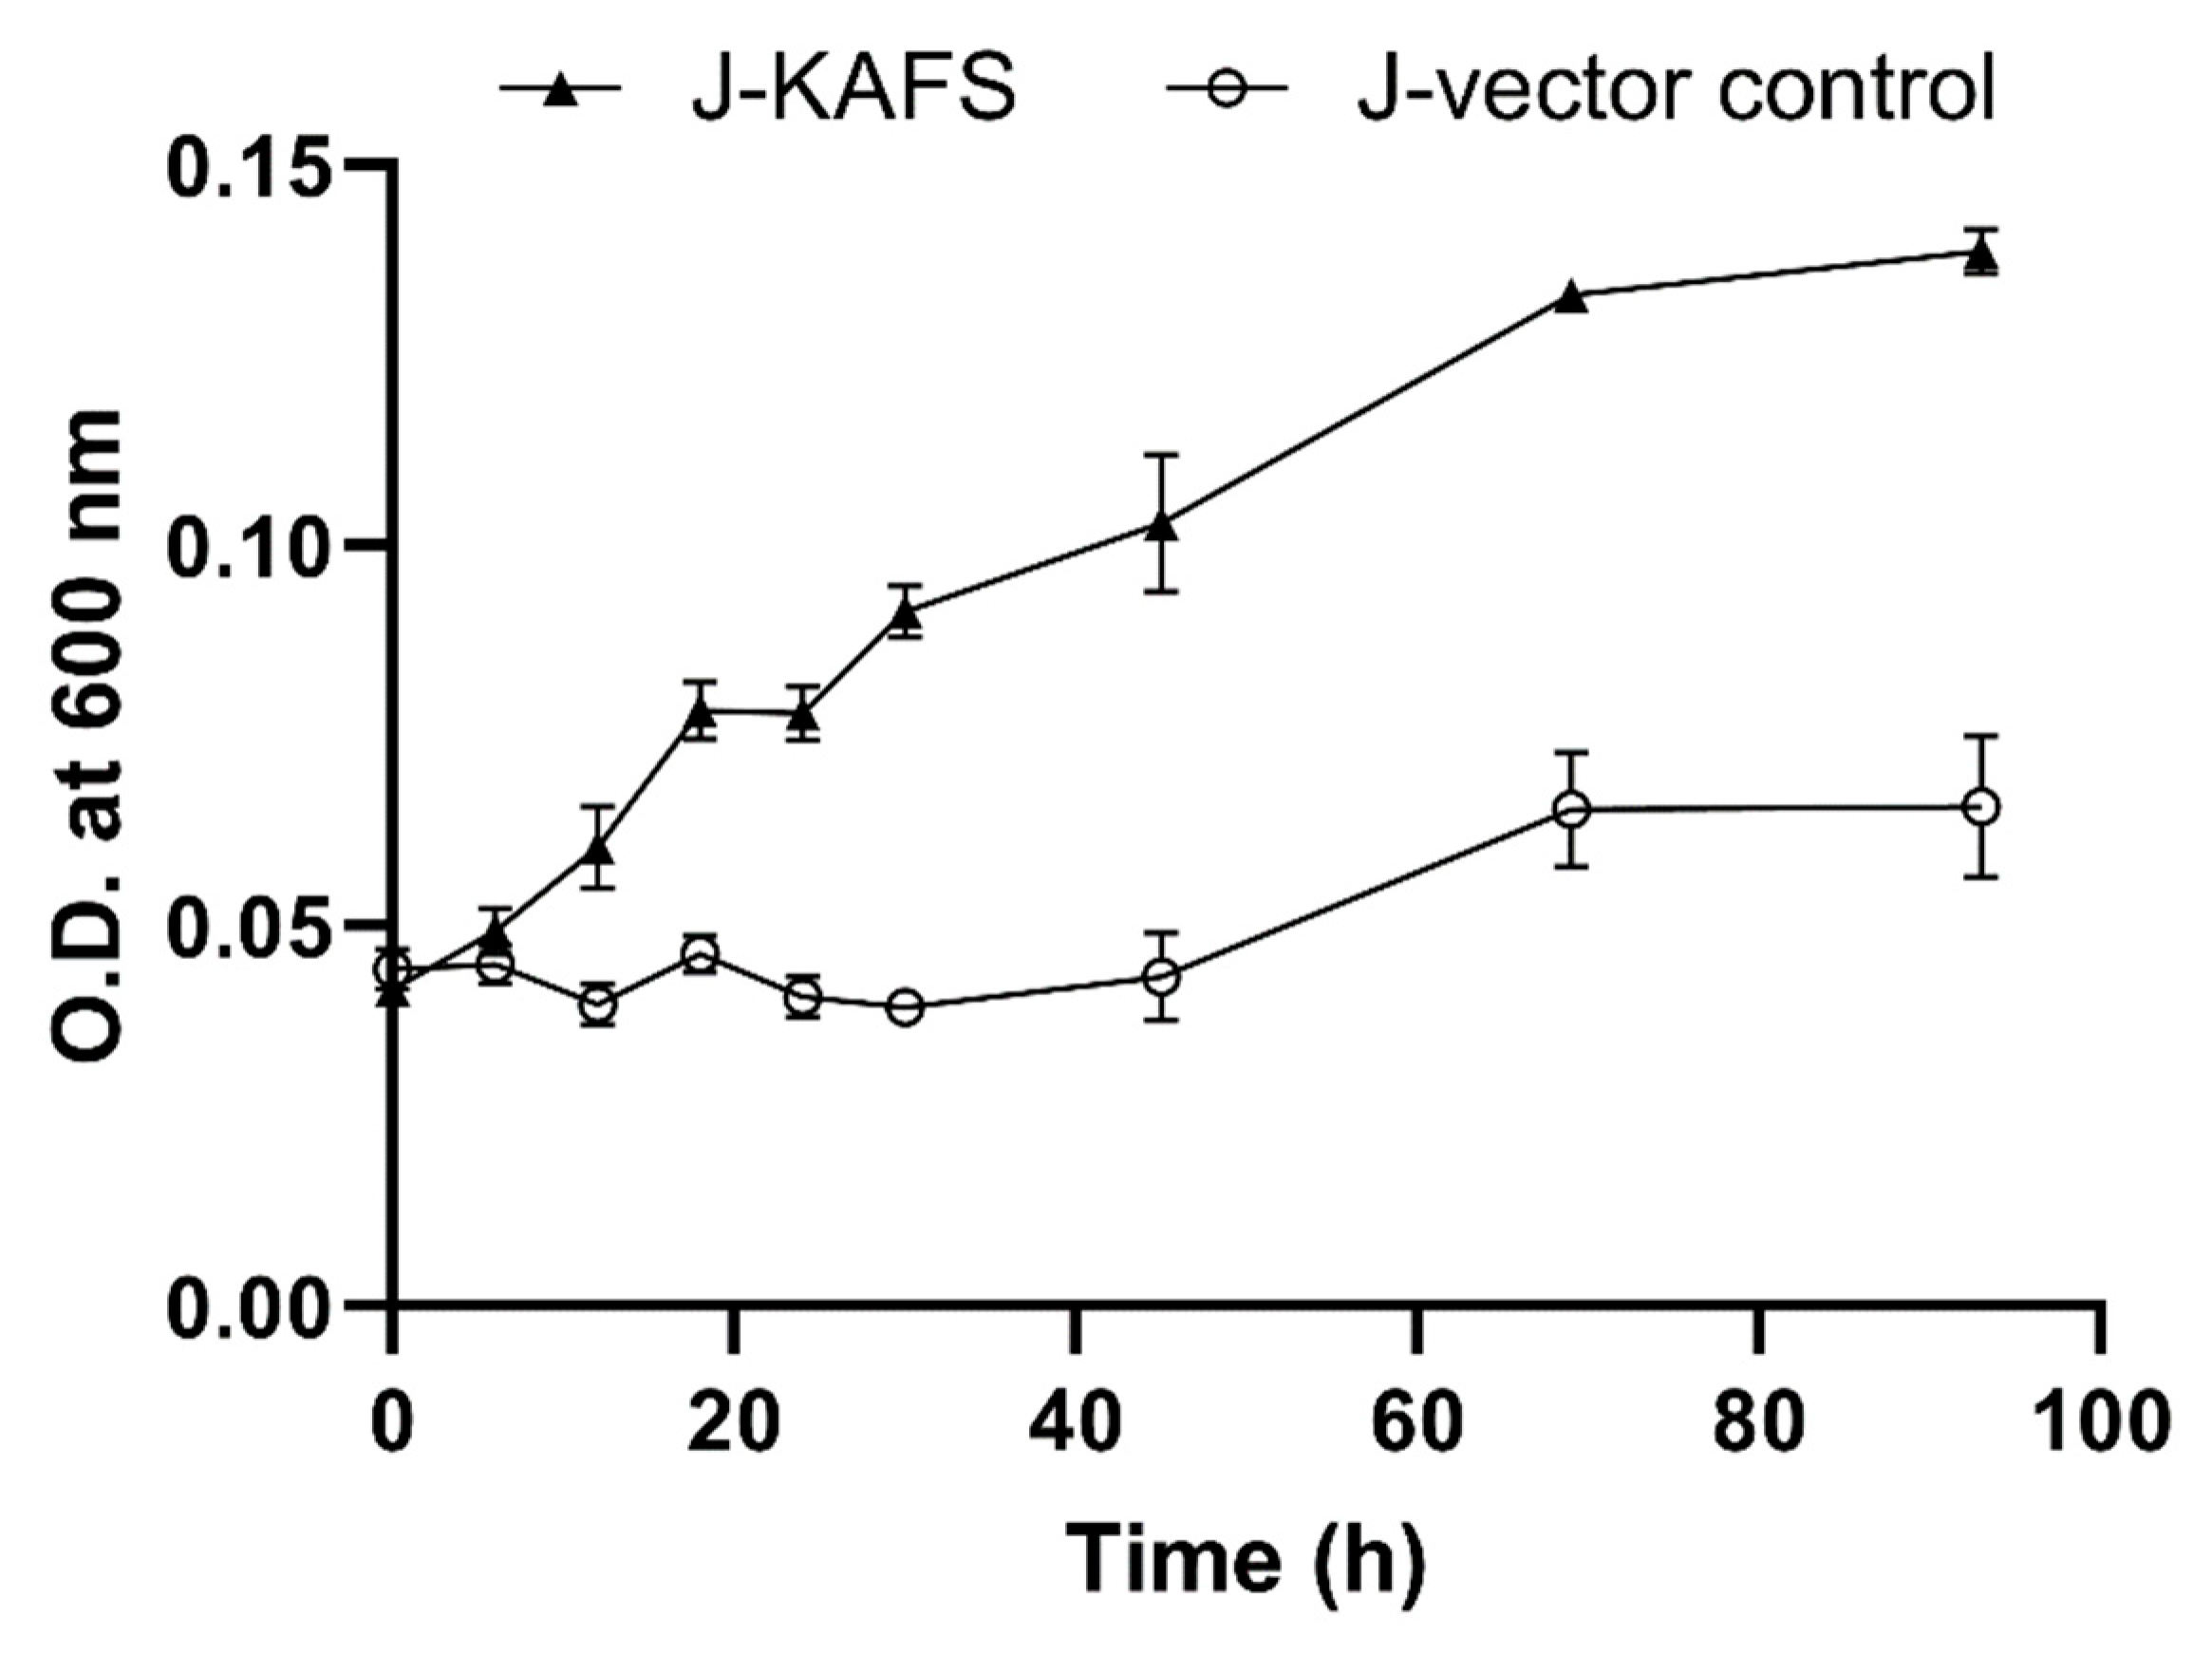
2.4. Growth of Transgenic Strains in Anaerobic Respiration Mode

To investigate the possibility of CO2 fixation with a hydrogen-powered method, glucose was removed from the culture medium and the energy supply was changed to anaerobic respiration mode. H2 was used as an inorganic electron source, and DMSO (dimethyl sulfoxide) was added as an electron acceptor in M9 minimal medium [15]. H2 and CO2 (at a 9:1 ratio) were added to the headspace of the culture bottles, whereas casein hydrolysate (1 g/L) and DMSO (0.5 g/L) were added to modified M9 minimal medium. Under the anaerobic respiration mode, strain J-KAFS showed more dominant growth as compared to the J-vector control strain (Figure 2). The anaerobic-respiration-dependent growth was carefully investigated by alternatingly removing either casein hydrolysate, CO2, H2, or DMSO (Supplementary Figure S1a–e). We discovered that all factors, including the heterologously expressed rTCA genes, hydrogen (as the electron donor), DMSO (as the electron acceptor), CO2, and casein hydrolysate are essential for the anaerobic-respiration-dependent growth of E. coli. It was noteworthy that without a supply with the combination of CO2, H2, and DMSO, casein hydrolysate alone failed to induce the growth of both strains (Supplementary Figure S1b,d,e). These results show that hydrogen-powered E. coli with the expression of rTCA genes could demonstrate enhanced growth with gaseous CO2.

2.5. Transcriptome Analysis of Transgenic Strains in Anaerobic Respiration Mode

Transcriptome analysis showed that some of the chemotaxis-related genes, flagellar assembly genes, and stress resistance genes were upregulated in the J-KAFS strain (Table 4). These results revealed the living dynamics and survival strategies under the anaerobic respiration and indicated that the J-KAFS strain was more viable than the control strain. Nonetheless, the transcription of several pyrimidine synthesis genes, such as carA, carB, and pyrB, was downregulated, as shown by transcriptome data from the glucose fermentation culture. The transcription of these three genes can be downregulated with uracil by transcriptional slippage [16]. This suggests that the J-KAFS strain synthesizes more pyrimidine than the J-vector control strain.

2.6. Metabolomics Analysis and Adenylate Concentrations of Transgenic Strains in Anaerobic Respiration Mode

Under anaerobic respiration culture conditions, numerous genes involved in chemotaxis, flagellar assembly, and acid resistance were notably upregulated (Table 4), which may result from the proton motive force and the adenylate energy charge. Since the amounts of other important metabolites might also be different between the J-KAFS and J-vector strains, they were cultured under anaerobic respiration conditions, and the metabolites were analyzed at different time points (Supplementary Table S2). Although the adenylate energy charges were similar in the E. coli J-KAFS and J-vector control strains, the total concentrations of ATP, ADP, and AMP in the J-KAFS strain were higher than those in the J-vector control (Table 5). In addition, the concentrations of pentose phosphate pathway metabolite ribose 5-phosphate, ribulose 5-phosphate, and sedoheptulose 7-phosphate were also increased in the J-KAFS strain compared to those in the J-vector control (Supplementary Table S2), which may serve as the precursors for purine synthesis. These results suggest that the E. coli J-KAFS strain produces more adenylate, which may promote cell growth.

2.7. Relative Carbonic Anhydrase Activities of Transgenic Strains

The transcriptome and metabolite results suggest that the E. coli J-KAFS strain had higher pyrimidine and adenylate concentrations than the E. coli J-vector control strain (Table 2, Table 4 and Table 5). E. coli J-KAFS grew to greater cell densities than the E. coli J-vector control strain under both glucose fermentation and anaerobic respiration modes (Figure 1 and Figure 2). Furthermore, the growth of the E. coli J-KAFS strain was enhanced with supplementation with CO2 gas (Figure 1). These results indicate that supplementation with CO2 increased the synthesis of pyrimidines and purines and further improved the growth of the E. coli J-KAFS strain. A similar phenomenon was reported: increased CO2 supplementation can enhance the growth of certain mutants limited by the synthesis of pyrimidines and purines [17]. Both pyrimidine and purine synthesis pathways require bicarbonate as a substrate, which can be acquired by CO2 dissolving into water or the conversion of CO2 into bicarbonate, being catalysed by carbonic anhydrase [14]. Therefore, the carbonic anhydrase activities of crude extract proteins from transgenic strains were measured (Supplementary Figure S2). However, the carbonic anhydrase activities of the E. coli crude extract were hard to determine. Nonetheless, the carbonic anhydrase activity of only the J-KAFS strain decreased after treatment with 2.5 mM acetazolamide (AZA, a carbonic anhydrase inhibitor) (Table 6). This result suggests that the J-KAFS strain presents more carbonic anhydrase activity than the J-vector control strain. To confirm the activity of every heterologously expressed enzyme, each protein will need to be purified.

3. Discussion

The enzymatic mechanisms of autotrophic organisms that convert CO2 into organic compounds have contributed to the global carbon cycle for billions of years. However, with anthropogenic activities, CO2 emissions have grown far beyond the assimilation of CO2 assimilation, leaving a large gap to fill in order to achieve carbon neutrality [18]. To find the balance between economic development and environmental protection, eco-friendly industrial processes have been investigated in recent decades. Gas fermentation is one of the industrial bioprocesses that could convert CO2 into organic compounds [3]. Other potential biotechnological approaches, such as constructing CO2-fixation pathways in microorganisms for the production of bio-based compounds, are also under development. Examples, including the expression of both ribulose-1,5-bisphosphate carboxylase/oxygenase (RuBisCO) and ribulose-5-phosphate kinase (PRK), which performs the CBB cycle in the E. coli host, could enhance in situ CO2 recycling [19]. Recently, with laboratory evolutions, inorganic CO2 assimilation into biomass in heterotrophic E. coli was achieved via the expression of RuBisCO, PRK, and formate dehydrogenase (with formate as an electron donor) [4]. The study opened the gate to changing the trophic mode of microbes.
In this study, four major rTCA cycle enzymes, including α-ketoglutarate:ferredoxin oxidoreductase, ATP-dependent citrate lyase, and fumarate reductase/succinate dehydrogenase from the photoautotrophic green sulfur bacterium Chlorobaculum tepidum were cloned into E. coli to explore their potential for CO2 assimilation. The transgenic E. coli strain was able to demonstrate largely enhanced growth with gaseous CO2 in either glucose fermentation or anaerobic respiration and showed the ability to assimilate external gaseous inorganic carbon directly through the expression of those genes. However, the construction of an intact set of C. tepidum α-ketoglutarate:ferredoxin oxidoreductase genes in E. coli failed. Unlike the case of Magnetococcus marinus, α-ketoglutarate:ferredoxin oxidoreductase can be expressed and purified as a holo-protein in E. coli [20]. We also sent requests to several biotechnology companies for the synthesis of the korAB genes of C. tepidum, and none of them were able to complete them without any mutations in korA. Based on the frameshift mutation sequence (717 deleted A) in korA, only the coenzyme A-binding domain remained in the KorA subunit, whereas the TPP-pyrimidine-binding domain of KorA could be truncated. It is still unknown whether the completely expressed KorA would inhibit the E. coli host cell or not. As a matter of fact, the expression of this korAB gene cassette could increase the growth of E. coli with gaseous CO2 supplementation under glucose fermentation and anaerobic respiration conditions (Figure 1c and Figure 2). The results suggest that either the truncated KorA with intact KorB or the intact KorB itself could function for CO2 assimilation.
In anaerobic respiration mode, we demonstrated that the hydrogen-powered E. coli J-KAFS with rTCA genes could perform gaseous-CO2-enhanced growth. However, J-KAFS could not synthesize all of its biomass through assimilation from inorganic CO2 only, as the growth of the J-KAFS strain in anaerobic respiration mode was eliminated when casein hydrolysate was removed from the medium (Supplementary Figure S1c). Due to the complicated composition of casein hydrolysate, it remains unknown which specific amino acid(s) from the hydrolysed proteins is required for the CO2-enhanced cell growth of the E. coli J-KAFS strain. Further metabolic and carbon flux analyses are warranted to reveal the connections between the specific components contained in casein hydrolysate and the CO2 assimilation pathway in the future.
The reduction of CO2 by α-ketoglutarate:ferredoxin oxidoreductase requires a specific reduced ferredoxin [20]. E. coli can produce reduced ferredoxin by ferredoxin (flavodoxin):NADP+ oxidoreductase [21] and pyruvate:ferredoxin oxidoreductase [22]. In this study, no C. tepidum ferredoxin was coexpressed in E. coli; therefore, it is not known whether native E. coli ferredoxin can be used as an electron donor by α-ketoglutarate:ferredoxin oxidoreductase. Despite the expected function of α-ketoglutarate:ferredoxin oxidoreductase, the transcriptomic and metabolomic analyses indicate that the synthesis of pyrimidines and adenylate was increased, respectively, in the E. coli J-KAFS strain (Table 2, Table 4, and Table 5). Although the adenylate concentration in the E. coli J-KAFS strain was higher than that in the E. coli J-vector control strain, there was no differential expression of purine synthesis genes in the transcriptome data (Table 4). This suggests that the increased adenylate concentration was not related to gene expression. This might be because there was more substrate for purine synthesis. Charles and Roberts [17] reported that increased CO2 levels can increase the synthesis of pyrimidines and purines in E. coli. The substrate that is required for both pyrimidine and purine syntheses is bicarbonate. Bicarbonate can be acquired from CO2 dissolving in water or the conversion of CO2 into bicarbonate being catalysed by carbonic anhydrase in E. coli [14]. Although we intended to measure the activity of carbonic anhydrase in E. coli crude-extract protein without the overexpression of specific genes, the determined WAU/mL was negligible (Supplementary Figure S2). However, treatment with the carbonic anhydrase inhibitor AZA further decreased carbonic anhydrase activity in the E. coli J-KAFS crude extract protein but not in the control (Table 6). These results suggest that the E. coli J-KAFS strain presents more carbonic anhydrase activity than the vector control strain. According to transcriptome data, obtained under glucose fermentation and anaerobic respiration culture conditions, none of the carbonic anhydrase genes were differentially expressed between E. coli J-KAFS and J-vector control strains (Table 2 and Table 4). Therefore, the reason for this difference should be based on the expression of heterologous genes. To investigate this mechanism further, protein purification and enzymatic analysis of each protein subunit need to be performed in the future.
The metabolite analysis of the E. coli J-KAFS strain under glucose fermentation conditions demonstrated a reduction in the CO2 release and an increase in biomass formation when compared with the E. coli J-vector control strain (Table 3). However, the fermentative organic acid productivity of the E. coli J-KAFS strain was lower than that of the E. coli J-vector control strain, except for pyruvate (Table 3). The increased biomass formation indicates that the synthesis of bacterial components such as fatty acids and proteins was improved. When using the pET system to produce proteins in E. coli, the addition of isopropyl β-D-1-thiogalactopyranoside (IPTG) was able to induce protein expression through binding with the LacI repressor and led to its dissociation from promoters [23]. In the E. coli J-KAFS strain, the expression of lacI was decreased compared with the vector control strain (Table 2). These results suggest that the E. coli J-KAFS strain may produce proteins with the pET system through a lower addition of IPTG and decreased CO2 emissions in the bioprocess. The application of this strain to the bioindustry still remains to be explored.

4. Conclusions

In this study, major rTCA cycle genes were simultaneously co-expressed within the E. coli host. The transgenic E. coli strain displayed greatly enhanced growth with gaseous CO2 and showed the ability to assimilate external gaseous inorganic carbon directly through the expression of those genes. The possibility of utilizing hydrogen as an electron donor was confirmed through anaerobic respiration with DMSO as the electron acceptor. Our results offer a novel strategy to engineer E. coli for the assimilation of external gaseous CO2.

5. Methods

5.1. DNA Manipulation

The α-ketoglutarate:ferredoxin oxidoreductase- and ATP-dependent citrate lyase-encoding gene clusters CT0162-CT0163 (GenBank) and CT0188-CT0189 were cloned. These genes were from the anaerobic phototrophic bacterium Chlorobaculum tepidum strain TLS (ATCC 49652/DSM 12025/NBRC 103806) genome (GenBank accession number: AE006470) [24] and were prepared as two cassettes for each kind of enzyme, according to the OGAB method, which has shown very high efficiency and fidelity [11,25]. Gene clusters CT2040–2242 and CT2266–2268, encoding fumarate reductase/succinate dehydrogenase, were prepared as two cassettes. A total of four cassettes encoding ten genes were cloned into the OGAB vector under the pR promoter to form an artificial operon [25]. The original promoter regions of each gene cluster were removed, whereas the ribosomal binding sites of each gene were retained. The cassettes and their genes were arranged in the following order—α-ketoglutarate:ferredoxin oxidoreductase (CT1063-CT1062), ATP-dependent citrate lyase (CT1089-CT1088), fumarate reductase/succinate dehydrogenase (CT2242-CT2041–CT2040 and CT2268-CT2267–CT2266), and all of the cloned nucleotide sequences on recombinant plasmids were confirmed by sequencing (Genomics, New Taipei City, Taiwan). The primers are listed in Supplementary Table S1.

5.2. Culture Conditions

All of the E. coli strains were cultured at 37 °C with shaking at 200 rpm. Precultures of E. coli strains were grown in Luria–Bertani broth for 12 h and then collected by means of centrifugation at 6000× g for 5 min. The supernatant was removed, and the pellet was washed with M9 minimal medium. This procedure was repeated 3 times. The bacteria were suspended at O.D.600nm = 5.0 in M9 minimal medium and inoculated (1%, v/v) into M9 medium with 0.2% glucose for culturing until growth to stationary phase to complete preculture. For anaerobic conditions, medium was prepared in an anaerobic chamber (Coy Laboratory Products, Grass Lk., MI, USA) and sealed with rubber and aluminium caps. The head-space gas was replaced with H2, N2, or CO2 by sparging. The working volume of the medium was 150 mL, and the headspace of the sealed bottle was approximately 100 mL. For the anaerobic glucose culture, the preculture E. coli strains were inoculated into M9 minimal medium with 0.2% glucose, 50 μg/mL thiamine, 2 mM MgSO4, and 0.1 mM CaCl2. CO2 was sparged into the headspace of a sealed bottle, and sodium bicarbonate was added at 20 mM to substitute for CO2 for some experimental conditions. For the anaerobic respiration culture, the preculture E. coli strains were inoculated into M9 minimal medium with 1 g/L casein hydrolysate, 5 g/L dimethyl sulfoxide (DMSO), 50 μg/mL thiamine, 2 mM MgSO4, 0.1 mM CaCl2, 0.01 mM NiCl2, and 0.01 mM FeCl2. The headspace of the bottle was filled with H2 and CO2 (90% H2, 10% CO2). The media were supplemented with 20 μg/mL chloramphenicol. Bacterial growth was determined by measuring the O.D.600nm optical density (GeneQuant 1300, GE Healthcare, Little Chalfont, Buckinghamshire, UK).

5.3. Enzyme Assays

The E. coli strains were first incubated in M9 medium supplied with 2 g/L glucose, 2 mM MgSO4, 0.1 mM CaCl2, 50 μg/mL thiamine, 20 μg/mL chloramphenicol, and 1 g/L casein hydrolysate under anaerobic conditions. To create anaerobic conditions, the headspace in a rubber sealed bottle was purged with H2 and CO2. Approximately 4 × 10⁹ bacterial cells were collected (from 150 mL medium) and sonicated in Tris buffer (100 mM Tris-HCl, pH 8.4, 3 mM dithioerythritol). The crude extracted proteins were collected from the supernatant by centrifugation (10,000× g). The total protein concentrations were determined with Bio-Rad Protein Assay Kits (Bio-Rad Laboratories, Hercules, CA, USA).

5.4. ATP-Dependent Citrate Lyase Activity Assays

The citrate lyase activity was measured using the method described by Kim and Tabita [26] with minor modifications. The assay was performed in a 1-mL volume containing 100 mM Tris-HCl, pH 8.4, 20 mM sodium citrate, 10 mM dithioerythritol, 10 mM MgCl2, 0.25 mM NADH, 0.44 mM coenzyme A, and 2.5 mM ATP. The optical density changes were measured at 365 nm (NADH, ε365 = 3.4 × 10³ M–1 cm–1) after the addition of sodium citrate solutions.

5.5. α-Ketoglutarate Oxidoreductase and Fumarate Reductase Activity Assays

These assays were performed in an anaerobic chamber (Coy Laboratory Products, Inc., Grass Lk., MI, USA) filled with 9% H2, 15% CO2, and 76% N2 gas at 35 °C, and all optical densities were measured with a GeneQuant 1300 (GE Healthcare, Little Chalfont, Buckinghamshire, UK). The α-ketoglutarate oxidoreductase and fumarate reductase activity assays were performed using a method described in a previous report with modifications [27]. The α-ketoglutarate oxidoreductase activity was determined by the reduction of succinyl-CoA (reduced methyl viologen:succinyl-CoA oxidoreductase). The assay was performed in a 1-mL volume, containing 100 mM Tris-HCl, pH 8.4, 4 mM dithioerythritol, 2 mM MgCl2, 4 mM methyl viologen, and 1 mM succinyl-CoA. The fumarate reductase (reduced methyl viologen:fumarate oxidoreductase) assay was performed in buffer, containing 100 mM Tris-HCl, pH 8.4, 4 mM methyl viologen, and 20 mM disodium fumarate. Dithionite was added from 5 mM stock solutions until the methyl viologen-containing assay solutions presented a faint blue color. The optical density changes were measured at 578 nm (methyl viologen, ε578 = 9.8 × 10³ M–1 cm–1) after adding succinyl-CoA or disodium fumarate solutions.

5.6. Carbonic Anhydrase Activity Assays

The carbonic anhydrase activity was measured using the Wilbur and Anderson method [28], modified as previously described [29]. The crude extract proteins were treated with or without 1 µL of acetazolamide (250 mM dissolved in DMSO)/0.1 mL for 15 min at room temperature before assays. The reaction mixture comprised 0.5 mL of ice-cold buffer containing 10 mM Tris-H3PO4 (pH 7.4), 0.1 mM phenol red, 100 mM Na2SO4, 0.1% Triton X-100, and 1 mM dithiothreitol with 0.1 mL of crude extract proteins. After adding 0.5 mL of ice-cold CO2-saturated water, the reduction in pH was followed spectrophotometrically by immediately measuring the O.D. at 558 nm every 0.1 seconds for 30 s with a UV-Vis spectrophotometer (V-630, JASCO) at 10 °C. Carbonic anhydrase activity was calculated using Wilbur–Anderson units (WAU)/mL sample. The definition for WAU is (T0−T)/T, in which T0 and T are the times required for the O.D. at 558 nm to drop from 0.5 to 0.3, without and with crude extract proteins, respectively.

5.7. Metabolite Analysis

The concentrations of glucose and extracellular pyruvate, lactate, formate, acetate, ethanol, and succinate were determined by means of a Thermo Scientific Dionex Ultimate 3000 LC system, equipped with an HPLC column HyperREZ XP Carbohydrate H+ (particle size 8 μm, 300 mm × 7.7 mm, Thermo Scientific, Waltham, MA, USA) and a refractive index (RI) detector. The mobile phase was 5 mM H2SO4, and the flow rate was 0.6 mL/min. The column temperature was at 45 °C. The injection volume was 10 μL for each analysis.
The total amount of CO2 was calculated as previously reported [30] by including gaseous CO2, dissolved CO2, and hydrated CO2. Briefly, the gaseous CO2 in the headspace of culture bottles was measured using an IR-based diffusive spectrometer (Sentry ST303, New Taipei City, Taiwan) [31]. The dissolved CO2 and hydrated CO2 were calculated based on the equilibrium constants (the pH values are presented in Supplementary Table S3), as previously reported [32].
To determine the metabolites inside anaerobic respiration-cultured E. coli, a capillary electrophoresis time-of-flight mass spectrometry-based metabolomics technique was applied and performed by Human Metabolome Technologies America (Boston, MA, USA). The E. coli strains were precultured as described above until the bacterial cells reached O.D.600nm = 0.2 in 450 mL of medium from three culture bottles. Then, the cells were collected and suspended in medium for anaerobic respiration conditions. The cells were collected, and the metabolites were extracted as described in a previous report [33] at 1, 6, and 24 h.

5.8. Transcriptome Analysis

Total RNA was isolated from E. coli strains that were incubated for 24 h (without glucose) for reverse transcription and DNA sequencing (Illumina), which was performed by Welgene Biotech Co., Ltd. (Taipei, Taiwan). Total RNA was extracted using Isol-RNA Lysis Reagent (5 PRIME, Hamburg, Germany) according to the manufacturer’s instructions. The procedure was the same as that in our previous report [34]. The Cuffdiff tool from the Cufflinks package [35] was used to calculate differential gene expression between the J-KAFS and vector control strains.

Supplementary Materials

The following are available online at https://0-www-mdpi-com.brum.beds.ac.uk/article/10.3390/fermentation7020098/s1. Figure S1: Transgenic E. coli strains require CO2 to grow under anaerobic conditions, Figure S2: Measurement of carbonic anhydrase activity of crude cell extract proteins from J-vector control and J-KAFS strains, Table S1: Primers used to construct the pGETS plasmid, Table S2: Carbon-containing metabolites in the E. coli JM109 vector control strain and J-KAFS strain in culture with casein hydrolysate with H2, CO2 and DMSO, Table S3: The pH values of the culture medium under glucose fermentation conditions.

Author Contributions

S.-C.L. and J.-H.P. performed the experiments, analyzed the data, and prepared the manuscript. E.-P.I.C., and C.-C.H. analyzed the data and prepared the manuscript. Y.-T.Y., S.-Y.L., T.-T.S., and K.T. analyzed data. S.-Y.T., D.-Y.W., C.-H.Y., and C.-H.H. performed experiments. All authors have read and agreed to the published version of the manuscript.

Funding

We acknowledge funding from the Ministry of Science and Technology grants MOST 104-2621-M-005-003-MY3, 106-2221-E-005-007-MY3, 107-2621-M-005-007-MY3, 107-2621-M-005-001, 107-2621-M-005-008-MY3, 107-2320-B-005-003-MY3, 105-2221-E-007-130-MY3, and MOST 107-2621-M-007-001-MY3 and funding in part by the TVGH-NCHU Research Cooperation Project TVGH-NCHU and 1077602. This work was also supported in part by the Ministry of Education, Taiwan, under the Higher Education Sprout Project.

Institutional Review Board Statement

Not applicable.

Informed Consent Statement

Not applicable.

Data Availability Statement

Data available in a publicly accessible repository. The data presented in this study are openly available in the NCBI Sequence Read Archive (http://0-www-ncbi-nlm-nih-gov.brum.beds.ac.uk/sra/, accessed on 17 June 2021) repository at accession number SRP158742.

Conflicts of Interest

Patent applications have been filed relating to the work in this manuscript.

References

  1. Oliver, N.J.; Rabinovitch-Deere, C.A.; Carroll, A.L.; Nozzi, N.E.; Case, A.E.; Atsumi, S. Cyanobacterial metabolic engineering for biofuel and chemical production. Curr. Opin. Chem. Biol. 2016, 35, 43–50. [Google Scholar] [CrossRef] [Green Version]
  2. Heijstra, B.D.; Leang, C.; Juminaga, A. Gas fermentation: Cellular engineering possibilities and scale up. Microb. Cell Factories 2017, 16, 60. [Google Scholar] [CrossRef] [Green Version]
  3. Liew, F.; Martin, M.E.; Tappel, R.C.; Heijstra, B.D.; Mihalcea, C.; Köpke, M. Gas fermentation—A flexible platform for commercial scale production of low-carbon-fuels and chemicals from waste and renewable feedstocks. Front. Microbiol. 2016, 7, 694. [Google Scholar] [CrossRef]
  4. Gleizer, S.; Ben-Nissan, R.; Bar-On, Y.M.; Antonovsky, N.; Noor, E.; Zohar, Y.; Jona, G.; Krieger, E.; Shamshoum, M.; Bar-Even, A.; et al. Conversion of Escherichia coli to generate all biomass carbon from CO2. Cell 2019, 179, 1255–1263.e1212. [Google Scholar] [CrossRef] [PubMed] [Green Version]
  5. Smith, E.; Morowitz, H.J. Universality in intermediary metabolism. Proc. Natl. Acad. Sci. USA 2004, 101, 13168–13173. [Google Scholar] [CrossRef] [PubMed] [Green Version]
  6. Evans, M.C.; Buchanan, B.B.; Arnon, D.I. A new ferredoxin-dependent carbon reduction cycle in a photosynthetic bacterium. Proc. Natl. Acad. Sci. USA 1966, 55, 928–934. [Google Scholar] [CrossRef] [Green Version]
  7. Erb, T.J. Carboxylases in natural and synthetic microbial pathways. Appl. Environ. Microbiol. 2011, 77, 8466–8477. [Google Scholar] [CrossRef] [Green Version]
  8. Tang, K.-H.; Blankenship, R.E. Both forward and reverse TCA cycles operate in green sulfur bacteria. J. Biol. Chem. 2010, 285, 35848–35854. [Google Scholar] [CrossRef] [Green Version]
  9. Owen, O.E.; Kalhan, S.C.; Hanson, R.W. The key role of anaplerosis and cataplerosis for citric acid cycle function. J. Biol. Chem. 2002, 277, 30409–30412. [Google Scholar] [CrossRef] [PubMed] [Green Version]
  10. Nunoura, T.; Chikaraishi, Y.; Izaki, R.; Suwa, T.; Sato, T.; Harada, T.; Mori, K.; Kato, Y.; Miyazaki, M.; Shimamura, S.; et al. A primordial and reversible TCA cycle in a facultatively chemolithoautotrophic thermophile. Science 2018, 359, 559–563. [Google Scholar] [CrossRef] [PubMed] [Green Version]
  11. Tsuge, K.; Matsui, K.; Itaya, M. One step assembly of multiple DNA fragments with a designed order and orientation in Bacillus subtilis plasmid. Nucleic Acids Res. 2003, 31, e133. [Google Scholar] [CrossRef] [PubMed] [Green Version]
  12. Nishizaki, T.; Tsuge, K.; Itaya, M.; Doi, N.; Yanagawa, H. Metabolic engineering of carotenoid biosynthesis in Escherichia coli by ordered gene assembly in Bacillus subtilis. Appl. Env. Microbiol. 2007, 73, 1355–1361. [Google Scholar] [CrossRef] [Green Version]
  13. Buchanan, B.B.; Evans, M.C. The synthesis of alpha-ketoglutarate from succinate and carbon dioxide by a subcellular preparation of a photosynthetic bacterium. Proc. Natl. Acad. Sci. USA 1965, 54, 1212–1218. [Google Scholar] [CrossRef] [PubMed] [Green Version]
  14. Merlin, C.; Masters, M.; McAteer, S.; Coulson, A. Why is carbonic anhydrase essential to Escherichia coli? J. Bacteriol. 2003, 185, 6415–6424. [Google Scholar] [CrossRef] [PubMed] [Green Version]
  15. Bilous, P.T.; Weiner, J.H. Dimethyl sulfoxide reductase activity by anaerobically grown Escherichia coli HB101. J. Bacteriol. 1985, 162, 1151–1155. [Google Scholar] [CrossRef] [PubMed] [Green Version]
  16. Charlier, D.; Nguyen Le Minh, P.; Roovers, M. Regulation of carbamoylphosphate synthesis in Escherichia coli: An amazing metabolite at the crossroad of arginine and pyrimidine biosynthesis. Amino Acids 2018, 50, 1647–1661. [Google Scholar] [CrossRef] [Green Version]
  17. Charles, H.P.; Roberts, G.A. Carbon dioxide as a growth factor for mutants of Escherichia coli. Microbiology 1968, 51, 211–224. [Google Scholar] [CrossRef] [Green Version]
  18. Dusenge, M.E.; Duarte, A.G.; Way, D.A. Plant carbon metabolism and climate change: Elevated CO2 and temperature impacts on photosynthesis, photorespiration and respiration. New Phytol. 2019, 221, 32–49. [Google Scholar] [CrossRef] [Green Version]
  19. Yang, C.H.; Liu, E.J.; Chen, Y.L.; Ou-Yang, F.Y.; Li, S.Y. The comprehensive profile of fermentation products during in situ CO2 recycling by Rubisco-based engineered Escherichia coli. Microb. Cell Fact. 2016, 15, 133. [Google Scholar] [CrossRef] [Green Version]
  20. Chen, P.Y.-T.; Li, B.; Drennan, C.L.; Elliott, S.J. A reverse TCA cycle 2-oxoacid:ferredoxin oxidoreductase that makes C-C bonds from CO2. Joule 2019, 3, 595–611. [Google Scholar] [CrossRef] [Green Version]
  21. Wan, J.T.; Jarrett, J.T. Electron acceptor specificity of ferredoxin (flavodoxin):NADP+ oxidoreductase from Escherichia coli. Arch. Biochem. Biophys. 2002, 406, 116–126. [Google Scholar] [CrossRef]
  22. Blaschkowski, H.P.; Knappe, J.; Ludwig-Festl, M.; Neuer, G. Routes of flavodoxin and ferredoxin reduction in Escherichia coli. Eur. J. Biochem. 1982, 123, 563–569. [Google Scholar] [CrossRef] [PubMed]
  23. Mierendorf, R.C.; Morris, B.B.; Hammer, B.; Novy, R.E. Expression and purification of recombinant proteins using the pet system. Methods Mol. Med. 1998, 13, 257–292. [Google Scholar] [CrossRef]
  24. Eisen, J.A.; Nelson, K.E.; Paulsen, I.T.; Heidelberg, J.F.; Wu, M.; Dodson, R.J.; Deboy, R.; Gwinn, M.L.; Nelson, W.C.; Haft, D.H.; et al. The complete genome sequence of Chlorobium tepidum TLS, a photosynthetic, anaerobic, green-sulfur bacterium. Proc. Natl. Acad. Sci. USA 2002, 99, 9509–9514. [Google Scholar] [CrossRef] [PubMed] [Green Version]
  25. Tsuge, K.; Sato, Y.; Kobayashi, Y.; Gondo, M.; Hasebe, M.; Togashi, T.; Tomita, M.; Itaya, M. Method of preparing an equimolar DNA mixture for one-step DNA assembly of over 50 fragments. Sci. Rep. 2015, 5, 10655. [Google Scholar] [CrossRef] [PubMed] [Green Version]
  26. Kim, W.; Tabita, F.R. Both subunits of ATP-citrate lyase from Chlorobium tepidum contribute to catalytic activity. J. Bacteriol. 2006, 188, 6544–6552. [Google Scholar] [CrossRef] [PubMed] [Green Version]
  27. Sawers, R.G.; Ballantine, S.P.; Boxer, D.H. Differential expression of hydrogenase isoenzymes in Escherichia coli K-12: Evidence for a third isoenzyme. J. Bacteriol. 1985, 164, 1324–1331. [Google Scholar] [CrossRef] [Green Version]
  28. Wilbur, K.M.; Anderson, N.G. Electrometric and colorimetric determination of carbonic anhydrase. J. Biol. Chem. 1948, 176, 147–154. [Google Scholar] [CrossRef]
  29. Jensen, E.L.; Clement, R.; Kosta, A.; Maberly, S.C.; Gontero, B. A new widespread subclass of carbonic anhydrase in marine phytoplankton. Isme J. 2019, 13, 2094–2106. [Google Scholar] [CrossRef] [Green Version]
  30. Pang, J.-J.; Shin, J.-S.; Li, S.-Y. The catalytic role of RuBisCO for in situ CO2 recycling in Escherichia coli. Front. Bioeng. Biotechnol. 2020, 8. [Google Scholar] [CrossRef]
  31. Li, Y.H.; Ou-Yang, F.Y.; Yang, C.H.; Li, S.Y. The coupling of glycolysis and the Rubisco-based pathway through the non-oxidative pentose phosphate pathway to achieve low carbon dioxide emission fermentation. Bioresour. Technol. 2015, 187, 189–197. [Google Scholar] [CrossRef] [PubMed]
  32. Zhuang, Z.Y.; Li, S.Y. Rubisco-based engineered Escherichia coli for in situ carbon dioxide recycling. Bioresour. Technol. 2013, 150, 79–88. [Google Scholar] [CrossRef] [PubMed]
  33. Ohashi, Y.; Hirayama, A.; Ishikawa, T.; Nakamura, S.; Shimizu, K.; Ueno, Y.; Tomita, M.; Soga, T. Depiction of metabolome changes in histidine-starved Escherichia coli by CE-TOFMS. Mol. Biosyst. 2008, 4, 135–147. [Google Scholar] [CrossRef] [PubMed]
  34. Chin, W.C.; Lin, K.H.; Liu, C.C.; Tsuge, K.; Huang, C.C. Improved n-butanol production via co-expression of membrane-targeted tilapia metallothionein and the clostridial metabolic pathway in Escherichia coli. BMC Biotechnol. 2017, 17, 36. [Google Scholar] [CrossRef] [PubMed] [Green Version]
  35. Trapnell, C.; Williams, B.A.; Pertea, G.; Mortazavi, A.; Kwan, G.; van Baren, M.J.; Salzberg, S.L.; Wold, B.J.; Pachter, L. Transcript Assembly and Quantification by RNA-Seq Reveals Unannotated Transcripts and Isoform Switching during Cell Differentiation. Nat. Biotechnol. 2010, 28, 511. Available online: https://0-www-nature-com.brum.beds.ac.uk/articles/nbt.1621#supplementary-information (accessed on 16 June 2021). [CrossRef] [PubMed] [Green Version]
Figure 1. Designed genetic pathway and growth of transgenic E. coli strains with different inorganic carbon sources. (a) Pathway map of CO2 assimilation enzymes related to this study. The heterologously expressed enzymes are marked in red. AclBA, ATP-dependent citrate lyase; KorAB, α-ketoglutarate:ferredoxin oxidoreductase; FrdABC/SdhCAB, fumarate reductase. Blue arrows represent TCA cycle activities contributed by E. coli genes; arrowheads indicate oxidative (clockwise) or reductive (counter-clockwise) activities; blue/red activity lines are oxidative direction only for E. coli enzymes or reversible for cloned C. tepidum enzymes. (b) DNA cassettes used to construct the expression plasmid pGETS-KAFS, which encodes the korAB, aclBA, frdABC, and sdhCAB genes from C. tepidum. (c) Anaerobic growth curves of transgenic E. coli strains with CO2 or bicarbonate present in glucose culture medium. Data are expressed as the means ± standard deviations, n = 3 independent biological samples.
Fermentation 07 00098 g001
Figure 2. Growth curves of E. coli J-KAFS and J-vector control strains under anaerobic respiration conditions. Data are expressed as the means ± standard deviations, n = 3 independent biological samples.
Fermentation 07 00098 g002
Table 1. The enzymatic activities of ATP-dependent citrate lyase, α-ketoglutarate oxidoreductase, and fumarate reductase.
Enzyme Activity (nmol/min/mg Protein)
StrainATP-Dependent Citrate Lyase aα-Ketoglutarate OxidoreductaseFumarate Reductase
J-KAFS b82 ± 56.5 ± 0.6142 ± 11
J-vector control c14 ± 3<0.0130 ± 2
a Citrate lyase activities were also detected using this method. b The J-KAFS strain name represents the E. coli JM109 strain, containing the plasmid pGETS-KAFS, with α-ketoglutarate:ferredoxin oxidoreductase, ATP-dependent citrate lyase, and fumarate reductase genes. c The J-vector control strain name represents the E. coli JM109 strain with the control plasmid pGETS118.
Table 2. Differential gene expression of E. coli J-KAFS and J-vector control strains incubated with glucose and CO2 gas for 12 h.
Gene NameDescriptionLog2 Ratio
(J-KAFS/J-Vector Control) a,b
Heterologous expression (Chlorobaculum tepidum genes cloned into Escherichia coli)
aclA (CT1088)ATP-citrate lyase α subunit22.2
aclB (CT1089)ATP-citrate lyase β subunit23.8
frdC (CT2040)succinate dehydrogenase/fumarate reductase, cytochrome b subunit21.6
frdB (CT2041)succinate dehydrogenase/fumarate reductase, iron-sulfur subunit22
frdA (CT2042)succinate dehydrogenase/fumarate reductase, flavoprotein subunit21.6
korB (CT0162)2-oxoglutarate ferredoxin oxidoreductase subunit β25.1
korA (CT0163)α-oxoglutarate ferredoxin oxidoreductase subunit α17.1
sdhB (CT2266)succinate dehydrogenase/fumarate reductase iron-sulfur subunit16.6
sdhA (CT2267)succinate dehydrogenase/fumarate reductase, flavoprotein subunit17.9
sdhC (CT2268)succinate dehydrogenase/fumarate reductase, cytochrome b subunit20.2
E. coli genes
Pyrimidine synthesis
carAcarbamoyl-phosphate synthase small subunit−2.7
carBcarbamoyl-phosphate synthase large chain−2.6
pyrIaspartate carbamoyltransferase regulatory subunit−3.4
pyrBaspartate carbamoyltransferase catalytic subunit−3.8
uppuracil phosphoribosyltransferase−2.4
ybbYuracil/xanthine transporter−3.1
Others
lacIlac repressor−4.9
yhdVlipoprotein−1.8
bfdbacterioferritin-associated ferredoxin−2.0
ygaVtranscriptional regulator−2.1
yjjZDUF1435 domain-containing protein−2.2
proUtRNA-Pro(UGG)−24.2
a Differential gene expression was analysed with Student’s t-test and the false discovery rate, and both p-values < 0.05 are shown. b The transcription levels of heterologously expressed genes in the control strain were set as 0.001.
Table 3. The carbon balance of transgenic E. coli strains.
StrainJ-Vector ControlJ-KAFS
CarbonAmount (mmol/L)
Consumed carbon a31.1451.91
Consumed glucose b5.18 ± 0.548.65 ± 0.51
Produced carbon c25.6847.3
Biomass carbon1.182.89
CO2 release d0.70 ± 0.26−1.08 ± 0.56
Fermentation product carbon23.7945.49
Pyruvate0.04 ± 0.010.31 ± 0.07
Lactate0.8 ± 0.031.88 ± 0.36
Formate7.59 ± 0.9113.88 ± 0.73
Acetate3.52 ± 0.585.49 ± 0.53
Ethanol3.28 ± 0.316.99 ± 0.75
Succinate0.02 ± 0.020.02 ± 0.27
Fermentation product per biomass carbon20.1515.74
Biomass formation percentage e3.7%5.5%
Carbon balance f82.46%91.11%
a The consumed carbon was calculated by multiplying the molar amount of consumed glucose by six. b The glucose concentrations in the culture supernatants at 0 h and 24 h of cultivation were determined using the dinitrosalicylic acid (DNS) method. The consumed glucose was the difference between the two glucose concentrations. c The produced carbon was the sum of the molar amounts of carbon in biomass and CO2. The mass of carbon in biomass was calculated by multiplying the biomass mass by 0.48, which is the experimentally determined percentage of carbon in dry E. coli cells (Bratbak G, Dundas I: Bacterial dry matter content and biomass estimations. Applied and Environmental Microbiology, 1984, 48:755-757). d The total CO2 changes in the batch were calculated to determine the CO2 release. e The biomass formation percentage was calculated by dividing the amount of biomass carbon by the amount of consumed carbon. f The carbon balance was calculated by dividing the amount of produced carbon by the amount of consumed carbon.
Table 4. Differential gene expression between J-KAFS and J-vector control strains under anaerobic respiration culture conditions.
Gene NameDescriptionExpression log2 Ratio
(GenBank CDS Number)(J-KAFS/Vector Control) a,b
Heterologous expression (Chlorobaculum tepidum genes cloned into Escherichia coli)
aclA (CT1088)ATP-citrate lyase α subunit19.1
aclB (CT1089)ATP-citrate lyase β subunit21
frdC (CT2040)Succinate dehydrogenase/fumarate reductase, cytochrome b subunit18.8
frdB (CT2041)Succinate dehydrogenase/fumarate reductase, iron-sulfur subunit19
frdA (CT2042)Succinate dehydrogenase/fumarate reductase, flavoprotein subunit18.5
korB (CT0162)2-Oxoglutarate ferredoxin oxidoreductase subunit β23
korA (CT0163)α-oxoglutarate ferredoxin oxidoreductase subunit α26.4
sdhB (CT2266)Succinate dehydrogenase/fumarate reductase iron-sulfur subunit24.3
sdhA (CT2267)Succinate dehydrogenase/fumarate reductase, flavoprotein subunit19
sdhC (CT2268)Succinate dehydrogenase/fumarate reductase, cytochrome b subunit18.3
E. coli genes
Chemotaxis
aerFused signal transducer for aerotaxis sensory component and methyl-accepting chemotaxis component2.5
cheAFused chemotactic sensory histidine kinase (soluble) in two-component regulatory system with CheB and CheY3.2
cheBFused chemotaxis regulator and protein-glutamate methylesterase in two-component regulatory system with CheA2.5
cheRChemotaxis regulator2.6
cheWPurine-binding chemotaxis protein3.1
cheYChemotaxis regulator transmitting signal to flagellar motor component2.6
tapMethyl-accepting protein IV3.3
tarMethyl-accepting chemotaxis protein II3.3
trgMethyl-accepting chemotaxis protein III, ribose and galactose sensor receptor2.7
tsrMethyl-accepting chemotaxis protein I, serine sensor receptor2.3
Flagellar assembly
flgKFlagellar hook-filament junction protein 13.1
flgLFlagellar hook-filament junction protein2.7
flgMAnti-sigma factor for FliA (sigma 28)3
flgNExport chaperone for FlgK and FlgL2.6
fliARNA polymerase, sigma 28 (sigma F) factor2.7
fliCFlagellar filament structural protein3.3
fliDFlagellar filament capping protein3.2
fliSFlagellar protein potentiates polymerization3
fliTPredicted chaperone2.9
fliZPredicted regulator of FliA activity2.5
flxAHypothetical protein2.8
motAProton conductor component of flagella motor3.3
motBProtein that enables flagellar motor rotation3.4
ycgRProtein involved in flagellar function3.1
yhjHEAL domain-containing protein involved in flagellar function3.5
Pyrimidine synthesis
carACarbamoyl-phosphate synthetase small subunit, glutamine amidotransferase−2.2
carBCarbamoyl-phosphate synthase large subunit−2
pyrBAspartate carbamoyltransferase, catalytic subunit−2.6
Stress resistance
gadAGlutamate decarboxylase A, PLP-dependent2.9
gadBGlutamate decarboxylase B, PLP-dependent3
gadCPredicted glutamate:gamma-aminobutyric acid antiporter2.6
hdeAStress response protein acid-resistance protein3.6
hdeBAcid-resistance protein3.9
hdeDAcid-resistance membrane protein3.2
yjbJPredicted stress response protein2.2
a Differential gene expression with a false discovery rate q < 0.05 is shown. b The transcription levels of heterologously expressed genes in the control strain were set as 0.001.
Table 5. Concentrations of ATP, ADP, and AMP in the E. coli J-vector control strain and J-KAFS strain under anaerobic respiration culture.
MetaboliteConcentration (pmol/O.D./mL)
J-Vector ControlJ-KAFS
1 h6 h24 h1 h6 h24 h
Adenylate energy charge a0.4030.4470.3540.4110.4480.319
ATP538138589540
ADP87955510413884
AMP9911192105133133
a The adenylate energy charge was calculated with the equation ((ATP) + 0.5(ADP))/((ATP) + (ADP) + (AMP)).
Table 6. Changes in carbonic anhydrase activities in crude extract proteins of transgenic strains after treatment with acetazolamide.
Strain bChanges in Carbonic Anhydrase Activity (WAU/mL) a
J-KAFS−0.81
J-vector control0
a The changes in carbonic anhydrase activity were calculated as the differences in Wilbur–Anderson units (WAU)/mL crude extract proteins with and without acetazolamide treatment. The definition for a WAU is (T0−T)/T, in which T0 and T are the times required for the O.D. at a 558-nm drop from 0.5 to 0.3, without and with crude cell extract, respectively. b The protein concentration of each crude cell extract was adjusted to 16.47 mg/mL.
Publisher’s Note: MDPI stays neutral with regard to jurisdictional claims in published maps and institutional affiliations.

