
Application of Augmented Reality in the Sensory Evaluation of Yogurts


Centre of Excellence—Food for Future Consumers, Department of Wine, Food and Molecular Biosciences, Faculty of Agriculture and Life Sciences, Lincoln University, Lincoln 7647, New Zealand
*
Author to whom correspondence should be addressed.
Fermentation 2021, 7(3), 147; https://0-doi-org.brum.beds.ac.uk/10.3390/fermentation7030147
Submission received: 17 June 2021
/
Revised: 25 July 2021
/
Accepted: 30 July 2021
/
Published: 9 August 2021
(This article belongs to the Special Issue Implementation of Digital Technologies on Beverage Fermentation)
Abstract
:Augmented reality (AR) applications in the food industry are considered innovative to enrich the interactions among consumers, food products, and context. The study aimed to investigate the effects of AR environments on the sensory responses of consumers towards different yogurts. AR HoloLens headsets were used to set up two AR environments: (1) AR coconut view (ARC) and (2) AR dairy view (ARD). Hedonic ratings, just-about-right (JAR), check-all-that-apply (CATA) attribute terms, emotional responses, purchase intent, and consumer purchasing behaviors of three types of yogurts (dairy-free coconut, dairy, and mixed) were measured under ARC, ARD, and sensory booths (SB). The results showed that the liking scores of dairy and mixed yogurts were generally higher than the coconut yogurt regardless of the environment. The interaction effect of yogurts and environments was statistically significant in terms of appearance, taste/flavor, sweetness, mouthfeel, aftertaste, and overall liking. JAR and penalty analysis revealed that consumers penalized the coconut yogurt for being “too much” in sourness, “too little” in sweetness, and “too thin” in mouthfeel. For the CATA analysis, attribute terms positively associated with overall liking (such as “sweet”, “smooth”, and “creamy”) were selected for dairy and mixed yogurts, whereas the attribute terms negatively associated with overall liking (such as “firm”, “heavy”, and “astringent”) were only selected for coconut yogurts. Regarding yogurt-consumption behaviors, the purchase intent of dairy and mixed yogurts was higher than that of the coconut yogurt, and taste and health were considered to be the most critical factors for yogurt consumption.
1. Introduction
Humans are social beings, and their actions depend on the social contexts. Building on this age-long traditional knowledge, sensory science, as a discipline, is actively integrating this overlooked dimension. In this regard, the changing scientific worldview [1] concerning the nature of individuals [2], the social agency of materials [3], and the theory that everything relates to everything else [4] stressed the scientific disciplines to realign themselves with these philosophies. The ongoing sensory science is actively seeking to connect and accommodate the social context in consumption settings. In the midst of this, a variety of novel techniques, such as virtual or augmented reality, are being tested for their efficacy in bringing context to the sensory booths. The impact of contextual information on sensory perception and acceptability should not be neglected [5]. Context and environments can have a significant effect on the perception, liking, and emotions of consumers when tasting different products [6]. In this succession, we tested the application of augmented reality (AR) for the inclusion of context.
The delivery of AR experience could be achieved by using AR head-mounted-display (HMD) devices and mobile phones capable of controlling users’ visual and auditory experiences [7]. AR menus have been used in some restaurants to make the consumers see the real-size 3D model of the dishes which they would like to order [8]. Recent interests of sensory AR systems mostly focus on engaging human–computer interactions or enrich intuitions by facilitating engagement with multisensory dimensions from both the physical and virtual information spaces [9]. Therefore, more vivid and realistic contexts could be created by immersive technologies in sensory studies. The effect of immersive technologies on improving ecology validity and engagement has been proven by previous studies [10,11,12]. Sinesio et al. [13] reported that similar results of emotions and hedonic scores were acquired in real-life environments, immersive rooms, and virtual-reality conditions [11]. Moreover, AR could increase the interactivity of food products, such as modifying texture or color [14] and adding digital nutrition information [15]. Extended global food competition demands high-quality products. If AR technology could be appropriately used to enhance interactions and engagements during sensory-evaluation tests, the more reliable consumption contextual data would be obtained from the sensory-evaluation assessments.
In this study, non-dairy and dairy yogurts were selected as the food models to test the effect of AR environments on the sensory experiences. In this regard, yogurt has a trustworthy reputation for its desirable taste and health benefits (probiotics). In comparison with other plant-based foods, non-dairy yogurts have the higher potential to be accepted by the general populations rather than special groups (e.g., vegan/vegetarian.). The sensory characteristics of plant-based foods may be the main obstacle to achieve higher consumer likings and preferences.
So far, very few studies have been conducted about the use of immersive technologies in creating contexts regarding the sensory evaluation of food products. Although some previous virtual reality (VR)-immersive studies revealed that contexts had a marginal effect on sensory acceptability [6,10], both AR and VR sensory studies are still at the early stages of research. In this experiment, a vanilla-flavored dairy milk-based yogurt (dairy yogurt), a vanilla-flavored coconut-milk-based yogurt (coconut yogurt), and a mixed combination yogurt (50% dairy and 50% coconut) were selected for the sensory test. The HoloLens 2 headsets (Microsoft, Ltd., Redmond, WA, USA) were used to create immersive AR environments. Three contextual environments referring to the traditional sensory booth (SB), AR dairy view (ARD), and AR coconut view (ARC) were used for consumers. This study aimed to investigate three environments’ effects on the sensory acceptance, emotional responses, purchase intent, and yogurt-consumption behaviors among three yogurt samples using augmented reality as a contextual factor of the evaluation.
2. Materials and Methods
2.1. Participants
A total of N = 63 untrained participants (23 males and 40 females), with 92% of them aging from 21 to 40 years, were recruited voluntarily for this study at Lincoln University, Lincoln, New Zealand. All participants were required to be not allergic to yogurt ingredients involved in the study and were asked to sign the consent form before the sensory evaluation. All work involving human participants was approved by the Lincoln University Human Ethics Committee (Approval No: 2019-68; date of approval 18-11-2019). A brief introduction was given to each participant about the sensory test procedure. Participants were also briefed about the use of the AR headsets. This study included three sensory sessions (sensory booth, AR dairy context, and AR coconut context), and all sessions were conducted in the sensory laboratory facility of Lincoln University, New Zealand. Each participant was required to complete the three sessions at once with a resting period of 5 min in between the sessions. The duration of all sessions was approximately 45 min. The order of three sessions for each participant was randomized.
2.2. Food Stimuli
A focus group of N = 7 was used to select dairy and non-dairy yogurt samples for the subsequent consumer study. Five coconut-milk-based yogurts and five dairy yogurts were selected from the local supermarket. After assessing the sensory attributes in terms of appearance, flavor, mouthfeel, texture, and overall liking, a dairy-based vanilla bean yogurt (Yoplait, Ltd., Auckland, Auckland, New Zealand) and a coconut-milk-based vanilla bean yogurt (Raglan, Ltd., Reglan, Waikato, New Zealand) were selected as the final stimuli to be tested for the context-effect experiment. The ingredients of the dairy yogurt included skim milk, milk solids, sugar, water, cream, thickener (modified starch), gelatin, natural flavors, acidity regulators (citric acid, sodium citrate), preservative (potassium sorbate), vanilla bean seeds (0.01 %), and cultures. The ingredients of the coconut yogurt were organic coconut cream, apple juice concentrate, natural starch, vanilla paste, and live vegan cultures (Acidophilus and Bifidobacterium). To avoid appearance bias and logical errors, a mixed vanilla bean yogurt (50% dairy-based vanilla bean yogurt and 50% coconut-milk-based vanilla bean yogurt) was used as a third sample for consumers. Yogurt products were purchased and kept in the refrigerator at 4 °C. The preparation and sampling process was conducted within one hour before the sensory session. About 15 mL samples were poured into 30 mL cups with lids. Samples were coded with 3 random digital numbers. Participants were randomly served with one of the three yogurt samples in each sensory session (the order of the samples was balanced and randomized to avoid positional bias).
2.3. Sensory Procedure
A brief explanation of the experimental procedures was given to each participant at the beginning of three sensory sessions. These instructions included the explanation of the proper wearing and operation of the AR headsets, the duration of the experiment, and how to fill out the questionnaire using the RedJade Sensory Solutions (Martinez, CA, USA) platform. Each participant was instructed to evaluate three yogurt samples in one of the three sensory sessions. There were three contextual environmental settings (SB, ARC, and ARD).
2.3.1. The 9-Point Hedonic Scale Questioning
For each environment, the participant was asked to rate the acceptability of sensory characteristics of each yogurt sample based on the 9-point hedonic scale, where 0 means “dislike extremely”, and 9 means “like extremely”, with a neutral response at 5 [16]. Sensory attributes included appearance, color, aroma, taste/flavor, sweetness, sourness, mouthfeel, viscosity, aftertaste, and overall liking.
2.3.2. Just-About-Right (JAR) Scale Questioning
Following the 9-point questions, the intensities of the sweetness, sourness, dairy flavor, coconut flavor, and mouthfeel were assessed using the just-about-right (JAR) scale, where 1 = not at all sweet/sour enough or much too weak/thin; 2 = just about right; and 3 = much too sweet/sour or much too strong/thick [17].
2.3.3. Check-All-That-Apply (CATA) Questioning
A check-all-that-apply (CATA) question was utilized for the sensory attributes of the yogurt samples. The terms in the CATA question were referenced in previous studies [18,19,20], including fruity flavor, dairy flavor, coconut flavor, vanilla flavor, sweet, sour, plain, smooth, creamy, astringent, homogeneous, cohesive, thick, thin, light, firm, compact, and heavy.
2.3.4. Emotions
Besides, the CATA-based method was used to assess the emotional responses evoked by the yogurt-tasting experience. The 33 emotional terms were pre-selected [21,22,23], including 24 positive terms (adventurous, satisfied, active, affectionate, energetic, enthusiastic, free, friendly, glad, good, happy, interested, joyful, loving, merry, nostalgic, pleased, pleasant, secure, warm, daring, eager, polite, understanding), 4 neutral terms (calm, peaceful, steady, and wild) and 5 negative terms (bored, disgusted, worried, aggressive, and guilty).
2.3.5. Purchase Intent, Demographics, and Consumption Questions
The purchase intent of each yogurt sample was also measured in the questionnaire (1 = No, 2 = Yes). For each participant, the demographic information (gender, age, and ethnicity) and consumer yogurt-consumption behavior were collected once at the beginning of the sensory booth session. Each participant was asked to multi-select the reasons for the yogurt consumption (nutritional, taste, probiotics, health, as a habit, emotional pleasantness, and other) and what factors they consider most when purchasing yogurt (flavor/taste, price, brand, plant-based yogurt/dairy-based yogurt, organic, locally produced, packaging, other/explanation). Participants were asked to use crackers (Arnott, Ltd., Silverwater, NSW, Australia) or water in between samples to avoid possible carryover effects.
2.4. Contextual Settings (Environments)
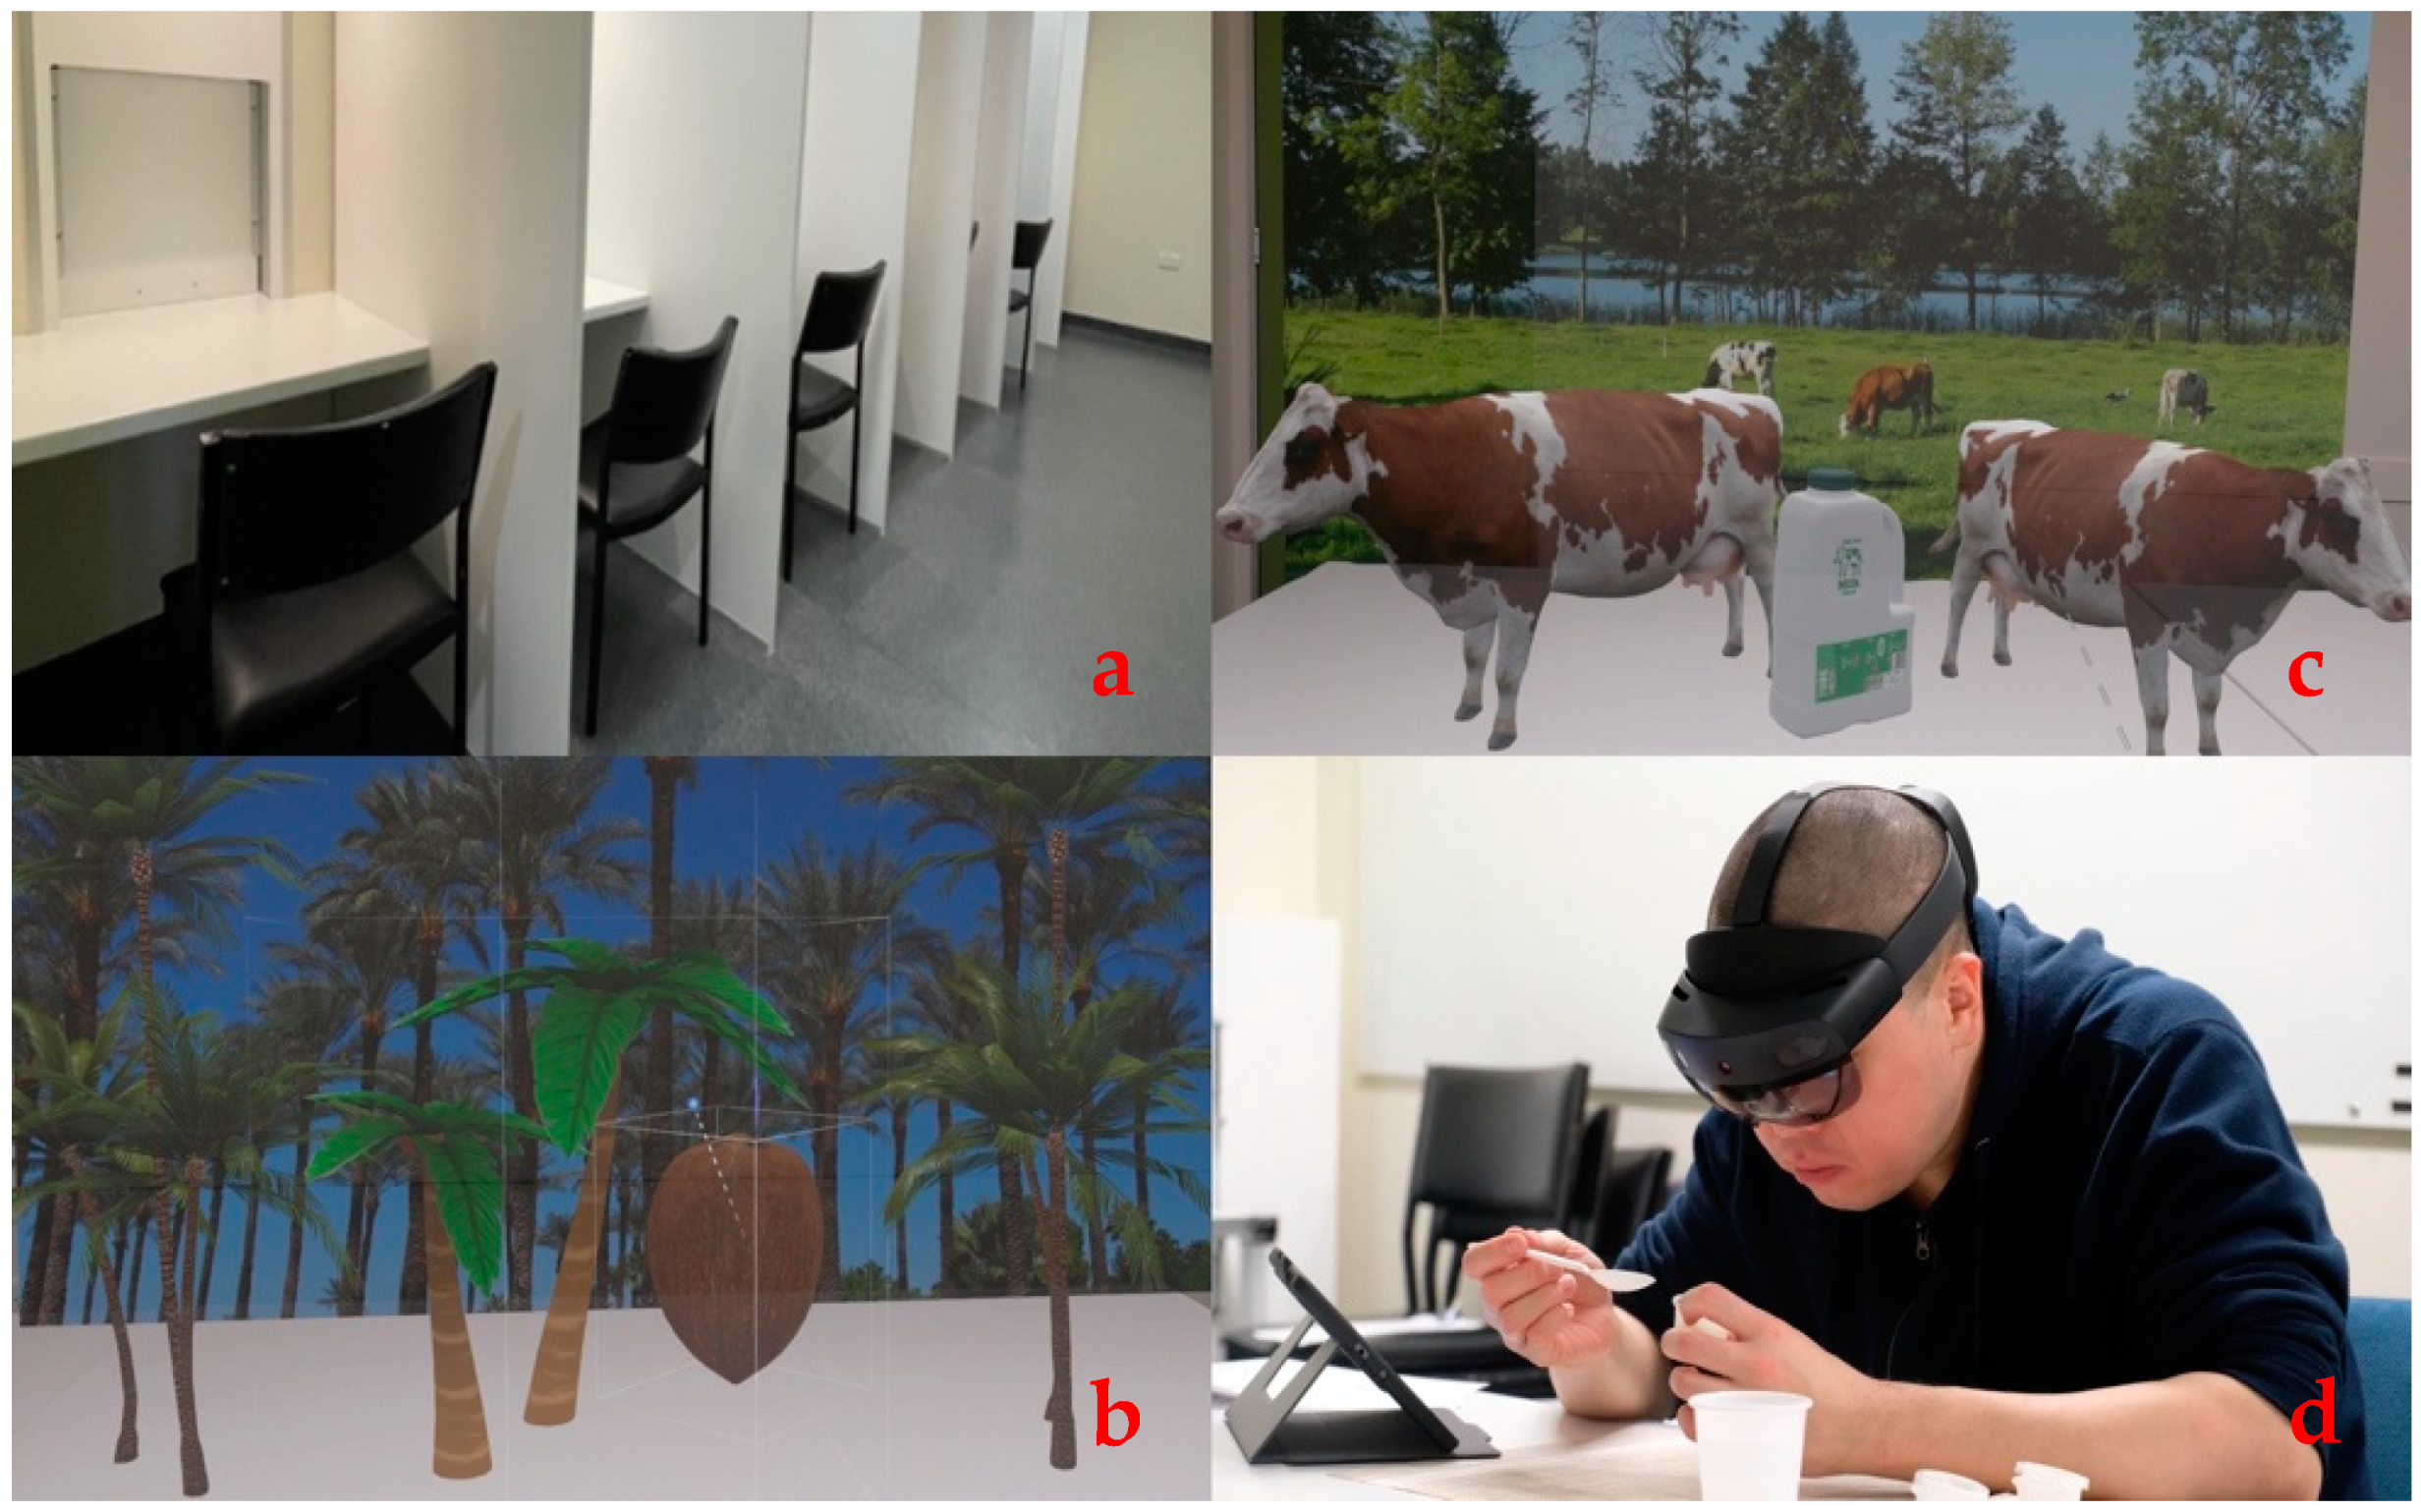
Figure 1 shows the three contextual settings, including the traditional sensory booths (the control setting), AR coconut view setting (ARC), and AR dairy view setting (ARD). The sensory testing booth (1.5 m width × 2.1 m height) was individual and isolated, located at RFH building, Lincoln University, Lincoln, New Zealand. The room temperature was controlled around 21 °C. Both incandescent light and the white-color fluorescent light were constant during the whole evaluation process. There was a window-door within each booth unit, which connected the testing booth with the food preparation room for easily placing samples and tablets.
The HoloLens 2 headset (Microsoft, Redmond, WA, USA) was applied for two AR testing settings to generate the two AR environments. Participants were able to see the appearance of the samples through the transparent visor. While assessing samples in the AR sessions, participants were asked to wear the AR headset for viewing the pre-set contextual settings. When it was time to fill out the sensory questionnaire after tasting the sample, participants were able to easily flip the visor up (no need to take off the headset) to step out of the AR environment. Participants repeated the process until they were finished evaluating all samples. Moreover, participants were required not to touch the 3D models to avoid the setting bias for each observation.
Two AR contextual settings were generated in the isolated focus room and displayed by the 3D Viewer application, which was run by the HoloLens 2 headset. Two HoloLens 2 devices were put on the table in the sensory focus group room, where one was used for the ARC and another for ARD. Both AR contextual settings included 3D models, photos, and music. The criterion for creating the AR settings was based on the actual environment and perceptions of milk or coconut production. One instructor helped participants to properly wear the headsets and explain the sensory procedure, while another instructor set the table for the tasting experience. When participants understood the entire process and saw the right contextual settings, instructors left the focus room to give participants a private space for the sensory evaluation.
2.4.1. Coconut View Environment
For ARC (Figure 1b), a coconut photo was used as the background while 3D palm trees and one 3D coconut were displayed, accompanied by beach sounds. The 3D models used for ARC were extracted from the Sketchfab 3D model’s platform (New York, NY, USA), using free-to-download non-commercial 3D models. Free 3D models used in ARC included palm trees [24] and one coconut [25]. The palm-tree photo comes from the Pixabay photo platform (Berlin, Berlin, Germany) [26]. The beach sound for the ARC originated from a beach-view video on YouTube [27], which gave a natural beach sound with sea waves and bird sounds.
2.4.2. Dairy View Environment
The ARD settings are presented in Figure 1c, including the background photo of a dairy farm with cows, two 3D cow models, one 3D milk model, and the farm’s natural cow sounds. All 3D models were free downloaded from the Sketchfab platform, including the cow [28] and the milk models [29]. The background photo of the farm view was downloaded free from the Pixabay platform [30]. The cow sounds with slight bird sounds were used from a cow-farm video on YouTube [31], which displayed the natural peaceful farm sound with cows’ mooing.
2.5. Statistical Analysis
The normality of hedonic data of sensory attributes was assessed by the Shapiro–Wilk test in XLSTAT Statistical Software 2019 (Addinsoft, New York, NY, USA). The result showed that all attribute data were not normally distributed. Therefore, the non-parametric Freidman’s test followed by a post hoc Nemenyi test in XLSTAT Statistical Software 2019 (Addinsoft, New York, NY, USA) was performed to assess if there were significant differences in hedonic ratings among the combinations of 3 yogurt types × 3 environments. The H0 assumption of Friedman’s test is that at least one treatment significantly differs from the other treatments. If H0 is approved, the Nemenyi test will be applied for the multiple means comparisons. The data of acceptability was auto sorted and analyzed for mean ranks using the XLSTAT Statistical Software. Penalty analysis performed on JAR data was used to determine the effects of the sensory attributes on the yogurt samples’ liking scores. Cochran’s Q test, correspondence analysis (CA), and principal coordinate analysis (PCoA) were applied to assess the CATA emotional responses and the CATA attributes of yogurts under different contextual settings. Principal component analysis (PCA; associations biplot) was applied to investigate the correlations of liking scores of attributes and yogurt samples under SB, ARC, and ARD. Agglomerative hierarchical cluster (AHC) analysis was performed to categorize the nine yogurt x environment combinations. The dissimilarity of these treatments was analyzed, relying on the Euclidean distance and Ward’s method for investigating the difference between the yogurts’ sensory attributes compared to the overall liking. Purchase-intent frequencies were analyzed by the Cochran’s Q test and simultaneously confidence interval test with multiple comparisons. Frequency percentages were reported for the demographic data. Data from all participants were collected automatically by RedJade Sensory Software (Martinez, CA, USA) and analyzed by the XLSTAT Statistical Software 2019 (Addinsoft, New York, NY, USA).
3. Results
3.1. Hedonic Results
Table 1 shows the Friedman analysis results of sensory acceptance regarding the three yogurt types (coconut vanilla, dairy, and mixed) under three contextual settings (SB, ARC, and ARD). Realizing the significant interaction effects for appearance, taste/flavor, sweetness, mouthfeel, aftertaste, and overall liking, only interactions and no main effects were further analysed for these attributes in the discussion section.
Table 2 shows the Nemenyi test results comparing the mean ranks at alpha 5% for the sensory attributes, including appearance, taste/flavor, sweetness, and overall liking. Only attributes that had shown significance (p < 0.05) at the multiple pairwise comparisons using Nemenyi’s procedure were summarized in Table 2. The liking score of the dairy yogurt under ARD significantly differed from the coconut yogurt under SB for the overall liking. Regarding appearance and sweetness, mixed yogurt under ARD had higher liking scores than the coconut yogurt under SB. Besides, the hedonic ratings of taste/ flavor of the mixed and dairy yogurts under SB were significantly higher than the coconut yogurt under SB. However, there were no differences in the liking scores between M-SB and D-ARD. Overall, coconut-based yogurt was the most disliked yogurt among the three yogurt types under the three contextual settings.
3.2. JAR Results and Penalty Analysis
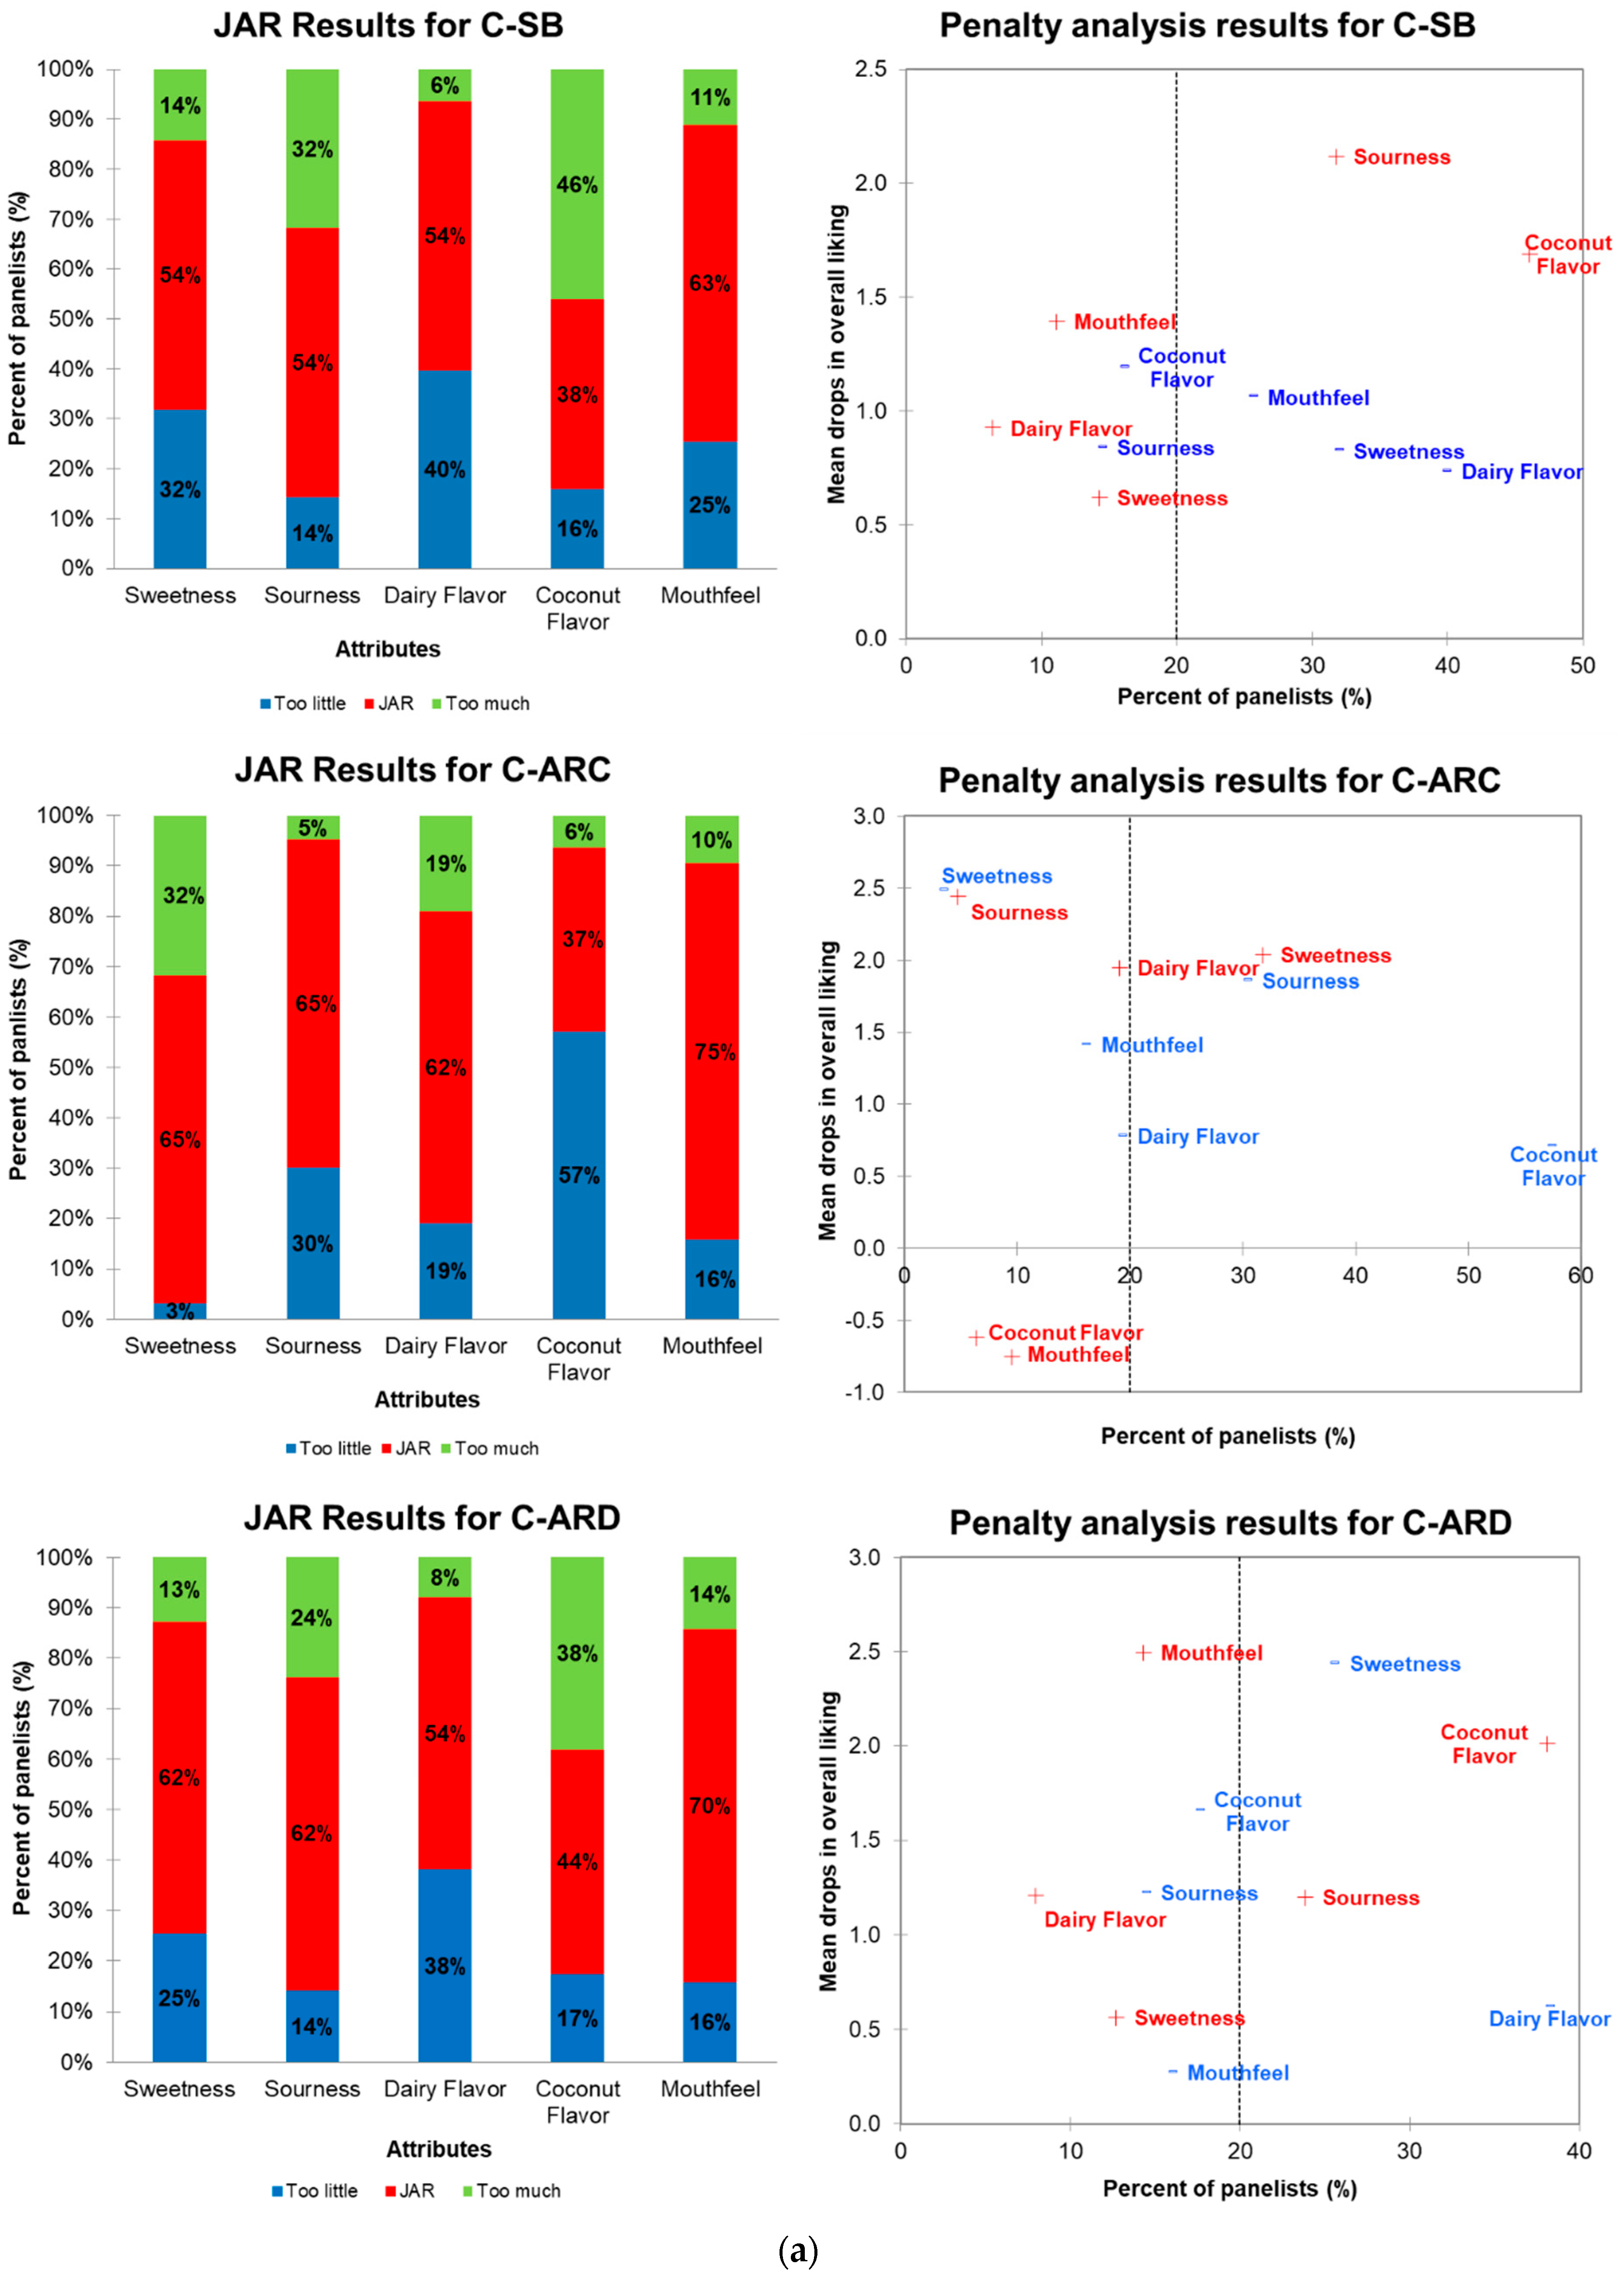
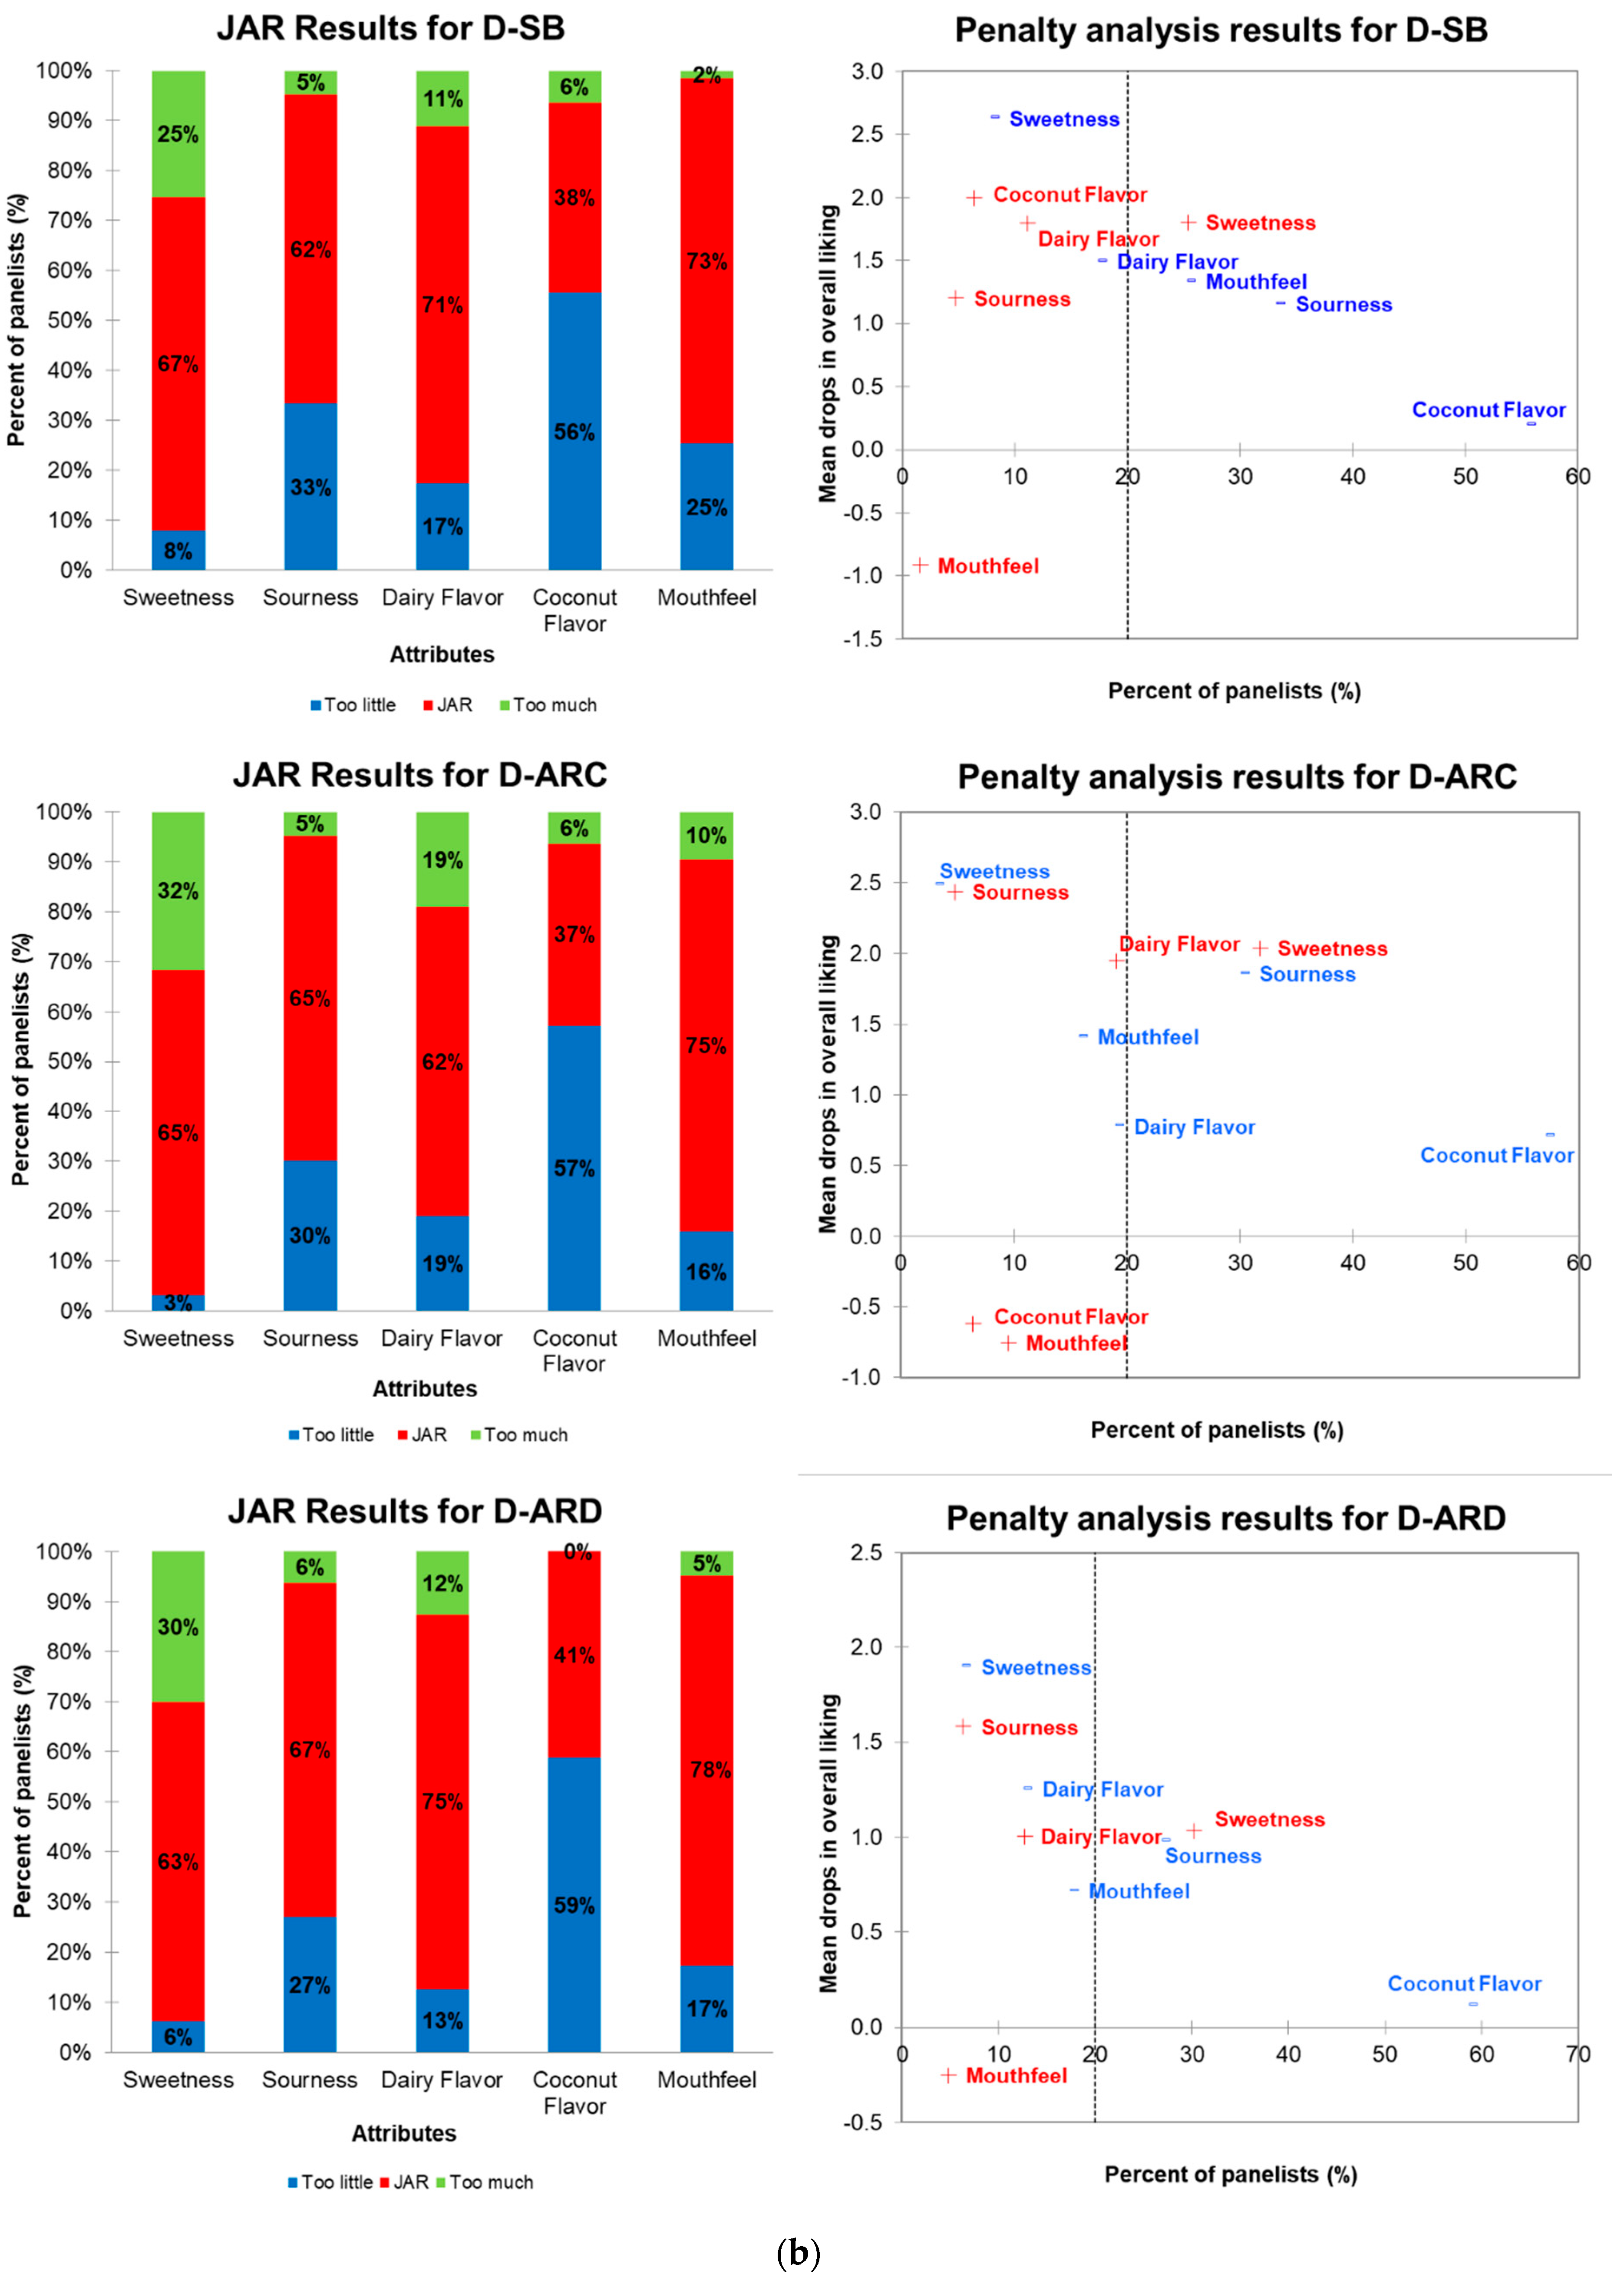
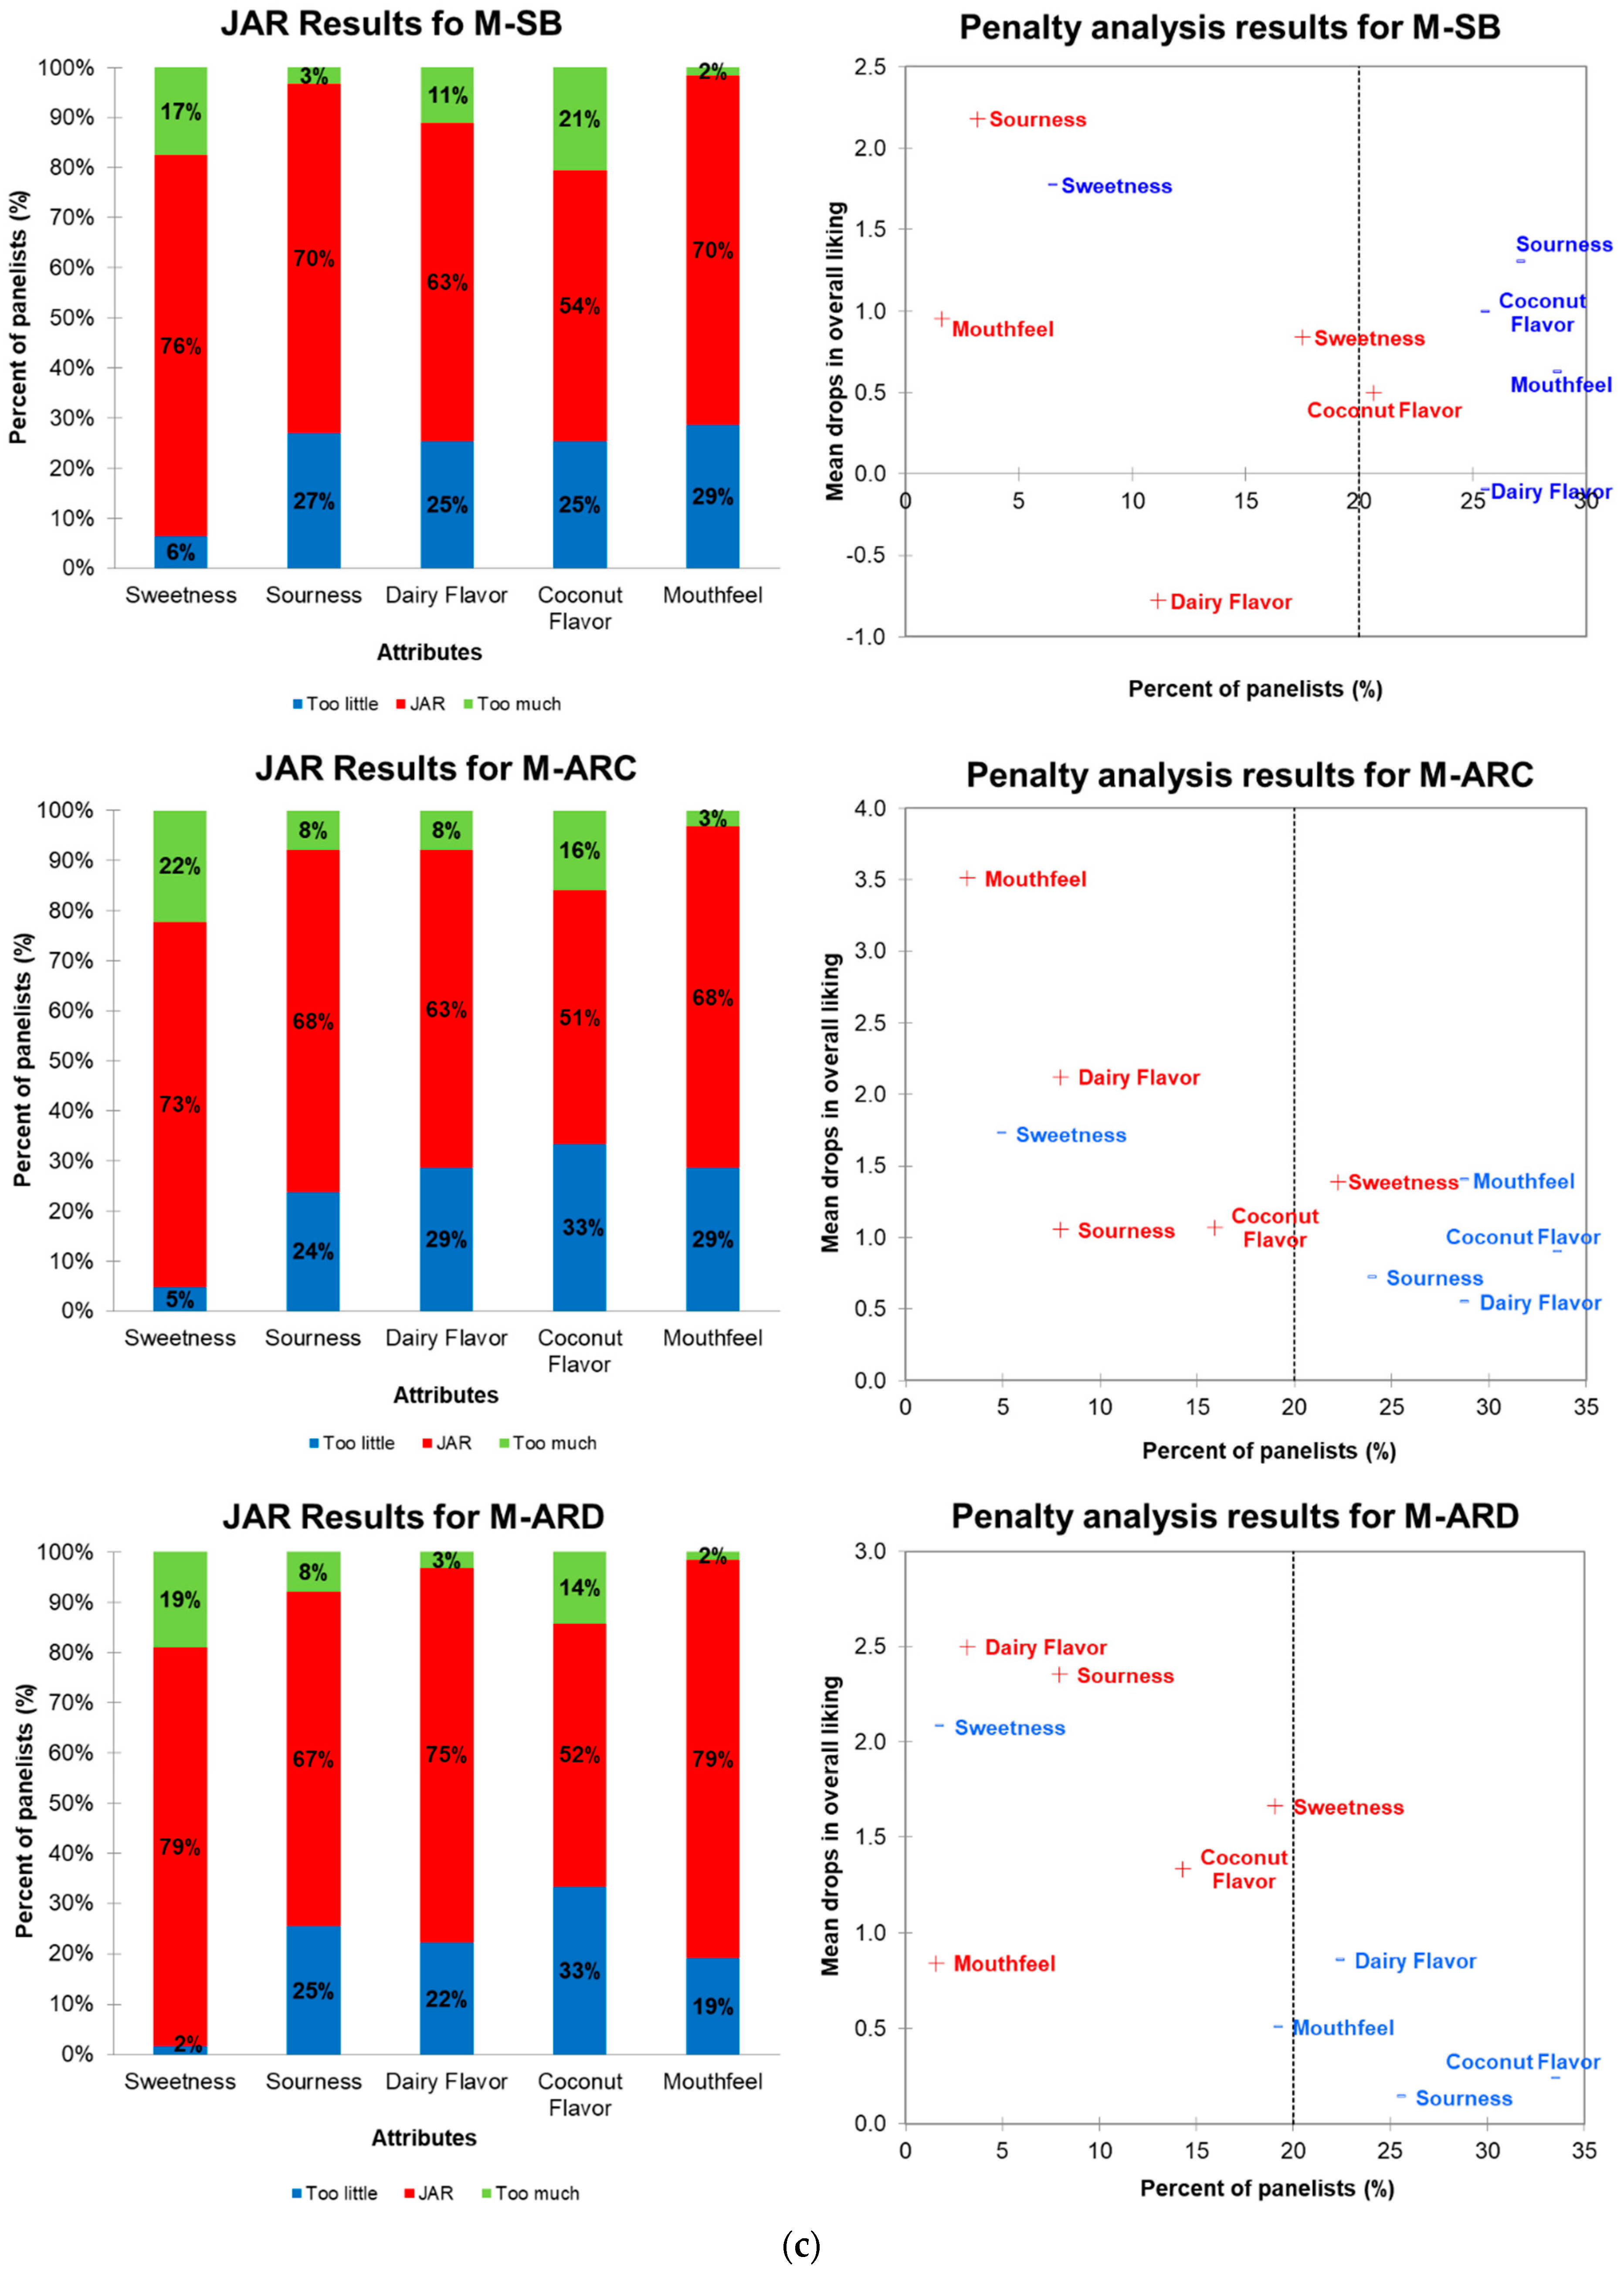
The JAR frequencies and mean drops based on the penalty analysis for five attributes (sweetness, sourness, dairy flavor, coconut flavor, and mouthfeel) of the yogurt samples (coconut-milk-based, dairy, and mixed) under three contexts (SB, ARC, and ARD) are presented in Figure 2. Coconut-milk-based yogurt under ARC had the highest selections of JAR for sweetness (65%), sourness (65%), dairy flavor (62%), and mouthfeel (75%). In contrast, the highest selection of JAR for coconut flavor (44) was shown under ARD. The highest proportions of participants selected that coconut-milk-based yogurt was “too little/weak” in sourness and coconut flavor under the ARC. Similarly, the selection frequencies of “too little/weak/thin” in sweetness, dairy flavor, and mouthfeel, respectively, were the highest under the sensory booths compared to the AR environments. The coconut yogurt under sensory booths had the highest selection of “too much/strong” in coconut flavor (46%) and sourness (32%), while the attributes of sweetness (32%) and dairy flavor (19%) were selected to be “too much” under the ARC. Regarding the dairy yogurt under all environments, the JAR frequencies of sweetness, sourness, dairy flavor, and mouthfeel were not much different, which varied from 62% to 78%. Approximately, 56–59% of participants selected “too weak” for coconut flavor, and 25–32% selected “too much” for sweetness. For the mixed yogurt, JAR was selected more frequently for sweetness (73–79%), sourness (67–70%), dairy flavor (63–75%), coconut flavor (51–54%), and mouthfeel (68–79%) under all contextual settings. The selections of “too little/weak/thin” for all evaluated attributes of the mixed yogurts except sweetness were similar under the different environments, ranging from 19% to 33%. Only 14–22% of participants selected “too much/strong” in the sweetness and coconut flavor of the mixed yogurt regardless of the environment.
Penalty analysis was based on the JAR frequencies and the hedonic scores of yogurt samples under different contexts. The threshold population size of 20% is considered to be the significant level for an attribute to be penalized in the analysis [32,33]. According to the explanation of the penalty plots [32], more than 20% of participants penalized coconut yogurt for being “too much/strong” in sourness and coconut flavor and “too little/weak” in sweetness and dairy flavor under SB and ARD, whereas “too much” sweetness and “too little/weak” sourness and coconut flavor were penalized under ARC. Dairy yogurts under all environments were penalized due to lack of sourness and coconut flavor and for having “too much” sweetness. For the mixed yogurts, having “too little/weak” sourness and coconut flavor affected the liking scores regardless of the environment. For the dairy yogurts, having “too thin” mouthfeel under SB and ARC as well as having “too much” sweetness under ARC and having “too weak” dairy flavor under ARD were penalized by over 20% of consumers. In addition, having a “too thin” mouthfeel influenced the hedonic scores of dairy yogurts under all contexts.
In general, the mixed yogurts had higher proportions of JAR scores for all sensory attributes compared to those of the dairy and coconut yogurts. Besides, coconut yogurts were slightly penalized for having the “too much” coconut flavor in SB and ARD. Comparing the environments, marginal differences were observed in the JAR responses, as participants had slightly different penalizations for all yogurts in each environment.
3.3. CATA Analysis of Attribute Terms of Yogurt Samples in Different Environments
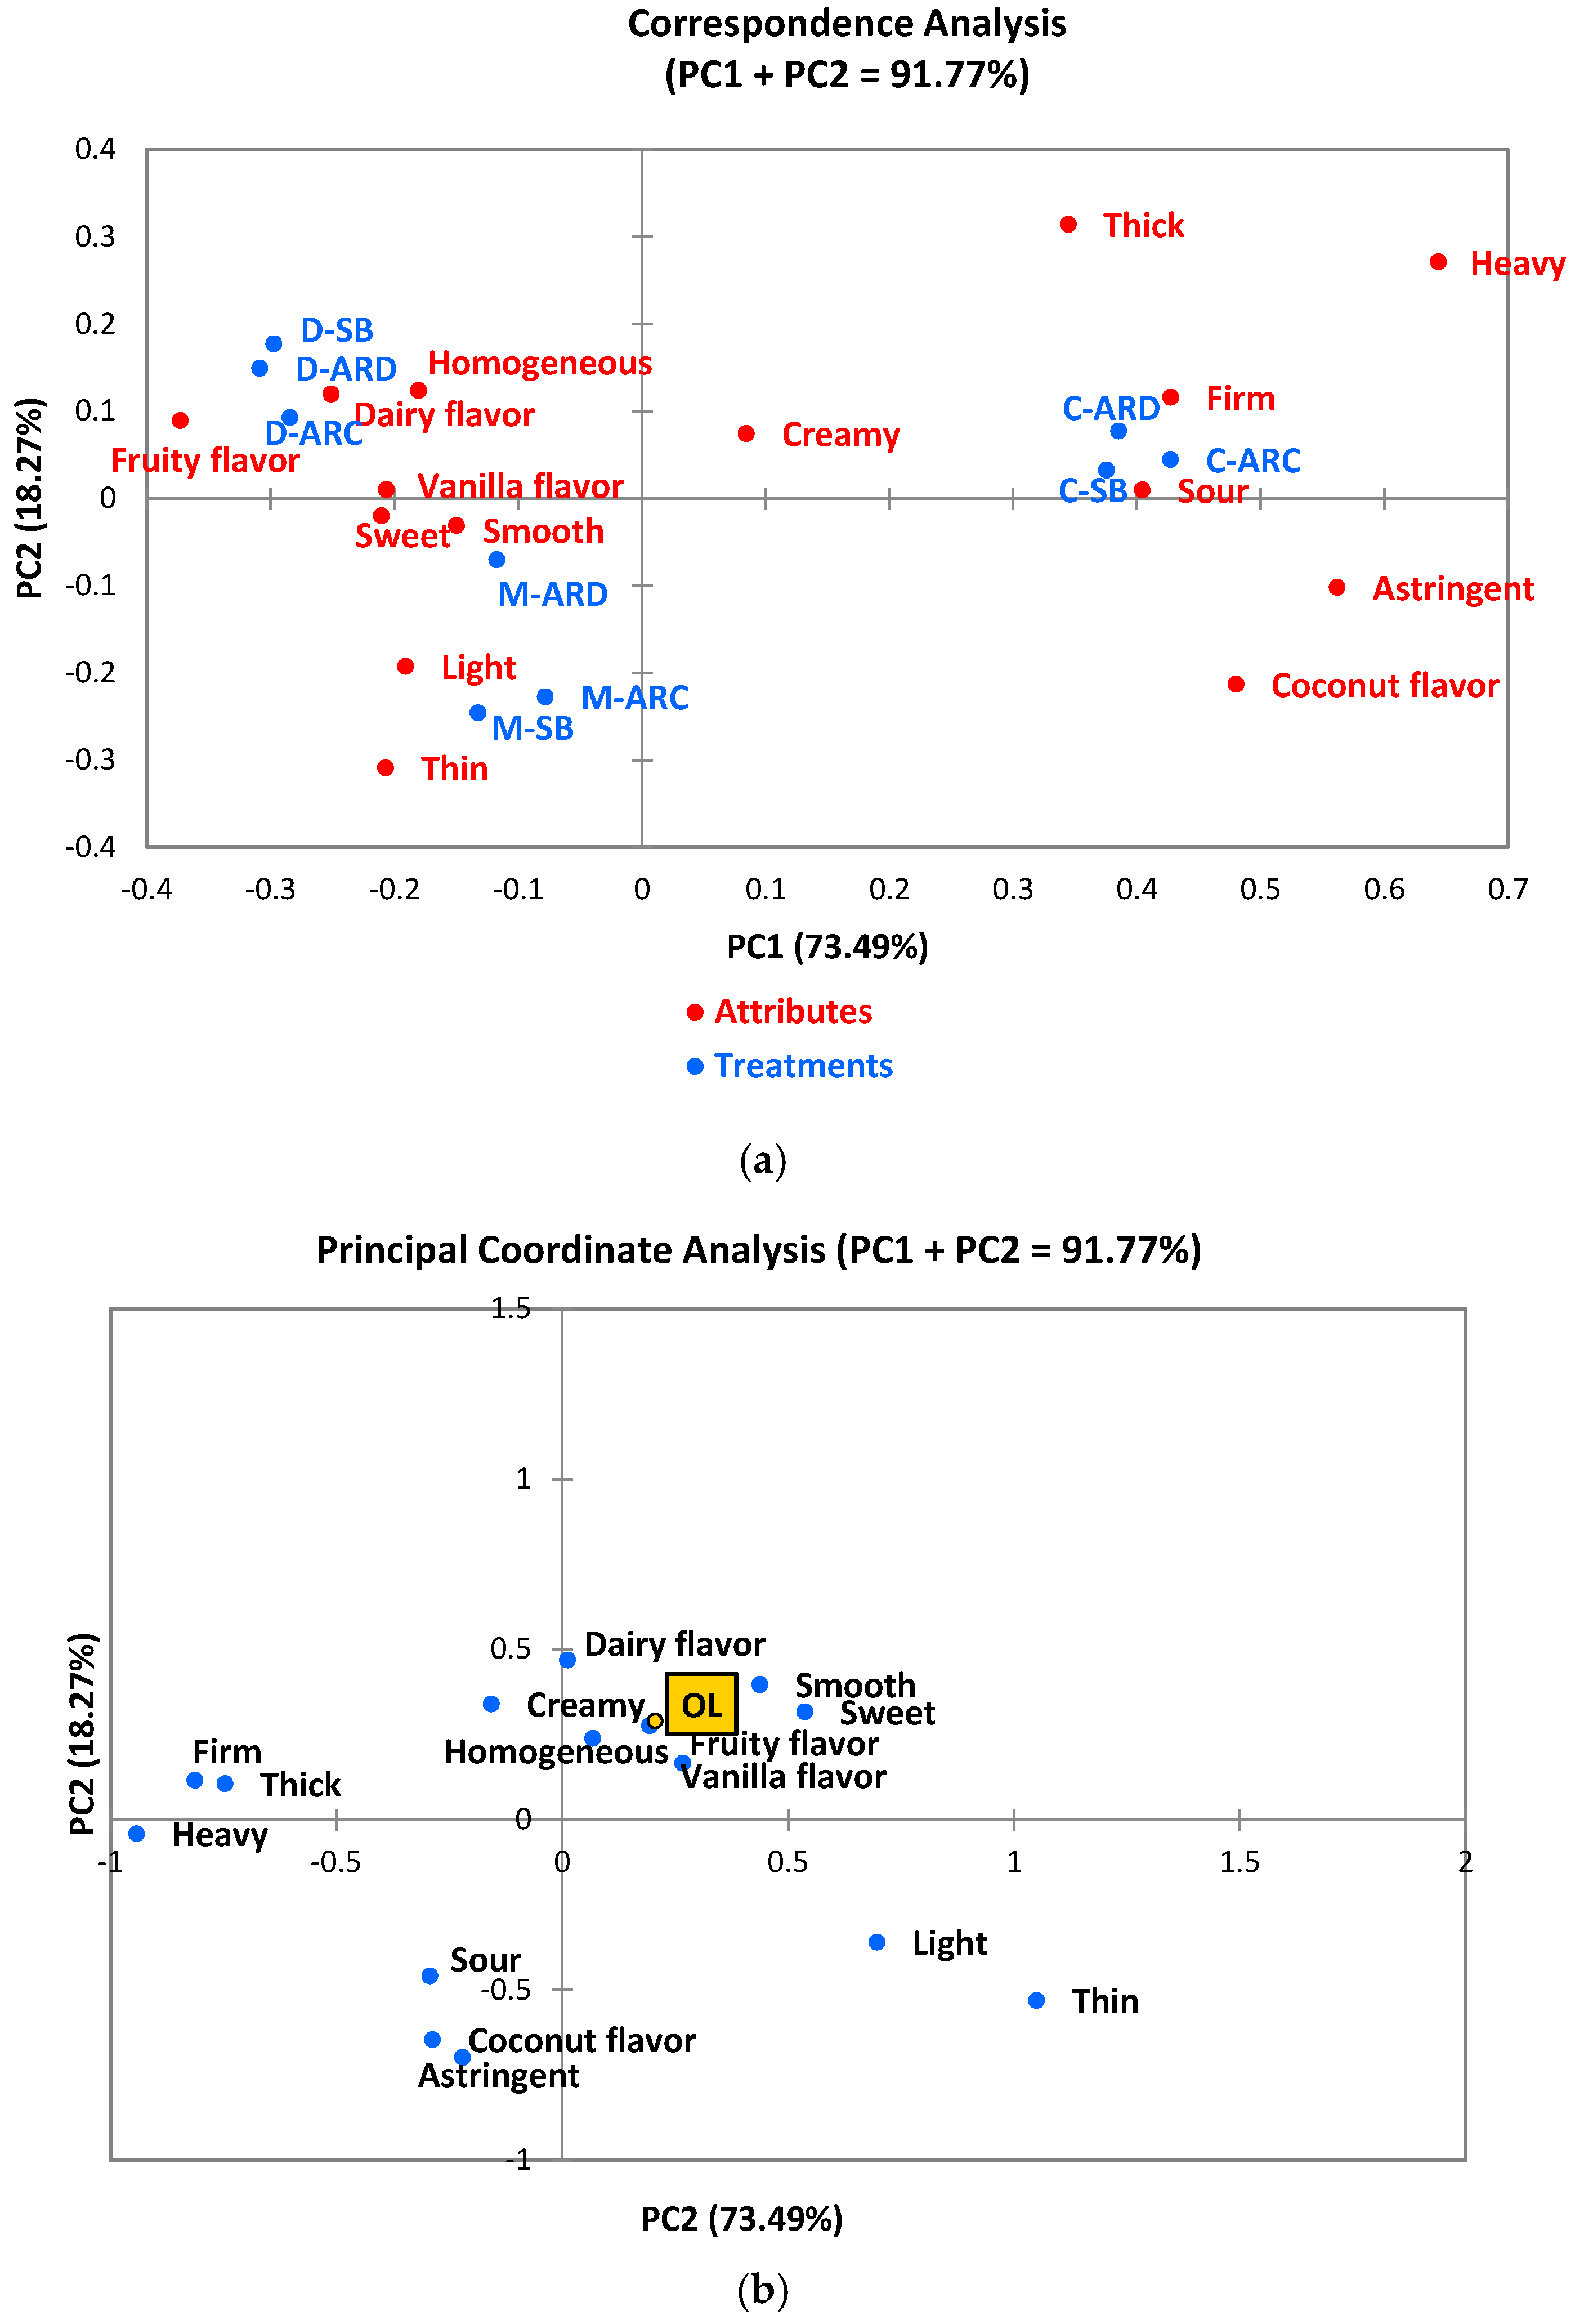
Figure 3 shows the correspondence analysis of the CATA attribute terms for the yogurts in the different environments and the principal coordinate analysis of the CATA attribute terms with the overall liking score. The principal component one (PC1) of the correspondence analysis accounted for 73.47%, and the principal component two (PC2) was 18.27%. Both components explained 91.77% of total data variability. According to the Cochran’s Q test results, 15 terms were significantly different among the yogurt samples, including “fruit flavor”, “dairy flavor”, “coconut flavor”, “vanilla flavor”, “sweet”, “sour”, “smooth”, “creamy”, “astringent”, “homogeneous”, “thick”, “thin”, “light”, “firm”, and “heavy” (data not shown). The participants selected attribute terms toward the dairy yogurt samples under all environments, such as “homogeneous”, “fruity flavor”, “dairy flavor”, “vanilla flavor”, “sweet”, “smooth”, and “creamy”. The mixed yogurt sample was related to the terms “thin”, “light”, “sweet”, and “smooth”. Besides, the mixed yogurt under ARD was associated with “creamy” and “vanilla flavor”. On the contrary, the coconut yogurt was linked with “coconut flavor”, “thick”, “firm”, “sour”, and “astringent” (Figure 3a). According to the results of the principal coordinate analysis regarding the descriptive terms against the acceptability of all samples in the different contexts, the liking score was positively associated with “sweet”, “smooth”, “dairy flavor”, “fruity flavor”, “vanilla flavor”, “creamy”, “light”, and “homogeneous”, whereas it was negatively associated with “firm”, “heavy”, and “astringent” (Figure 3b).
In general, samples were grouped according to the yogurt type (coconut, dairy, or mixed), with marginal effects of the environment in the discrimination of the attributes (Figure 3a). The dairy and mixed yogurts were more similar in their sensory attributes compared to those of the coconut yogurt. In the principal coordinate analysis, the overall liking was more related to the dairy yogurts compared to the other samples.
3.4. Emotional Responses
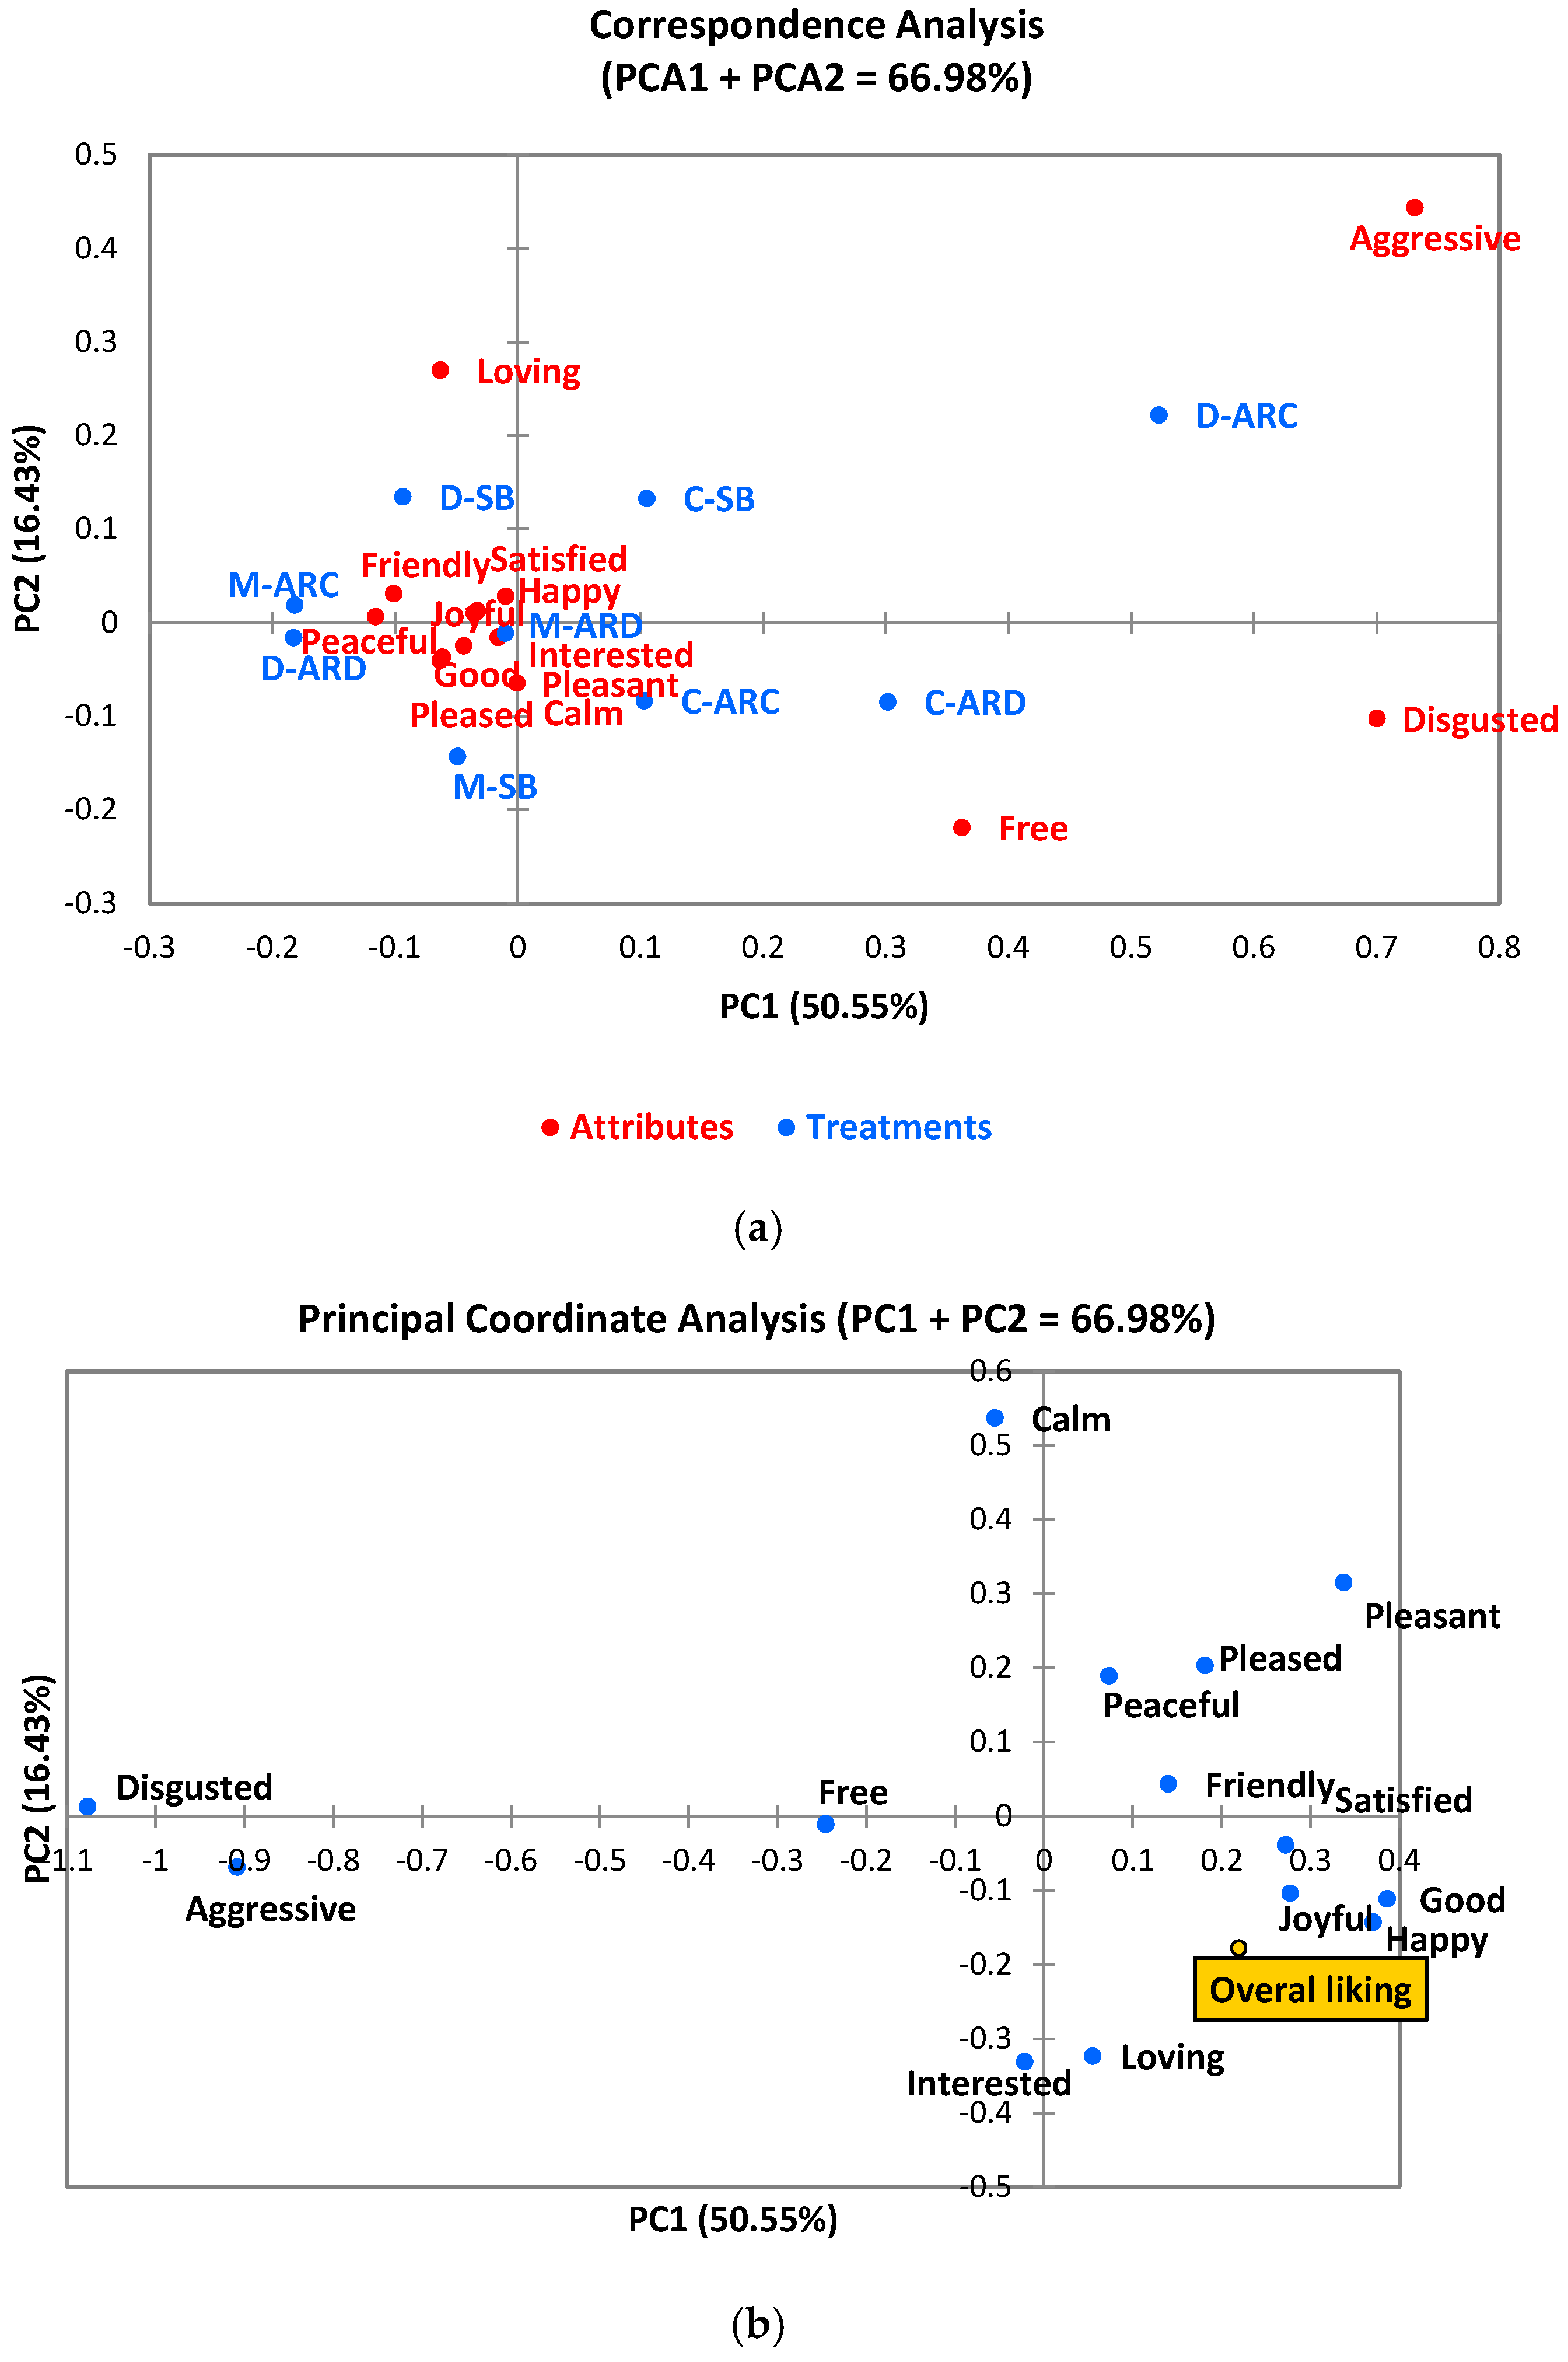
The results of the correspondence analysis of emotional terms for the yogurts in different environments were shown in Figure 4a. PC1 (50.33%) and PC2 (16.43%) explained 66.89% of the total variability. According to the Cochran’s Q test results, 14 emotional terms showed significant differences among the treatments, including “satisfied”, “calm”, “free”, “friendly”, “good”, “happy”, “interested”, “joyful”, “loving”, “peaceful”, “pleased”, “pleasant”, “disgusted”, and “aggressive” (data not shown). Specifically, the dairy yogurt under SB and ARD, the mixed yogurt under all contexts, and the coconut yogurt under SB and ARC were associated with nine positive emotional terms (“friendly”, “satisfied”, “happy”, “joyful”, “pleased”, “good”, “interested”, “loving”, and “peaceful”) and one neutral emotional term (“calm”). In addition, the emotional term “free” was associated with the coconut-milk-based yogurt under the ARD treatment. On the other hand, negative terms, such as “aggressive” and “disgusted”, were linked with the diary yogurt under ARC.
Figure 4b presents the results of the principal coordinate analysis of the emotional terms concerning the overall liking score. In general, the positive emotional terms, such as “satisfied”, “happy”, “good”, “joyful”, “pleasant”, and “peaceful”, were positively associated with the overall liking of yogurt products. On the other hand, negative emotional terms, such as “aggressive” and “disgusted”, were negatively associated with overall liking.
In general, no clear separations among yogurt types and environments were shown in the correspondence analysis results. The dairy yogurt under the AR coconut environment was different in its emotional profile compared to the other samples in this experiment. Figure 4c shows the merged results from the attributes and emotions of the different yogurt samples under the different environments. Generally, the sensory attributes were separated from the emotional terms. However, the textural attributes “heavy”, “firm”, “thick”, and “creamy” were related to the emotional terms “aggressive” and “disgusted”. Besides, these negative emotions and textural attributes were closely related to the coconut yogurts.
3.5. Principal Component and Cluster Analyses of Yogurt Samples under the Three Contexts
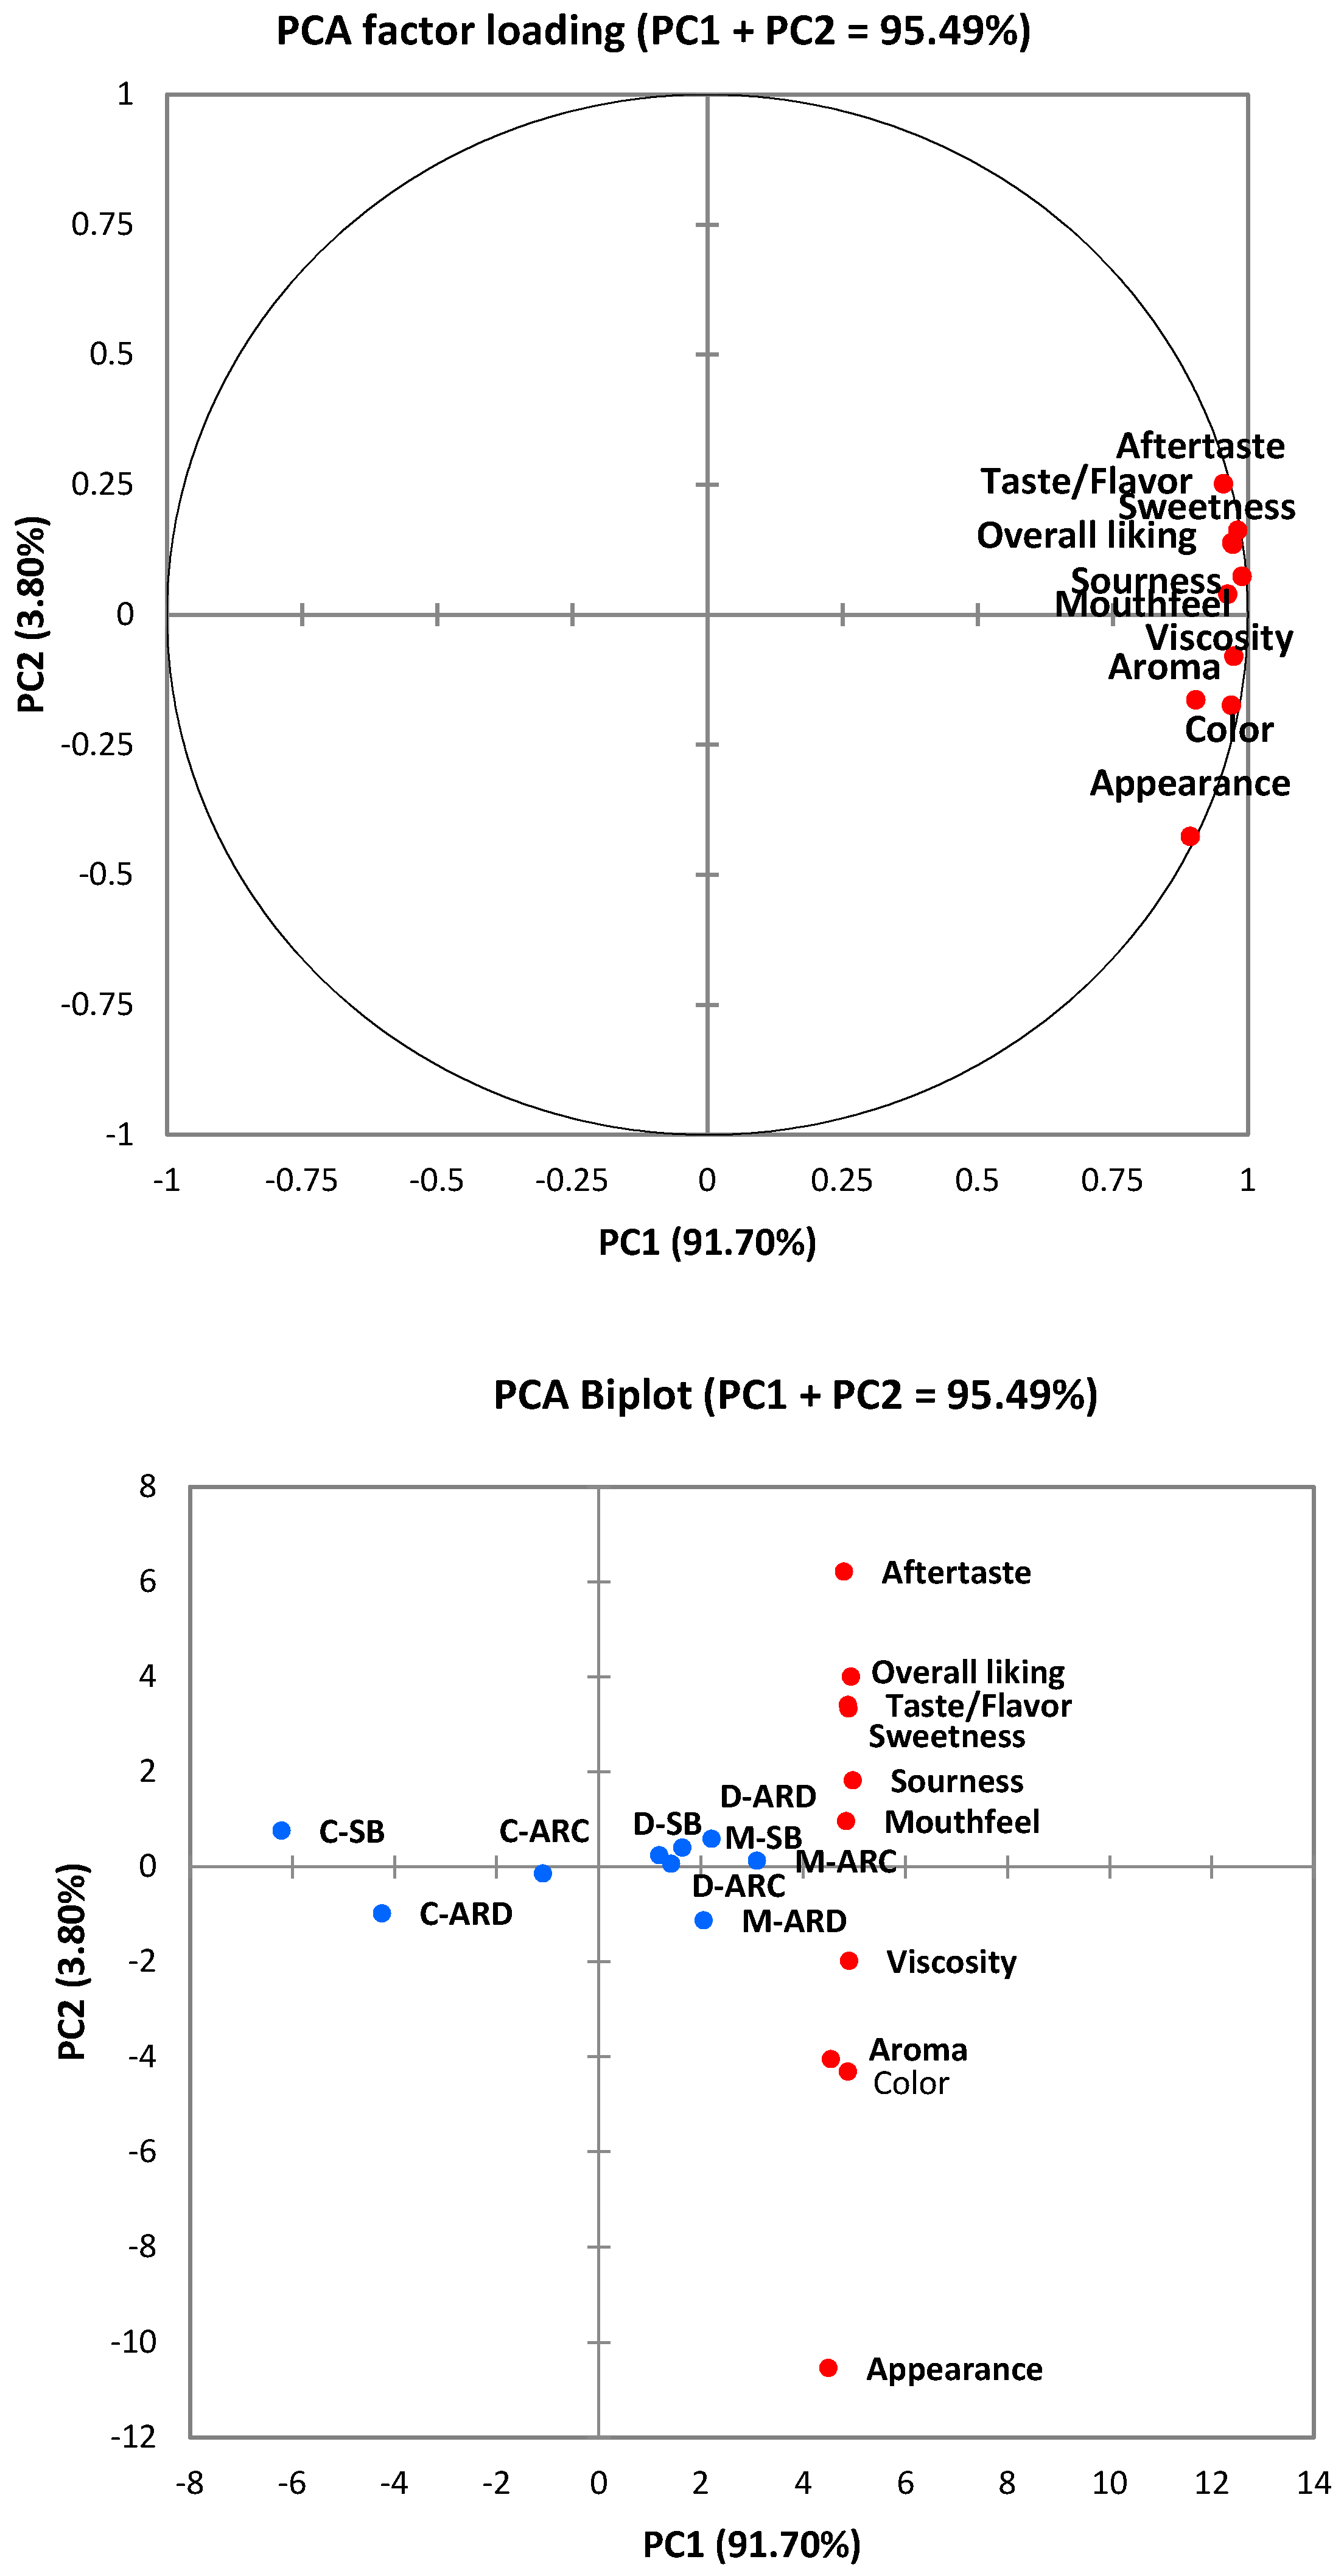
PCA biplot visualized the associations between the nine yogurt × environment combinations and the hedonic scores of the yogurt samples’ ten sensory attributes. According to Figure 5, the PC1 accounted for 91.70% of the data variability, while the PC2 accounted for 3.80%. Both PCs explained 95.49% of total data variability. Liking vectors of most attributes were aligned with the horizontal axis (PC1), with the squared cosines ranging from 0.80 to 0.96. However, the liking vectors of appearance and aftertaste were linked with the vertical axis (PC2), with squared cosines ranging from 0.01 to 0.18. Liking vectors of taste/flavor, sweetness, sourness, mouthfeel, and overall liking were close to each other. Liking vectors of aroma and color were closely associated with viscosity. Besides, the liking vector of appearance was not closely related to color, as both vectors were almost orthogonal. In the case of the different treatments, the dairy and mixed yogurts, regardless of the contextual effects, were highly associated with the liking of mouthfeel, sourness, and viscosity. Moreover, dairy and mixed yogurts were relatively linked with the liking of taste/flavor, sweetness, aroma, color, and overall liking. In contrast, coconut yogurt was negatively associated with the liking of all evaluated attributes under all environments.
Figure 6 shows the dendrogram of the nine yogurt × environment combinations (3 × 3 factorial). Two main cluster groups are presented, which refer to (1) coconut-milk-based yogurt under the sensory booth and AR dairy view, (2) coconut yogurt under AR coconut view, and dairy and mixed yogurts under all environments.
3.6. The Purchase Intent of Yogurt Samples under Different Environments
Table 3 presents the yogurt samples’ frequencies of purchase intent (dairy, coconut, and mixed) under three environments (SB, VRC, and VRD). Both dairy yogurt (61.9–68.3%) and mixed yogurt (63.5–69.8%) showed higher purchase intent than coconut yogurt (41.3–55.6%) regardless of environment. The frequencies of purchase intent were not significantly different among the dairy and mixed yogurts under all contexts. In contrast, the purchase intent of mixed yogurt under ARD was significantly different compared to the coconut yogurt under the ARC and SB. Therefore, consumers would like to buy dairy and mixed yogurts in the market.
3.7. The Results of Consumers Consumption Behaviour on Yogurt
Table 4 shows the results of yogurt-consumption frequencies, reasons for yogurt consumption, and factors that participants consider when purchasing yogurt. For the results of purchase frequencies, about 60.4% of participants selected “two or three times a week” or “sometimes in a week”, while 14.3% of participants consume yogurt every day. The rest of the participants (25.4%) had relatively low yogurt-consumption frequencies. Regarding the reasons for yogurt consumption, 71% of consumers considered “health” and “taste” to be the main reason, followed by “nutrition” (60.3%), “probiotics” (49.2%), “as a habit” (28.6%), and “emotional pleasantness” (15.9%). Approximately 58.7% of consumers selected “price” as the most important factor that affected the purchase intent. “Brand”, “type” (dairy or non-dairy yogurt), and “packaging” of the yogurt were the least selected factors affecting purchase intent, accounting for 28.6%, 20.5%, and 15.9%, respectively. Only 9.5% of consumers were concerned with the factor “locally produced”, and 6.3% of consumers considered “organic” as the most important information that influenced their purchase decision.
4. Discussion
4.1. The Effect of Contexts on Consumer Acceptability of Yogurt Products
A significant interaction between environment and test samples signifies the importance of the stimulus context to the psychophysical judgments in food. Mostly, context affected all modalities or attributes except aroma and sourness. The overall mild, sweet impression of most yogurt aroma types could be responsible for this finding. The aroma as a stimulus may be lost in the high contextual effects of AR. No effect of context in the case of sourness may be attributed to the intensity of surprise bestowed by the acidity of sour stimuli. The sourness has been previously related to high-pitch sounds and angular shapes [34]. Physiologically, sourness has been found related to increased blood flow in the face [35], higher heart rate [36], and muscular concentration [37]. This strong context-less intensity of sourness leads towards stimulus-specific deliberations, which may also be related to survival instincts; for instance, conveying the detection of elements of microbe [38]. However, in general, consumers significantly liked dairy-based or mixed yogurts over coconut-based yogurts. Participants with a natural aversion to coconut smell or flavor perceived that coconut-flavored food products were unacceptable regardless of the different contexts [16].
Under sensory booths, the liking score of the taste, sweetness, mouthfeel, and viscosity differed significantly among yogurt types, whereas the liking scores of those attributes were not significantly different under ARD and ARC. This might be explained because sensory booths are isolated environments that allow participants to focus on the tasting task, and sensory differences are more evident in these contexts [16]. In this study, the liking scores of coconut yogurts for all sensory attributes under the two AR contexts (dairy and coconut) were higher compared to those scores under the sensory booths. This might reflect the enhancing effects of immersive technologies on the hedonic responses of consumers towards food products [6]. In contrast, Bangcuyo et al. [39] revealed that participants showed more discrimination in the immersive coffeehouse than the sensory booths. Overall, stimulus-specific contextual settings should not be overlooked; building on the significant interactions found between context and stimuli in this and other studies, critical insights into the intended consumer behaviors can be found.
4.2. JAR Results
Context primed consumers to desire more coconut and dairy flavors in their respective contexts in the case of coconut- and dairy-based yogurts (Figure 2a,b). This congruent priming of consumers’ mental states has been previously reported by others [37,40], and it is frequently used by marketers through advertisement campaigns. The priming of consumers’ mental states through context leads consumers to expect something relevant. Additionally, context-incongruent probing of coconut flavor in dairy-based yogurts was an unintentional act laid out by less coconut flavor (Figure 2b), which should be avoided in most if not all cases. Thanks to this, coconut flavor appeared as a polarized attribute, penalizing for both “too strong” and “too weak” in most cases (Figure 2). This may also be due to consumers having no agreement on their ideal level, i.e., one segment preferring a weaker level while another segment preferring a stronger level. For instance, about 6–46% of consumers perceived coconut yogurt as being “too strong” in coconut flavor, while 16–57% of consumers selected “too weak” in coconut flavor (Figure 2a). The mixed yogurts (half coconut and half dairy yogurts) obtained the highest JAR scores (varied from 51% to 79%) for all attributes (sweetness, sourness, dairy flavor, coconut flavor, and mouthfeel) under the three contexts, and this might be due to the balance of flavors in this yogurt.
4.3. Attribute Terms and Emotional Responses of Yogurts
The results of the correspondence analysis regarding the CATA attribute terms of the yogurt samples under different contexts showed that the same-type yogurts were close to each other when considering all sensory characteristics (such as C-SB, C-ARC, and C-ARD; D-SB, D-ARC, and D-ARD; M-SB, M-ARC, and ARD). The layout of the nine test samples in the plot was mainly dependent on the yogurt type rather than on the context. As shown in Figure 3, the dairy and mixed yogurts were linked to textural terms, including “homogeneous”, “smooth”, “sweet”, and “creamy”. Previously, those terms were also used to describe the desired texture in yogurts using premium and private labels [22]. In addition, the principal coordinate analysis proved the positive association between those attribute terms and overall liking. On the contrary, coconut yogurts were associated with “firm”, “sour”, and “astringent”, which had a negative association with the overall liking. These findings confirm that textural and mouthfeel properties can have a significant effect on the acceptability of yogurt products [41].
In the context of emotional responses, the environments showed a more dissociative layout of yogurt samples (Figure 4). Before interpreting the superimposed representation of rows and columns in Figure 4, it would be worthy to mention that points closer to the origin contribute little to the derived space [42]. Ten positive, two negative, and two neutral emotional terms were the most frequent among consumers. All coconut-based samples are located in the right quadrants of the plot, whereas mostly all other samples are on the left side of the correspondence plot. The closeness of treatments indicates that those have either similar row or column profiles, meaning that they are related. Similarly, emotional terms clustered in the middle of the correspondence map have either similar row or column profiles. The position of D-ARC associates it with negative terms, such as “aggressive” and “disgusted”. The incongruent context types, such as in the case of C-ARD and D-ARC, may be responsible for this layout. Previously, Bangcuyo et al. [39] used more comparable environments, such as “VR-dark coffee shop” and “VR-bright coffee shop”, concerning one sample type, whereas here, we used two context types in two different sample types. Realizing the importance of context in food-consumption settings, it should be also kept in mind that yogurts are never consumed in dairy parlors as compared to other products, such as the case of coffee or beer, so the use of the context here was to demonstrate the effects of AR elements on the tasting experience.
4.4. Purchase Intent and Consumption Behaviors
Health, taste, and nutrition were the most frequent reasons for purchasing yogurt. Not surprisingly, the above findings reflect consumers’ perceptions of different yogurts. Dairy and mixed yogurts are sweet, homogenous, creamy, smooth, and fruity, while the coconut yogurt is astringent, sour, and thick. For the most important factor when purchasing yogurts, interestingly, the majority of participants selected “price” in the first place. Besides, “brand” and “type of yogurt” were also important factors for consumers when selecting a particular yogurt. Familiarity with the products can have a significant effect on the purchase decision of consumers [43]. If the consumers do not belong to a special population cohort (for instance, vegan/vegetarian), they will probably purchase dairy yogurts with desirable sensory attributes. Therefore, the above reasons could potentially explain why coconut yogurt’s purchase intent was lower than the dairy and mixed yogurts regardless of the effects of context.
5. Limitations
The limited number of partakers was a limitation of this study, which may pose constraints in generalizing these results. Still, this work gives an insight into the first-of-its-kind approach for the investigation of augmented reality in a fast-changing scientific worldview to include context. A more segregated sample size of higher number and congruent context type would be a further next step to follow.
6. Conclusions
The study investigated the consumer acceptability, JAR attributes, emotional response, purchase intent, and consumer purchase behaviors on coconut-milk-based, dairy, and mixed yogurts (half coconut and dairy) under three environments (sensory booth, AR coconut view, and AR dairy view). The augmented reality technique was explored in this study to create test environments for yogurts. A significant interaction effect between yogurt type and environment was observed in most sensory attributes. Dairy and mixed yogurts were significantly linked to attributes associated with liking scores, such as “sweet”, “smooth”, and “creamy”, while coconut yogurt was described with attributes against overall liking in terms of “astringent”, “thin”, and “sour”. Taste/flavor and health were the most important reasons to determine the purchase intent of yogurts. Moreover, dairy and mixed yogurts’ purchase intents were higher than that of the non-dairy yogurt regardless of environment. Compared to virtual reality, one obvious advantage of AR technology was the seamless combination of the real environment with different virtual elements. Besides, AR has a significant potential to develop practical, advanced mixed-immersive applications in the food industry.
Author Contributions
Conceptualization, D.D.T. and Y.D.; methodology, D.D.T. and Y.D.; formal analysis, Y.D.; investigation, Y.D.; data curation, Y.D.; writing—original draft preparation, Y.D.; writing—review and editing, Y.D., D.D.T., A.M., and C.S.; supervision, D.D.T., and C.S.; project administration, D.D.T.; funding acquisition, D.D.T. All authors have read and agreed to the published version of the manuscript.
Funding
This research was funded by Lincoln University, New Zealand, through the Centre of Excellence-Food for Future Consumers.
Institutional Review Board Statement
The study was conducted according to the guidelines of the Declaration of Helsinki, and approved by the Human Ethics Committee of Lincoln University (Approval: 2019-68, date of approval 18-11-2019).
Informed Consent Statement
Informed consent was obtained from all subjects involved in the study.
Data Availability Statement
The data presented in this study are available on request from the corresponding author.
Acknowledgments
I would like to acknowledge all the subjects who participated in the sensory study.
Conflicts of Interest
The authors declare no conflict of interest. The funders had no role in the design of the study; in the collection, analyses, or interpretation of data; in the writing of the manuscript, or in the decision to publish the results.
References
- Irzik, G.; Nola, R. Worldviews and their relation to science. In Science, Worldviews and Education; Matthews, M.R., Ed.; Springer: Dordrecht, The Netherlands, 2009; pp. 81–97. [Google Scholar]
- Chapman, C.A.; Huffman, M.A. Why do we want to think humans are different? Anim. Sentience 2018, 3. [Google Scholar] [CrossRef]
- Sillar, B. The social agency of things? Animism and materiality in the Andes. Camb. Archaeol. J. 2009, 19, 367–377. [Google Scholar] [CrossRef]
- Rout, M.; Reid, J. Embracing indigenous metaphors: A new/old way of thinking about sustainability. Sustain. Sci. 2020, 15, 945–954. [Google Scholar] [CrossRef]
- Jaeger, S.; Hort, J.; Porcherot, C.; Ares, G.; Pecore, S.; MacFie, H. Future directions in sensory and consumer science: Four perspectives and audience voting. Food Qual. Prefer. 2017, 56, 301–309. [Google Scholar] [CrossRef]
- Torrico, D.D.; Sharma, C.; Dong, W.; Fuentes, S.; Viejo, C.G.; Dunshea, F.R. Virtual reality environments on the sensory acceptability and emotional responses of no-and full-sugar chocolate. LWT 2020, 137, 110383. [Google Scholar] [CrossRef]
- Wedel, M.; Bigné, E.; Zhang, J. Virtual and augmented reality: Advancing research in consumer marketing. Int. J. Res. Mark. 2020, 37, 443–465. [Google Scholar] [CrossRef]
- Das, S.M.; Sridhara, V.; Khorashadi, B. Systems and Methods Involving Augmented Menu Using Mobile Device. U.S. Patent No. 9,179,278, 3 November 2015. [Google Scholar]
- Crofton, E.C.; Botinestean, C.; Fenelon, M.; Gallagher, E. Potential applications for virtual and augmented reality technologies in sensory science. Innov. Food Sci. Emerg. Technol. 2019, 56, 102178. [Google Scholar] [CrossRef]
- Kong, Y.; Sharma, C.; Kanala, M.; Thakur, M.; Li, L.; Xu, D.; Harrison, R.; Torrico, D.D. Virtual Reality and Immersive Environments on Sensory Perception of Chocolate Products: A Preliminary Study. Foods 2020, 9, 515. [Google Scholar] [CrossRef] [Green Version]
- Sinesio, F.; Moneta, E.; Porcherot, C.; Abbà, S.; Dreyfuss, L.; Guillamet, K.; Bruyninckx, S.; Laporte, C.; Henneberg, S.; McEwan, J.A. Do immersive techniques help to capture consumer reality? Food Qual. Prefer. 2019, 77, 123–134. [Google Scholar] [CrossRef]
- Zandstra, E.; Kaneko, D.; Dijksterhuis, G.; Vennik, E.; De Wijk, R. Implementing immersive technologies in consumer testing: Liking and Just-About-Right ratings in a laboratory, immersive simulated café and real café. Food Qual. Prefer. 2020, 84, 103934. [Google Scholar] [CrossRef]
- Sinesio, F.; Saba, A.; Peparaio, M.; Civitelli, E.S.; Paoletti, F.; Moneta, E. Capturing consumer perception of vegetable freshness in a simulated real-life taste situation. Food Res. Int. 2018, 105, 764–771. [Google Scholar] [CrossRef] [PubMed]
- Ammann, J.; Stucki, M.; Siegrist, M. True colours: Advantages and challenges of virtual reality in a sensory science experiment on the influence of colour on flavour identification. Food Qual. Prefer. 2020, 86, 103998. [Google Scholar] [CrossRef]
- Gutiérrez, F.; Htun, N.N.; Charleer, S.; De Croon, R.; Verbert, K. Designing augmented reality applications for personal health decision-making. In Proceedings of the 52nd Hawaii International Conference on System Sciences, Maui, HI, USA, 8–11 January 2019. [Google Scholar]
- Lawless, H.T.; Heymann, H. Sensory Evaluation of Food: Principles and Practices; Springer Science & Business Media: New York, NY, USA, 2010. [Google Scholar]
- Li, B.; Hayes, J.E.; Ziegler, G.R. Just-about-right and ideal scaling provide similar insights into the influence of sensory attributes on liking. Food Qual. Prefer. 2014, 37, 71–78. [Google Scholar] [CrossRef] [Green Version]
- Chetachukwu, A.S.; Thongraung, C.; Yupanqui, C.T. Development of reduced-fat coconut yoghurt: Physicochemical, rheological, microstructural and sensory properties. Int. J. Dairy Technol. 2019, 72, 524–535. [Google Scholar] [CrossRef]
- Jaeger, S.R.; Lee, P.Y.; Xia, Y.; Chheang, S.L.; Roigard, C.M.; Ares, G. Using the emotion circumplex to uncover sensory drivers of emotional associations to products: Six case studies. Food Qual. Prefer. 2019, 77, 89–101. [Google Scholar] [CrossRef]
- Janiaski, D.; Pimentel, T.; Cruz, A.; Prudencio, S. Strawberry-flavored yogurts and whey beverages: What is the sensory profile of the ideal product? J. Dairy Sci. 2016, 99, 5273–5283. [Google Scholar] [CrossRef]
- Gutjar, S.; de Graaf, C.; Kooijman, V.; de Wijk, R.A.; Nys, A.; ter Horst, G.J.; Jager, G. The role of emotions in food choice and liking. Food Res. Int. 2015, 76, 216–223. [Google Scholar] [CrossRef]
- Schouteten, J.J.; De Steur, H.; Sas, B.; De Bourdeaudhuij, I.; Gellynck, X. The effect of the research setting on the emotional and sensory profiling under blind, expected, and informed conditions: A study on premium and private label yogurt products. J. Dairy Sci. 2017, 100, 169–186. [Google Scholar] [CrossRef] [Green Version]
- Nestrud, M.A.; Meiselman, H.L.; King, S.C.; Lesher, L.L.; Cardello, A.V. Development of EsSense25, a shorter version of the EsSense Profile®. Food Qual. Prefer. 2016, 48, 107–117. [Google Scholar] [CrossRef]
- Sketchfab. Available online: https://sketchfab.com/3d-models/palms-f34a5b4ccc774d68b9fc51b3e59690db (accessed on 28 November 2020).
- Sketchfab. Available online: https://sketchfab.com/3d-models/coconut-b68fd365187f45cf843e316d2ea23260 (accessed on 29 November 2020).
- Pixabay. Available online: https://pixabay.com/photos/palm-trees-trees-tropical-palm-4968319/ (accessed on 29 November 2020).
- YouTube. Available online: https://www.youtube.com/watch?v=QX4j_zHAlw8&t=146s (accessed on 29 November 2020).
- Sketchfab. Available online: https://sketchfab.com/3d-models/cow-99d333e3b4e4470a8d7d38436489c001 (accessed on 28 November 2020).
- Sketchfab. Available online: https://sketchfab.com/3d-models/milk-5e8d71045e2040ba8f6619d86d204cf5 (accessed on 28 November 2020).
- Pixabay. Available online: https://pixabay.com/photos/cows-pasture-land-animals-meadow-3636937/ (accessed on 29 November 2020).
- YouTube. Available online: https://www.youtube.com/watch?v=KjmuBo8xoCU (accessed on 29 November 2020).
- Meullenet, J.F.; Xiong, R.; Findlay, C.J. Multivariate and Probabilistic Analyses of Sensory Science Problems; John Wiley & Sons: Hoboken, NJ, USA, 2008; Volume 25. [Google Scholar]
- Pagès, J.; Berthelo, S.; Brossier, M.; Gourret, D. Statistical penalty analysis. Food Qual. Prefer. 2014, 32, 16–23. [Google Scholar] [CrossRef]
- Velasco, C.; Salgado-Montejo, A.; Marmolejo-Ramos, F.; Spence, C. Predictive packaging design: Tasting shapes, typefaces, names, and sounds. Food Qual. Prefer. 2014, 34, 88–95. [Google Scholar] [CrossRef]
- Kashima, H.; Hayashi, N. Basic taste stimuli elicit unique responses in facial skin blood flow. PLoS ONE 2011, 6, e28236. [Google Scholar] [CrossRef] [PubMed]
- Robin, O.; Rousmans, S.; Dittmar, A.; Vernet-Maury, E. Gender influence on emotional responses to primary tastes. Physiol. Behav. 2003, 78, 385–393. [Google Scholar] [CrossRef]
- Pomirleanu, N.; Gustafson, B.M.; Bi, S. Ooh, that’s sour: An investigation of the role of sour taste and color saturation in consumer temptation avoidance. Psychol. Mark. 2020, 37, 1068–1081. [Google Scholar] [CrossRef]
- Strohminger, N. Disgust talked about. Philos. Compass 2014, 9, 478–493. [Google Scholar] [CrossRef]
- Bangcuyo, R.G.; Smith, K.J.; Zumach, J.L.; Pierce, A.M.; Guttman, G.A.; Simons, C.T. The use of immersive technologies to improve consumer testing: The role of ecological validity, context and engagement in evaluating coffee. Food Qual. Prefer. 2015, 41, 84–95. [Google Scholar] [CrossRef]
- Campbell, M.C.; Manning, K.C.; Leonard, B.; Manning, H.M. Kids, cartoons, and cookies: Stereotype priming effects on children’s food consumption. J. Consum. Psychol. 2016, 26, 257–264. [Google Scholar] [CrossRef]
- Gupta, M.; Torrico, D.D.; Hepworth, G.; Gras, S.L.; Ong, L.; Cottrell, J.J.; Dunshea, F.R. Differences in Hedonic Responses, Facial Expressions and Self-Reported Emotions of Consumers Using Commercial Yogurts: A Cross-Cultural Study. Foods 2021, 10, 1237. [Google Scholar] [CrossRef] [PubMed]
- Sharma, C.; Swaney-Stueve, M.; Severns, B.; Talavera, M. Using correspondence analysis to evaluate consumer terminology and understand the effects of smoking method and type of wood on the sensory perception of smoked meat. J. Sens. Stud. 2019, 34, e12535. [Google Scholar] [CrossRef]
- Torrico, D.D.; Fuentes, S.; Viejo, C.G.; Ashman, H.; Dunshea, F.R. Cross-cultural effects of food product familiarity on sensory acceptability and non-invasive physiological responses of consumers. Food Res. Int. 2019, 115, 439–450. [Google Scholar] [CrossRef]
Figure 1.
Contextual settings (environments) for sensory evaluation of yogurt samples. (a) Sensory booth, (b) AR coconut view, (c) AR dairy view, (d) HoloLens 2 headset.
Figure 1.
Contextual settings (environments) for sensory evaluation of yogurt samples. (a) Sensory booth, (b) AR coconut view, (c) AR dairy view, (d) HoloLens 2 headset.

Figure 2.
Just-about-right (JAR) frequencies and penalty analysis results of sensory attributes (-, too little; +, too much) of (a) coconut, (b) dairy, and (c) mixed yogurts under SB, AR1, and AR2. The description of the treatment’s labels can be found in the footnote of Table 2.
Figure 2.
Just-about-right (JAR) frequencies and penalty analysis results of sensory attributes (-, too little; +, too much) of (a) coconut, (b) dairy, and (c) mixed yogurts under SB, AR1, and AR2. The description of the treatment’s labels can be found in the footnote of Table 2.


Figure 3.
(a) Correspondence analysis of the CATA attribute terms for the yogurts under the different environments and (b) principal coordinate analysis of the CATA descriptive terms with the overall liking score (OL). The description of the treatment’s labels can be found in the footnote of Table 2.

Figure 4.
(a) Correspondence analysis of the emotional terms for the yogurts under the different environments, (b) principal coordinate analysis of the emotional terms with the overall liking score, and (c) correspondence analysis of the merged results from the attributes and emotions of the yogurt samples. The description of the treatment’s labels can be found in the footnote of Table 2.


Figure 5.
Principal component analysis (PCA) biplot regarding hedonic scores of yogurt attributes under the three contextual settings. The description of the treatment’s labels can be found in the footnote of Table 2.
Figure 5.
Principal component analysis (PCA) biplot regarding hedonic scores of yogurt attributes under the three contextual settings. The description of the treatment’s labels can be found in the footnote of Table 2.

Figure 6.
Dendrogram of agglomerative hierarchical clustering (AHC) grouping yogurt samples under the different environments. Different colored lines indicate different groups of yogurt samples given by AHC analysis. The description of the treatment’s labels can be found in the footnote of Table 2.
Figure 6.
Dendrogram of agglomerative hierarchical clustering (AHC) grouping yogurt samples under the different environments. Different colored lines indicate different groups of yogurt samples given by AHC analysis. The description of the treatment’s labels can be found in the footnote of Table 2.


Table 1.
The Q- and p-values summary (α = 0.05) of the Friedman analysis from the sensory attributes on yogurt samples under different environments.
Table 1.
The Q- and p-values summary (α = 0.05) of the Friedman analysis from the sensory attributes on yogurt samples under different environments.
| Effects | Acceptability Attributes | |||||||||
|---|---|---|---|---|---|---|---|---|---|---|
| Appearance | Color | Aroma | Taste/Flavor | Sweetness | ||||||
| Q-Value | p-Value | Q-Value | p-Value | Q-Value | p-Value | Q-Value | p-Value | Q-Value | p-Value | |
| Yogurt | 8.20 | 0.02 | 12.27 | <0.01 | 7.73 | 0.02 | 18.05 | <0.01 | 15.00 | <0.01 |
| Environment | 4.70 | 0.10 | 0.57 | 0.75 | 1.31 | 0.52 | 0.05 | 0.98 | 2.51 | 0.29 |
| Yogurt × Env. | 16.75 | 0.03 | 14.95 | 0.06 | 12.29 | 0.14 | 27.00 | <0.01 | 22.02 | <0.01 |
| Effects | Acceptability Attributes | |||||||||
| Sourness | Mouthfeel | Viscosity | Aftertaste | Overall Liking | ||||||
| Q-Value | p-Value | Q-Value | p-Value | Q-Value | p-Value | Q-Value | p-Value | Q-Value | p-Value | |
| Yogurt | 7.19 | 0.03 | 11.80 | <0.01 | 12.07 | <0.01 | 18.06 | <0.01 | 21.53 | <0.01 |
| Environment | 2.73 | 0.26 | 1.54 | 0.46 | 2.14 | 0.34 | 4.31 | 0.12 | 4.70 | 0.10 |
| Yogurt × Env. | 10.84 | 0.21 | 19.88 | 0.01 | 14.93 | 0.06 | 22.35 | <0.01 | 25.09 | <0.01 |
Table 2.
Results of the Nemenyi analysis (α = 0.05) on four attributes for nine yogurt treatments (critical difference: 1.53).
Table 2.
Results of the Nemenyi analysis (α = 0.05) on four attributes for nine yogurt treatments (critical difference: 1.53).
| Attribute | Yogurt | Environment | ||
|---|---|---|---|---|
| SB | ARC | ARD | ||
| Appearance | C | 4.08 b | 4.89 ab | 4.88 ab |
| D | 5.03 ab | 5.22 ab | 5.06 ab | |
| M | 4.90 ab | 5.15 ab | 5.79 a | |
| Taste/Flavor | C | 4.06 b | 4.60 ab | 4.22 ab |
| D | 5.71 a | 4.98 ab | 5.29 ab | |
| M | 5.65 a | 5.37 ab | 5.10 ab | |
| Sweetness | C | 4.06 b | 4.90 ab | 4.28 ab |
| D | 5.15 ab | 5.08 ab | 5.44 ab | |
| M | 5.37 ab | 5.64 a | 5.10 ab | |
| Overall liking | C | 4.08 b | 4.87 ab | 4.13 ab |
| D | 5.12 ab | 5.24 ab | 5.62 a | |
| M | 5.25 ab | 5.58 ab | 5.11 ab | |
Data displayed as mean ranks; the different letters within each attribute mean significant difference (p < 0.05). C-SB, coconut-milk-based yogurt in the sensory booth; D-SB, dairy yogurt in the sensory booth; M-SB, Mixed yogurt (50% dairy yogurt and 50% coconut-milk-based yogurt) in the sensory booth; C-ARC, coconut-milk-based yogurt in AR coconut view; D-ARC, dairy yogurt in AR coconut view; M-ARC, mixed yogurt in AR coconut view; C-ARD, coconut-milk-based yogurt in AR dairy view; D-ARD, dairy yogurt in AR dairy view; M-ARD, mixed yogurt in AR dairy view.
Table 3.
The purchase-intent frequencies of yogurt samples under three contextual environments.
| Variable | Yogurt 1 | Environment 1 | ||
|---|---|---|---|---|
| SB | ARC | ARD | ||
| Purchase Intent (%) 2 | C | 41.3 c | 42.9 bc | 55.6 abc |
| D | 68.3 ab | 68.3 ab | 61.9 abc | |
| M | 63.5 abc | 66.7 abc | 69.8 a | |
1 Dairy yogurt (D), non-dairy yogurt (coconut-based yogurt; C), and mixed yogurt (50% dairy yogurt and 50% non-dairy yogurt; M) were tested under environments (SB, sensory booth; ARC, AR coconut view; ARD, AR dairy view). 2 Cochran’s Q test with Marascuilo procedure was applied for multiple pairwise comparisons (n = 63); frequencies with different superscript (a, b, c) in the purchase-intent table indicate significant differences (p < 0.05).
Table 4.
Factors affecting consumers’ consumption of yogurts and behaviors.
| Frequencies of Yogurt Consumption | Percentage (%) |
|---|---|
| Everyday | 14.3 |
| Two or three times a week | 30.2 |
| Sometimes in a week | 30.2 |
| Two or three times a month | 12.7 |
| Sometimes in a month | 11.1 |
| Occasionally | 1.6 |
| Reasons for Yogurt Consumption | Percentage (%) |
| Health | 71.4 |
| Taste | 71.4 |
| Nutrition | 60.3 |
| Probiotics | 49.2 |
| As a habit | 28.6 |
| Emotional pleasantness | 15.9 |
| Factor Considered most When Purchasing Yogurt | Percentage (%) |
| Price | 58.7 |
| Brand | 28.6 |
| Type (dairy yogurt or non-dairy yogurt) | 20.6 |
| Packaging | 15.9 |
| Locally produced | 9.5 |
| Organic | 6.3 |
Publisher’s Note: MDPI stays neutral with regard to jurisdictional claims in published maps and institutional affiliations. |
© 2021 by the authors. Licensee MDPI, Basel, Switzerland. This article is an open access article distributed under the terms and conditions of the Creative Commons Attribution (CC BY) license (https://creativecommons.org/licenses/by/4.0/).
Share and Cite
MDPI and ACS Style
Dong, Y.; Sharma, C.; Mehta, A.; Torrico, D.D. Application of Augmented Reality in the Sensory Evaluation of Yogurts. Fermentation 2021, 7, 147. https://0-doi-org.brum.beds.ac.uk/10.3390/fermentation7030147
AMA Style
Dong Y, Sharma C, Mehta A, Torrico DD. Application of Augmented Reality in the Sensory Evaluation of Yogurts. Fermentation. 2021; 7(3):147. https://0-doi-org.brum.beds.ac.uk/10.3390/fermentation7030147
Chicago/Turabian StyleDong, Yanyu, Chetan Sharma, Annu Mehta, and Damir D. Torrico. 2021. "Application of Augmented Reality in the Sensory Evaluation of Yogurts" Fermentation 7, no. 3: 147. https://0-doi-org.brum.beds.ac.uk/10.3390/fermentation7030147
Note that from the first issue of 2016, this journal uses article numbers instead of page numbers. See further details here.