Article

Effect of Temperature and Time on Oxygen Consumption by Olive Fruit: Empirical Study and Simulation in a Non-Ventilated Container

by
Eddy Plasquy
1,*,
María C. Florido
2,
Rafael Rubén Sola-Guirado
3,
José María García Martos
1 and
Juan Francisco García Martín
4,*
1
Department of Biochemistry and Technology of Plant Foods, Instituto de la Grasa, Spanish National Research Council, Ctra. Sevilla Utrera, km 1, Edifice 46, 41013 Seville, Spain
2
Department of Crystallography, Mineralogy and Agricultural Chemistry, Escuela Técnica Superior de Ingeniería Agronómica, Universidad de Sevilla, Ctra. Sevilla Utrera, km 1, 41013 Seville, Spain
3
Department of Mechanic, Campus Rabanales, University of Córdoba, Ed. Leonardo Da Vinci, Ctra. Nacional IV, km 396, 14014 Córdoba, Spain
4
Departamento de Ingeniería Química, Facultad de Química, Universidad de Sevilla, 41012 Seville, Spain
*
Authors to whom correspondence should be addressed.
Submission received: 1 September 2021 / Revised: 15 September 2021 / Accepted: 20 September 2021 / Published: 23 September 2021
(This article belongs to the Special Issue Implementation of Digital Technologies on Beverage Fermentation)

Abstract

:
Fermentation processes within olive fruit jeopardize the quality of the extracted oil. Aeration, temperature, and time play a crucial role in attaining the critical threshold at which an aerobic respiration shifts towards anaerobic. In this work, the O2 consumption and CO2 production of olive fruit kept in a closed container at different temperatures (5–45 °C) were measured over 7 h. The data allowed us to describe the relationship between the temperature and the respiration rate as an Arrhenius function and simulate the oxygen consumption in the inner part of a container full of fruit with low aeration, considering the generated respiration heat over time. The simulation revealed that olives risk shifting to anaerobic respiration after 3 h at 25 °C and less than 2 h at 35 °C when kept in a non-ventilated environment. The results underline the irreversible damage that high day temperatures can produce during the time before fruit processing, especially during transport. Lowering, as soon as possible, the field temperature thus comes to the fore as a necessary strategy to guarantee the quality of the olives before their processing, like most of the fruit that is harvested at excessive temperatures.

1. Introduction

Currently, the implementation of super high-density hedgerow orchards is accelerating at a fast rate. For example, it increased roughly 116% in Spain in 2016 when compared to 2015 [1]. While still being a fraction of the 1.5 Mha cultivated in Andalusia (the world’s leading olive-producing region), the shift towards fully mechanized harvesting and pruning is setting [2]. The ‘Arbequina’ cv. is currently by far the most established (90%) variety in super high-density hedgerow orchards, along with ‘Arbosana’, ‘Koroneiki’, and the recently introduced ‘Sikitita’ [3,4]. These cultivars are characterized by an early ripening that starts early November. However, the season often starts several weeks earlier because extra virgin olive oil (EVOO) with the highest quality is achieved from green olives. Consequently, harvesting is carried out in a period when the day temperatures are well above 30 °C. It can be expected that olive production will cope with major and profound challenges according to the predictions of climate change in the Mediterranean Basin [5,6,7,8]. The flowering and ripening of the fruit are expected to be brought forward, so it is necessary to start the harvest earlier to obtain an optimal quality of oil [9,10,11,12].
Harvesting under these conditions implies that the temperature of the fruit can quickly attain excessive levels, especially when the fruit are collected in containers or trailers that are fully exposed to the sun. Temperature is considered to be the most important factor affecting postharvest shelf-life, along with atmospheric composition and physical stress [13]. Within the physiological temperature range of most crops (0–30 °C), higher temperatures cause an exponential rise in respiration. Aerobic respiration involves three interconnected metabolic pathways: glycolysis, the Krebs or tricarboxylic acid (TCA) cycle, and oxidative phosphorylation. During glycolysis, pyruvate is produced out of glucose, which is then further broken down in the TCA cycle to produce CO2, flavin adenine dinucleotide (FADH2), and nicotinamide adenine dinucleotide (NADH). During the electron transfer, the energy contained in NADH and FADH2 is released, producing two and three adenosine triphosphate (APT) molecules, respectively. In the absence of O2, NADH and FADH2 are accumulated, and the concentration of the oxidized forms (NAD+ and FAD) decreases. The TCA cycle is interrupted, and glycolysis becomes the only way to obtain ATP. The regeneration of NAD+ in the absence of oxygen takes place through fermentative metabolism by the reductive decarboxylation of pyruvate to ethanol. The shift from predominantly aerobic to predominantly anaerobic respiration is known as the anaerobic compensation point or the fermentative threshold and varies the gas diffusion and respiration rates within the different tissues [13]. Values between 1.5 and 3.5% of O2 have been reported for apples and mushrooms, respectively, as the critical limit at which an increased CO2 production marks the offset of an anaerobic respiration [14].
The fermentative processes in olives provokes the development of negative sensory attributes, such as winey, vinegary or muddy sediment, in the resulting olive oils. This means that these oils cannot be commercially considered as EVOO. The presence of alcohols such as methanol or ethanol facilitates the esterification of free fatty acids and the formation of fatty acid alkyl esters (FAAE) in olive oil, the presence of which shows that the olives have undergone a fermentation process [15]. Other causes of oil deterioration such as oxidation or freezing do not induce the increase of these compounds [16]. Methanol can also be formed by the metabolization of pectin from the cell wall during olive ripening, while ethanol can have this origin only in some very specific varieties, so its formation is more related to fermentation [17]. As a consequence, the presence of fatty acid ethyl esters (FAEE) was considered in 2013 as a marker of oil deterioration and is included in the European Union Regulation of olive oil quality.
The hydrolytic and oxidative deterioration of olive fruit is strongly influenced by inappropriate practices during its harvest, storage and transport to industry. The content of ethanol was significantly higher in ground-picked olives than in fruit harvested directly from the tree, although the concentration of FAEE in the extracted oil stayed below the official EVOO limit [18]. Jabeur et al. showed that a relevant factor to explain high levels of FAEE in stored olives is the type of container used for post-harvest storage, reporting higher levels in closed plastic bags than in perforated plastic boxes [19]. Although the fruit in closed plastic bags was brought under conditions of increased asphyxiation, no record was kept of their actual O2 consumption or CO2 production during the storage at room temperature up to 25 days. As the fruit was kept at room temperature, no effect of the temperature on the respiration rate was studied, either.
The available O2 and the storage temperature are both equally important factors in the formation of ethanol in the fruit [20]. Beltrán et al. measured a six-fold increase in ethanol content for both washed and unwashed olive fruit after 12 h of storage in silos, although without reporting the storage temperature [21]. The production of ethanol is directly related to anaerobic respiration, while the temperature has a direct impact on the rate of respiration [21]. In conditions where ventilation is hindered, high temperatures will speed up respiration by generating more heat and accelerating the consumption of oxygen. Ultimately, when all the available oxygen is consumed, anaerobic respiration will take place. It can thus be expected that, in a closed system, the higher the respiration rate, the earlier the processes of fermentation will start to produce ethanol. Thus far, the respiration rate of olive fruit was studied jointly with its ethylene production to document the effects of cold storage on olive fruit [22,23,24,25,26]. Only one study reported the respiration rate and the physicochemical changes that occur in olive fruit picked for table olives and exposed to air at temperatures between 10 and 40 °C [27]. The respiration quotient or the ratio of CO2 produced to O2 consumed varied between 2.5 and 1.3 for the Gordal cultivar, and between 2.2 and 1.2 for the ‘Manzanilla’ cv. However, the experiment took place in an open system, so the evolution of the oxygen consumption was not taken into consideration.
The rates of gas diffusion and respiration may vary significantly when the fruit are piled up, as when olives are collected and transported in large containers. Under such conditions, some olives in the containers risk becoming anaerobic while others remain aerobic. The reduction of O2 in the storage atmosphere, which determines the ethanol formation threshold of olive fruit in an unventilated environment, has never been determined thus far. This study aims to determine experimentally the time at which the olive fruit attains this formation threshold when kept in a closed system at distinct temperatures.

2. Materials and Methods

2.1. Olive Samples

Roughly 5 kg of olive fruits (‘Picual’ variety) were hand-picked at a farm in Bollullos par del Condado (Spain) in November 2019, and immediately brought to the facilities of the Instituto de la Grasa (Spanish National Research Council, Seville, Spain) in a perforated plastic box. The olives were healthy, without any visible infection or bruising, and green (ripening index 2.3). On arrival, the fruit was stored in a refrigerator set at 5 °C (±1 °C).

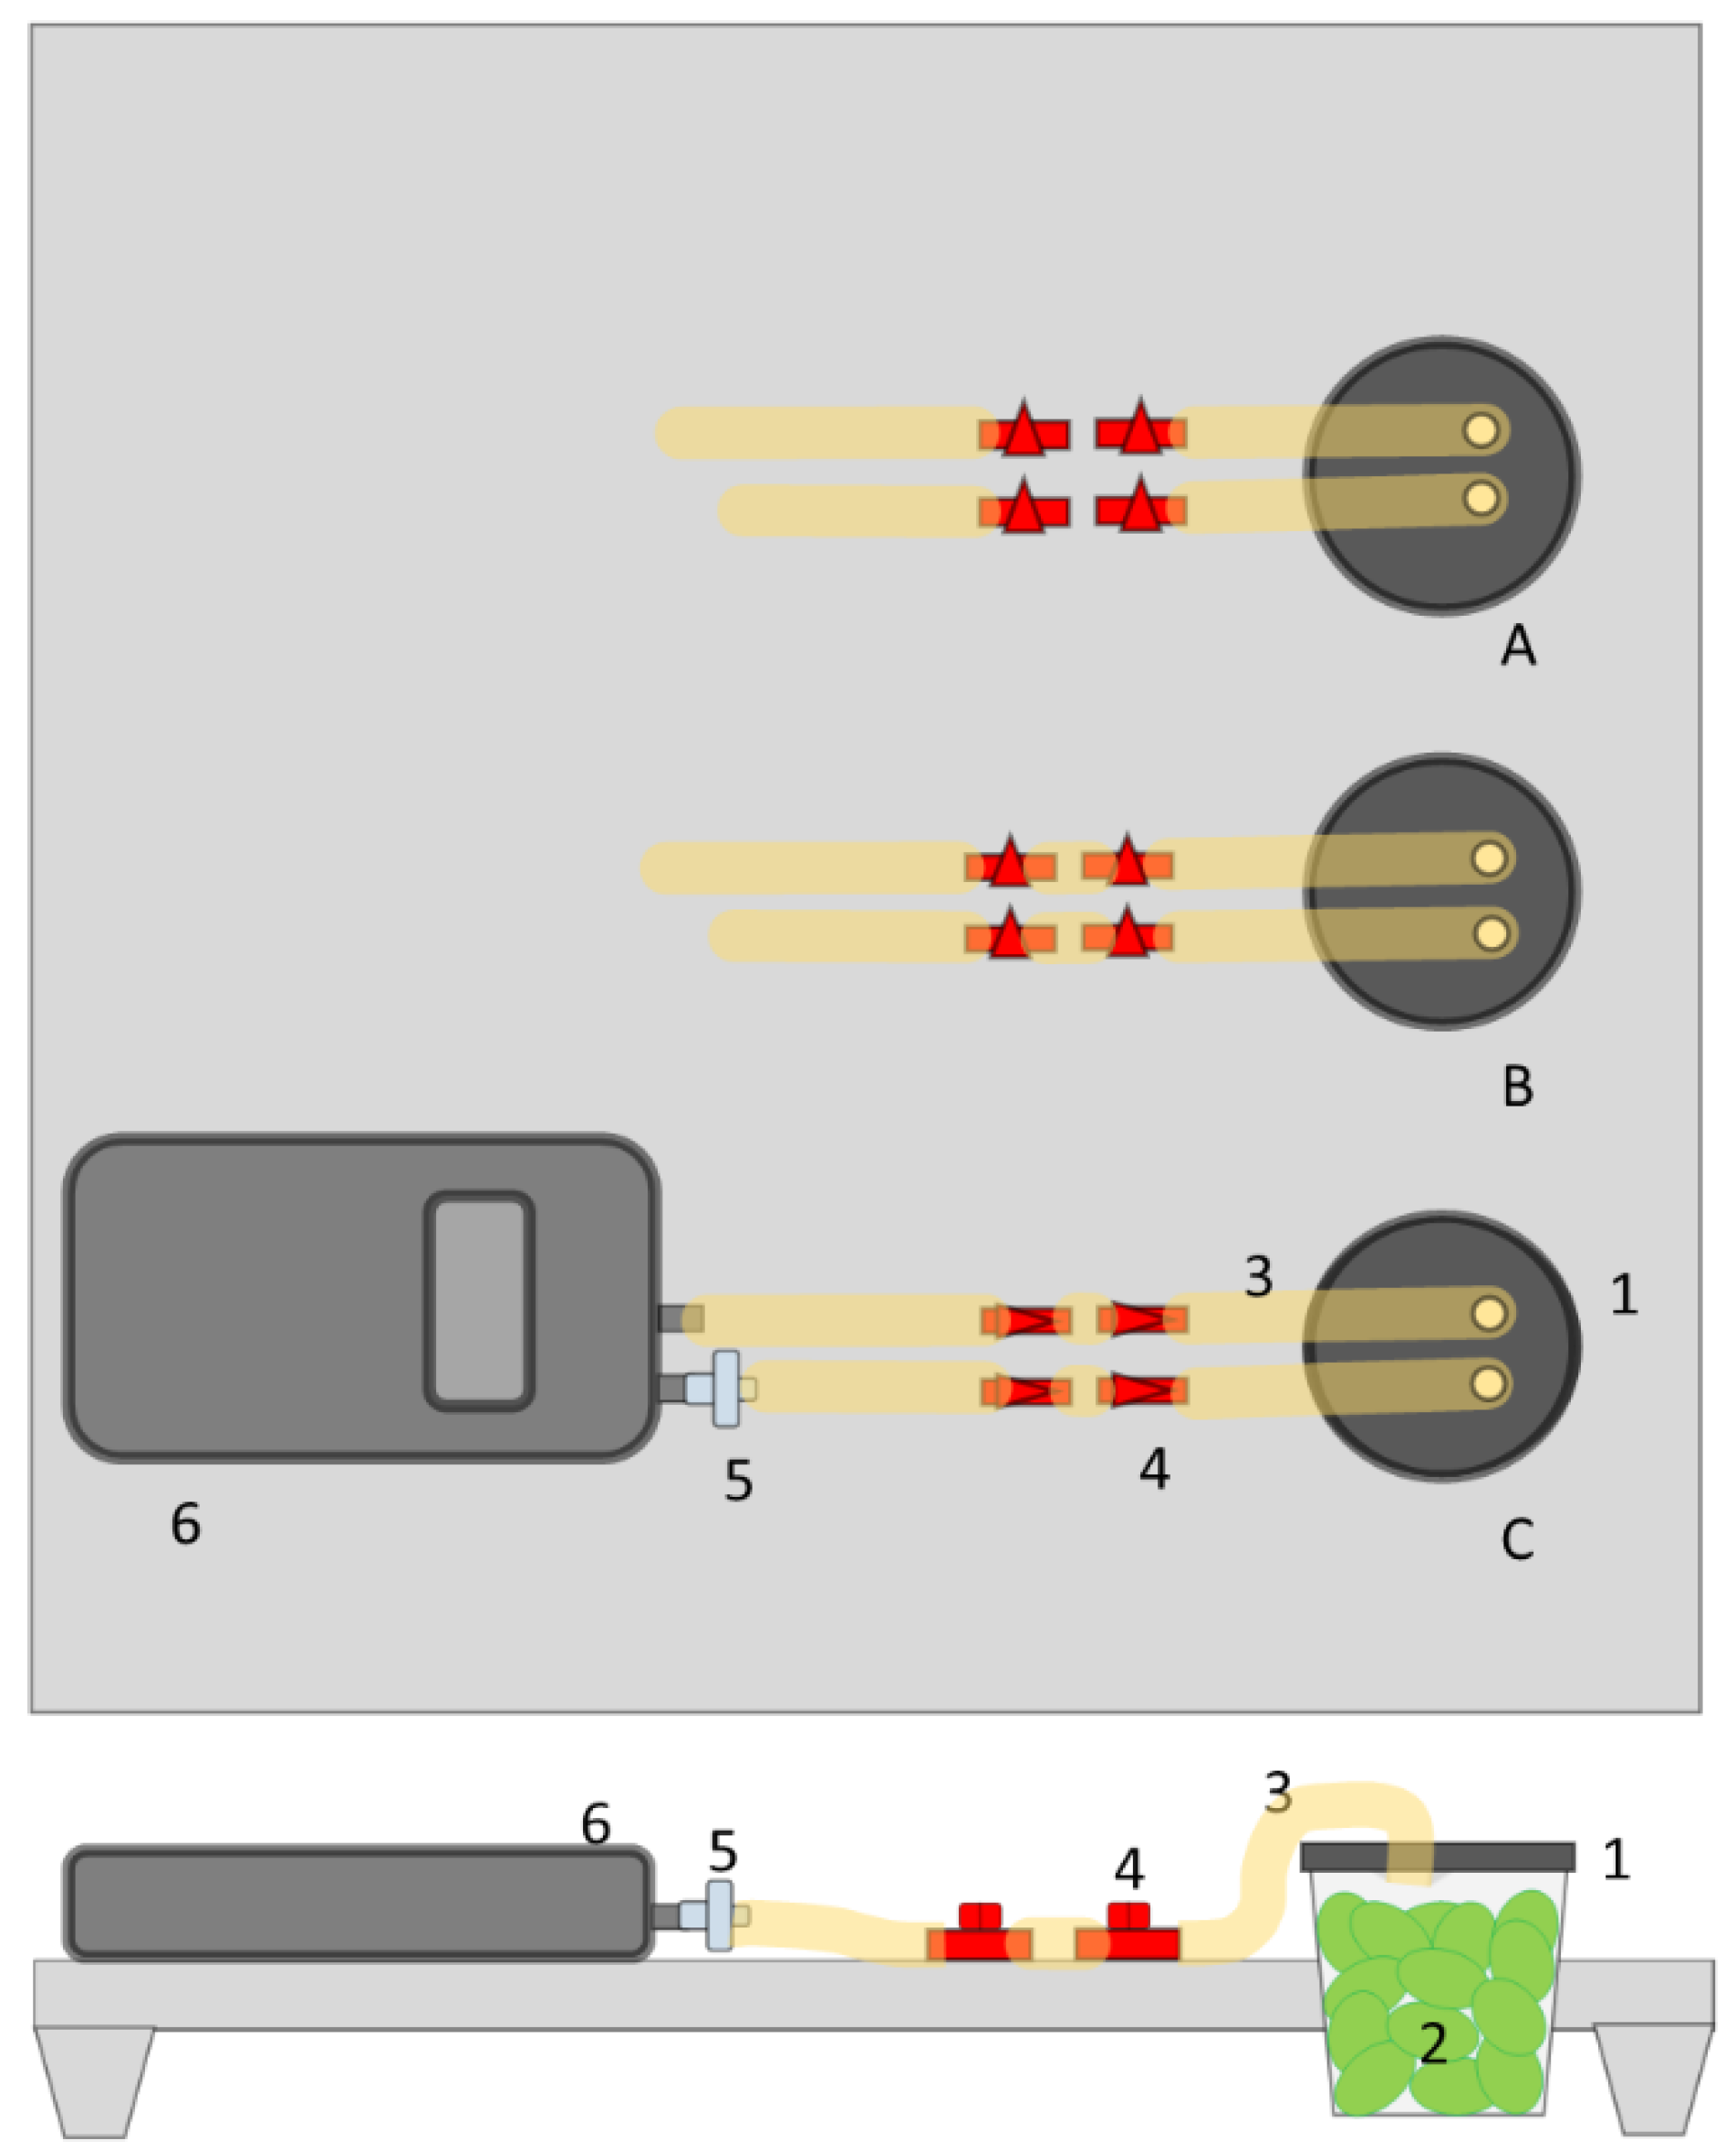
2.2. Experimental Set-Up

The experiment consisted in measuring the CO2 and O2 concentrations in three hermetically sealed glass jars (approx. 125 mL) containing a known amount of olives (approx. 45 g) hourly for 7 consecutive hours, while keeping the temperature constant at 5, 10, 15, 20, 23, 30, 35, 40, or 45 °C. The CO2 and O2 contents of the headspace of these jars were determined with a G100 portable gas analyzer (Geotechnical Instrument Ltd., Leamington Spa, UK). The tests took place at the facilities and laboratories of the Instituto de la Grasa.
The measuring device consisted of a support, three glass jars with screw caps, and a gas analyzer (Figure 1). The support was made of a wooden board (30 × 30 × 1 cm; four legs of 5 cm), with three holes (7 cm) to hold the glass jars. Through two holes in the screw cap, flexible silicone tubes of 15 cm (diameter of 1 cm) were fixed at 1 cm inside and sealed with silicone. The full tightness of the recipient (jar with the screw cap with tubes) was tested by immersion in a bowl of water. Each tube was connected to two plastic valves, placed one behind the other. Both valves were fixed at the wooden platform to create a stable structure. A silicone tube of 5 cm was connected to the second valve to provide a connection with the gas analyzer.
The temperatures of 5, 10, 15, and 20 °C were obtained in a cooling chamber, adjusted to these temperatures (±1 °C) 24 h before the trials. Stable room temperature allowed for measurements at 23 °C. A FD720 incubator (BINDER GmbH, Tuttlingen, Germany), with a volume of 740 dm3 was used to attain the temperatures within the range of 30 °C and 45 °C.
The exact volume of each jar and the connected tubes (including the two valves) was determined by weighting the needed water to fill the closed system (precision 0.1 g). On the day of the trial, fruit was taken out of the refrigerator to fill the three glass jars as much as possible without damaging the fruit. The olives of each jar were weighted separately on a laboratory balance (precision 0.1 g). Thereafter, the three jars (A, B, C) filled with the olives were placed without the cap in the thermostatic environment (cooling room or incubator) to attain the desired temperature. After one hour, the screw caps were closed and a first measurement (t0) was performed with the gas analyzer. In the following 7 h, the O2 and CO2 concentration (% v/v) was measured. This period was taken as the maximum timespan between the harvesting and the discharge of the fruit in the mill. The samples in the incubator were taken outside for the time of the measurement (approx. 360 s). The ones kept in the cooling room were measured there.
The temperature of each set of three jars (Ti) was set to 5, 10, 15, 20, 23, 30, 35, or 40 °C. The measurements (tj) took place at 0, 1, 2, 3 4, 5, 6, and 7 h.
The volume of the air ( V a i r ) in the closed system with the olive fruit was deduced from the measured volumes of the closed jars ( V j a r r ) minus the volume of olives (   V o l i v e ) obtained from the weight of the olives, knowing the density of the olive fruit. The volume fractions of the O2 ( V O 2 ) and CO2 ( V C O 2 ) in each jar could be calculated by multiplying the V a i r by the volumetric concentrations of each gas ( y O 2 ( T i , t j )   and   y C O 2 ( T i ,   t j ) ) in % (v/v), which were measured with the gas analyzer at Ti and tj.

2.3. Theory and Calculus

The amount of each gas ( W ( T i ,   t j ) ) expressed in mg per g of fruit ( mg / g olive ) at temperature T and time t (Equations (1) and (2)) could be calculated given the molecular masses of 32 g/mole for O2 and 44 g/mole for CO2, and the molar volume of a gas (Equation (3)).
W O 2 ( T i ,   t j ) ( mg / g olive ) = 32 · V O 2 ( T i ,   t j ) · 10 3 · W o l i v e 1 · V m ( T i ) 1
W C O 2 ( T i ,   t j ) ( mg / g olive ) = 44 · V C O 2 ( T i ,   t j ) · 10 3 · W o l i v e 1 · V m ( T i ) 1
where
V m ( T i ) = R T i P
with Vm (Ti) = molar volume of a gas (dm³) at temperature Ti.
R: gas constant (0.082 dm³ atm K−1 mol−1) of the ideal gas law.
Ti: temperature (K).
The respiration rate is the velocity by which CO2 is produced ( R R C O 2 ) and O2 is consumed ( R R O 2 ) at a given temperature T i , both in cm ³   kg 1 h 1 , and can be calculated given the values of y O 2 ( T i ,   t j ) and two different tj:
R R C O 2 ( T i ) = [ y C O 2 ( T i , t ) y C O 2 ( T i ,     t j ) ] · V f / [ ( t ( T i ) t j ( T i ) ) · W o l i v e · 100 ]
R R O 2 ( T i ) = [ y O 2 ( T i , t ) y O 2 ( T i ,     t j ) ] · V f / [ ( t ( T i ) t j ( T i ) ) · W o l i v e · 100 ]
That can be expressed in terms of moles ( mM   kg 1 h 1 ) as follows:
R R C O 2 ( T i ) = R R C O 2 ( T i ) ( cm ³   kg 1 h 1 ) · 44 · V m ( T i ) 1
R R O 2 ( T i ) = R R O 2 ( T i ) ( cm ³   kg 1 h 1 ) · 32 · V m ( T i ) 1
The respiration rate can be characterized by using either the CO2 production rate or the O2 consumption rate. In the closed system under study, oxygen acted as the limiting reagent and was therefore given preference over CO2 production. The Arrhenius model allows for the determination of the respiration rate at a given temperature from data obtained at other temperatures, assuming that the reaction is of zero-order and that the respiration rate is therefore constant, equal to the specific rate constant [14].
R R O 2 = A O 2 · e E a O 2 · 1 R T
with A O 2 (cm³ kg−1 h−1): pre-exponential factor for O2 consumption.
E a O 2 (J mol−1): activation energy for the O2 consumption.
R: gas constant (8.314 J mol−1 K−1) of the ideal gas law.
A O 2 (cm³ kg−1 h−1) and E a O 2 (J mol−1) can be calculated when knowing the R R O 2 at two different T i solving the two Equations (9) and (10), and by having Equations (11) and (16).
R R O 2 ( T 1 ) = A O 2 · e E a O 2 · 1 R T 1
R R O 2 ( T 2 ) = A O 2 · e E a O 2 · 1 R T 2
A O 2 = R R O 2 ( T 1 ) · e E a O 2 · 1 R T 1
R R O 2 ( T 2 ) = R R O 2 ( T 1 ) · e E a O 2 · 1 R T 1 · e E a O 2 · 1 R T 2
R R O 2 ( T 2 ) R R O 2 ( T 1 ) = e E a O 2 · 1 R T 1   E a O 2 · 1 R T 2
ln ( R R O 2 ( T 2 ) R R O 2 ( T 1 ) ) = E a O 2 · 1 R T 1 E a O 2 · 1 R T 2
ln ( R R O 2 ( T 2 ) R R O 2 ( T 1 ) ) = E a O 2   ( 1 R T 1 1 R T 2 )
E a O 2 = ln ( R R O 2 ( T 2 ) R R O 2 ( T 1 ) ) ( 1 R T 1 1 R T 2 )

2.4. Simulation Model

After verifying that the Arrhenius model could be used to estimate the consumption rate at the different temperatures, a simulation study was performed to calculate the time needed to consume up to 3% of the O2 present in a closed system filled with fruit at a given temperature. This limit was set arbitrarily, and was considered the thresholds as reported by Fonseca et al. [14].
The closed system was a 1-m³ cube situated in the lower part of a container used to transport olives with dimensions set at 6 m long, 2.5 m wide, and 2.5 m high (Figure 2). The cube was situated at 0.75 m from the lateral walls to guarantee that direct heat exchange with the outside was negligible. A distance of 1.5 m between the upper layers of the fruit and the upper site, together with the absence of a lateral or vertical airflow, prevented the entrance of O2 into the cube of fruit under study.
The biometrical characteristics of olives (‘Picual’ cv.) used in another experiment were used to calculate the air volume (Vair) in 1 m³ [28,29]. The mean weight was 4.4 g and the volume, calculated after measuring the width and height and assuming the volume to be a prolate spheroid, was 4.14 cm³. By weighting the number of olives that entered in a known volume, it was determined that 500 g of olives (of 4.4 g per olive) entered in a volume of 1 dm³, and 500 kg, i.e., 113,636 olives, in 1 m³. The volume occupied by the fruit thus accounted for 0.470 m³. The total volume of O2, expressed in dm³, in 1 m³ filled with 500 kg of olive fruit, amounted to (1 m³–0.470 m³) ∙ 0.209 O2 dm³ O2/ dm³ air ∙ 1000 dm³/m³, i.e., 110.7 dm³.
The amount of O2 consumed for a given time interval ( t j + 1 t j ) can be calculated using the respiration rate at each temperature, as obtained by the Arrhenius equation.
V O 2 ( T i ,   t j + 1 ) = V O 2 ( T i ,   t j ) R R O 2 ( t j ) · ( 500   kg 1000   kg ) · ( t j + 1 t j )
During aerobic respiration, energy is produced at a rate of 2667 kJ for each mole of glucose that reacts with 6 moles of O2 [13]:
C 6 H 12 O 6 ( s ) + 6 O 2 ( g )   6 CO 2 ( g ) + 6 H 2 O   ( l ) + 2667   kJ
where 5% of that energy is consumed during the breaking down of the glucose molecule, 41% is used to produce 38 ATP molecules, and 57% is lost as heat [13]. Therefore, for each mole of O2 consumed, 253 kJ are added to the system. Under adiabatic conditions, the heat generated during a time t needs to be taken into consideration as it added up to the initial temperature t under which the fruit was stored. As the production of this heat follows the consumption of O2, the Arrhenius model can be used to calculate the rate of heat production, l ( T ) , expressed in kJ kg−1 h−1, at a given temperature T(t) (Equation (19)). As it refers to the same reaction, the activation energy (Ea) is the same, although the pre-exponential factor B (J kg−1 h−1) is different.
l ( T ) = B · e E a 1 R T
At time t, the temperature of the system (m) and Cp increase by
T ( t t 0 ) = l ( T 0 ,     t 0 ) m · C p · t
The temperature T(t) at time t thus becomes:
T ( t ) = T ( t 0 ) + T ( t t 0 )  
Considering:
R R O 2 ( t ) = R R O 2 ( T 0 )   and   R R O 2 ( t 0 ) = R R O 2 ( 0 )
It can be deduced that:
R R O 2 ( t ) R R O 2 ( 0 ) = R R O 2 ( T 0 ) ( t t 0 )
R R O 2 ( t ) = R R O 2 ( 0 ) + E a E a R · T 0 ( t t 0 )
Therefore:
R R O 2 ( t ) = R R O 2 ( 0 ) + E a O 2 E a O 2 R ( T 0 + l m C p t ) ( t t 0 )
At each time interval (tt0), the rate of consumption of O2 was calculated, considering the initial temperature and the accumulated heat produced during that interval. According to the Arrhenius equation, the reaction rate increases with increases in temperature, thus the increased respiration rate can then be accordingly adjusted. This corrected respiration rate allowed a precise estimation of the time it takes for the described closed system, at an initial temperature T to attain the critical threshold of 3% of O2.

3. Results

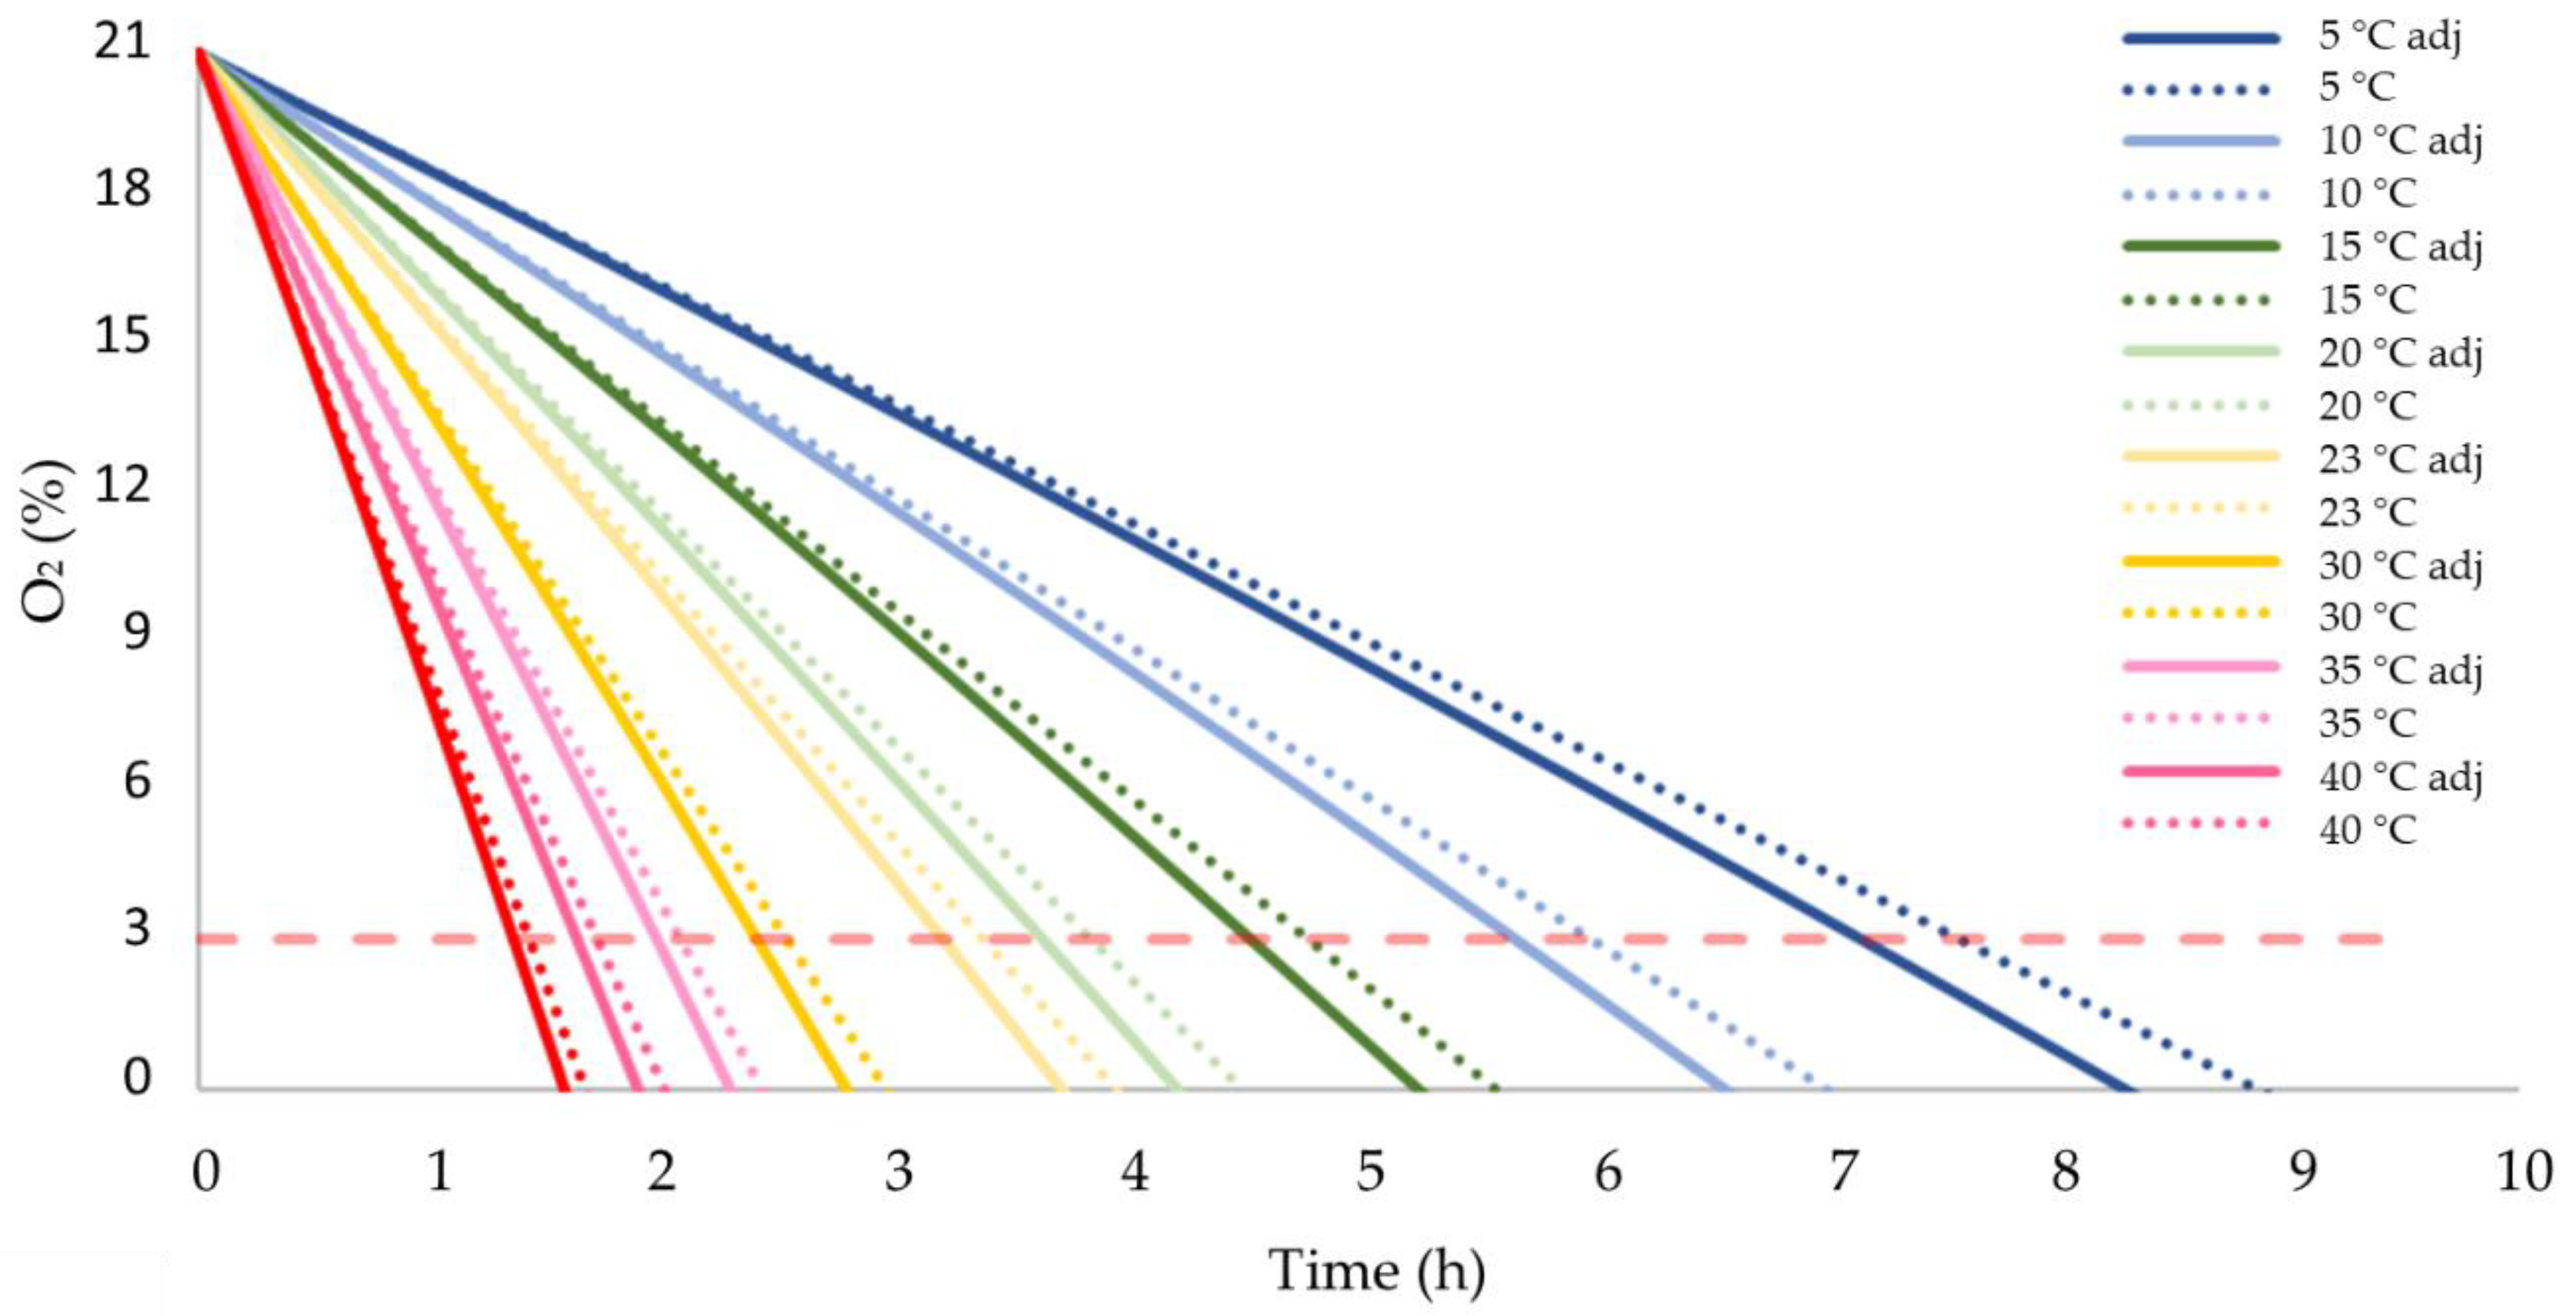
3.1. Concentrations of O2 and CO2 over Time

The calculated values of W O 2 and W C O 2 over 7 h allowed us to appreciate the differences among the samples kept at different temperatures (Table 1). At 5 °C, the consumption of the O2 hardly changed over the studied time. As the temperature increased, the amount of O2 decreases rapidly and we recorded an increase of CO2. At 20 °C, the amount of O2 and CO2 balanced after 7 h, while at 30 °C the balance occurred after 3 h, and at 40 °C it balanced in less than 2 h. At 45 °C, all the O2 in the jars was consumed in less than 3 h.
The ratio of CO2 produced to O2 consumed (RQ) fell within the range of 0.6 (5 and 10 °C) and 1.4 (30 °C) during the full time of the experiment for the samples that were kept at temperatures below 35 °C. From then on, the RQ started to increase before the end of the trials, with values above 3 after 6 h at 35 °C, 3.6 after 5 h at 40 °C, and 3.7 after 2 h at 45 °C. The limitations of the gas analyzer used impeded the registration of CO2 concentrations above 20%, so no accurate values could be obtained once all the O2 was consumed.

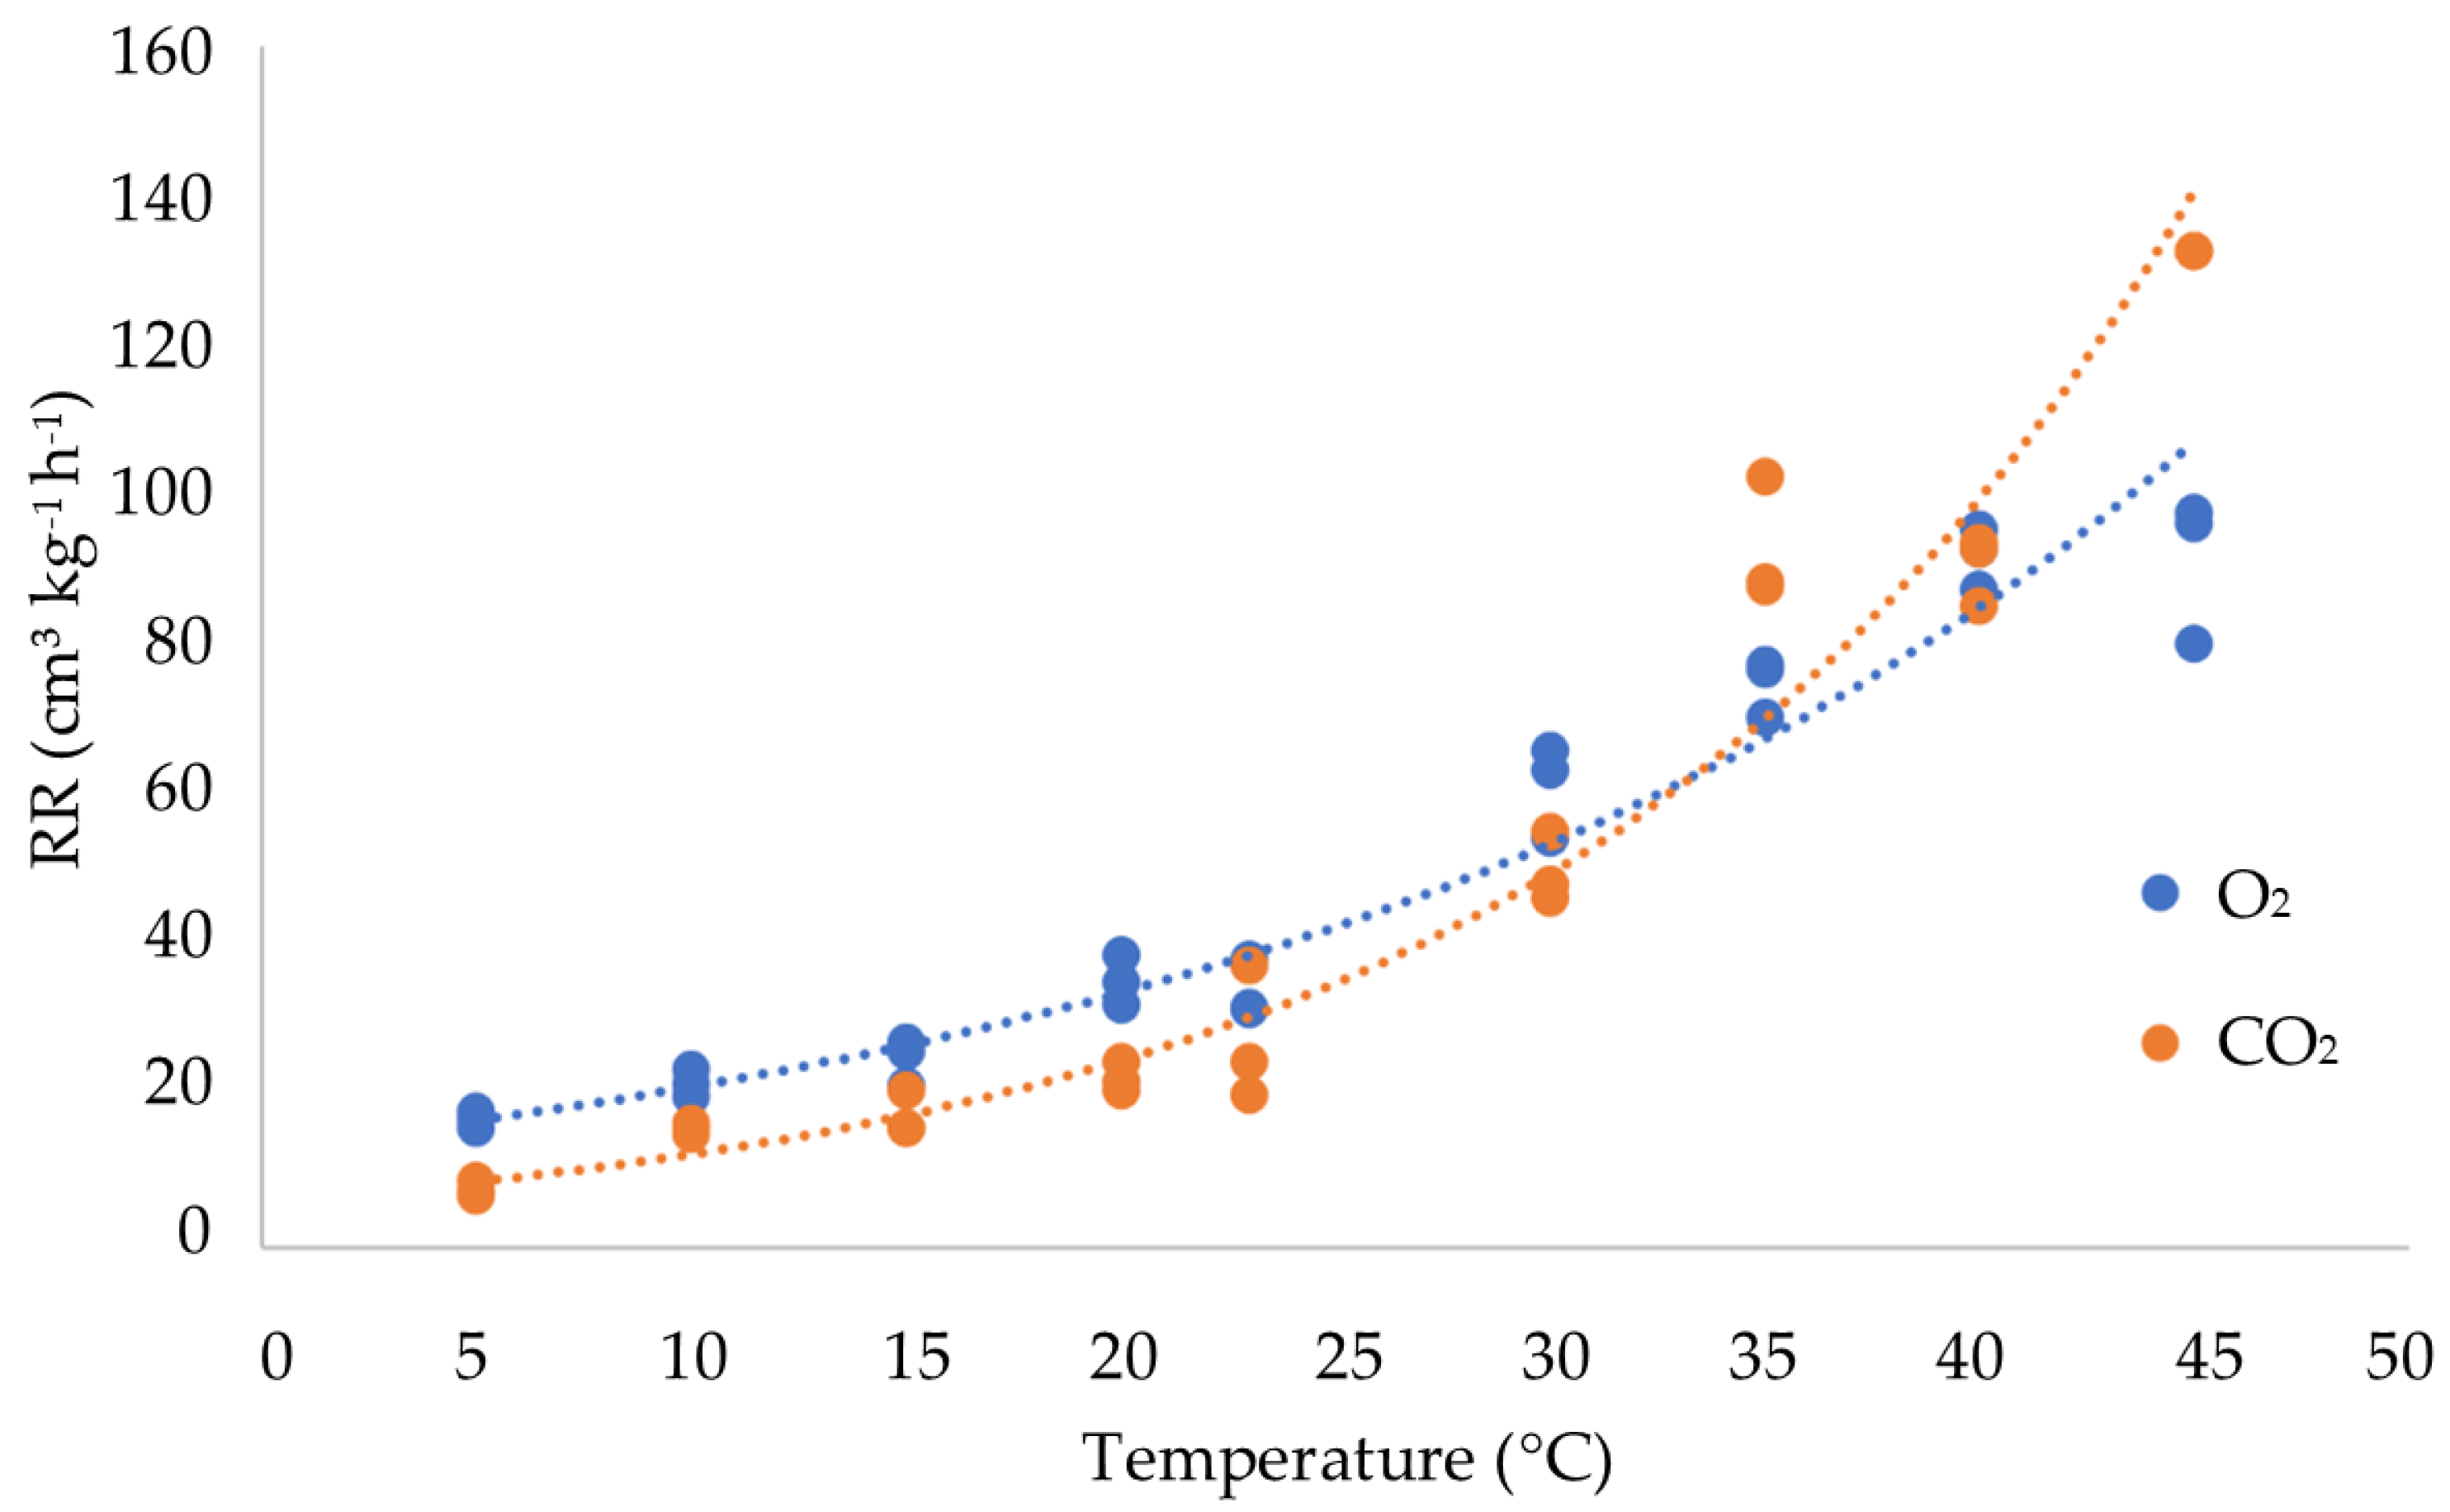
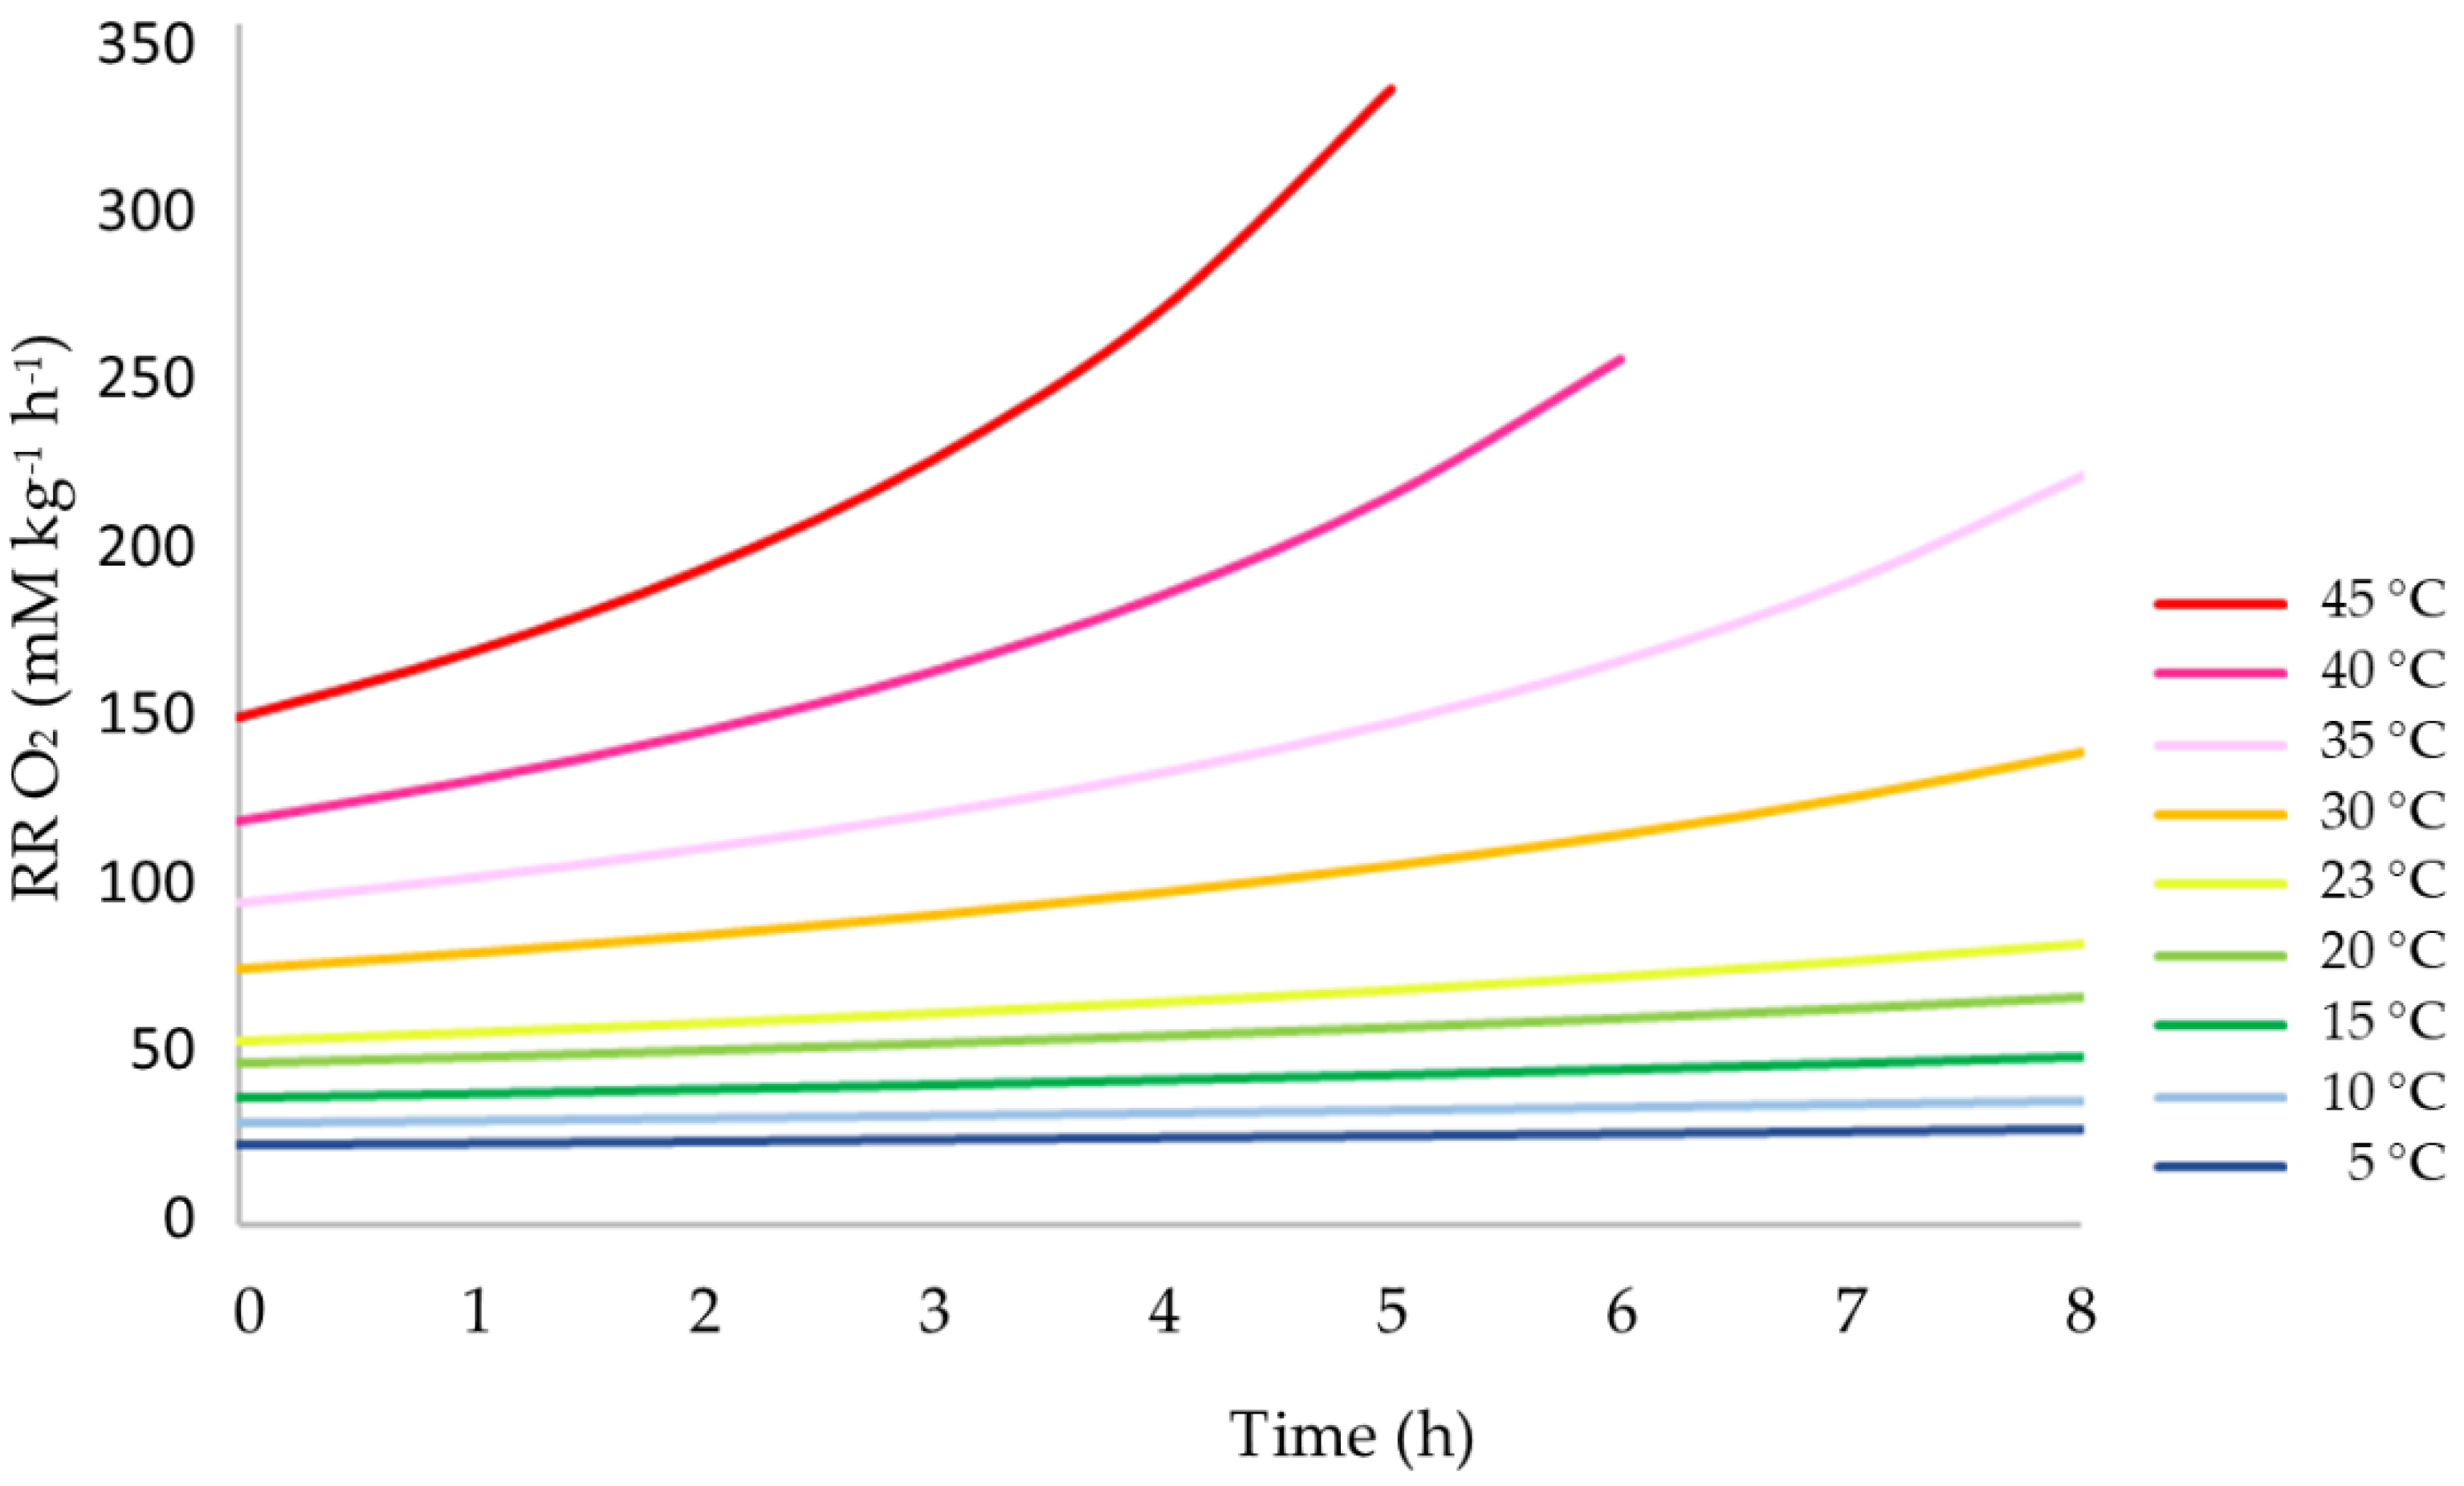
3.2. Influence of Temperature on the Respiration Rate

The influence of the temperature on the respiration rate became even more clear when the consumption of O2 (Equation (4)) was plotted against the temperature (Figure 3). The respiration rate doubled between 10 and 20 °C and between 20 and 30 °C. The values of the O2 increased exponentially (y = 12.801e0.0495x; R² = 0.97) between 5 and 40 °C. However, above 40 °C the respiration rate did not increase further and it maintained an almost equal level. The CO2 production (Equation (5)) increased similarly to the O2 up to 30 °C, after which the values continued to increase at a much higher velocity than the O2.
The data allowed the calculation of the pre-exponential factor (A) and the activation energy (Ea) of the Ahrrenius equation at each temperature, once the respiration rate, expressed in mM   kg 1 h 1 of O2 consumed, was assessed following Equations (11) and (16). Both coefficients were determined with distinct intervals of (tt0), after which the calculated values of R R O 2 were compared with the rates obtained in the experiments. The data registered after 1 and 2 h were the most satisfactory when compared with the ones between 2 and 3, 3 and 4, and 1 and 4 h. A correlation coefficient of 0.99 was obtained when the data at 45 °C were not considered (data not shown). Therefore, the following Arrhenius function (Equation (26)) was withheld:
R R O 2 ( T ) = 1.9   10 7 · e 31.4 · 1 R T
Up to 40 °C, the Arrhenius function closely matched the observed data (Figure 4). At 45 °C, the oxygen consumption was nil after 3 h because all the oxygen in the jars had been already consumed within those three hours (Table 1).

3.3. Heat Generated by Fruit Respiration

To take into account the additional heat generated by the reaction itself, the pre-exponential factor B of the Arrhenius function, as defined in Equation (19), was calculated under the assumption that the reaction produced 253 kJ for each mole of O2 consumed, resulting in:
l ( T ) = 5.98   10 5 · e 30.7 · 1 R T
To estimate this additional effect, a simulation was performed following Equations (21)–(25), assuming a closed system of 1 m³ containing 500 kg of olives, and a free volume of O2 of 110.7 dm³ over 7 h. The obtained curves at each T0 are all defined by an adjusted quadratic function, presenting increasing acceleration with a higher initial temperature (Figure 5). It can be observed that the respiration rate at an initial temperature of 30 °C rose after 4 h to a level that equaled the one that exists at a T0 of 35 °C. At an initial temperature of 35 °C, the respiration rate at 40 °C was attained after 3 h.
This theoretical estimation did not consider the decreasing amount of O2 necessary to keep the aerobic reaction going. As such, the calculated respiration rates at high initial temperatures after three or more hours are not valid, as no oxygen will be present in the closed system.

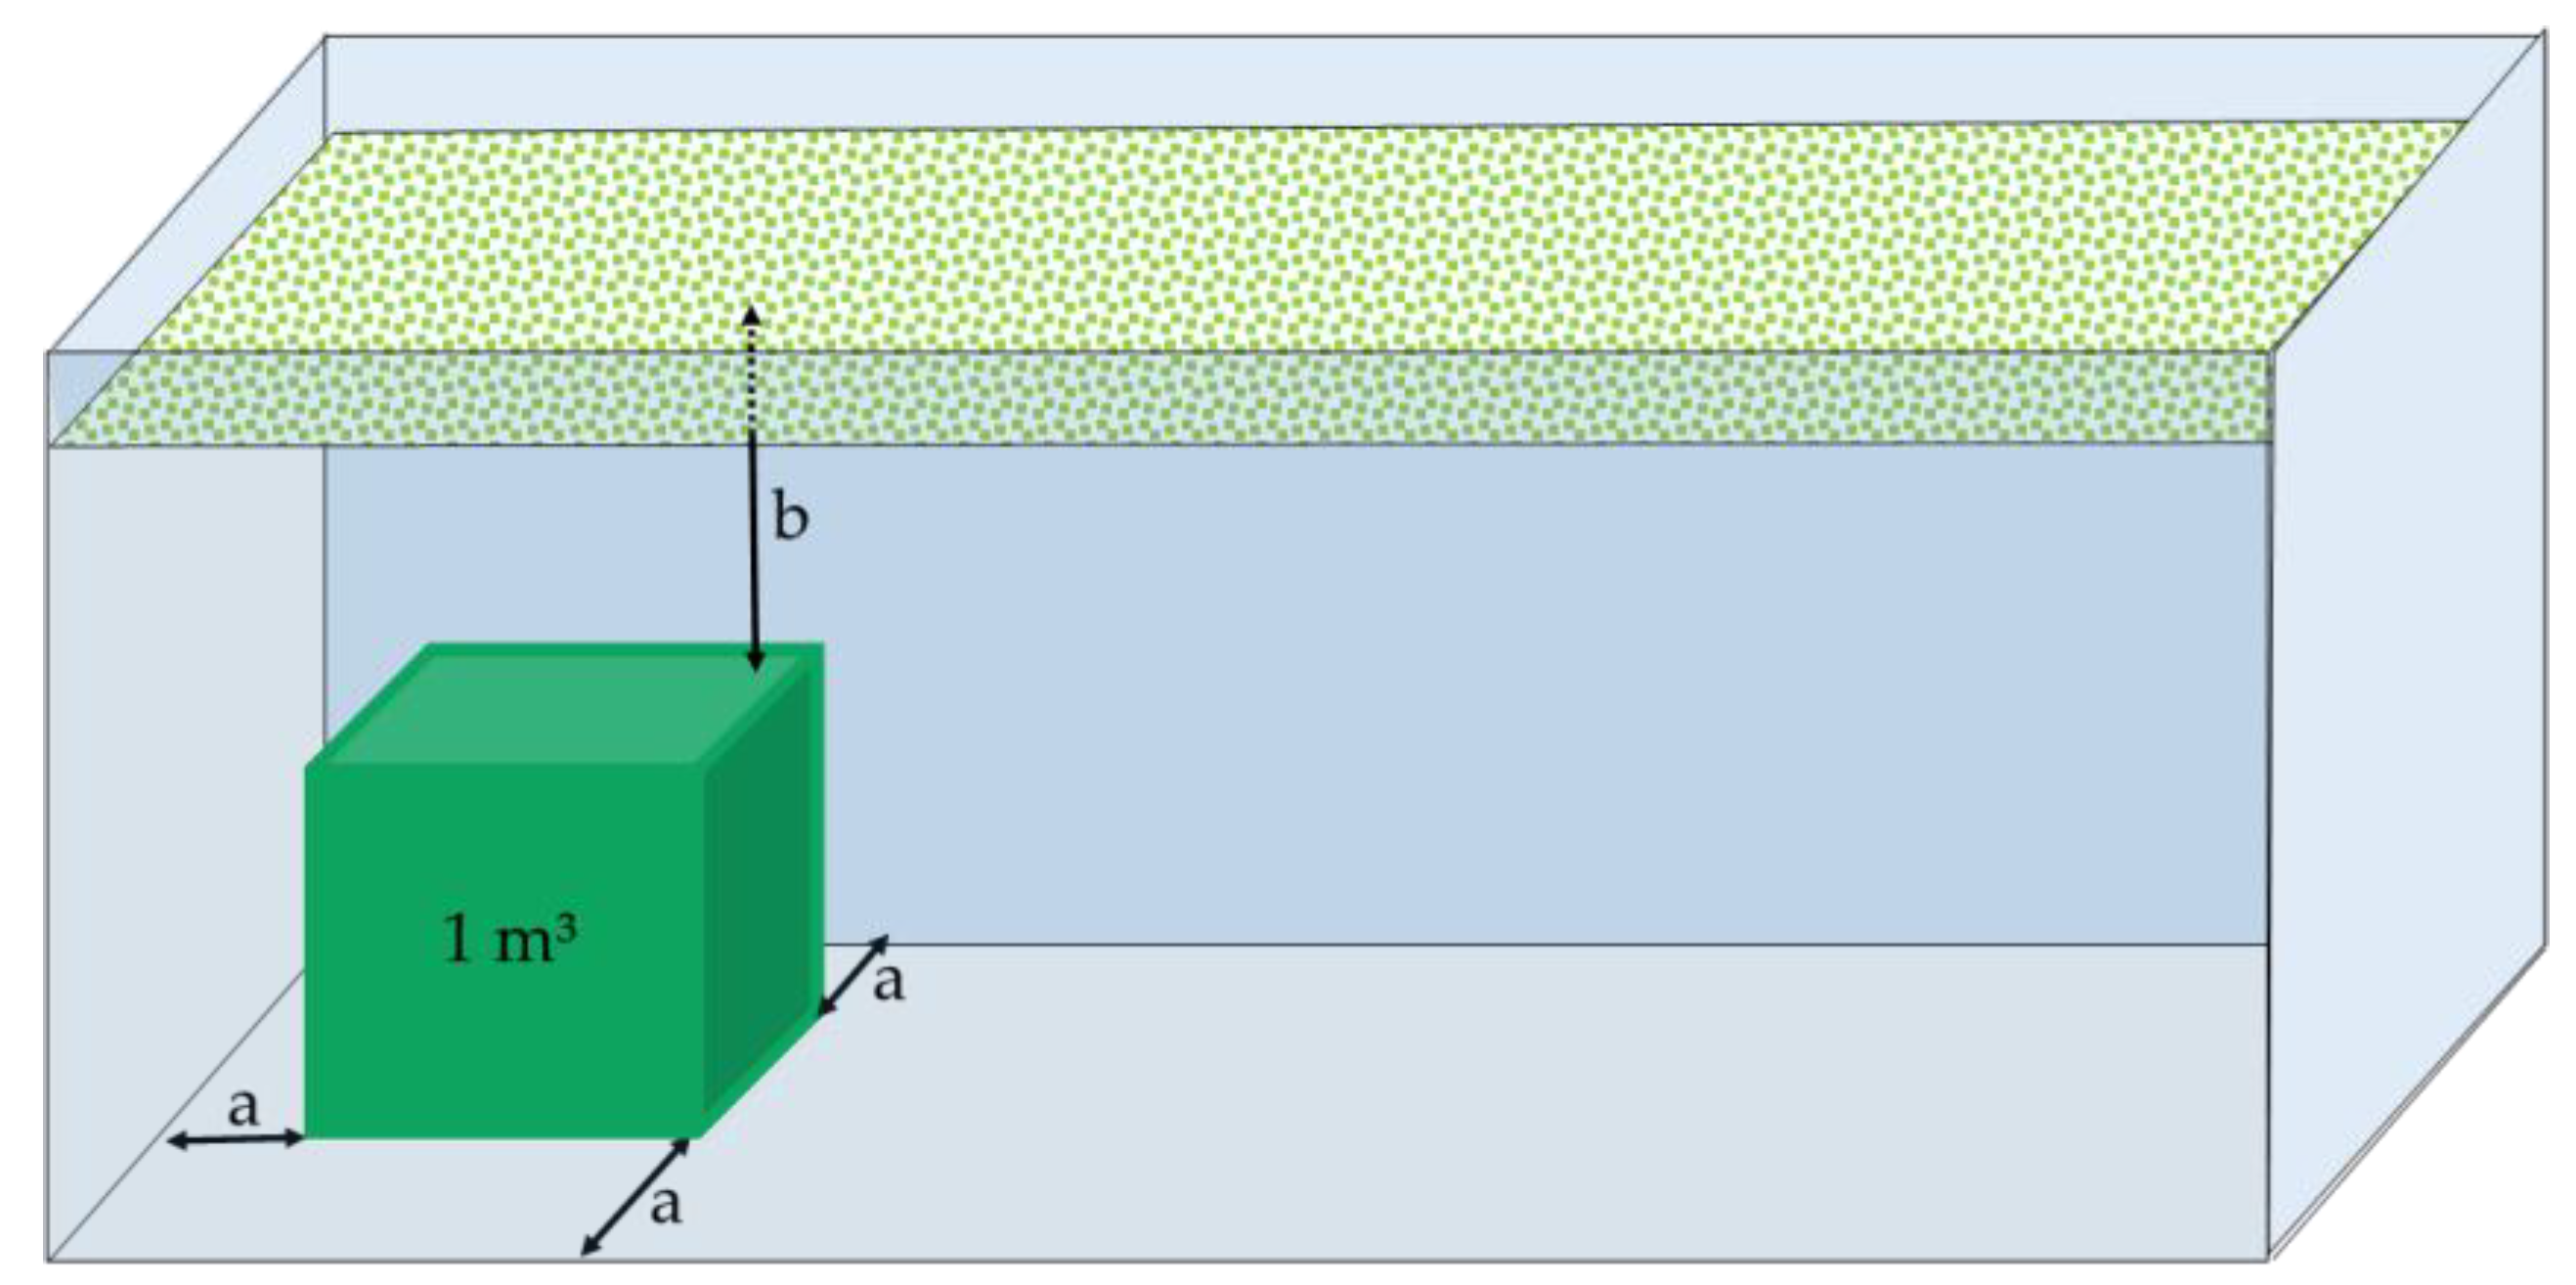
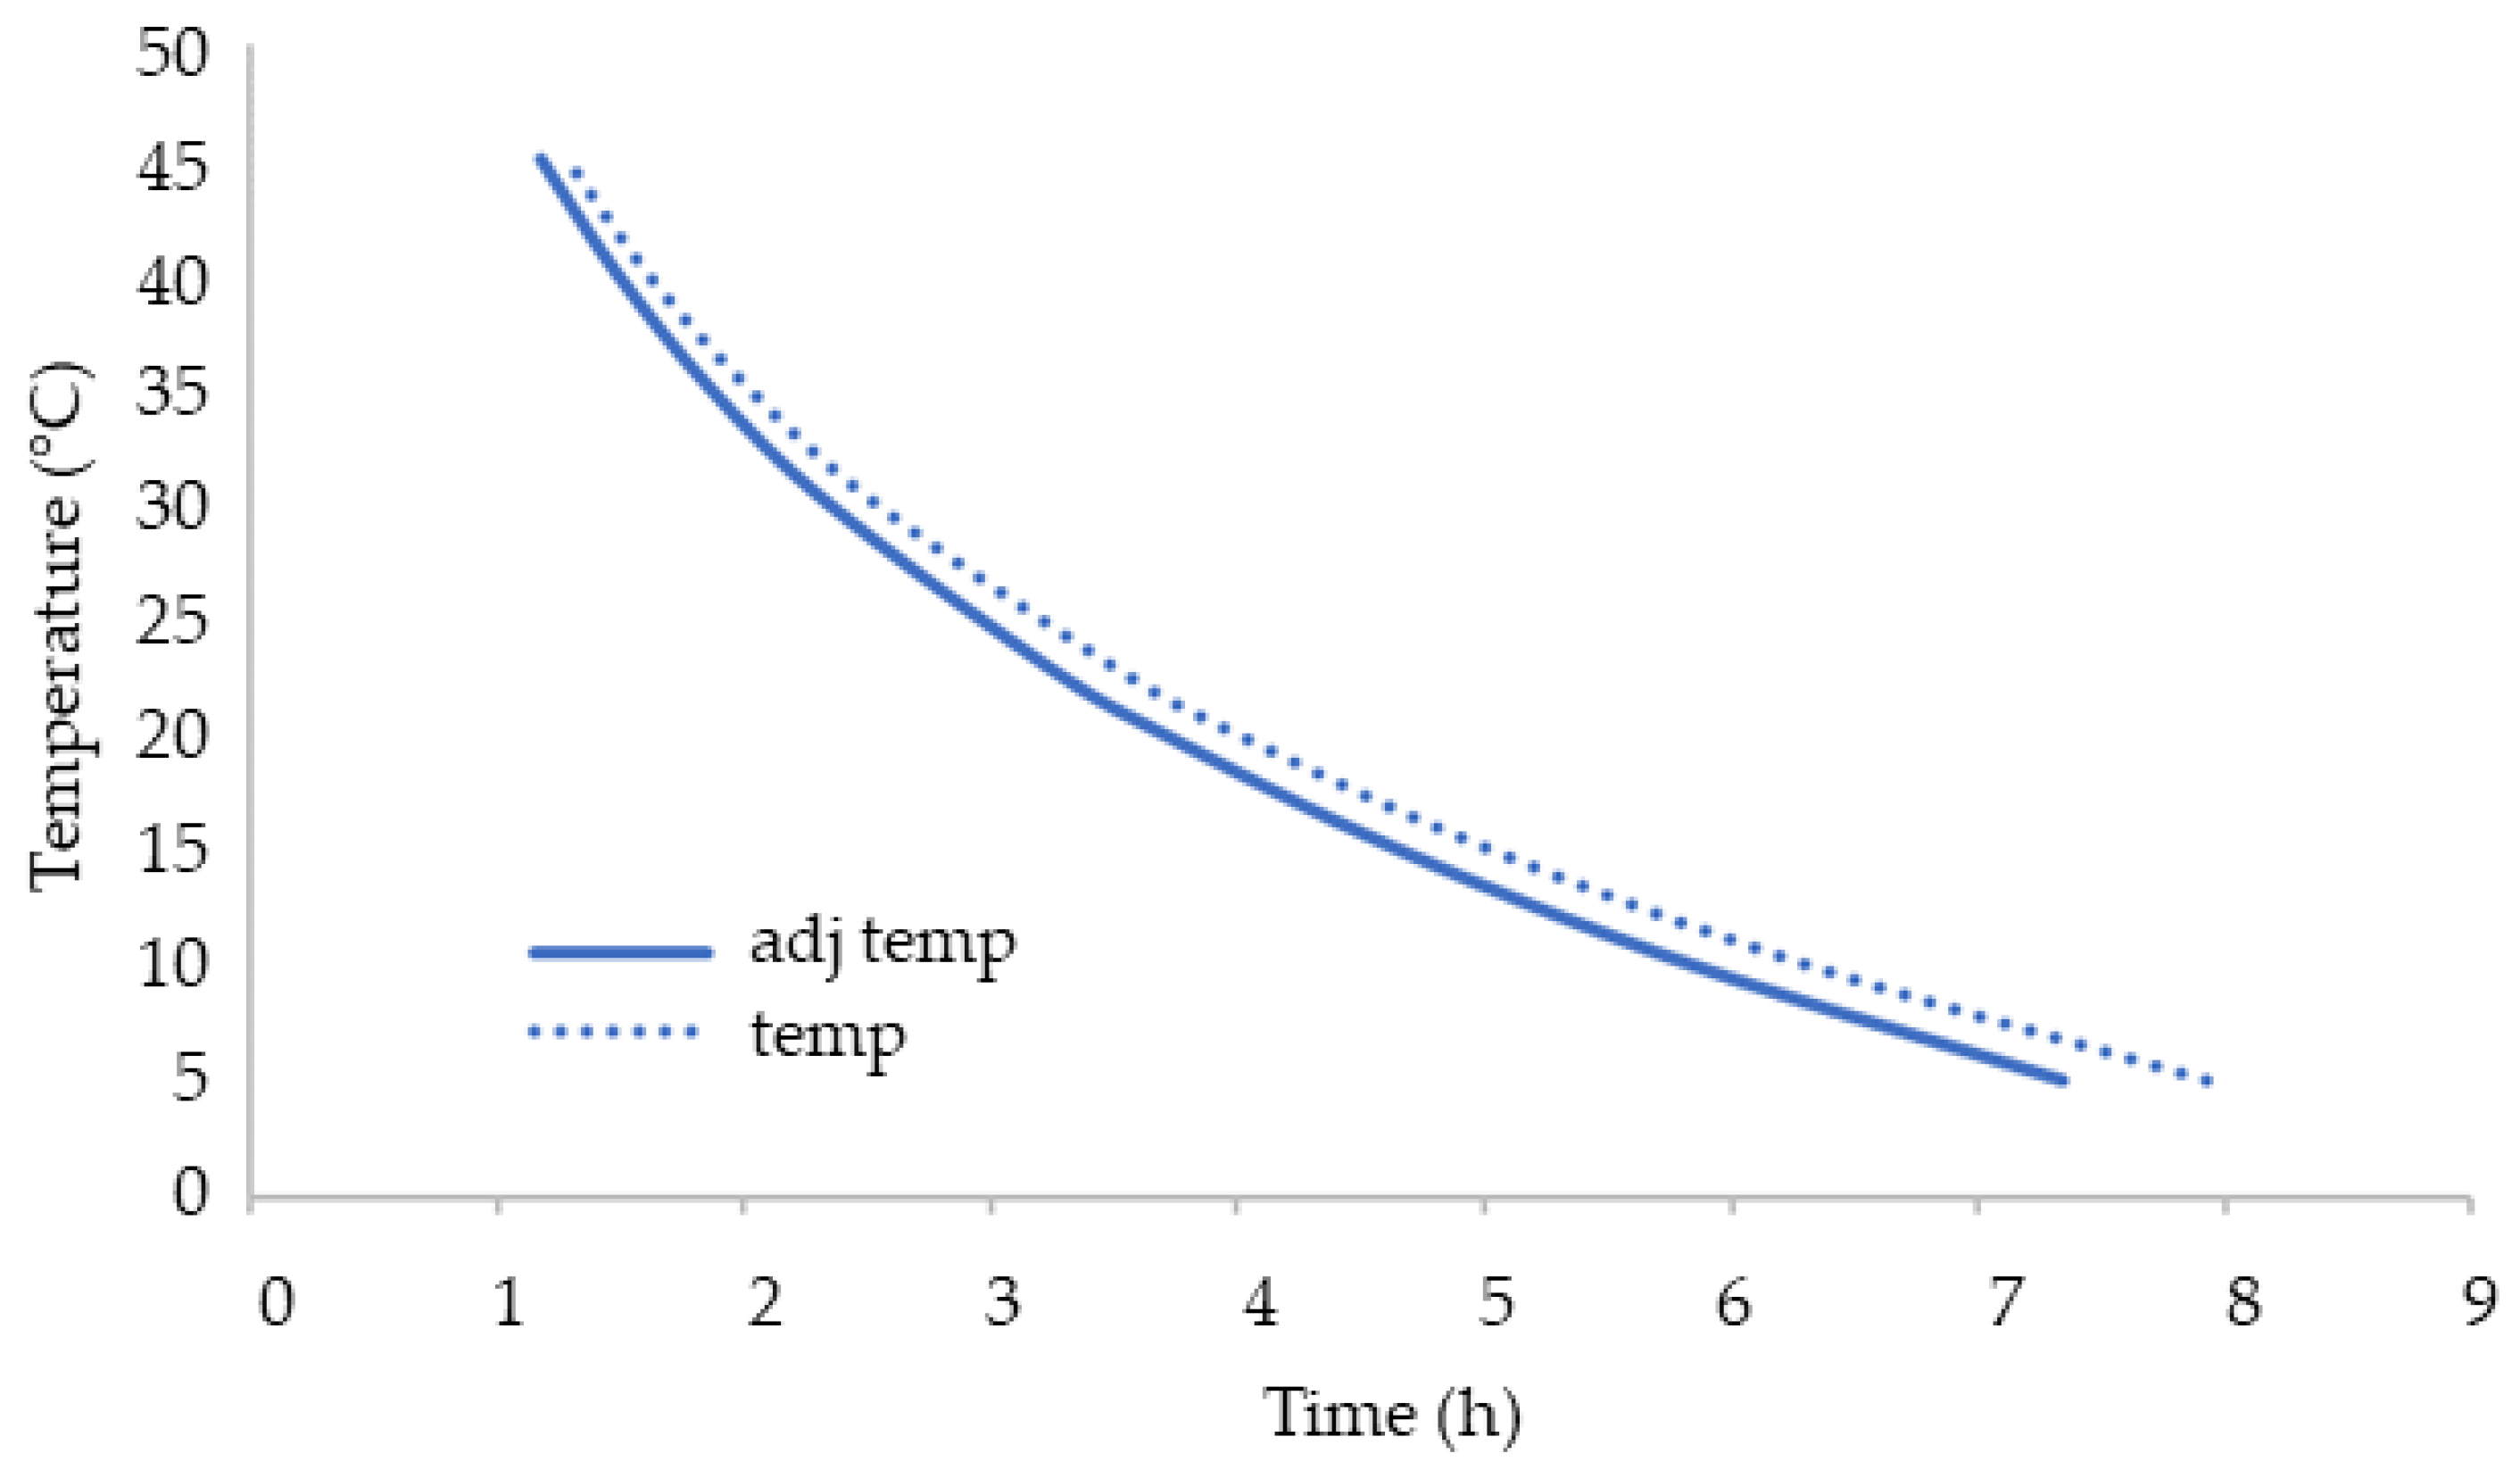
3.4. Consumption of O2 during Storage under Adiabatic Conditions

The adjusted respiration rates facilitated a simulation of the consumption of oxygen within the described closed system (Figure 6). To underscore the effect of the heat generated by the fruit itself, a dotted line is added to represent the decrease of O2 without considering this additional heat. The limit where aerobic respiration becomes critical is set at 3% and marked as a horizontal dashed line. According to this simulation, the olives kept at a temperature above 35 °C, will attain that limit in less than 2 h. Fruit kept between 20 and 30 °C risk fermentation in less than 4 h, while fruit stored between 5 and 15 °C can be stored between 7.5 and 5 h without inducing anaerobic respiration. With 3% of O2 left, the added heat reduced the needed time between 7.3% (5 °C) and 8.5% (45 °C) (data not shown). However, as it takes longer to attain this threshold at lower temperatures, the reduction of the time is equally greater: 35 min at 5 °C, 16 min at 23 °C, and 7 min at 45 °C.
Plotting the different temperatures against the time needed to consume up to 3% of O2 revealed an exponential curve (y = 67.962 e−0.341x) with an R² of 0.99 (Figure 7). The graphic indicates that when the fruit is kept at 25 °C under the described conditions, it will take 3 h to attain this threshold of 3%, while it will less than 2 h at 35 °C.

4. Discussion

The experiment provided concise data on the O2 consumption and CO2 production of olives in a closed system at different temperatures over a period of 7 h. The data allowed an estimation of the changes in respiration rate as well as the moment when a defined closed system would shift to anaerobic respiration. The limitations related to a closed or static system that were summed up by Fonseca et al. [14] were overcome or were negligible for the experiment. The gas volume could be accurately estimated, the experiment was designed to measure the effect of O2 depletion and CO2 production, the time between the sampling provided enough data to make generalized estimations, and no combination of gases was considered.
The obtained RQ values for the samples kept below 35 °C were within the normal values as reported in the literature, ranging from 0.7 to 1.3 [27,30]. The higher levels registered at an increasingly earlier time did indicate a shift towards anaerobic respiration. Values higher than 6 are reported for fruit and vegetables packed in low permeability films and causally linked to the presence of fermentative metabolism [14]. Although the limitations of the used gas analyzer did impede a precise registration of the produced CO2, it is obvious that the registered values above 3 marked the change in metabolism.
The effect of time and temperature on respiration has been studied on various intact fruit as well as in fresh-cut produce [14,31,32,33,34,35,36]. In all of these studies, an Arrhenius-type equation was shown to be very reliable to describe the respiration rate as a function of the temperature. The calculated respiration rate of the olive fruit kept at different temperatures adjusted itself to an Arrhenius function up to 40 °C. The obtained preexponential factor and the respiration activation energy of olive fruit, being respectively 1.9 107 (mg∙kg−1∙h−1) and 31.4 (kJ∙mol−1), lie within the normal range (9.8∙105–1.2∙1017 mg∙kg−1∙h−1 and 29–93 kJ∙mol−1), as reported in the literature for fruit and vegetables [37].
It was observed that biological reactions generally increase two or three-fold for every 10 °C raised in temperature for temperatures in the range of 10–30 °C [38]. At higher temperatures, enzymatic denaturation may occur, leading to a reduced respiration rate, while at lower temperatures, physiological injury can provoke an increase in respiration rate [39]. The obtained data did present comparable results in the aforementioned temperature range. However, the reduction of the respiration rate at the highest temperatures was not induced by an enzymatic denaturation but by the fact that oxygen acted as the limiting factor in the reaction, leading to a flattening of the respiration rate curve above 40 °C. At the lowest temperature, no physiological injuries were observed, nor were they expected as olive fruit can be stored at 5 °C without risk of physiological deterioration [40,41,42].
The fact that the respiration rate tends to decrease with storage time has been modelled in different ways. For example, Waghmare et al. used a first-order decay model [31], while Bhande et al. applied a model using principles of enzyme kinetics with uncompetitive inhibition [34]. However, all these models studied modified atmosphere packaging designs (MAP) and considered a far longer storage time. As those fruits and vegetables were kept for up to 5 days, developmental changes during storage needed to be considered. The experiment under discussion focused on the consumption of oxygen and did not consider these physiological changes. As the time frame was much shorter, the storage temperature was higher, and the fruit was not kept under MAP conditions, there was no need to model the effect of time on the respiration rate.
The cumulative effect of the heat produced during the respiration was given full consideration in the presented model and led to an adjusted Arrhenius equation in which the temperature was corrected with the heat generated by the respiration over a specified time interval. The model further assumed that the respiratory heat generation was not constant but a function of the heat at each moment, rendering a more precise estimation than suggested by Redding et al. [32]. Thus far, few studies have considered this variable, and it is often discarded it as being a neglectable factor in the overall heat transfer, suggesting that in a typical precooling process the heat added by respiration is approx. 0.5% [43,44,45]. However, the results indicate that, under specific conditions, this effect leads to a reduction of the estimated time by 7% before the critical minimum concentration of 3% is attained. The impact of the added heat is more pronounced at a lower temperature, simply because it takes longer to attain the threshold. As such, the results do confirm the suggestion made by Redding et al. [32] that the assumption of a negligible contribution of respiration rate is more likely to be untrue for lengthy precooling processes.
The model assumed that the 1 m³ of fruit within the bulk transport could be considered a closed system, with neither fresh air entering nor a temperature change induced from outside. In a real bulk transport scenario, the top layers are not only exposed to fresh air, but also be submitted to higher temperatures if they are exposed to the sun. At the same time, the layers on the lateral sides of the container will be heated up as the walls can be warmed up during transport. As heat is brought into the system during the transport, the respiration rate will increase accordingly, while the entrance of fresh air will delay the moment when the critical threshold is reached. Specific measurements of the O2 and CO2 concentrations, as well as the temperature at different layers, are thus needed to further fine-tune the presented model. Alternatively, Computation Fluid Dynamics can be used to calculate the airflow and temperature changes within the defined container numerically, either with a porous-medium approach or a direct simulation [46]. Future research is also needed to confirm the presence of ethanol in fruit that is generated under the described critical conditions. It would also be interesting to calculate the behavior of damaged fruit, which can sometimes occur as a consequence of the detachment pattern generated by some harvester systems such as super-intensive harvesters [47]. As for now, the presented model cautions that to avoid fermentation processes in at least a substantial part of the fruit, it is necessary to consider the time of transport as an important risk factor.

5. Conclusions

The shift towards super high-density hedgerow orchards, together with the foreseeable impact of climatic changes, urges us to focus on the postharvest conditions of the olive fruit. The presented study clarified the direct relation between both variables and demonstrated that even at non-extreme ambient temperatures (between 30 and 40 °C), the threshold where anaerobic respiration becomes dominant can be attained within a couple of hours. To avoid detrimental fermentative processes, it is thus recommended to reduce the time between the harvest and the extraction as much as possible, as well as to contemplate the introduction of cooling systems to reduce the field heat prior to fruit processing.

Author Contributions

Conceptualization, E.P. and J.M.G.M.; methodology, E.P.; validation, R.R.S.-G.; formal analysis, E.P., M.d.C.F.F. and R.R.S.-G.; investigation, E.P.; resources, J.M.G.M.; data curation, E.P.; writing—original draft preparation, E.P., M.d.C.F.F., R.R.S.-G., J.M.G.M. and J.F.G.M.; writing—review and editing, E.P., M.d.C.F.F., J.M.G.M., R.R.S.-G. and J.F.G.M.; supervision, J.M.G.M., R.R.S.-G. and M.d.C.F.F.; project administration, J.M.G.M. All authors have read and agreed to the published version of the manuscript.

Funding

This research received no external funding.

Institutional Review Board Statement

Not applicable.

Informed Consent Statement

Not applicable.

Data Availability Statement

Not applicable.

Conflicts of Interest

The authors declare no conflict of interest.

References

  1. Diez, C.M.; Moral, J.; Cabello, D.; Morello, P.; Rallo, L.; Barranco, D. Cultivar and tree density as key factors in the long-term performance of super high-density olive orchards. Front. Plant Sci. 2016, 7, 1–13. [Google Scholar] [CrossRef] [Green Version]
  2. Servicio de Estudios y Estadísticas de la Junta de Andalucía. Análisis de la Densidad en las Plantaciones de Olivar en Andalucía; Junta de Andalucía: Seville, Spain, 2019. [Google Scholar]
  3. Connor, D.J.; Gómez-del-Campo, M.; Rousseaux, M.C.; Searles, P.S. Structure, management and productivity of hedgerow olive orchards: A review. Sci. Hortic. 2014, 169, 71–93. [Google Scholar] [CrossRef]
  4. Rallo, L.; Díez, C.M.; Morales-Sillero, A.; Miho, H.; Priego-Capote, F.; Rallo, P. Quality of olives: A focus on agricultural preharvest factors. Sci. Hortic. 2018, 233, 491–509. [Google Scholar] [CrossRef]
  5. Fraga, H.; Pinto, J.G.; Santos, J.A. Climate change projections for chilling and heat forcing conditions in European vineyards and olive orchards: A multi-model assessment. Clim. Change 2019, 152, 179–193. [Google Scholar] [CrossRef]
  6. Arenas-Castro, S.; Gonçalves, J.F.; Moreno, M.; Villar, R. Projected climate changes are expected to decrease the suitability and production of olive varieties in southern Spain. Sci. Total Environ. 2020, 709, 136161. [Google Scholar] [CrossRef]
  7. Mihailescu, E.; Soares, M.B. The influence of climate on agricultural decisions for three European crops: A systematic review. Front. Sustain. Food Syst. 2020, 4, 64. [Google Scholar] [CrossRef]
  8. Sousa, A.A.R.; Barandica, J.M.; Aguilera, P.A.; Rescia, A.J. Examining potential environmental consequences of climate change and other driving forces on the sustainability of Spanish olive groves under a socio-ecological approach. Agriculture 2020, 10, 509. [Google Scholar] [CrossRef]
  9. Galán, C.; García-Mozo, H.; Vázquez, L.; Ruiz, L.; de La Guardia, C.D.; Trigo, M.M. Heat requirement for the onset of the Olea europaea L. pollen season in several sites in Andalusia and the effect of the expected future climate change. Int. J. Biometeorol. 2005, 49, 184–188. [Google Scholar] [CrossRef] [PubMed]
  10. Avolio, E.; Orlandi, F.; Bellecci, C.; Fornaciari, M.; Federico, S. Assessment of the impact of climate change on the olive flowering in Calabria (southern Italy). Theor. Appl. Climatol. 2012, 107, 531–540. [Google Scholar] [CrossRef]
  11. García-Mozo, H.; Oteros, J.; Galán, C. Phenological changes in olive (ola europaea l.) reproductive cycle in southern Spain due to climate change. Ann. Agric. Environ. Med. 2015, 22, 421–428. [Google Scholar] [CrossRef] [PubMed] [Green Version]
  12. Gabaldón-Leal, C.; Ruiz-Ramos, M.; de la Rosa, R.; León, L.; Belaj, A.; Rodríguez, A.; Santos, C.; Lorite, I.J. Impact of changes in mean and extreme temperatures caused by climate change on olive flowering in southern Spain. Int. J. Climatol. 2017, 37, 940–957. [Google Scholar] [CrossRef]
  13. Saltveit, M.E. Respiratory Metabolism. In The Commercial Storage of Fruits, Vegetables, and Florist and Nursery Stocks. Agriculture Handbook 66; Gross, K.C., Wang, C.Y., Saltveit, M., Eds.; United States Department of Agriculture: Washington, DC, USA, 2016; pp. 68–75. [Google Scholar]
  14. Fonseca, S.C.; Oliveira, F.A.R.; Brecht, J.K. Modelling respiration rate of fresh fruits and vegetables for modified atmosphere packages: A review. J. Food Eng. 2002, 52, 99–119. [Google Scholar] [CrossRef]
  15. Bendini, A.; Valli, E.; Cerretani, L.; Chiavaro, E.; Lercker, G. Study on the effects of heating of virgin olive oil blended with mildly deodorized olive oil: Focus on the hydrolytic and oxidative state. J. Agric. Food Chem. 2009, 57, 10055–10062. [Google Scholar] [CrossRef] [PubMed]
  16. Gómez-Coca, R.B.; Cruz-Hidalgo, R.; Fernandes, G.D.; Pérez-Camino, M.D.C.; Moreda, W. Analysis of methanol and ethanol in virgin olive oil. MethodsX 2014, 1, e207–e211. [Google Scholar] [CrossRef] [Green Version]
  17. García-Vico, L.; Belaj, A.; León, L.; de la Rosa, R.; Sanz, C.; Pérez, A.G. A survey of ethanol content in virgin olive oil. Food Control 2018, 91, 248–253. [Google Scholar] [CrossRef] [Green Version]
  18. Beltran, G.; Sánchez, R.; Sánchez-Ortiz, A.; Aguilera, M.P.; Bejaoui, M.A.; Jimenez, A. How ‘ground-picked’ olive fruits affect virgin olive oil ethanol content, ethyl esters and quality. J. Sci. Food Agric. 2016, 96, 3801–3806. [Google Scholar] [CrossRef] [PubMed]
  19. Jabeur, H.; Zribi, A.; Abdelhedi, R.; Bouaziz, M. Effect of olive storage conditions on Chemlali olive oil quality and the effective role of fatty acids alkyl esters in checking olive oils authenticity. Food Chem. 2015, 169, 289–296. [Google Scholar] [CrossRef] [PubMed]
  20. Plasquy, E.; García Martos, J.M.; Florido, M.C.; Sola-guirado, R.R.; García Martín, J.F. Cold storage and temperature management of olive fruit: The impact on fruit physiology and olive oil quality—A review. Processes 2021, 9, 1543. [Google Scholar] [CrossRef]
  21. Beltran, G.; Hueso, A.; Bejaoui, M.A.; Gila, A.M.; Costales, R.; Sánchez-Ortiz, A.; Aguilera, M.P.; Jimenez, A. How olive washing and storage affect fruit ethanol and virgin olive oil ethanol, ethyl esters and composition. J. Sci. Food Agric. 2021, 101, 3714–3722. [Google Scholar] [CrossRef]
  22. García, J.M.; Streif, J. The effect of controlled atmosphere storage on fruit and oil quality of “Gordal” olives. Gartenbauwissenschaft 1991, 56, 233–238. [Google Scholar]
  23. Agar, I.T.; Hess-Pierce, B.; Sourour, M.M.; Kader, A.A. Quality of Fruit and Oil of Black-Ripe Olives Is Influenced by Cultivar and Storage Period. J. Agric. Food Chem. 1998, 46, 3415–3421. [Google Scholar] [CrossRef]
  24. Yousfi, K.; Cayuela, J.A.; García, J.M. Effect of Temperature, modified atmosphere and ethylene during olive storage on quality and bitterness level of the oil. JAOCS J. Am. Oil Chem. Soc. 2009, 86, 291–296. [Google Scholar] [CrossRef]
  25. Morales-Sillero, A.; Pérez, A.G.; Casanova, L.; García, J.M. Cold storage of ‘Manzanilla de Sevilla’ and ‘Manzanilla Cacereña’ mill olives from super-high density orchards. Food Chem. 2017, 237, 1216–1225. [Google Scholar] [CrossRef] [PubMed] [Green Version]
  26. Plasquy, E.; Blanco-Roldán, G.; Florido, M.C.; García, J.M. Effects of an integrated harvest system for small producers on the quality of the recollected olive fruit. Grasas y Aceites 2021, 72, e436. [Google Scholar]
  27. García, P.; Brenes, M.; Romero, C.; Garrido, A. Respiration and physicochemical changes in harvested olive fruits. J. Hortic. Sci. 1995, 70, 925–933. [Google Scholar] [CrossRef]
  28. Plasquy, E.; Garcia, J.M.; Florido, M.C.; Sola-guirado, R.R. Estimation of the cooling rate of six olive cultivars using thermal imaging. Agriculture 2021, 11, 164. [Google Scholar] [CrossRef]
  29. Plasquy, E.; García Martos, J.M.; Florido Fernández, M.D.C.; Sola-Guirado, R.R.; García Martín, J.F. Adjustment of olive fruit temperature before grinding for olive oil extraction. experimental study and pilot plant trials. Processes 2021, 9, 586. [Google Scholar] [CrossRef]
  30. Kader, A.A. Respiration and gas exchange of vegetables. In Postharvest Physiology of Vegetables; Weichmann, J., Ed.; Marcel Dekker: New York, NY, USA, 1987; pp. 25–43. [Google Scholar]
  31. Waghmare, R.B.; Mahajan, P.V.; Annapure, U.S. Modelling the effect of time and temperature on respiration rate of selected fresh-cut produce. Postharvest Biol. Technol. 2013, 80, 25–30. [Google Scholar] [CrossRef]
  32. Redding, G.P.; Yang, A.; Shim, Y.M.; Olatunji, J.; East, A. A review of the use and design of produce simulators for horticultural forced-air cooling studies. J. Food Eng. 2016, 190, 80–93. [Google Scholar] [CrossRef]
  33. Bower, J.H.; Jobling, J.J.; Patterson, B.D.; Ryan, D.J. A method for measuring the respiration rate and respiratory quotient of detached plant tissues. Postharvest Biol. Technol. 1998, 13, 263–270. [Google Scholar] [CrossRef]
  34. Bhande, S.D.; Ravindra, M.R.; Goswami, T.K. Respiration rate of banana fruit under aerobic conditions at different storage temperatures. J. Food Eng. 2008, 87, 116–123. [Google Scholar] [CrossRef]
  35. Caleb, O.J.; Mahajan, P.V.; Opara, U.L.; Witthuhn, C.R. Modelling the respiration rates of pomegranate fruit and arils. Postharvest Biol. Technol. 2012, 64, 49–54. [Google Scholar] [CrossRef]
  36. Iqbal, T.; Rodrigues, F.A.S.; Mahajan, P.V.; Kerry, J.P. Effect of Time, temperature, and slicing on respiration rate of mushrooms. J. Food Sci. 2009, 74, E298–E303. [Google Scholar] [CrossRef] [PubMed]
  37. Exama, A.; Arul, J.; Lencki, R.W.; Lee, I.Z.; Toupin, C. Suitability of plastic films for modified atmosphere packaging of fruits and vegetables. J. Food Sci. 1993, 58, 1365–1370. [Google Scholar] [CrossRef]
  38. Zagory, D.; Kader, A. Modified atmosphere packaging of fruits and vegetables. Food Technol. 1988, 42, 70–77. [Google Scholar]
  39. Fidler, J.C.; North, C.J. The effect of conditions of storage on the respiration of apples. I. The effects of temperature and concentrations of carbon dioxide and oxygen on the production of carbon dioxide and uptake of oxygen. J. Hortic. Sci. 1967, 42, 189–206. [Google Scholar] [CrossRef]
  40. García, J.M.; Yousfi, K. The postharvest of mill olives. Grasas y Aceites 2006, 57, 16–24. [Google Scholar] [CrossRef]
  41. Clodoveo, M.L.; Delcuratolo, D.; Gomes, T.; Colelli, G. Effect of different temperatures and storage atmospheres on Coratina olive oil quality. Food Chem. 2007, 102, 571–576. [Google Scholar] [CrossRef]
  42. Kalua, C.M.; Bedgood, D.R.; Bishop, A.G.; Prenzler, P.D. Changes in virgin olive oil quality during low-temperature fruit storage. J. Agric. Food Chem. 2008, 56, 2415–2422. [Google Scholar] [CrossRef]
  43. Tanner, D.J.; Cleland, A.C.; Opara, L.U.; Robertson, T.R. A generalised mathematical modelling methodology for design of horticultural food packages exposed to refrigerated conditions: Part 1, formulation. Int. J. Refrig. 2002, 25, 33–42. [Google Scholar] [CrossRef]
  44. Ferrua, M.J.; Singh, R.P. Modeling the forced-air cooling process of fresh strawberry packages, Part I: Numerical model. Int. J. Refrig. 2009, 32, 335–348. [Google Scholar] [CrossRef]
  45. Dehghannya, J.; Ngadi, M.; Vigneault, C. Mathematical Modeling Procedures for Airflow, Heat and Mass Transfer during Forced Convection Cooling of Produce: A Review. Food Eng. Rev. 2010, 2, 227–243. [Google Scholar] [CrossRef]
  46. Zhao, C.J.; Han, J.W.; Yang, X.T.; Qian, J.P.; Fan, B.L. A review of computational fluid dynamics for forced-air cooling process. Appl. Energy 2016, 168, 314–331. [Google Scholar] [CrossRef]
  47. Sola-Guirado, R.R.; Aragon-Rodriguez, F.; Castro-Garcia, S.; Gil-Ribes, J. The vibration behaviour of hedgerow olive trees in response to mechanical harvesting with straddle harvester. Biosyst. Eng. 2019, 184, 81–89. [Google Scholar] [CrossRef]
Figure 1. Representation of the measuring device to register the consumed O2 and produced CO2 in a closed system by portable gas analyzer. Elements of the measuring device: 1. glass jar (125 mL) with 2 holes (1 cm Ø); 2. olive fruit (±40 g); 3. silicone tube (1 cm Ø); 4. plastic valve; 5. humidity filter; 6. G100 portable gas analyzer. A, B, C are the three samples of the triplicate design.
Fermentation 07 00200 g001
Figure 2. Situation of a closed system of 1 m³ volume within a container, with a distance of 0.75 m (a) from the lateral walls and 1.5 m between upper layers of the fruit and the upper site (b).
Fermentation 07 00200 g002
Figure 3. Respiration rate expressed as the O2 consumed and CO2 produced by olive fruit in a closed system kept at temperatures between 5 and 45 °C.
Fermentation 07 00200 g003
Figure 6. Consumption of available O2 within the described closed system at different temperatures, taking into account the additional heat produced by the fruit itself (adj).
Fermentation 07 00200 g006
Figure 7. Time needed to attain the threshold of 3% O2 in the described closed system kept at temperatures between 5 and 45 °C.
Fermentation 07 00200 g007
Figure 4. Experimental mean respiration rates (blue points), expressed as O2 consumed, and theoretical calculated values according to the Arrhenius equation (orange points) at temperatures between 5 and 45 °C.
Fermentation 07 00200 g004
Figure 5. Simulation of the increase of the respiration rate of olive fruits kept in a closed system, expressed as consumed O2 (mM kg−1 h−1), at different temperatures over 8 h.
Fermentation 07 00200 g005
Table 1. Amount of mg O2 consumed and mg CO2 produced per gram of olive fruit kept in a closed system at a temperature between 5 and 45 °C, over a time span of 7 h. Each value indicates the mean value of 3 replicates ± standard deviation.
TimeO2 (mg/golive)
(h)5 °C10 °C15 °C20 °C23 °C30 °C35 °C40 °C45 °C
00.55 ± 0.020.46 ± 0.000.50 ± 0.010.53 ± 0.020.53 ± 0.010.53 ± 0.020.48 ± 0.010.48 ± 0.010.40 ± 0.02
10.53 ± 0.020.42 ± 0.010.47 ± 0.010.49 ± 0.020.49 ± 0.040.42 ± 0.010.39 ± 0.010.36 ± 0.010.27 ± 0.02
20.51 ± 0.020.41 ± 0.000.44 ± 0.010.42 ± 0.020.45 ± 0.040.35 ± 0.010.27 ± 0.020.26 ± 0.030.19 ± 0.02
30.50 ± 0.020.39 ± 0.010.42 ± 0.010.37 ± 0.020.40 ± 0.030.30 ± 0.000.19 ± 0.030.16 ± 0.010.00 ± 0.00
40.50 ± 0.020.40 ± 0.010.39 ± 0.010.33 ± 0.010.36 ± 0.040.22 ± 0.000.15 ± 0.030.07 ± 0.020.00 ± 0.00
50.49 ± 0.020.37 ± 0.010.37 ± 0.020.28 ± 0.020.32 ± 0.040.16 ± 0.000.13 ± 0.030.04 ± 0.010.00 ± 0.00
60.47 ± 0.030.37 ± 0.010.35 ± 0.020.26 ± 0.020.28 ± 0.030.13 ± 0.000.12 ± 0.030.03 ± 0.010.00 ± 0.00
70.48 ± 0.020.35 ± 0.010.33 ± 0.020.24 ± 0.020.25 ± 0.030.11 ± 0.000.10 ± 0.030.04 ± 0.010.00 ± 0.00
TimeCO2 (mg/golive)
(h)5 °C10 °C15 °C20 °C23 °C30 °C35 °C40 °C45 °C
00.01 ± 0.000.02 ± 0.000.01 ± 0.000.00 ± 0.000.01 ± 0.000.00 ± 0.000.02 ± 0.000.01 ± 0.000.01 ± 0.00
10.04 ± 0.000.06 ± 0.000.04 ± 0.000.04 ± 0.000.06 ± 0.000.15 ± 0.000.17 ± 0.000.20 ± 0.000.22 ± 0.00
20.04 ± 0.000.07 ± 0.000.07 ± 0.000.09 ± 0.000.11 ± 0.000.23 ± 0.000.35 ± 0.000.34 ± 0.000.53 ± 0.00
30.05 ± 0.000.09 ± 0.000.10 ± 0.000.13 ± 0.000.16 ± 0.000.29 ± 0.000.49 ± 0.000.48 ± 0.000.63 ± 0.00
40.05 ± 0.000.10 ± 0.000.13 ± 0.000.17 ± 0.000.21 ± 0.000.39 ± 0.000.60 ± 0.000.64 ± 0.000.63 ± 0.00
50.06 ± 0.000.11 ± 0.000.15 ± 0.000.20 ± 0.000.25 ± 0.000.46 ± 0.000.65 ± 0.000.73 ± 0.000.63 ± 0.00
60.06 ± 0.000.11 ± 0.000.17 ± 0.000.23 ± 0.000.28 ± 0.000.49 ± 0.000.68 ± 0.000.73 ± 0.000.63 ± 0.00
70.06 ± 0.000.12 ± 0.000.19 ± 0.000.24 ± 0.000.31 ± 0.000.52 ± 0.000.70 ± 0.000.74 ± 0.000.63 ± 0.00
Publisher’s Note: MDPI stays neutral with regard to jurisdictional claims in published maps and institutional affiliations.

