
Survey of Inoculated Commercial Saccharomyces cerevisiae in Winery-Based Trials


1
Instituto Nacional de Investigação Agrária e Veterinária, INIAV-Dois Portos, Quinta da Almoinha, 2565-191 Dois Portos, Portugal
2
BioISI-Biosystems and Integrative Sciences Institute, Faculty of Sciences, University of Lisboa, 1749-016 Lisboa, Portugal
*
Author to whom correspondence should be addressed.
Fermentation 2021, 7(3), 176; https://0-doi-org.brum.beds.ac.uk/10.3390/fermentation7030176
Submission received: 13 August 2021
/
Revised: 27 August 2021
/
Accepted: 31 August 2021
/
Published: 3 September 2021
(This article belongs to the Special Issue Yeast Biotechnology 5.0)
Abstract
:Wine production has developed from spontaneous to controlled fermentations using commercial active dry yeasts (ADY). In this study, S. cerevisiae commercial ADY were tested, and yeast community dynamics were monitored at different fermentation stages in three winery-based trials with volumes ranging from 60 L to 250 hL. The differentiation of S. cerevisiae strains was achieved using microsatellite markers. In Experiment 1, results showed that both ADY strains revealed similar profiles, despite being described by the producer as having different properties. In Experiment 2, higher genetic diversity was detected when co-inoculation was tested, while in sequential inoculation, the initial ADY seemed to dominate throughout all fermentation. Pilot-scale red wine fermentations were performed in Experiment 3, where one single ADY strain was tested along with different oenological additives. Surprisingly, these trials showed an increase in distinct profiles towards the end of fermentation, indicating that the dominance of the ADY was lower than in the blank modality. The use of ADY is envisaged to promote a controlled and efficient alcoholic fermentation, and their purchase represents an important cost for wineries. Therefore, it is most relevant to survey commercial ADY during wine fermentation to understand if their use is effective.
1. Introduction
The use of select commercial Saccharomyces cerevisiae strains has been a common practice for wine production mostly since the end of the 20th century. The development of the wine industry has also been followed by an increase in the supply of new species and strains in the active dry yeast (ADY) production industry. Production techniques have undergone many changes and improvements, and strain selection criteria have adapted to the new requirements of winemakers, opinion makers and consumers. The production of ADY has evolved with specificities aimed at its use at the beginning or end of fermentation, suitability for lower temperatures, and reduction in the yield of alcohol or production of specific aromas, among others. In fact, nowadays, the offer of these oenological yeasts is enormous.
To evaluate the use of starter cultures, initial studies have been conducted on the laboratory scale despite the burden that this may introduce in scaling up the results to the winery level. Recent winery-based studies have shown very interesting results on the presence and/or dominance of indigenous versus commercial S. cerevisiae strains [1,2,3,4,5,6,7]. Scholl et al. investigated the presence of commercial S. cerevisiae strains in spontaneous fermentations at wineries that conduct both inoculated and spontaneous fermentations and showed that indigenous S. cerevisiae strains were found in relatively low abundance [5]. Differences were also found in the diversity of S. cerevisiae strains depending on the cultivar and the winery. Some studies have also reported on the co-inoculation of multiple S. cerevisiae strains, but overall, studies have mostly been dedicated to the influence on the volatile composition and sensory properties of the produced wines [8,9,10].
On the other hand, recent studies on the dominance of different inoculated strains have mostly been carried out on mixed fermentations with non-Saccharomyces yeasts and S. cerevisiae with the aim of understanding the behavior and interactions of strains throughout the fermentation process [11,12,13,14]. Fewer studies have focused on the population dynamics of different inoculated strains of S. cerevisiae, as reported by Gustafsson et al. [15]. Previous winery-based studies have shown that the frequently used strains Lalvin RC212 and Lalvin ICV-D254 tend to predominate, with over 80% presence even in spontaneous fermentations [16].
In order to follow S. cerevisiae population dynamics during fermentation, adequate methods that enable differentiation at the strain level are needed. Simple sequence repeat (SSR) markers are powerful biomolecular tools for the differentiation of yeast strains [17]. The development of these techniques has led to the study of population dynamics during fermentation and has opened the possibility to understand the complex roles of microorganisms in wine fermentation [1,18].
In this paper, wine fermentations carried out in the cellar using S. cerevisiae commercial ADY were performed in white and red grapes; the size of the assessed fermentations ranged from microvinifications (60 L) and pilot scale fermentations (500 L) to large-scale fermentations (250 hL). The presence of the added ADY during fermentation was monitored using microsatellite or SSR markers.
2. Materials and Methods
2.1. Yeast Strains
Different commercial ADY were used in the three experiments. ADY were selected by the wine producer depending on the desired characteristics. Table 1 summarizes the information available.
2.2. Winery Procedures
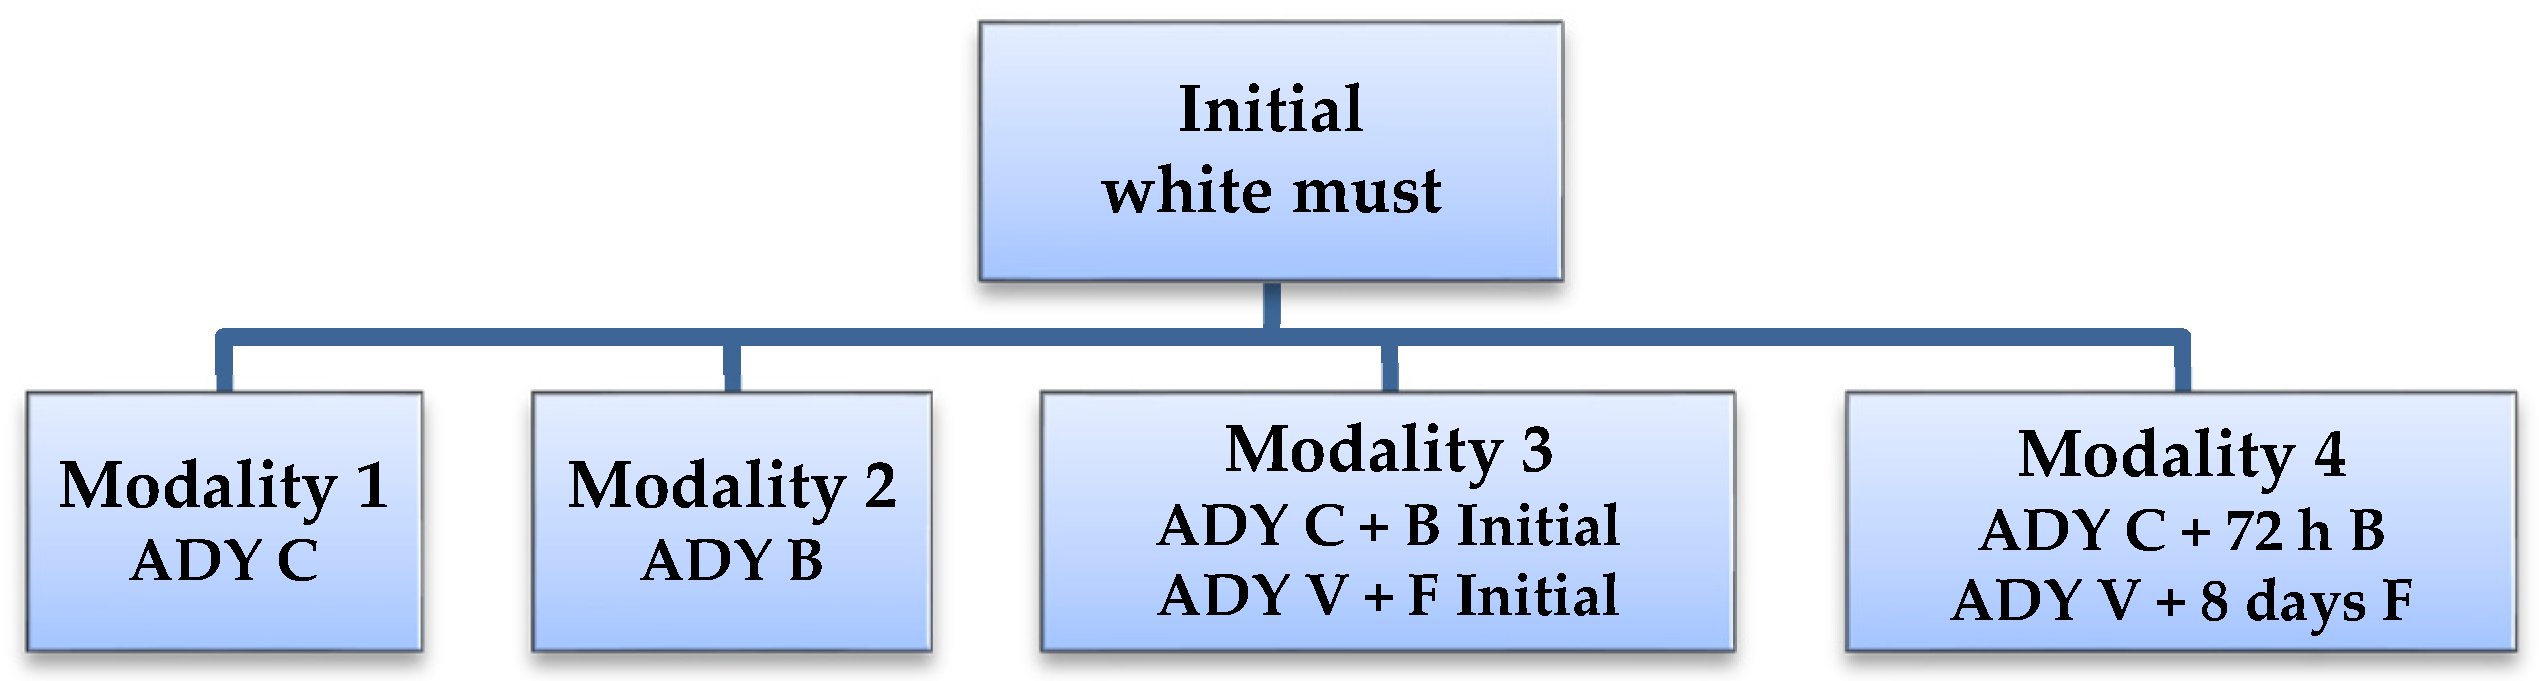
Three winery experimental trials were performed. White wine was produced in Experiment 1 and 2, while Experiment 3 produced red wine. The general setup for Experiment 1 and 2 is schematized in Figure 1.
In Experiment 3, the influence of oenological additives on the prevalence of ADY in red wine fermentations was evaluated using a single ADY strain. The fermentation activators applied were a blend of yeast nutrients (F1 and F2), and the applied tannin preparations were a blend of condensed and hydrolyzed tannins specific for color stabilization (T1 and T2), as well as a blank (B) without additives. For the five trials carried out, detailed information and procedures used were previously described [1].
2.2.1. Experiment 1
A first set of two commercial ADY was selected by the winery to ferment their wines; namely, strains C and B were selected. The winery planned to use strain C as the starter yeast and to add strain B at mid-fermentation in order to prevent stuck fermentation. Yeast rehydration was performed according to the manufacturer instructions, and 30 g/hL were added.
White must (sugars 188 g/L; total acidity 5.5 g/L tartaric acid; pH 3.29) was clarified by cold settling. SO2 was then added (50 mg/L), and the mixture was homogenized and distributed in 4 deposits of 60 L, corresponding to the four modalities of yeast addition, as represented in Figure 1: modality 1—single addition of ADY C; modality 2—single addition of ADY B; modality 3—simultaneous addition of ADY C and B; modality 4—sequential addition, wherein ADY C was added to the initial must and ADY B was added after 72 h (must density 1.032). Fermentation took place at room temperature of around 23 °C.
Three samples were collected from each modality at 2 h, 72 h and 7 days after the first ADY addition, corresponding to the initial (I), middle (M) and end (E) time periods of the fermentation process.
2.2.2. Experiment 2
A second set of two ADY was selected; specifically, these were strains V and F (Table 1). The winery planned to use strain V as the starter yeast and to add strain F at mid-fermentation in order to prevent stuck fermentations.
A white must from a different vintage was used (sugars 213 g/L) and similar procedures as Experiment 1 were performed, including cold settling and addition of SO2 (50 mg/L). Fermentation activators and pectolytic enzymes were also added. The must was proportionally distributed in two stainless steel deposits of 250 hL. Two modalities of yeast addition were performed, corresponding to modalities 3 and 4 (Figure 1): modality 3—simultaneous addition of ADY V and ADY F; modality 4—sequential addition, wherein ADY V was added to the initial must, followed by ADY F after eight days (must density 1.040). Fermentation took place at around 16 °C.
Three samples were collected from each deposit 1, 9 and 17 days after ADY addition, corresponding to the initial (I), middle (M) and end (E) time periods of the fermentation process.
2.2.3. Experiment 3
Homogenized red mush (sugars 179.5 g/L; pH 3.13) with SO2 (80 mg/L) and ADY (20 g/100 kg) was equally distributed in five tanks of 500 L each. A different fermentation activator (F1 or F2) or tannin (T1 or T2) was added to each of the corresponding four tanks, and the remaining one was set as blank [1].
Must samples were collected at the middle (M) and end (E) of the fermentation process.
2.3. Commercial Yeast Isolation
In order to determine the microsatellite profiles of the commercial ADY used, a new package of each ADY was opened in a laminar flow chamber. The yeast was resuspended in sterilized water following the supplier instructions. After yeast rehydration, serial decimal dilutions using a solution of NaCl and tryptone (8.5 g/L and 1.0 g/L, respectively; autoclaved for 15 min at 121 °C) were performed to obtain a countable number of colonies by spread plating a volume of 100 µL of the appropriate dilutions on YPD agar (yeast extract, 5 g/L, bacto-peptone, 10 g/L, glucose, 20 g/L, agar, 20 g/L). Twenty-five random colonies of each ADY were further purified and used for SSR analysis.
2.4. Fermentation Yeasts Isolation
Three must samples were collected from each fermentation at each time point. Appropriate serial dilutions were performed, and samples were spread plated on a grape must-agar medium (diluted grape must, 50%, v/v; pH 5; agar 20 g/L). After 48 h at 25 °C, 10 colonies of each triplicate presenting with the S. cerevisiae morphology type (whitish and slightly brilliant, butyrous, smooth, raised and occasionally conical, entire margin and opaque) were randomly collected and further purified. Cultures were maintained on YPD agar at 4 °C.
The yeast isolates were screened on lysine medium agar (lysine hydrochloride, Sigma-Aldrich, added to Yeast Carbon Base, Difco Laboratories) in order to exclude the non-Saccharomyces yeasts (lysine+).
2.5. DNA Extraction and Purification
Procedures were performed as described by Duarte et al. [1]. Briefly, cells were suspended in a lysing buffer and disrupted using glass beads. DNA was purified with chloroform:isoamyl alcohol (24:1) and precipitated with 1/10 volume of sodium acetate (3 M, pH 5.2) and two volumes of absolute ethanol followed by incubation with RNase (100 µg/mL in TE: 10 mM tris-HCl and 1 mM EDTA, pH 8) for 30 min at 37 °C. DNA was washed with ethanol (70%, v/v), dried and resuspended in TE.
2.6. Microsatellite Analysis
The same six SSR loci mentioned by Duarte et al. [1] were used, namely ScAAT1, ScAAT2, ScAAT3, ScAAT5, SCYOR267C and SC8132X [19,20]. SSR amplifications were conducted in two multiplex reactions as previously described [1]. The first multiplex with primers ScAAT1, ScAAT2 and ScAAT5 was performed following the conditions already described by Pérez et al. [19]. The other multiplex reaction with primers ScAAT3, SCYOR267C and SC8132X was optimized. The amplification conditions consisted of an initial denaturation step at 94 °C for five min, followed by 10 cycles of 15 s at 94 °C, 30 s at 68 °C (decreasing 1 °C per cycle to 57 °C) and 45 s at 72 °C; this was then followed by 25 cycles of 15 s at 94 °C, 30 s at 58 °C, and 45 s at 72 °C, and a final step of 5 min at 72 °C [1]. An aliquot of 1–2 µL of the amplified product, 0.5 µL of Ceq DNA Size Standard kit-600 (Beckman Coulter Inc., Fullerton, California, CA, USA) and 25 µL formamide were sequentially dispensed on a 96-well sample plate. Separation was performed by capillary electrophoresis (6 kV; 50 °C; capillary 30 cm length; 35 min) on a CEQ 8000 Genetic Analysis System (Beckman Coulter Inc., Fullerton, California, CA, USA).
2.7. Data Analysis
3. Results and Discussion
The microsatellite profiles of the commercial ADY used in the three winery experiments, as well as fermentation isolates, were determined. The genetic distance between the isolates is represented by dendrograms, built based on the Nei distance [22] and the clustering method UPGMA.
3.1. Experiment 1
In this experiment, 60 L fermentation deposits were used and 2 commercial ADY were tested. ADY C is, according to the manufacturer, a S. cerevisiae r.f. uvarum which is cryotolerant, with a high production of aromatic compounds with a positive effect on the wine sensory characteristics. ADY B is, according to the manufacturer, a S. cerevisiae r.f. bayanus more suitable for the control, regularization and restart of fermentation.
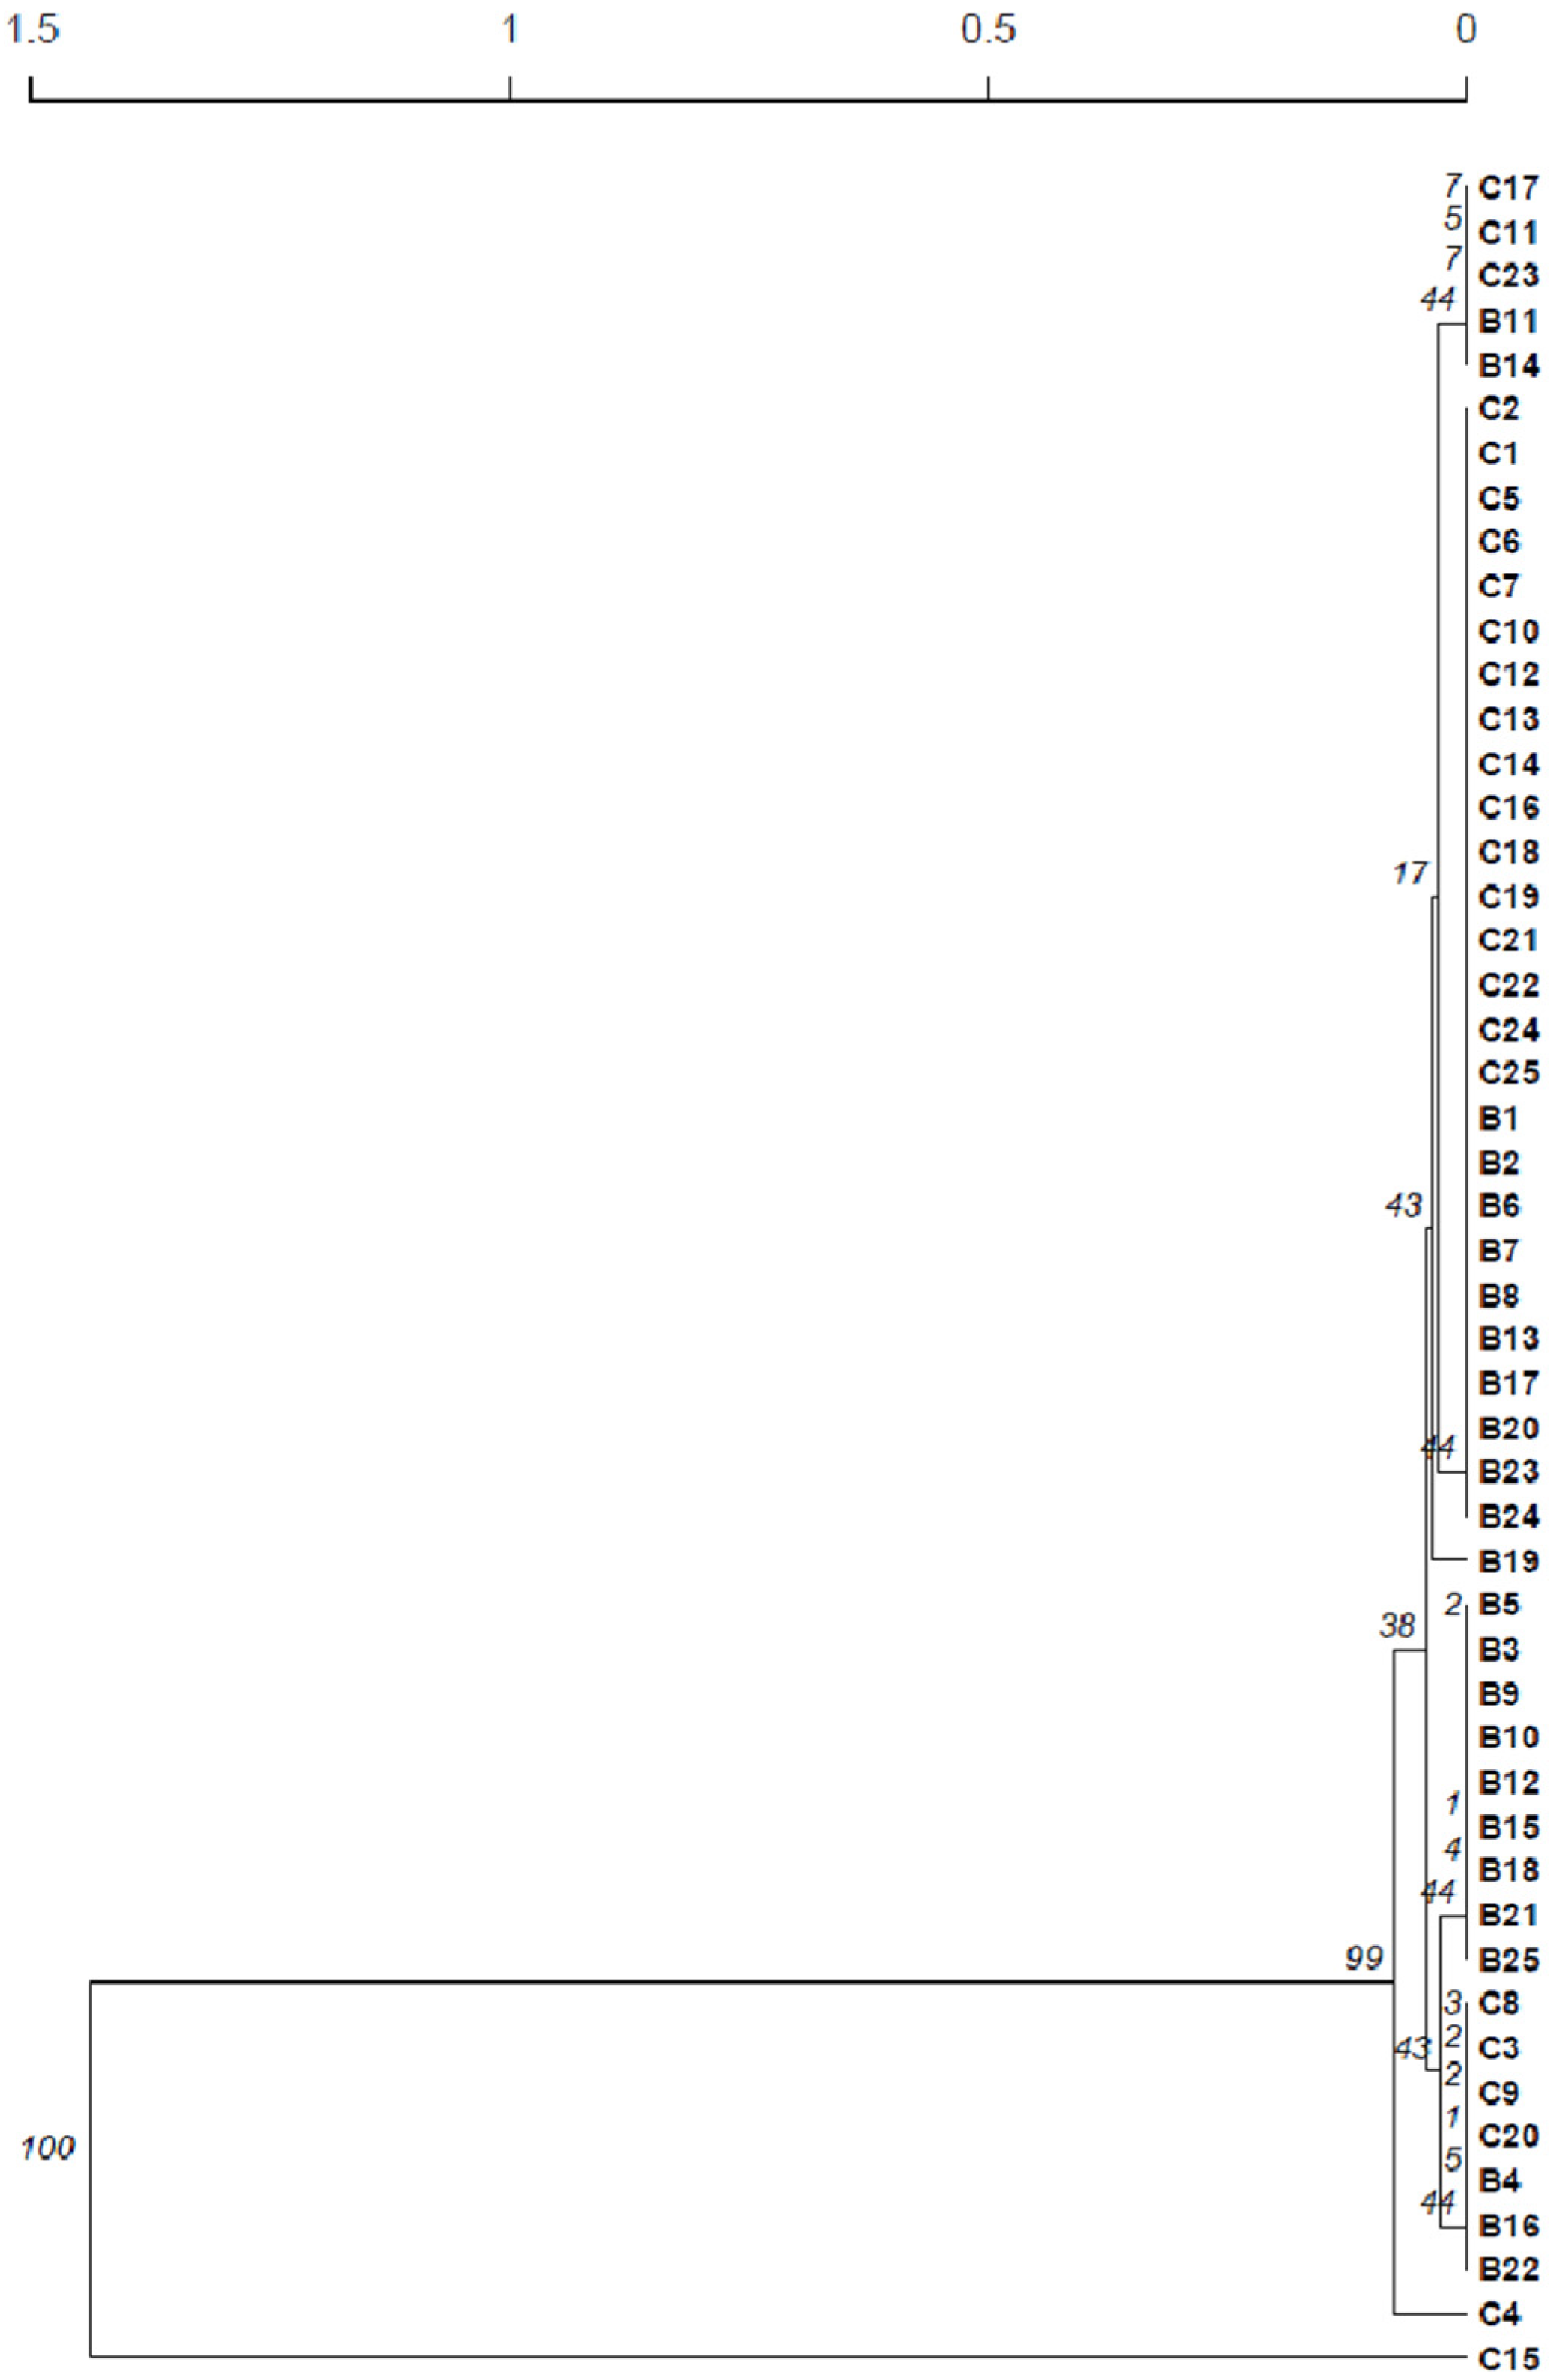
The dendrogram presented in Figure 2 compares the 25 isolates from ADY B with the 25 isolates from ADY C based on the microsatellite profiles. Isolates from ADY B were genetically closer to 24 isolates from ADY C, with a total of six profiles shared by isolates from each of the two ADY, C and B. Only the isolate C15 from ADY C presented a genetically distant profile.
Surprisingly, the SSR profiles of the isolates of commercial ADY C and B showed a high similarity, clearly evidenced by the dendrogram in Figure 2. These two ADY commercial preparations were, most probably, originated from the same yeast strain. This result made it impossible to study the evolution of the added yeast or yeast mixtures during fermentation, as their profiles were similar.
The presence of S. cerevisiae isolates presenting profiles genetically distant from those found for the ADY C and B, which might correspond to native yeasts, were only detected at the beginning of fermentation (results not shown).
This result highlights the major importance of using molecular markers for certifying the commercial yeasts present in the market, as is already a current requirement for the grapevine varieties trade.
3.2. Experiment 2
In this experiment, fermentation deposits of 250 hL were used. These deposits were close to the conditions usually used by the winery, and two commercial ADY were also tested. ADY V (Anchor, South Africa) is suited for the production of fresh and fruity white and rosé wines to enhance volatile thiol aromas (passion fruit, grapefruit, gooseberry and guava), to produce esters (tropical fruit salad, floral) and killer positive. ADY F (DSM, The Netherlands) is a fructophilic yeast to prevent and restart stuck fermentation. ADY F does not produce secondary aromas and preserves the specific characteristics of the must when restarting fermentation. This experiment was performed utilizing modalities 3 and 4 (Figure 1).
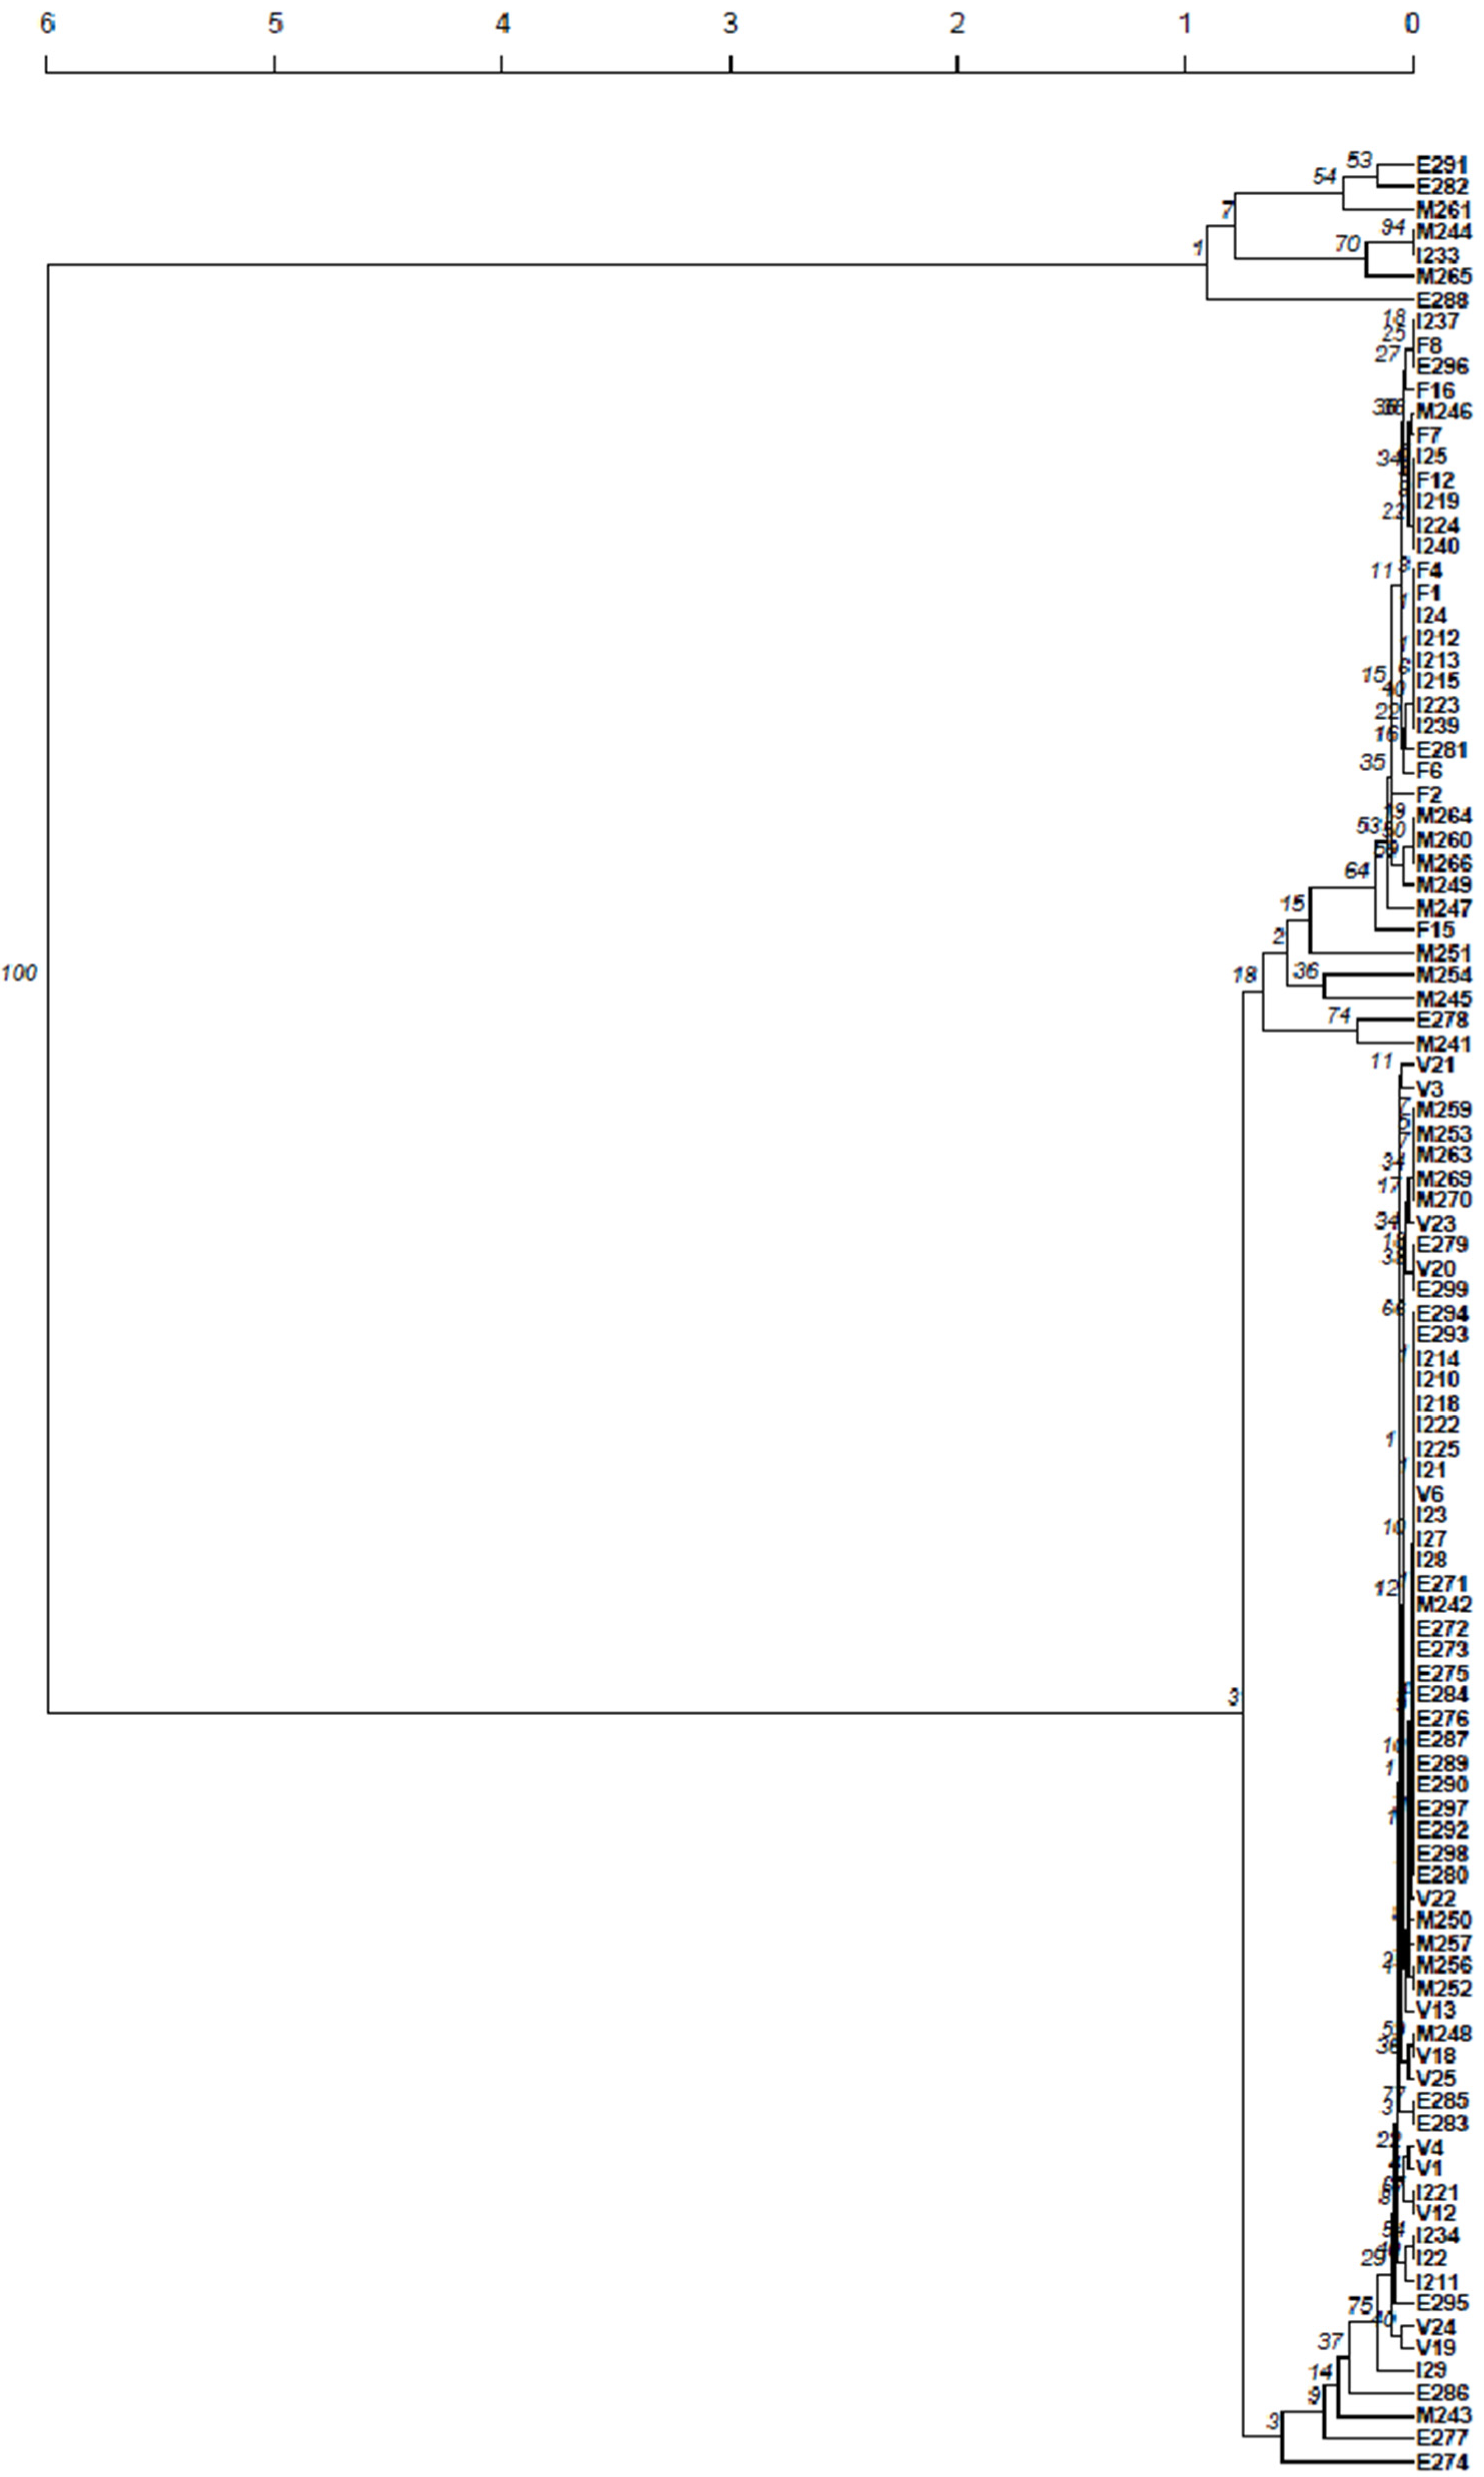
For the 25 ADY V isolates, 14 different SSR profiles were obtained, although these profiles were genetically very close. This can be observed from the dendrograms of Figure 3 and Figure 4, where those profiles were included together with the profiles of the yeast isolates from the initial (I), middle (M) and end (E) time periods of the fermentation of modalities 3 and 4, respectively. Concerning the 25 isolates of ADY F, 9 different profiles were obtained. However, these profiles are genetically very close, as can be seen in the dendrograms of Figure 3 and Figure 4.
It is important to notice that the profiles for ADY V and ADY F were genetically distant from each other, allowing their differentiation.
Regarding modality 3, where both ADY were added at the beginning of fermentation, the isolates from the initial, middle and end periods of fermentation presented with profiles genetically closer to ADY V and ADY F (Figure 3). Though similar numbers of each ADY were detected at the beginning, towards the end of fermentation, a prevalence of genetically closer ADY V profiles was observed; 20 isolates were identified, and only two ADY F profiles were detected. Isolates genetically distant from these ADY profiles, probably corresponding to native yeasts, were also detected at the initial (one isolate), middle (8) and end (7) periods of fermentation.
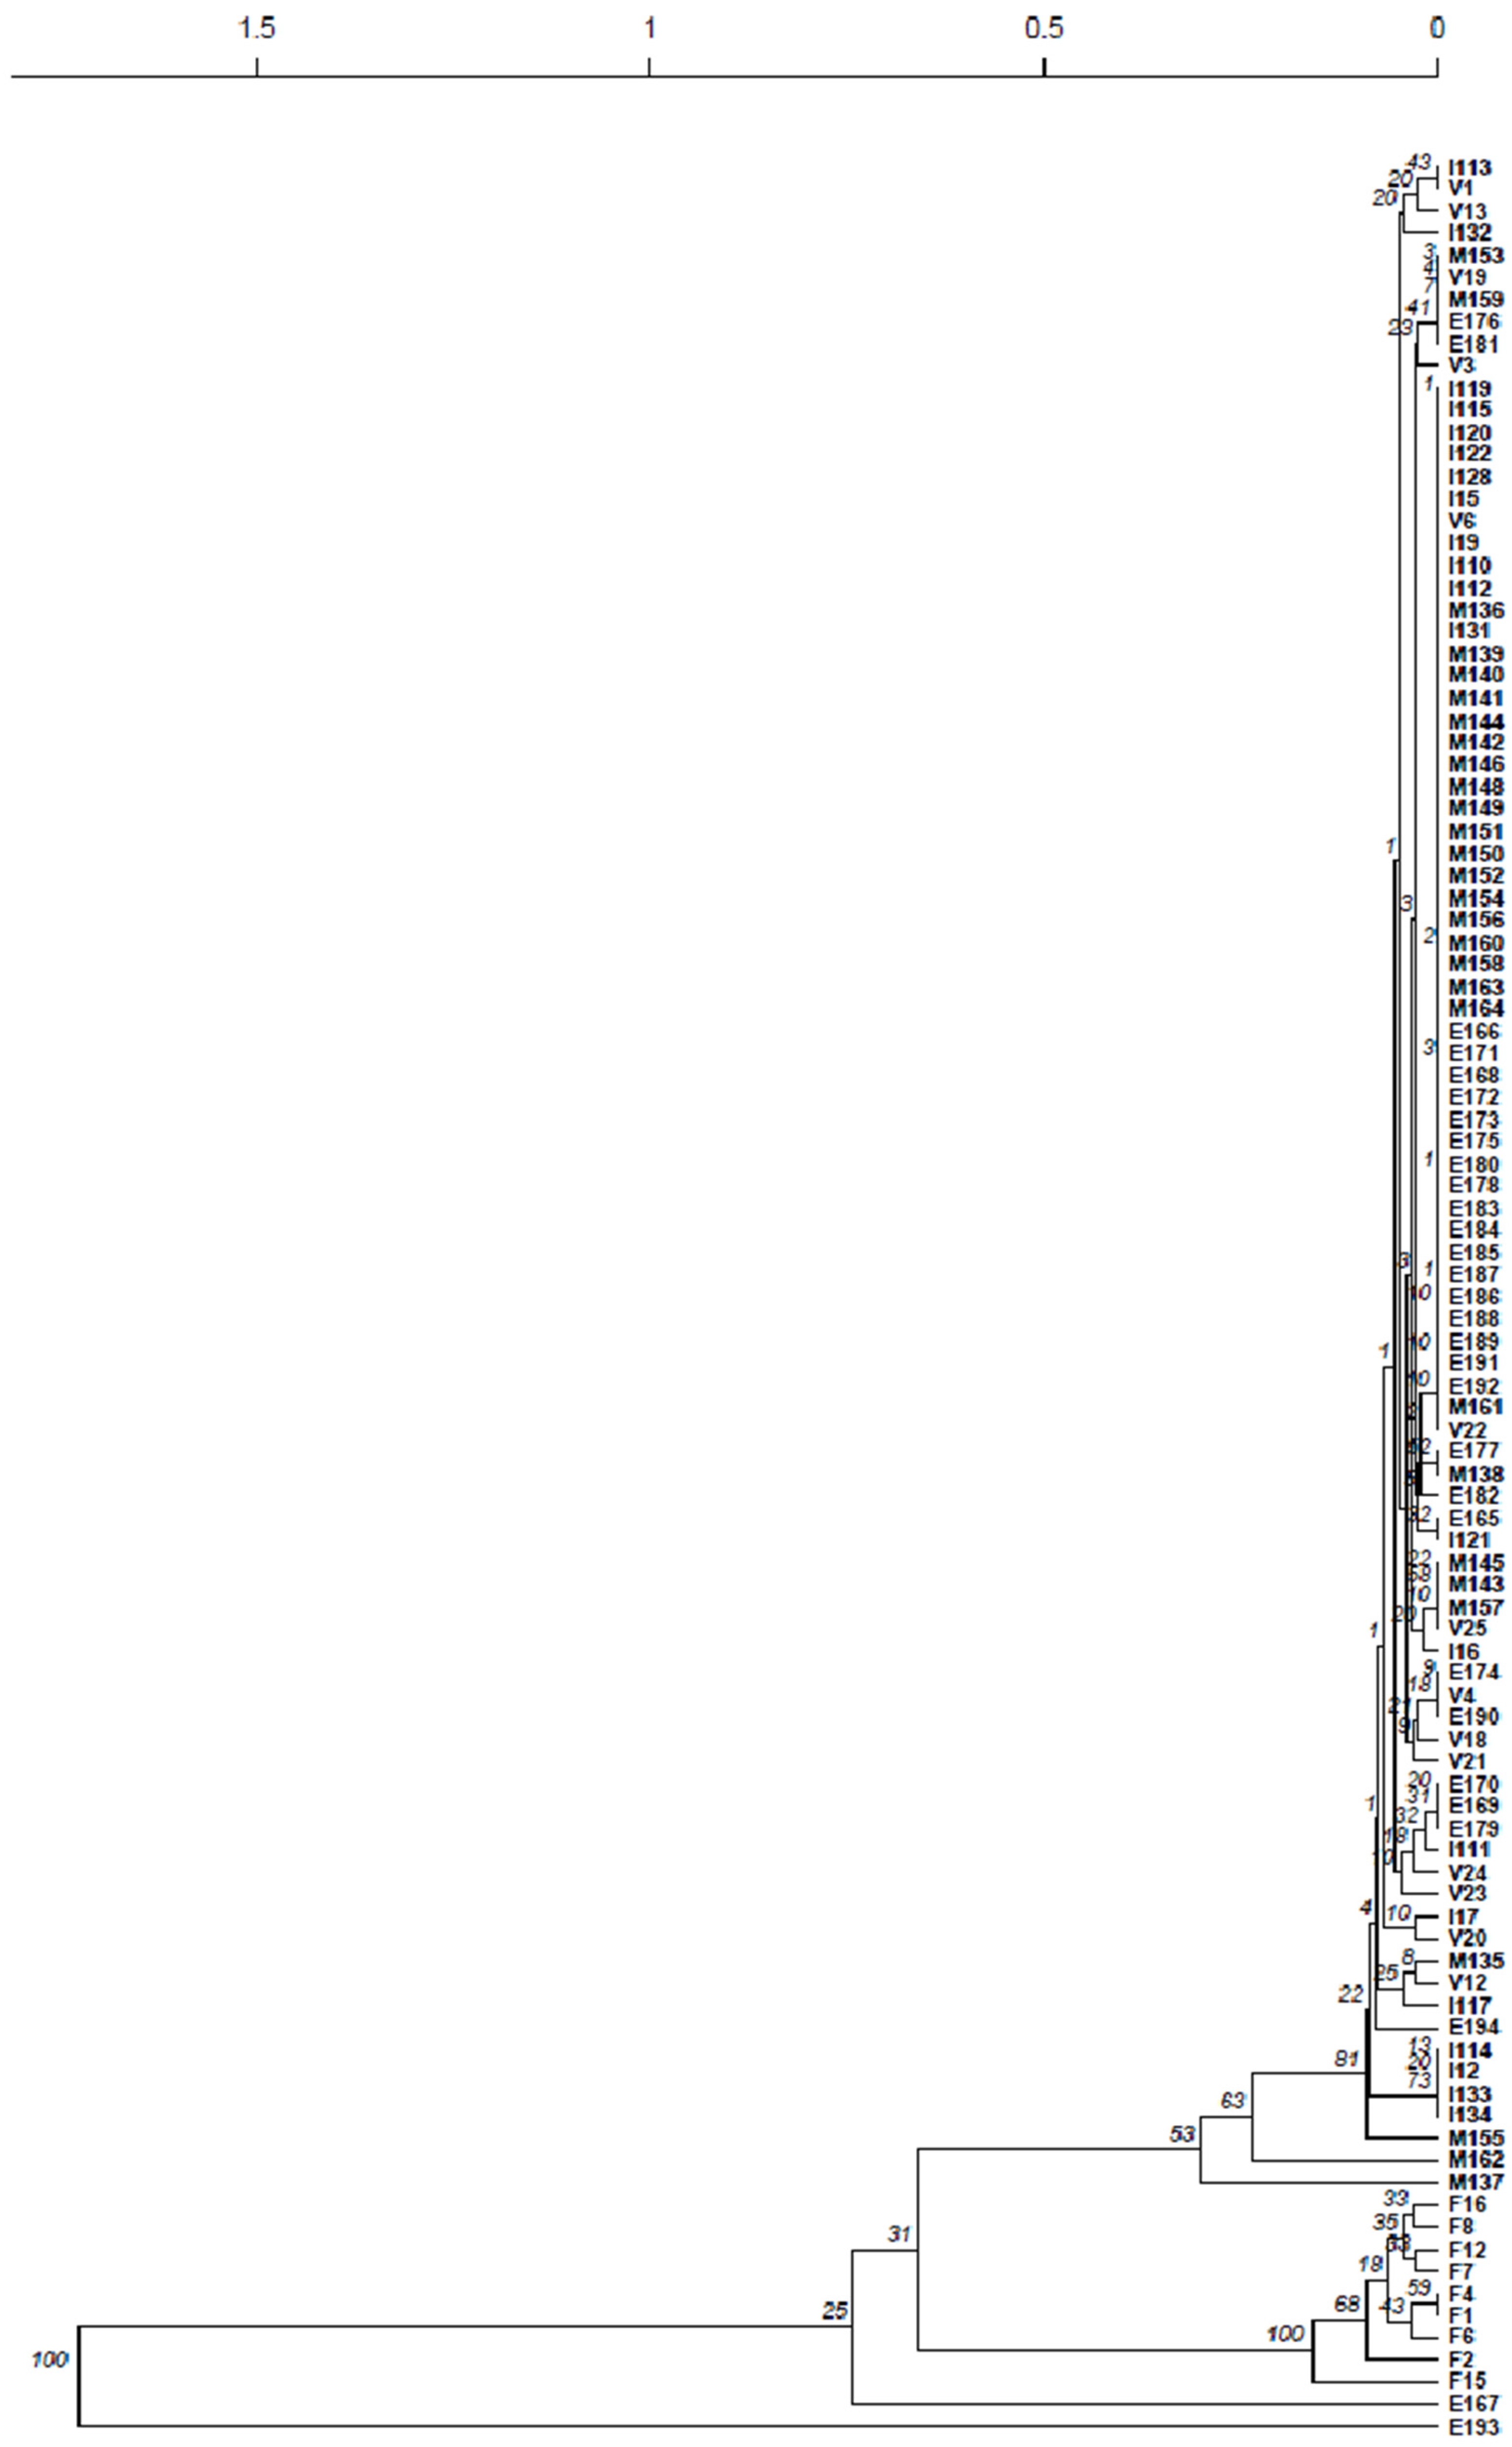
For modality 4, where ADY F was added at mid-fermentation, only isolates with profiles genetically closer to ADY V were detected. This occurred at the beginning, where it was expected, but also at the middle and end of fermentation (Figure 4). Moreover, two isolates each from the middle and end of fermentation presented profiles genetically distant from ADY profiles, most likely corresponding to native yeasts.
Higher genetic diversity was detected when the two ADY were added at the beginning of fermentation (modality 3), with both ADY detected throughout the fermentation and a high number of native yeasts detected at the middle and end of fermentation. On the contrary, for modality 4, the ADY V added at the beginning of fermentation seemed to dominate, as no ADY F profile was detected during fermentation and a lower number of native yeasts were also detected. Several works have already shown that the inoculum of S. cerevisiae ADY cells, both commercial and indigenous, ensures a very rapid dominance of a single strain and the suppression of natural microbiota [23,24,25].
Additionally, it was interesting to observe that sequential inoculation (modality 4) resulted in a slower fermentation, a stable number of viable cells and a higher wine quality (Figures S1 and S2 in supplementary data). Co-inoculation (modality 3) resulted in a faster fermentation, resulting in a decline in the number of cells with culture viability and a low-quality wine (Figures S1 and S2).
This study showed that despite ADY sequential addition, only the first inoculated strain was detected, inferring its dominance during fermentation. Other works have reported that the use of starter cultures does not always guarantee the dominance of the inoculated strain [1,26,27]. It is important to further evaluate in future works if single addition of ADY V would result in the same fermentation performance and wine characteristics, thus saving money and work for the winery.
3.3. Experiment 3
Pilot-scale red wine fermentations of 500 L volume were performed in the winery, where fermentation modalities included the use of fermentation activators and tannin preparations.
Must samples were collected at the middle (must density between 1.044 and 1.053) (M) and end of fermentation (E) (must density between 0.998 and 1.006; just before the separation of grape solids from the wine).
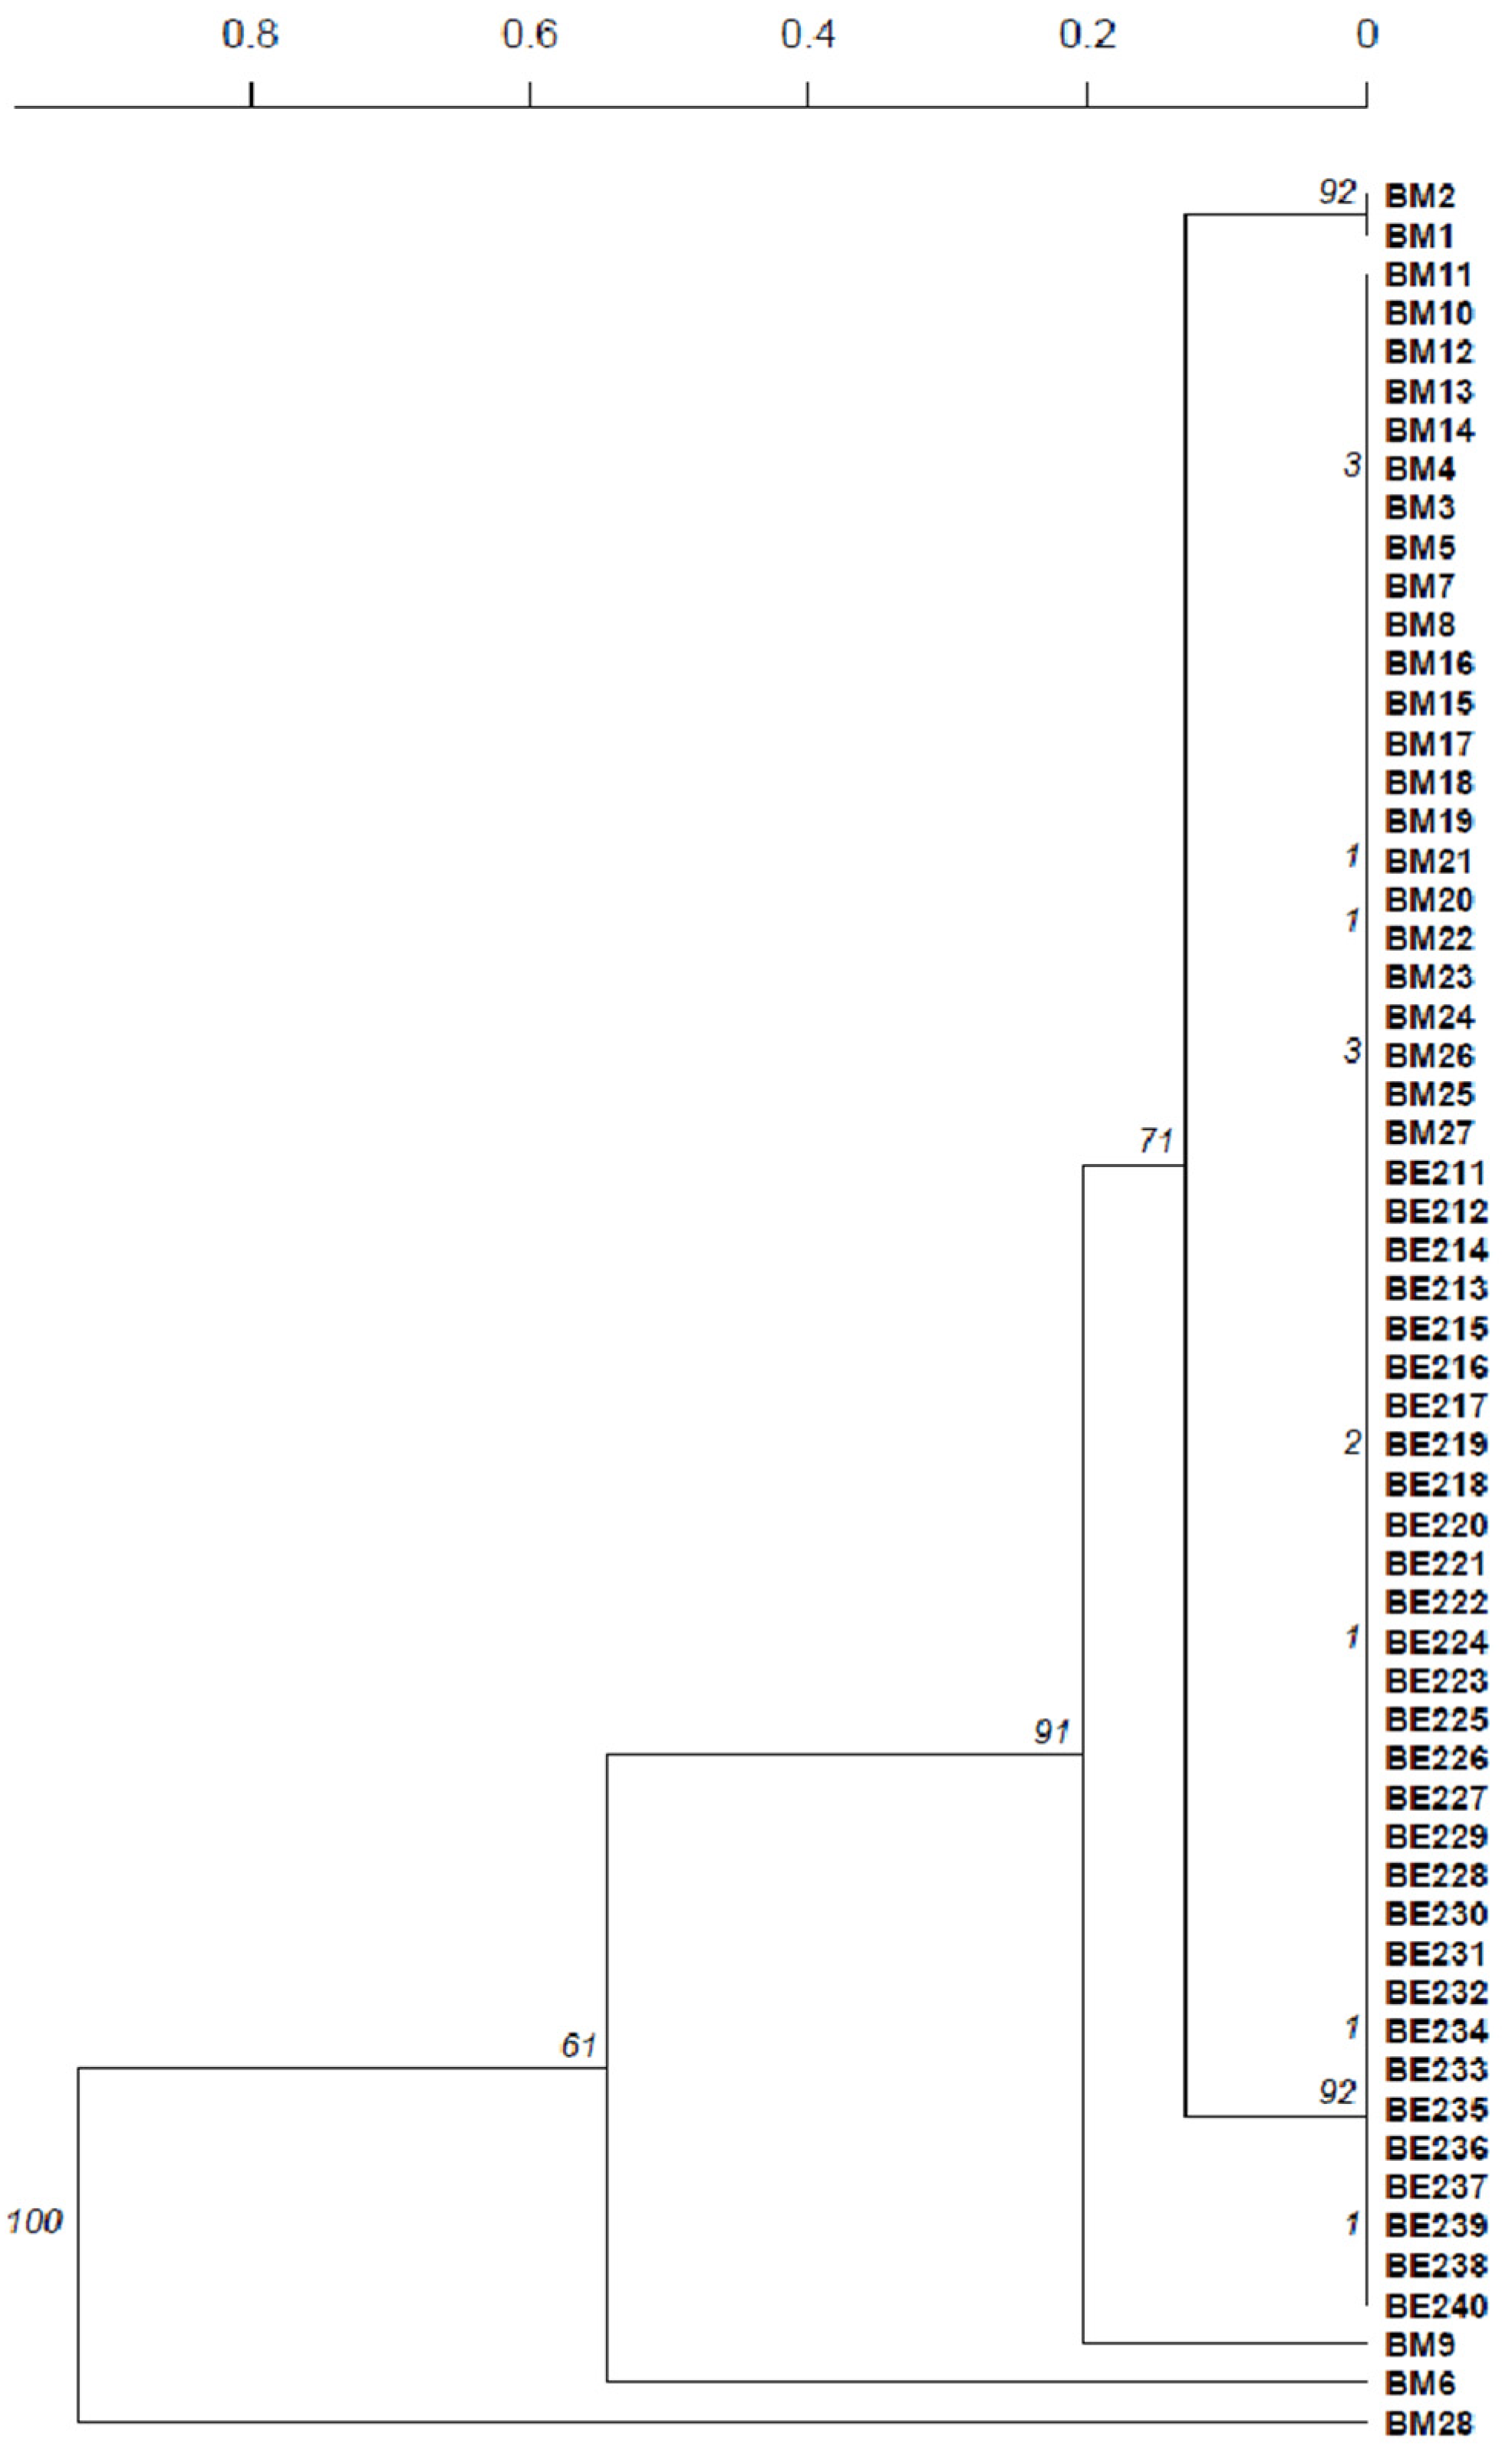
The isolates from the ADY D used in this experiment presented a single profile with only one allele for each locus. The majority of the isolates of the blank modality, without additives, presented a profile similar to the ADY. Only five isolates during the middle of fermentation presented a profile genetically distant from the ADY profile; these most certainly corresponded to native yeasts (Figure 5). By the end of fermentation, only isolates presenting the ADY profile were detected, indicating a dominance of the starter yeast.
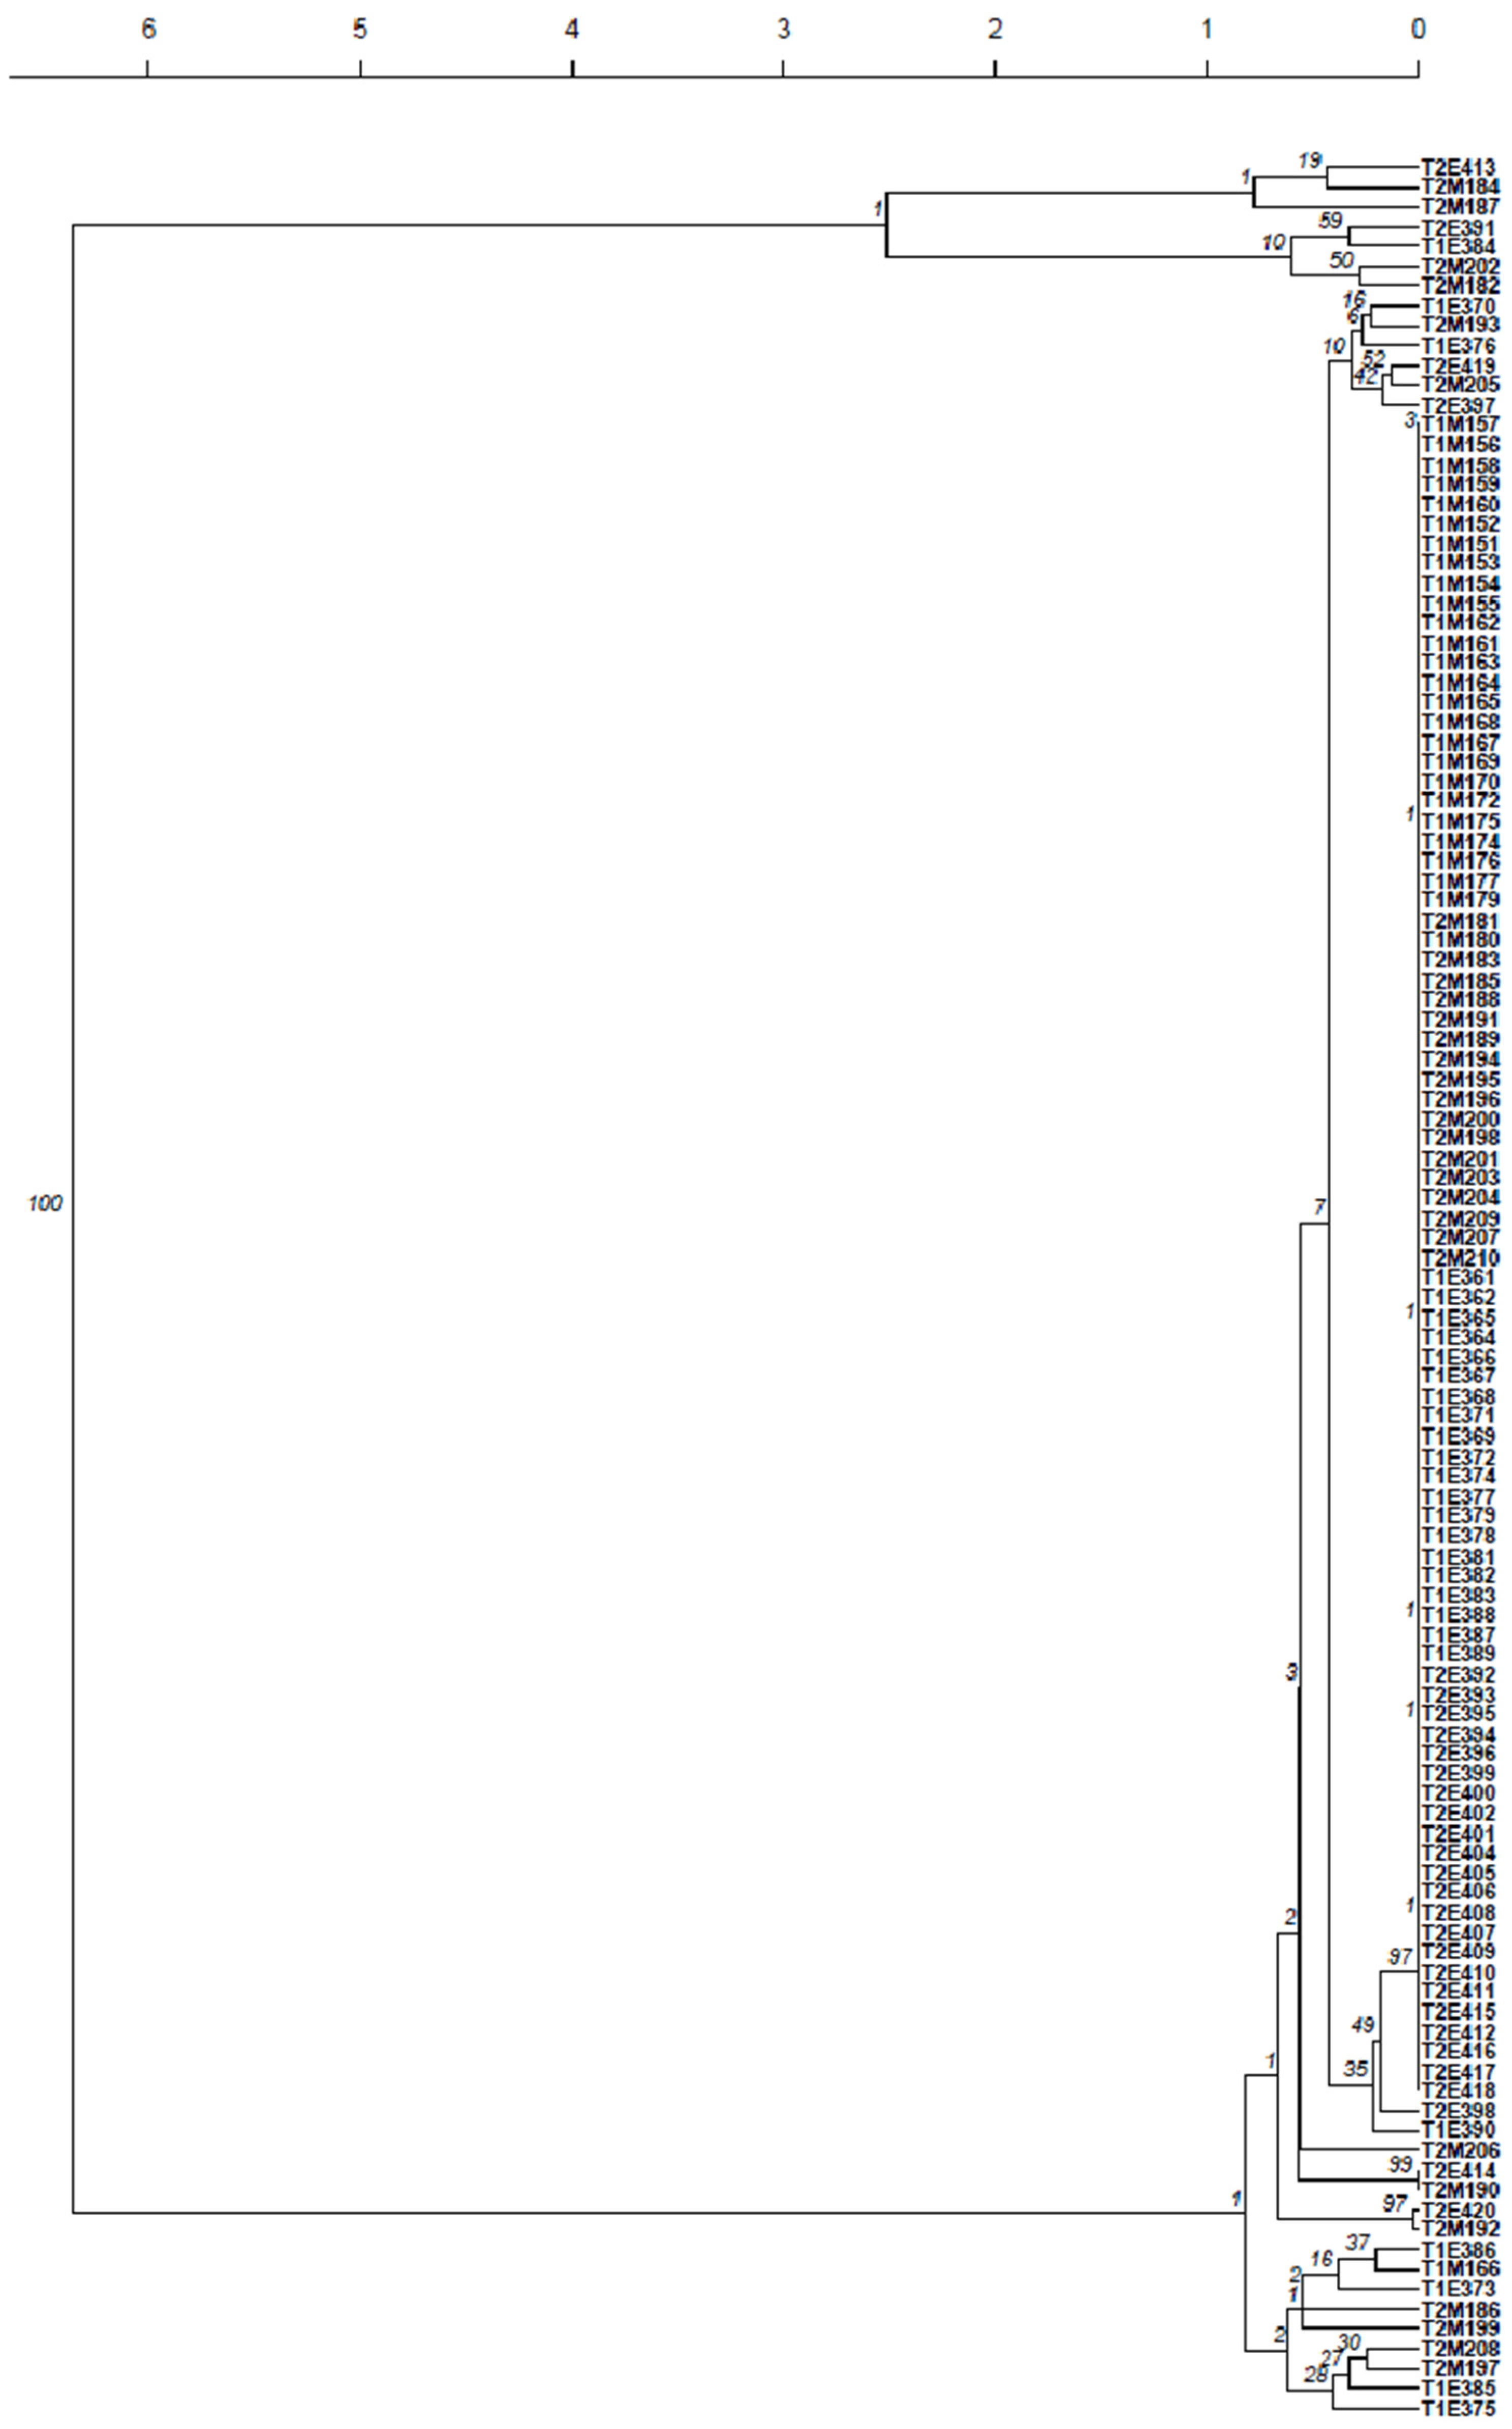
Regarding the addition of fermentation activators, two commercial preparations were used; these were F1 and F2. Although the majority of the isolates obtained at the middle and end of the fermentation presented a profile genetically similar to the ADY profile, genetically distant profiles were also detected, most probably corresponding to native yeasts (Figure 6). A higher number of isolates with genetically distant profiles was detected when the F1 fermentation activator was used. Surprisingly, both fermentation activator (F1 and F2) trials showed an increase in distinct profiles towards the end of fermentation, indicating that the dominance of the ADY was lower than in the blank modality. Lower ADY implantation was found with oenological additives, as already observed in a previous work [1].
In relation to tannin preparations T1 and T2, a high number of isolates presenting profiles genetically distant from the ADY profile was observed (Figure 7). For T2, at middle fermentation, almost half of the isolates corresponded to native yeasts. At the end of fermentation, a high number of isolates with profiles genetically distant from the ADY profile was detected. It can therefore be assumed that these additives negatively influenced the ADY implantation.
A putative influence of fermentation activators and tannin preparations on ADY strain implantation during fermentation was observed. In all trials, a negative correlation was observed on the dominance of ADY D when compared with the blank modality. All trials showed an increase in the number of genetically distant profiles from the ADY towards the end of fermentation, except for T2, which, nevertheless, presented a high number of native yeast at the end of fermentation.
The relevance of this study is attributed to the fermentation procedures tested, which were close to industrial winery conditions. The application of SSR markers to S. cerevisiae strain characterization in the winery environment, as previously reported [17], was revealed once more to be a powerful tool.
4. Conclusions
In this study, S. cerevisiae commercial ADY were tested, and yeast dynamics were monitored in white and red wine fermentation winery trials. The purchase of ADY is an important cost for wineries and is mostly relevant to achieve constant and controlled fermentations. The study of ADY implantation could not be achieved in one of the trials, as both commercial ADY strains used revealed similar SSR profiles. These results emphasized the need for rigorous control on the production and commercialization of ADY, ideally through molecular certification.
Higher genetic diversity was detected when co-inoculation was tested. In sequential inoculation, the initial ADY predominated over fermentation, while other SSR profiles, either the ADY added sequentially or native yeasts, were less detected. This result may question the effectiveness of the second inoculation. Therefore, one of the envisaged future works is to evaluate if a single addition of the initial ADY would result in the same fermentation performance and wine characteristics, thus reducing the additional cost and work for the winery inherent to the use of a second ADY. Likewise, a possible negative influence of oenological additives on ADY efficiency was detected, as the ADY was less detected when compared to the blank deposit.
Overall, there are many factors influencing the dynamics of ADY strains in wine fermentation. This type of survey is of utmost importance to ensure their effectiveness during fermentation and to achieve the desired sensorial quality, as the use of ADY is often directed to increase the sensorial complexity of wines using different strains of S. cerevisiae and, more recently, even non-Saccharomyces species.
Supplementary Materials
The following are available online at https://0-www-mdpi-com.brum.beds.ac.uk/article/10.3390/fermentation7030176/s1. Figure S1. Fermentation evolution evaluated by must density (D) and yeast cell counts (evaluated by culture) (Y) for modalities 3 and 4 of Experiment 2; Figure S2. Overall quality of the wines obtained for modalities 3 and 4 of experiment 2. The bars represent the average value obtained with 8 experts from the INIAV Dois Portos tasting panel. The standard deviation is indicated by the error bars at the top.
Author Contributions
Conceptualization, F.L.D. and M.M.B.-C.; methodology, F.L.D. and M.M.B.-C.; software, F.L.D. and M.M.B.-C.; formal analysis, F.L.D. and M.M.B.-C.; investigation, F.L.D. and M.M.B.-C.; data curation, F.L.D. and M.M.B.-C.; writing—original draft preparation, F.L.D. and M.M.B.-C.; writing—review and editing, F.L.D. and M.M.B.-C.; visualization, F.L.D. and M.M.B.-C. All authors have read and agreed to the published version of the manuscript.
Funding
This research received no external funding.
Institutional Review Board Statement
Not applicable.
Informed Consent Statement
Not applicable.
Data Availability Statement
The data presented in this study are available on request from the corresponding author. The data are not publicly available due to producers’ privacy.
Acknowledgments
The authors wish to acknowledge the wineries involved in the trials.
Conflicts of Interest
The authors declare no conflict of interest.
References
- Duarte, F.L.; Alves, A.C.; Alemão, M.F.; Baleiras-Couto, M.M. Influence of red wine fermentation oenological additives on inoculated strain implantation. World J. Microbiol. Biotechnol. 2013, 6, 1139–1144. [Google Scholar] [CrossRef]
- Perrone, B.; Giacosa, S.; Rolle, L.; Cocolin, L.; Rantsiou, K. Investigation of the dominance behavior of Saccharomyces cerevisiae strains during wine fermentation. Int. J. Food Microbiol. 2013, 2, 156–162. [Google Scholar] [CrossRef] [PubMed]
- Lange, J.N.; Faasse, E.; Tantikachornkiat, M.; Gustafsson, F.S.; Halvorsen, L.C.; Kluftinger, A.; Ledderhof, D.; Durall, D.M. Implantation and persistence of yeast inoculum in Pinot noir fermentations at three Canadian wineries. Int. J. Food Microbiol. 2014, 180, 56–61. [Google Scholar] [CrossRef]
- Martiniuk, J.T.; Pacheco, B.; Russell, G.; Tong, S.; Backstrom, I.; Measday, V. Impact of Commercial Strain Use on Saccharomyces cerevisiae Population Structure and Dynamics in Pinot Noir Vineyards and Spontaneous Fermentations of a Canadian Winery. PLoS ONE 2016, 8, e0160259. [Google Scholar] [CrossRef] [PubMed] [Green Version]
- Scholl, C.M.; Morgan, S.C.; Stone, M.L.; Tantikachornkiat, M.; Neuner, M.; Durall, D.M. Composition of Saccharomyces cerevisiae strains in spontaneous fermentations of Pinot Noir and Chardonnay. Aust. J. Grape Wine Res. 2016, 22, 384–390. [Google Scholar] [CrossRef]
- Aponte, M.; Romano, R.; Villano, C.; Blaiotta, G. Dominance of S. cerevisiae Commercial Starter Strains during Greco di Tufo and Aglianico Wine Fermentations and Evaluation of Oenological Performances of Some Indigenous/Residential Strains. Foods 2020, 9, 1549. [Google Scholar] [CrossRef]
- Tantikachornkiat, M.; Morgan, S.; Lepitre, M.; Cliff, M.; Durall, D. Yeast and bacterial inoculation practices influence the microbial communities of barrel-fermented Chardonnay wines. Aust. J. Grape Wine Res. 2020, 26, 279–289. [Google Scholar] [CrossRef]
- King, E.S.; Swiegers, J.H.; Travis, B.; Francis, I.L.; Bastian, S.E.P.; Pretorius, I.S. Coinoculated Fermentations Using Saccharomyces Yeasts Affect the Volatile Composition and Sensory Properties of Vitis vinifera L. cv. Sauvignon Blanc Wines. J. Agric. Food Chem. 2008, 56, 10829–10837. [Google Scholar] [CrossRef]
- King, E.S.; Kievit, R.L.; Curtin, C.; Swiegers, J.H.; Pretorius, I.S.; Bastian, S.E.P.; Francis, I.L. The Effect of Multiple Yeasts Co-Inoculations on Sauvignon Blanc Wine Aroma Composition, Sensory Properties and Consumer Preference. Food Chem. 2010, 122, 618–626. [Google Scholar] [CrossRef]
- Saberi, S.; Cliff, M.A.; van Vuuren, H.J.J. Impact of Mixed S. cerevisiae Strains on the Production of Volatiles and Estimated Sensory Profiles of ChardonnayWines. Food Res. Int. 2012, 48, 725–735. [Google Scholar] [CrossRef]
- Contreras, A.; Curtin, C.; Varela, C. Yeast population dynamics reveal a potential ‘collaboration’ between Metschnikowia pulcherrima and Saccharomyces uvarum for the production of reduced alcohol wines during Shiraz fermentation. Appl. Microbiol. Biotechnol. 2015, 99, 1885–1895. [Google Scholar] [CrossRef] [PubMed]
- Padilla, B.; Zulian, L.; Ferreres, À.; Pastor, R.; Esteve-Zarzoso, B.; Beltran, G.; Mas, A. Sequential Inoculation of Native Non-Saccharomyces and Saccharomyces cerevisiae Strains for Wine Making. Front. Microbiol. 2017, 8, 1293–1314. [Google Scholar] [CrossRef]
- Dimopoulou, M.; Troianou, V.; Toumpeki, C.; Gosselin, Y.; Dorignac, É.; Kotseridis, Y. Effect of strains from different Saccharomyces species used in different inoculation schemes on chemical composition and sensory characteristics of Sauvignon blanc wine. OENO One 2020, 4, 745–759. [Google Scholar] [CrossRef]
- Zhu, X.; Torija, M.-J.; Mas, A.; Beltran, G.; Navarro, Y. Effect of a Multistarter Yeast Inoculum on Ethanol Reduction and Population Dynamics in Wine Fermentation. Foods 2021, 10, 623. [Google Scholar] [CrossRef] [PubMed]
- Gustafsson, F.S.; Jiranek, V.; Neuner, M.; Scholl, C.M.; Morgan, S.C.; Durall, D.M. The Interaction of Two Saccharomyces cerevisiae Strains Affects Fermentation-Derived Compounds in Wine. Fermentation 2016, 2, 9. [Google Scholar] [CrossRef]
- Hall, B.; Durall, D.M.; Stanley, G. Population Dynamics of Saccharomyces cerevisiae during Spontaneous Fermentation at a British ColumbiaWinery. Am. J. Enol. Vitic. 2011, 62, 66–72. [Google Scholar] [CrossRef]
- Rex, F.; Hirschler, A.; Scharfenberger-Schmeer, M. SSR-Marker Analysis—A Method for S. cerevisiae Strain Characterization and Its Application for Wineries. Fermentation 2020, 6, 101. [Google Scholar] [CrossRef]
- Kioroglou, D.; LLeixá, J.; Mas, A.; Portillo, M.D.C. Massive Sequencing: A New Tool for the Control of Alcoholic Fermentation in Wine? Fermentation 2018, 4, 7. [Google Scholar] [CrossRef] [Green Version]
- Pérez, M.A.; Gallego, F.J.; Martinéz, I.; Hidalgo, P. Detection, distribution and selection of microsatellites (SSRs) in the genome of the yeast Saccharomyces cerevisiae as molecular markers. Lett. Appl. Microbiol. 2001, 33, 461–466. [Google Scholar] [CrossRef]
- González-Techera, A.; Jubany, S.; Carrau, F.M.; Gaggero, C. Differentiation of industrial wine yeast strains using microsatellite markers. Lett. Appl. Microbiol. 2001, 33, 71–75. [Google Scholar] [CrossRef] [PubMed]
- R Core Team. R: A Language and Environment for Statistical Computing; R Foundation for Statistical Computing: Vienna, Austria, 2019. [Google Scholar]
- Nei, M. Estimation of average heterozygosity and genetic distance from a small number of individuals. Genetics 1978, 89, 583–590. [Google Scholar] [CrossRef]
- Ciani, M.; Capece, A.; Comitini, F.; Canonico, L.; Siesto, G.; Romano, P. Yeast Interactions in Inoculated Wine Fermentation. Front. Microbiol. 2016, 7, 555. [Google Scholar] [CrossRef] [Green Version]
- Capece, A.; Pietrafesa, R.; Siesto, G.; Romaniello, R.; Condelli, N.; Romano, P. Selected Indigenous Saccharomyces cerevisiae Strains as Profitable Strategy to Preserve Typical Traits of Primitivo Wine. Fermentation 2019, 5, 87. [Google Scholar] [CrossRef] [Green Version]
- Philipp, C.; Bagheri, B.; Horacek, M.; Eder, P.; Bauer, F.F.; Setati, M.E. Inoculation of grape musts with single strains of Saccharomyces cerevisiae yeast reduces the diversity of chemical profiles of wines. PLoS ONE 2021, 7, e0254919. [Google Scholar] [CrossRef]
- Barrajón, N.; Arévalo-Villena, M.; Úbeda, J.; Briones, A. Enological properties in wild and commercial Saccharomyces cerevisiae yeasts: Relationship with competition during alcoholic fermentation. World J. Microbiol. Biotechnol. 2011, 27, 2703–2710. [Google Scholar] [CrossRef]
- Capece, A.; Romaniello, R.; Poeta, C.; Siesto, G.; Massari, C.; Pietrafesa, R.; Romano, P. Control of inoculated fermentations in wine cellars by mitochondrial DNA analysis of starter yeast. Ann. Microbiol. 2011, 61, 49–56. [Google Scholar] [CrossRef]
Figure 1.
Schematic representation of white must experiments. Experiment 1—ADY C and B; experiment 2—ADY V and F.
Figure 1.
Schematic representation of white must experiments. Experiment 1—ADY C and B; experiment 2—ADY V and F.

Figure 2.
Dendrogram presenting the genetic distance between the ADY used in experiment 1, based on the microsatellite profiles. C—ADY C isolates; B—ADY B isolates; both are followed by the number of the isolate. Scale at top represents genetic distance.
Figure 2.
Dendrogram presenting the genetic distance between the ADY used in experiment 1, based on the microsatellite profiles. C—ADY C isolates; B—ADY B isolates; both are followed by the number of the isolate. Scale at top represents genetic distance.

Figure 3.
Dendrogram presenting the genetic distance between the isolates from Experiment 2, modality 3 and the ADY isolates, based on the microsatellite profiles. V—ADY V isolates; F—ADY F isolates; isolates from fermentation are represented by a letter; I—initial, M—middle or E—end time periods of fermentation, followed by the number of the isolate. Scale at top represents genetic distance.

Figure 4.
Dendrogram presenting the genetic distance between the isolates from Experiment 2, modality 4 and the ADY isolates, based on the microsatellite profiles. V—ADY V isolates; F—ADY F isolates; isolates from fermentation are represented by a letter; I—initial, M—middle or E—end time periods of fermentation, followed by the number of the isolate. Scale at top represents genetic distance.

Figure 5.
Dendrogram presenting the genetic distance between the isolates from the blank modality based on the microsatellite profiles. Isolates from fermentation are represented by the letters BM or BE, corresponding to middle or end of the blank fermentation, respectively, followed by the number of the isolate. Scale at top represents genetic distance.

Figure 6.
Dendrogram presenting the genetic distance between the isolates from the fermentation activator modality based on microsatellite profiles. Isolates from fermentation are represented by F1 or F2, depending on the fermentation activator used, followed by the letter M—middle or E—end of fermentation, and finally the number of the isolate. Scale at top represents genetic distance.

Figure 7.
Dendrogram presenting the genetic distance between the isolates from the tannin preparation modality based on the microsatellite profiles. Isolates from fermentation are represented by T1 or T2, depending on the tannin preparation used, followed by the letter M—middle or E—end of fermentation, and finally the number of the isolate. Scale at top represents genetic distance.


Table 1.
ADY used in the experiments, as well as their respective codes and suppliers.
| Strain | Code | Supplier | Experiment |
|---|---|---|---|
| S. cerevisiae r.f. uvarum | C | AEB Bioquímica, SA Portugal | 1 |
| S. cerevisiae r.f. bayanus | B | AEB Bioquímica, SA Portugal | 1 |
| S. cerevisiae hybrid | V | Anchor, South Africa | 2 |
| S. cerevisiae var. bayanus | F | DSM, The Netherlands | 2 |
| S. cerevisiae, var. cerevisiae | D | Proenol, Vila Nova de Gaia | 3 |
Publisher’s Note: MDPI stays neutral with regard to jurisdictional claims in published maps and institutional affiliations. |
© 2021 by the authors. Licensee MDPI, Basel, Switzerland. This article is an open access article distributed under the terms and conditions of the Creative Commons Attribution (CC BY) license (https://creativecommons.org/licenses/by/4.0/).
Share and Cite
MDPI and ACS Style
Duarte, F.L.; Baleiras-Couto, M.M. Survey of Inoculated Commercial Saccharomyces cerevisiae in Winery-Based Trials. Fermentation 2021, 7, 176. https://0-doi-org.brum.beds.ac.uk/10.3390/fermentation7030176
AMA Style
Duarte FL, Baleiras-Couto MM. Survey of Inoculated Commercial Saccharomyces cerevisiae in Winery-Based Trials. Fermentation. 2021; 7(3):176. https://0-doi-org.brum.beds.ac.uk/10.3390/fermentation7030176
Chicago/Turabian StyleDuarte, Filomena L., and M. Margarida Baleiras-Couto. 2021. "Survey of Inoculated Commercial Saccharomyces cerevisiae in Winery-Based Trials" Fermentation 7, no. 3: 176. https://0-doi-org.brum.beds.ac.uk/10.3390/fermentation7030176
Note that from the first issue of 2016, this journal uses article numbers instead of page numbers. See further details here.