Article

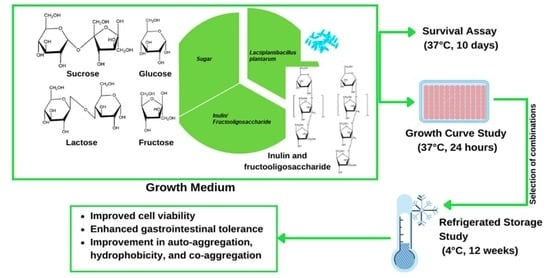
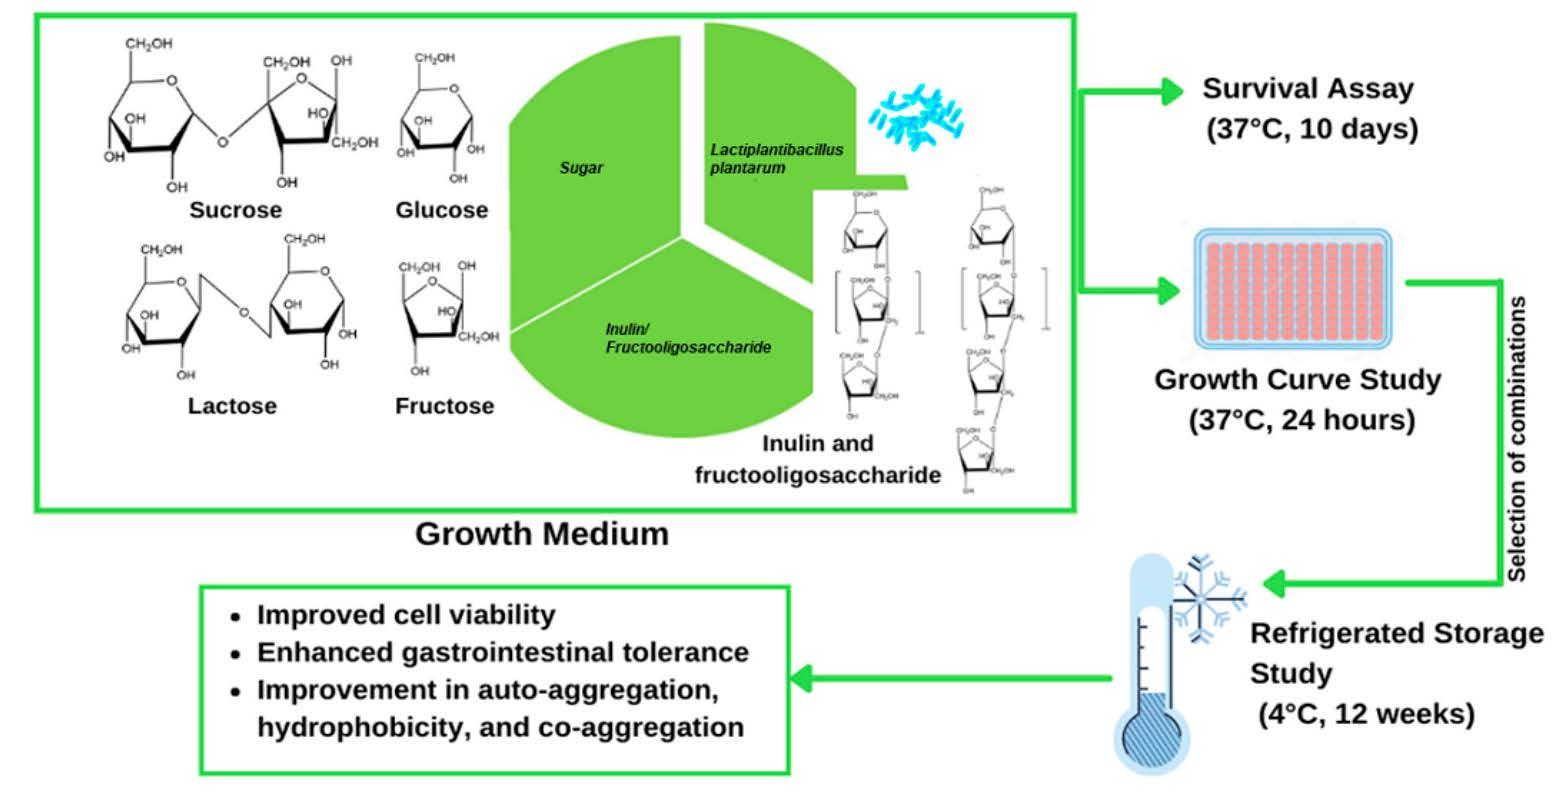
Viability, Storage Stability and In Vitro Gastrointestinal Tolerance of Lactiplantibacillus plantarum Grown in Model Sugar Systems with Inulin and Fructooligosaccharide Supplementation

School of Science, Monash University Malaysia, Subang Jaya 47500, Selangor, Malaysia
*
Author to whom correspondence should be addressed.
Submission received: 9 September 2021 / Revised: 21 October 2021 / Accepted: 25 October 2021 / Published: 6 November 2021
(This article belongs to the Special Issue Fermented and Functional Food)

Abstract

:
This study aims to investigate the effects of inulin and fructooligosaccharides (FOS) supplementation on the viability, storage stability, and in vitro gastrointestinal tolerance of Lactiplantibacillus plantarum in different sugar systems using 24 h growth and 10 days survival studies at 37 °C, inulin, and FOS (0%, 0.5%, 1%, 2%, 3% and 4%) supplementation in 2%, 3%, and 4% glucose, fructose, lactose, and sucrose systems. Based on the highest percentage increase in growth index, sucrose and lactose were more suitable sugar substrates for inulin and FOS supplementation. In survival studies, based on cell viability, inulin supplementation showed a better protective effect than FOS in 3% and 4% sucrose and lactose systems. Four selected sucrose and lactose systems supplemented with inulin and FOS were used in a 12-week storage stability study at 4 °C. Inulin (3%, 4%) and FOS (2%, 4%) supplementation in sucrose and lactose systems greatly enhanced the refrigerated storage stability of L. plantarum. In the gastrointestinal tolerance study, an increase in the bacterial survival rate (%) showed that the supplementation of FOS in lactose and sucrose systems improved the storage viability of L. plantarum. Both inulin and FOS supplementation in sucrose and lactose systems improved the hydrophobicity, auto-aggregation, co-aggregation ability of L. plantarum with Escherichia coli and Enterococcus faecalis.

Graphical Abstract

1. Introduction

Inulin and fructooligosaccharides (FOS) are among the most studied and well-established prebiotics. Inulin and FOS consist of a linear chain of fructose, constituted by a monomeric unit of fructose linked by beta glycosidic (2, 1) bonds, with a terminal glucose unit. Inulin has a heterogeneous degree of polymerization ranging (DP) from 6 to 60, while FOS has a DP ranging from 2 to 10 [1,2,3]. The inability of the human digestive system to hydrolyze fructans is due to the lack of effective hydrolytic enzymes that can break β linkages [4]. However, probiotics such as Lactobacillus and Bifidobacterium can degrade these bonds. Furthermore, inulin and FOS are known to modulate intestinal microflora composition and metabolic activity, promoting the growth of bifidogenic bacteria [5]. There are a number of researchers investigating the effect of prebiotics on the viability of probiotics in various food products such as fermented milk [6,7], yogurts [8,9], soy milk [10], fruit juices [11], oat-based products [12], and fermented cream cheese [13]. These studies show inconsistent effects of prebiotics, particularly the effect of oligosaccharides on the growth and viability of probiotics in complex food matrices. Hence, we hypothesized here that the effect of prebiotics on probiotic strains in various food products might be due to the different sugar compositions of these foods.
Lactiplantibacillus plantarum, formerly known as Lactobacillus plantarum [14], is generally regarded as safe (GRAS) and has a long history of safe usage in food products as probiotics. Apart from its abundances in environmental niches, including dairy, meat, and food spoilage, it is a well-known common indigenous bacterium of the human gastrointestinal tract [15]. L. plantarum is a Gram-positive, non-spore forming, heterofermentative strain, representing its natural ability to survive in the gastrointestinal tract and convert hexose sugars into an organic acid [16,17,18]. L. plantarum primarily produces lactic acid and acetic acid along with traces of tartaric acid, malic acid, and citric acid [18,19]. L. plantarum also produces antimicrobial peptides [20,21], short-chain fatty acids (SCFA) [22], vitamin B12 [23], folate [24], and exopolysaccharides [25] during subsequent fermentation, including gases (H2 and CO2). SCFAs, namely acetate, butyrate, propionate, and lactate, plays an essential role in intestinal health: they provide an energy source for microbial growth and physiological effects, including reducing systemic inflammation, curbing glucose homeostasis and satiety, promoting weight loss, enhancing lipid metabolism, and enhancing mineral absorption [26]. In addition, L. plantarum shows tolerance towards pH as low as 2.5 and moderate to low levels of bile salts. These add to its ability to survive in the gastric transit and colonization of the intestinal tract of humans [15,27].
L. plantarum is a facultative heterofermentative: they can either produce different end products such as lactic acid, acetic acid, and carbon dioxide similar to heterofermentative bacteria or only produce lactic acid depending on the type of sugars available for fermentation [28]. The ability of L. plantarum to convert lactose, sucrose, glucose, and fructose to lactic acid via the glycolysis and phosphoketolase pathway makes it an essential bacterial species used in fermentation [29]. Inulin and FOS are hydrolyzed by β-fructofuranosidase, an extracellular enzyme produced by L. plantarum, which can degrade inulin into shorter fractions of sucrose, fructose, and inulin with a DP up to 6 [30]. Two routes are proposed to hydrolyze FOS: FOS are transported intact into the cytoplasm where they are hydrolyzed, or extracellular enzymes hydrolyze them; then the hydrolysates are transported into the cytoplasm [31]. Several studies have reported an inducible operon in Lactobacillus spp. A fructofuranosidase gene associated with the ATP-binding cassette (ABC) transport system was reported in L. acidophilus [32]. Similarly, an ATP-dependent transport system was reported by Kaplan, Hutkins [33] in L. paracasei 1195 and a set of five genes located in a single locus encoding sucrose phosphoenolpyruvate transport system (PTS), a β-fructofuranosidase, a fructokinase, an α-glucosidase, and a sucrose operon repressor were identified in L. plantarum WCFS1 [34]. In a previous study on another Lactobacillus strain, the effects of inulin and FOS on the growth and viability of Lactobacillus casei in media containing different sugars such as glucose, fructose, sucrose, and lactose were investigated [35]. However, as probiotic properties are strain-specific [36], the present study investigates the effects of inulin and FOS supplementation on the growth, storage stability, and in vitro gastrointestinal tolerance of different L. plantarum sugar systems. In addition, the effects of inulin and FOS supplementation on the surface properties of L. plantarum, such as auto-aggregation, co-aggregation, and hydrophobicity, were investigated.

2. Materials and Methods

2.1. Microbial Culture and Materials

Lactiplantibacillus plantarum (ATCC 8014), Escherichia coli (ATCC 25922), and Enterococcus faecalis (ATCC 29212) were purchased directly from American Type Culture Collection (ATCC) (Manassas, VA, USA).
De Man, Rogosa and Sharpe (MRS) media, agar powder, phosphate-buffered saline (PBS) tablets, anaerogens, lysozyme, bile salts, pepsin, pancreatin, peptone, sodium chloride (NaCl), potassium chloride (KCl), calcium chloride (CaCl2), and yeast extract were purchased from Oxoid, Hampshire, UK. Glucose, fructose, sucrose, lactose, tween-80, and gram staining kit were purchased from Sigma-Aldrich, St. Louis, MO, USA. Sodium bicarbonate (NaHCO3), ammonium bicarbonate (NH4HCO3), magnesium sulfate (MgSO4), manganese (II) sulfate (MnSO4), dipotassium phosphate (K2PO4) was purchased from Friendemann Schmidt, Perth, Australia. Inulin and fructooligosaccharide (FOS) were obtained from Fiatec Biosystems Sdn. Bhd, Puchong, Malaysia. According to the company, the average degree of polymerization (DP) for inulin and FOS was reported to be ≥10 and between three to eight, respectively.

2.2. Reactivation of Probiotic Culture and Preparation of Inoculum

L. plantarum was activated from glycerol stock according to the method of Nazzaro et al. [37]. Glycerol stock of L. plantarum was streaked on MRS agar and incubated anaerobically in anaerobic jars (Anaerobic Plus System, Oxoid, Hampshire, UK) at 37 °C for 48 h with AnaeroGen sachets (Oxoid, Hampshire, UK). A single colony of L. plantarum from MRS agar was transferred to 10 mL of MRS broth and incubated at 37 °C for 48 h under anaerobic condition followed by centrifugation at 10,000× g for 10 min at 4 °C. The supernatant was removed, and cell pellets obtained were washed thrice with PBS before inoculating into MRS media. The bacterial culture was regularly sub-cultured and maintained on MRS agar plates at 4 °C along with gram staining to detect cross-contamination with other microorganisms.
During inoculum preparation, L. plantarum is grown in MRS broth for 18 at 37 °C, 120 rpm incubator shaker under anaerobic condition followed by centrifugation at 10,000× g for 10 min at 4 °C.

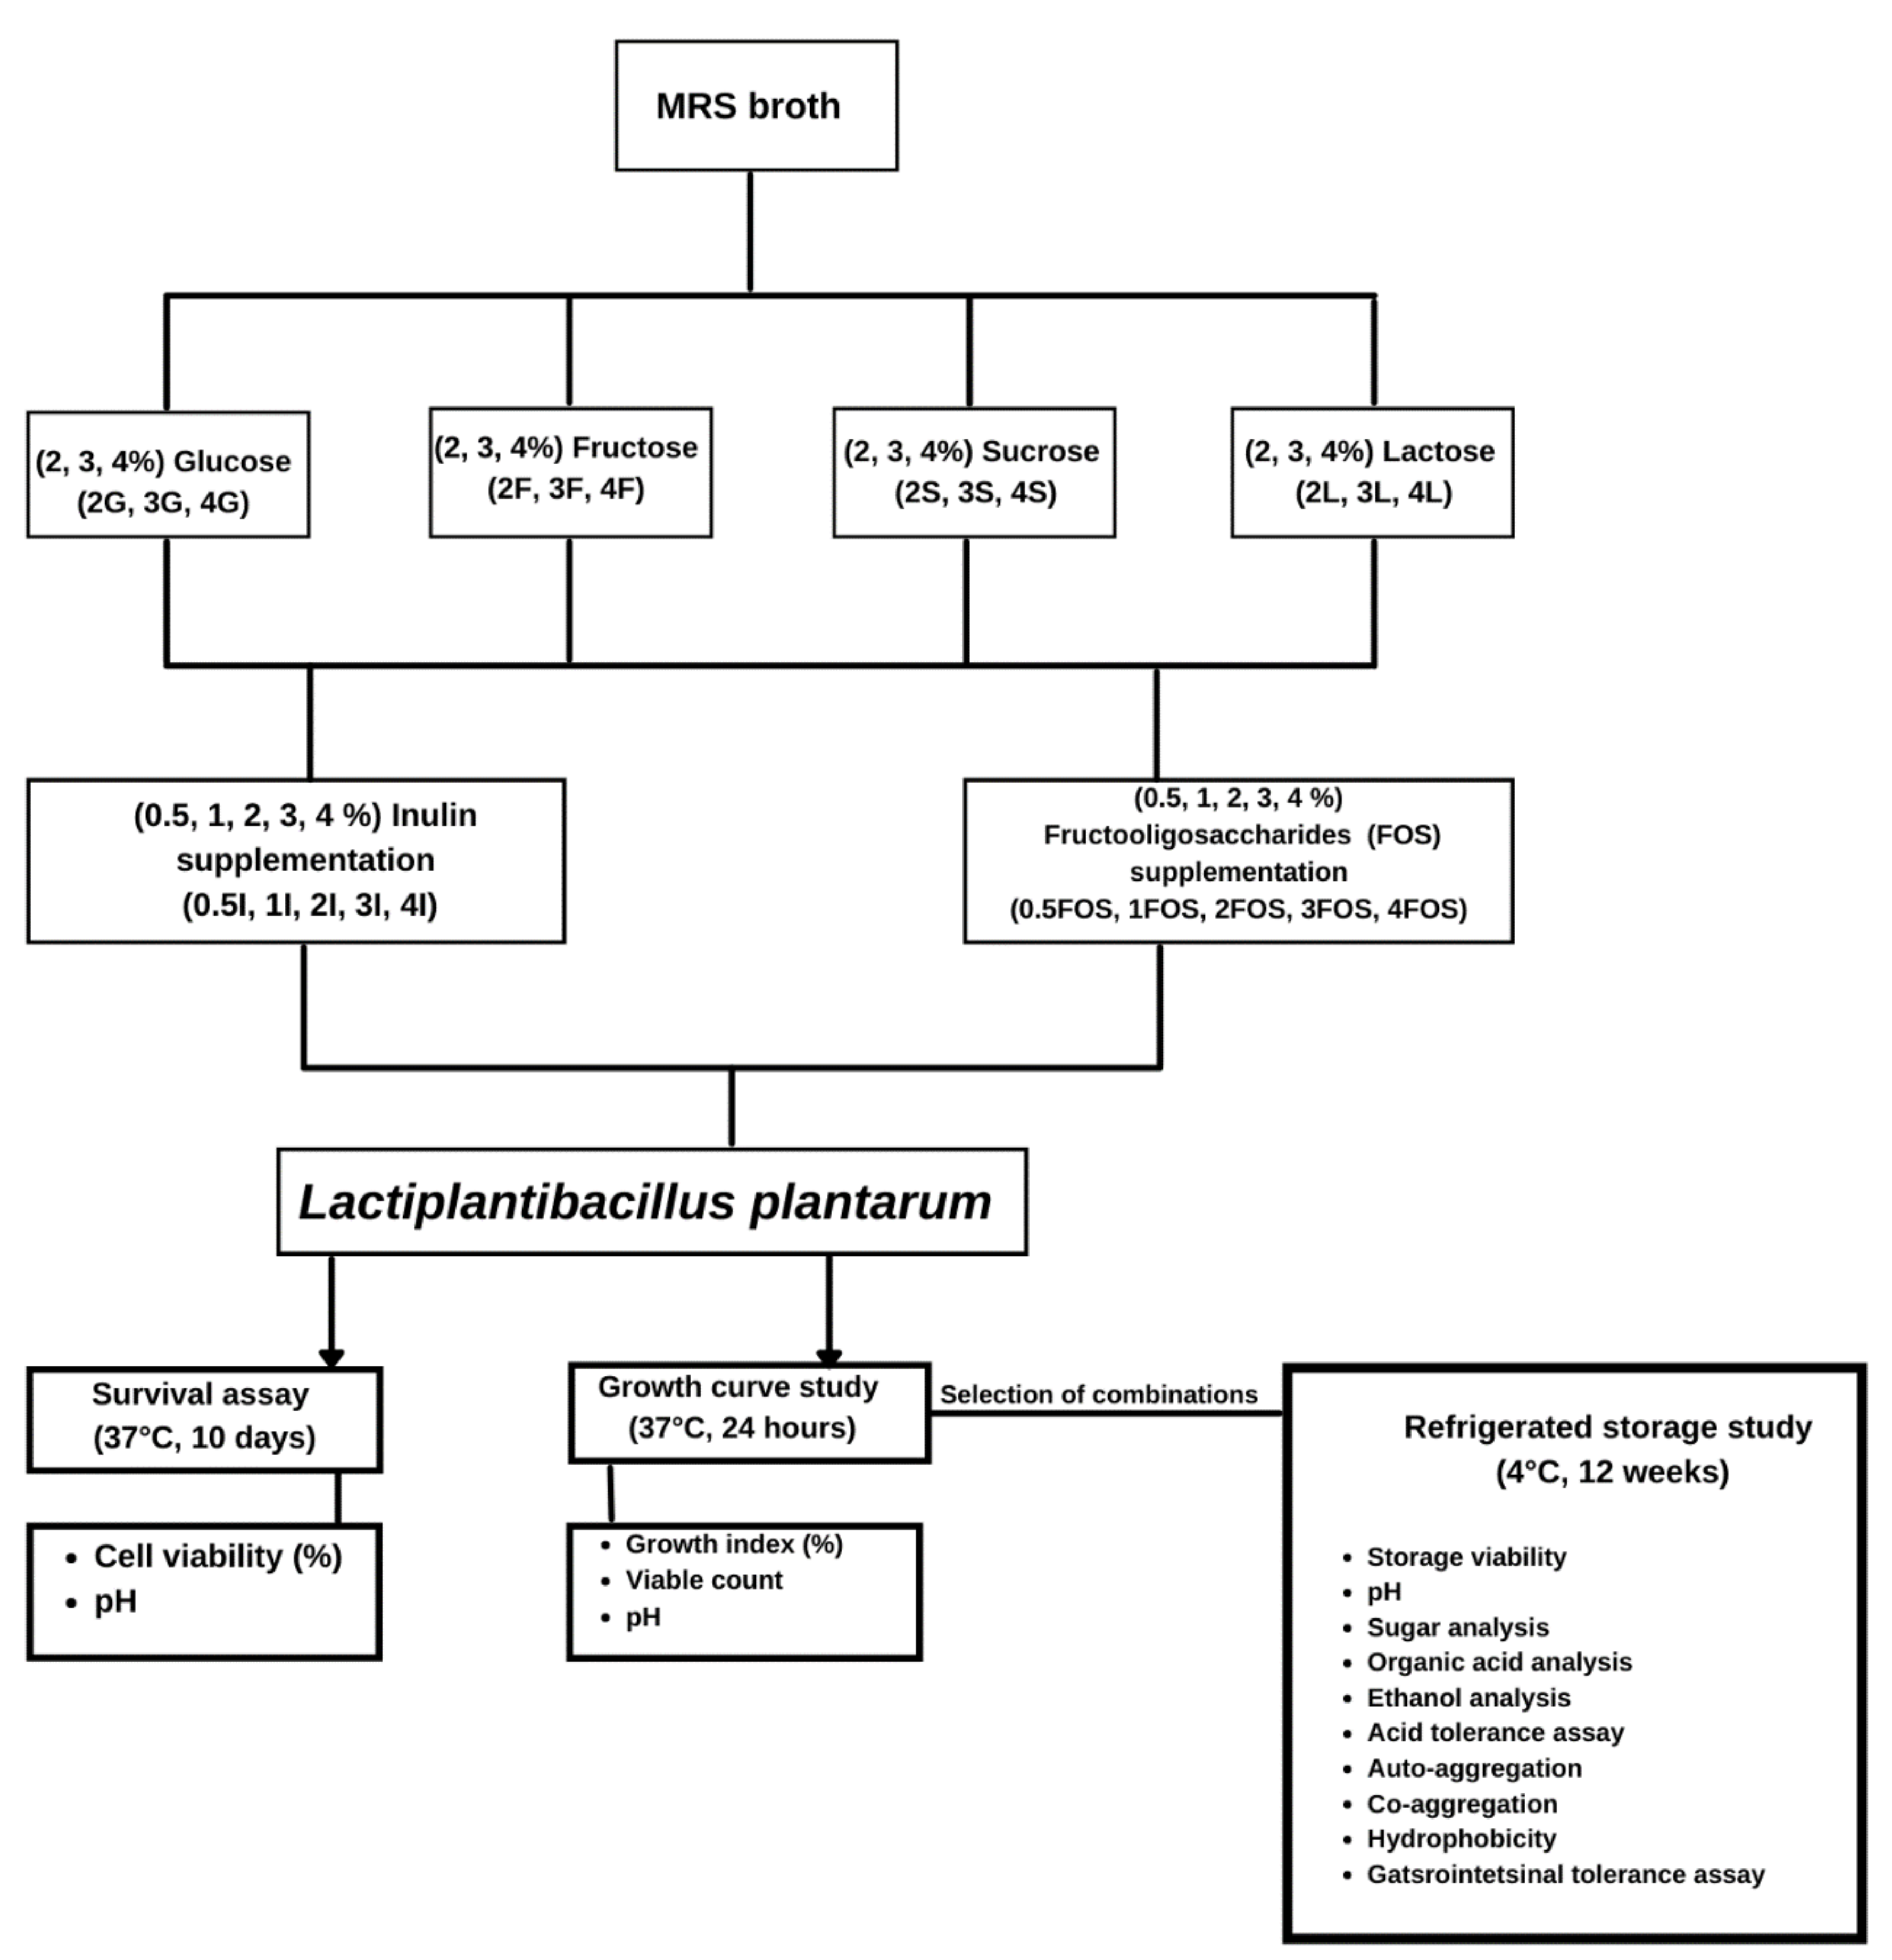
2.3. Preparation of MRS Broth for L. plantarum

MRS broth (1000 mL) with pH 6.5 ± 0.2 was prepared using peptone (10 g), yeast extract (5 g), Tween-80 (2 mL), NH4HCO3 (0.75 g), MgSO4 (0.1 g), MnSO4 (0.5 g), K2PO4 (2 g), prebiotics and sugar. Four different sugars (fructose, sucrose, glucose, and lactose) at different concentrations (1%, 2%, 3%, and 4%) with inulin and FOS supplementation at different concentrations (0.5%, 1%, 2%, 3%, and 4%) were used for growth and survival assays.
For refrigerated storage study, only MRS broth with four different combinations of sugar and prebiotic was studied: (1) 3S+4I: 3% sucrose (3S) with 4% inulin (4I), (2) 2L+3I: 2% lactose (2L) with 3% inulin (3I), (3) 3S+2FOS: 3% sucrose (3S) with 2% FOS (2FOS), and (4) 3L+4FOS: 3% lactose (3L) with 4% FOS (4FOS). Experimental set-up is shown is Figure 1.

2.4. Growth Curve Study

Each medium with OD600 (7 log CFU/mL) of inoculum was individually dispensed into a 96-well plate in an anaerobic chamber. The plate was then incubated and measured simultaneously inside a TECAN Spark®10M microplate reader (TECAN, Grödig, Austria) at 37 °C for 24 h (Figure 1). Microbial growth was monitored by measuring the absorbance at the OD600 at 60 min intervals using the TECAN automated microplate reader, with 15 s auto-shaking at 1440 rpm before each measurement. The change obtained at OD600 was then plotted against time, and the growth index was calculated using the equation below from the sum of all single OD readings and compared with the OD values obtained with the cultures grown in MRS-broth according to modification by Bevilacqua et al. [38]:
Growth   index   = OD MAX OD NC OD PC × 100 %
where ODMAX was the maximum absorbance attained, ODNC was the absorbance of negative control (MRS broth without any sugar and FOS), and ODPC was the absorbance of positive control (MRS broth with 4% glucose).
The OD values of samples with inulin or FOS supplementation were corrected with the OD measurement of MRS broth with inulin or FOS without any bacterial culture. The OD values of samples without inulin or FOS were corrected with the OD measurement of MRS broth without any bacterial culture.
Percentage of increase in growth index = (Growth index of a sugar with inulin/FOS supplementation–Growth index of the sugar without supplementation)/Growth index of the sugar without supplementation ×100.
Figure 1. Experimental set-up.
Fermentation 07 00259 g001

2.5. Survival Study

The survival assay was performed according to Bevilacqua et al. [39]; modified by Parhi et al. [35]. MRS broth (20 mL) was dispensed in Schott bottles and inoculated at 5% w/v with L. plantarum (Figure 1). The number of viable cells in culture per mL was determined by spread plating 0.1 mL of serially diluted cultures on MRS agar media and incubated at 37 °C for 48 h under anaerobic conditions. Viable cell count was expressed as log CFU/mL. The cell viability (%) and pH (pH-meter F-71, LAQUA, Irvine, CA, USA) at 25 °C were measured at 2-days intervals for 10 days.
Cell   viability   % = CFUmL Day T 1 CFUmL Day 0 1 × 100 %
where CFUmL−1Day−T was the viable cell count at the day of analysis and CFUmL−1Day−0 was the initial viable cell count.

2.6. Refrigerated Storage Study

2.6.1. Storage Viability and pH

Sugar solutions were filter-sterilized using 0.22 μm polyethersulfone membrane syringe filters and added aseptically to Schott bottles with sterilized MRS broth. After inoculating L. plantarum at a concentration of 5% w/v and 24 h fermentation at 37 °C under anaerobic conditions, cultures were stored for 12 weeks at 4 °C. Storage viability (log CFU/mL), pH, auto-aggregation, co-aggregation, hydrophobicity, sugar analysis, organic acid analysis, ethanol analysis, and gastrointestinal assay were analyzed every alternate week. The pH of a medium was measured using a pH-meter (F-71, LAQUA, Irvine, CA, USA) at 25 °C. Storage viability was expressed as log CFU/mL, and colonies were counted after allowing them to grow at 37 °C for 48 h under anaerobic conditions.

2.6.2. Sugar and Organic Acid Analysis

Sugars such as glucose, fructose, sucrose, lactose, and organic acids such as lactic acid and acetic acid were quantified using high-performance liquid chromatography (HPLC) (Agilent, Santa Clara, CA, USA). Samples were diluted with deionized water by a factor of two and filtered through 0.22 µm dual syringe filters (Thermo-line, Sydney, Australia) before they were injected. Ten µL samples were injected into a Hi-Plex Ca column (Agilent, Santa Clara, CA, USA; 300 × 7.7 mm) using Milli-Q water as mobile phase at a flow rate of 0.6 mL/min at 80 °C for sugar determination, and Hi-Plex H column (Agilent, Santa Clara, CA, USA; 300 × 7.7 mm) using 0.01 M H2SO4 as mobile phase at a flow rate of 0.6 mL/min at 75 °C for organic acid. Sugars and organic acids were detected using a refractive index detector (RID). The concentration of each sugar in the medium was determined from their respective calibration curves based on their peak areas obtained from their standard solutions.

2.6.3. Ethanol Analysis

Ethanol was quantified using a gas chromatography (GC) system (Clarus 500, PerkinElmer, Shelton, CT, USA). Samples were filtered through 0.22 µm dual syringe filters (Thermo-line, Sydney, Australia) before injecting the samples. 0.5 µL samples were injected into a WAX ETR column (PerkinElmer, Waltham, MA, USA; 30 m, 0.32 mmID, 0.25 µm df) at 250 °C for 3 min.

2.6.4. Acid Tolerance Assay

The isolates were incubated overnight in MRS broth at 37 °C. Actively grown cells were harvested by centrifugation (10,000× g, 4 °C, 10 min). The pH of MRS broth was adjusted at pH 1.0, 1.5, and 2.0 with 1N HCl [10]. MRS broth adjusted to pH 6.5 was used as a control. Harvested cells were resuspended in MRS broth with acidic pH and incubated at 37 °C. After a time interval of 0, 1, 2, and 3 h, samples were withdrawn and serially diluted in phosphate buffer saline (PBS). Samples were plated on MRS agar plates and incubated at 37 °C for 48 h. Cell viability was assessed by the spot plate count method, and the results were expressed as log CFU/mL.

2.6.5. Cell Auto-Aggregation and Co-Aggregation

Cell auto-aggregation and co-aggregation were performed according to Kos et al. [40]. Harvested cells were washed, resuspended in PBS, and adjusted to an absorbance of 0.5 at 600 nm every alternate week. The suspension was incubated at 37 °C for 2 h. One mL of the upper phase was removed carefully to measure the absorbance at 600 nm. Cell auto-aggregation was measured by a decrease in absorbance and measured by using the following equation:
A % = 1 A t A 0 × 100
where A% represents the percentage of auto-aggregation, A0 represents the initial value (0 h), and At represents the final value (2 h).
Equal volumes (2 mL) of L. plantarum and pathogen (E. coli and E. faecalis) suspensions for the co-aggregation assay were divided into glass test tubes and mixed by vortexing. Control tubes containing 2 mL of suspension of each bacterial species. Absorbance was measured after 5 h. The percentage of co-aggregation was determined according to Kos et al. [40]:
Co aggregation   % = A x + A y 2 A x + y A x + A y 2 × 100
where A represents absorbance, x and y represent each of the two strains in the control tubes, and (x + y) represents their mixture.

2.6.6. Hydrophobicity of Bacteria

Hydrophobicity was determined following the method of Kimoto-Nira et al. [41] with some modifications. First, five mL aliquots of cultures were collected every alternate week in storage assay, centrifuged at 10,000× g for 10 min at 4 °C, and suspended in PBS to obtain an OD620 of 1.0. Next, one mL of xylene was added to 1.0 mL of cell suspensions (Figure 1). The solution was incubated at 30 °C for 10 min, mixed for 60 s, and then left to stand for 15 min. The aqueous phase was removed, and OD620 was determined. The percentage of hydrophobicity was calculated using the following equation:
H % = 1 H t H 0 × 100
where H% represents the percentage of hydrophobicity, Ho represents the initial value (0 min), and Ht represents the final value (15 min).

2.6.7. Gastrointestinal Tolerance Assay

The tolerance of probiotics during storage of in vitro digestion was determined by a modified method of Valero-Cases, Frutos [42]. The ringer solution (1000 mL) containing NaCl (6.2 g), KCl (2.2 g), CaCl2 (0.22 g), and NaHCO3 (1.2 g) was used as an electrolyte solution to prepare simulated saliva, gastric juice, and intestinal fluid. One mL of cultures were collected over two weeks intervals and then centrifuged 10,000× g for 10 min, at 4 °C. The cells were washed thrice using PBS buffer. The cell pellet was resuspended in 1 mL of PBS pH 7.0 ± 0.2. Step 1: 1 mL of simulated saliva (100 mg/mL lysozyme in ringer solution) with pH 6.5 ± 0.2 was added to resuspended cells and incubated for 2 h at 37 °C in a water bath. Step 2: 100 µL aliquots were removed from samples for serial dilution and spot plated on MRS agar. CFU was calculated after incubation at 37 °C for more than 48 h. Step 3: 1 mL of simulated gastric juice (3 mg/mL pepsin in 0.85% NaCl) with pH 2.5 ± 0.2 was added to the same mixture and incubated for 4 h at 37 °C in a water bath. Step 4: 100 µL aliquots were removed from samples for serial dilution and spot plated on MRS agar. The viable count was calculated after incubation at 37 °C for more than 48 h. Step 5: 1 mL of simulated intestinal fluid (0.3% bile salt + 1 mg/mL pancreatin in 0.85% NaCl solution) with pH 8.0 ± 0.2 was added to same mixture and incubated for 6 h at 37 °C in water bath. Step 4: 100 µL aliquots were removed from samples for serial dilution and spot plated on MRS agar. The viable count was calculated after incubation at 37 °C for more than 48 h (Figure 1). The percentage of survival was calculated using the following formula:
Bacterial   Survival   Rate   % = Log 10 CFU   after   gastrointestinal   assay Log 10 CFU   before   gastrointestinal   assay × 100

2.7. Statistical Analysis

Experiments were performed in three independent replicates, and results were expressed as means and standard deviations. These results were statistically analyzed using t-test (week 0 and 12), one-way analysis of variance (ANOVA), and Tukey’s test for post-hoc analysis. Statistical significance was determined at p < 0.05 using SPSS (Statistical Package for the Social Sciences) version 23 from IBM Corporation (New York, NY, USA)

3. Results and Discussion

3.1. Growth Study

The growth index described by Bevilacqua et al. [38] was used where growth index > 75% stands for growth kinetics similar to those under optimal conditions; growth index in the range of 25–75% underlines a partial inhibition; growth index < 25% stands for potent inhibition of the microorganism [38]. The significant increase in viable count (log CFU/mL) of L. plantarum (Supplementary Tables S1 and S2) correlates with the growth index of L. plantarum (Table 1 and Table 2). The growth index of L. plantarum increased with increasing inulin and FOS concentration from 0.5% to 3% as a sole carbon source in MRS broth, suggesting a dose-dependent effect of inulin and FOS on the growth, but a further increase in concentration (4%) showed partial inhibition (Table 1 and Table 2). A positive growth effect of 1% inulin of L. plantarum ST16 Pa has been reported by da Silva Sabo et al. [43]. A similar dose-dependent effect of inulin and FOS was reported by Parhi et al. [35] on the growth of L. casei. Moreover, Munoz et al. [44] reported that CFU increased with increasing FOS (1%, 2%) concentration for L. casei LE8, but CFU decreased with increasing FOS (5%) concentration for L. plantarum LE27. The chain lengths of inulin and FOS affect the fermentability of L. plantarum. The short chains of FOS (DP < 10) were rapidly fermented, and long chains of inulin (DP > 20) were steadily fermented [1], resulting in a positive effect on the growth of L. plantarum. However, the growth index of L. plantarum was observed to be below 75% in MRS broth, with 0.5%, 1%, and 4% inulin as the sole carbon source (Table 1). This might be due to the accumulation of partially hydrolyzed inulin and fructose moieties on the outer cell wall, limiting mass transfer in the system.
In comparison to a positive control (growth index = 100%), inulin as the sole carbon source could not support the growth of L. plantarum well. The percentage increase in growth index was determined by comparing the growth index of the inulin or FOS supplemented sugar system with the growth index of the non-supplemented respective sugar system. The growth media, MRS broth containing 2%, 3%, 4% glucose, and fructose, showed growth index >75% while 2%, 3%, and 4% sucrose, and lactose showed growth index < 75%, this suggests that L. plantarum prefers glucose and fructose than sucrose and lactose (Table 1 and Table 2). The percentage increase in growth index, which ranged from 5.0–65.4% and 5.5–73.7% with inulin and FOS supplementation, respectively, in all sugar systems, shows the positive effect of inulin and FOS supplementation on L. plantarum. The increase in growth index is most likely due to the release of fructose as a result of partial hydrolysis of inulin and FOS by an extracellular enzyme β-fructofuranosidase produced by L. plantarum [30]. Partial hydrolysis of inulin releases shorter sucrose and fructose, which were subsequently metabolized as an additional carbon and energy source [45]. Perrin et al. [46] reported that the standard for prebiotic action is that probiotics possess cell-associated glycosidases that hydrolyze prebiotics such as oligosaccharides to form monomers of fructose. The highest percentage increase in growth index for inulin supplementation was 65.4% in 2% lactose with 3% inulin, followed by 49.3% in 3% sucrose with 4% inulin. As for FOS, the highest percentage increase in growth index was 73.7% in 3% lactose with 4% FOS followed by 46.5% in 3% sucrose with 2% FOS (Table 1 and Table 2). This indicates that for positive effect in growth index of L. plantarum, sucrose and lactose were more suitable sugar substrates for inulin and FOS supplementation. Since FOS showed the highest percentage increase in growth index, it was the better prebiotic supplementation in sucrose and lactose systems. Growth-promoting effects of inulin and FOS on L. plantarum have been reported in the presence of lactose-rich food matrices such as fermented milk [7], yogurts [8], whey [47], and cheese [48]. The positive effect was also exhibited in glucose and fructose systems but at a lower percentage of increase. In the glucose system, the highest percentage growth index increase of 8.3% and 8.5% was observed in 2% glucose with 2% inulin and 2% FOS supplementation, respectively (Table 1 and Table 2). This indicates that the positive effect of inulin was similar to FOS in the glucose system. The highest percentage growth index increases 18.0% and 11.4% in the 2% and 3% fructose system was with 2% inulin and 0.5% FOS supplementation, respectively (Table 1 and Table 2). This indicates that inulin was a better prebiotic than FOS in the fructose system. L. plantarum preferred growth on glucose compared to fructose, sucrose, and lactose without any inulin and FOS supplementation, but with inulin and FOS supplementation, a significant number of positive effects on growth index were observed in fructose and lactose systems. The results on the growth index of L. plantarum using fructose as the carbon source is consistent with the studies of Corcoran et al. [49], Hedberg et al. [50], and Kneifel [51], in which Lactobacillus spp. utilized fructose efficiently but less than glucose. Several researchers reported that glucose is transported by the phosphotransferase system (PTS), which regulates uptake and metabolism of other carbon sources [52,53,54]. In contrast, fructose metabolism requires the induction of specific enzymes before sugars enter the Embden-Meyerhof pathway (EMP); hence, a slower fructose utilization than glucose was exhibited in the substrate uptake without affecting inulin and FOS metabolism. The results in Table 1 and Table 2 also suggest that to achieve the positive effect of inulin or FOS supplementation in the growth index of L. plantarum, a higher concentration of sugar (>4%) is not desirable. Several in vitro studies have reported the positive effect of inulin and FOS on Lactobacillus and Bifidobacterium strains [6,55,56]. This study demonstrates that the concentration and type of sugar and prebiotic are essential factors for stimulating or suppressing the growth of L. plantarum.

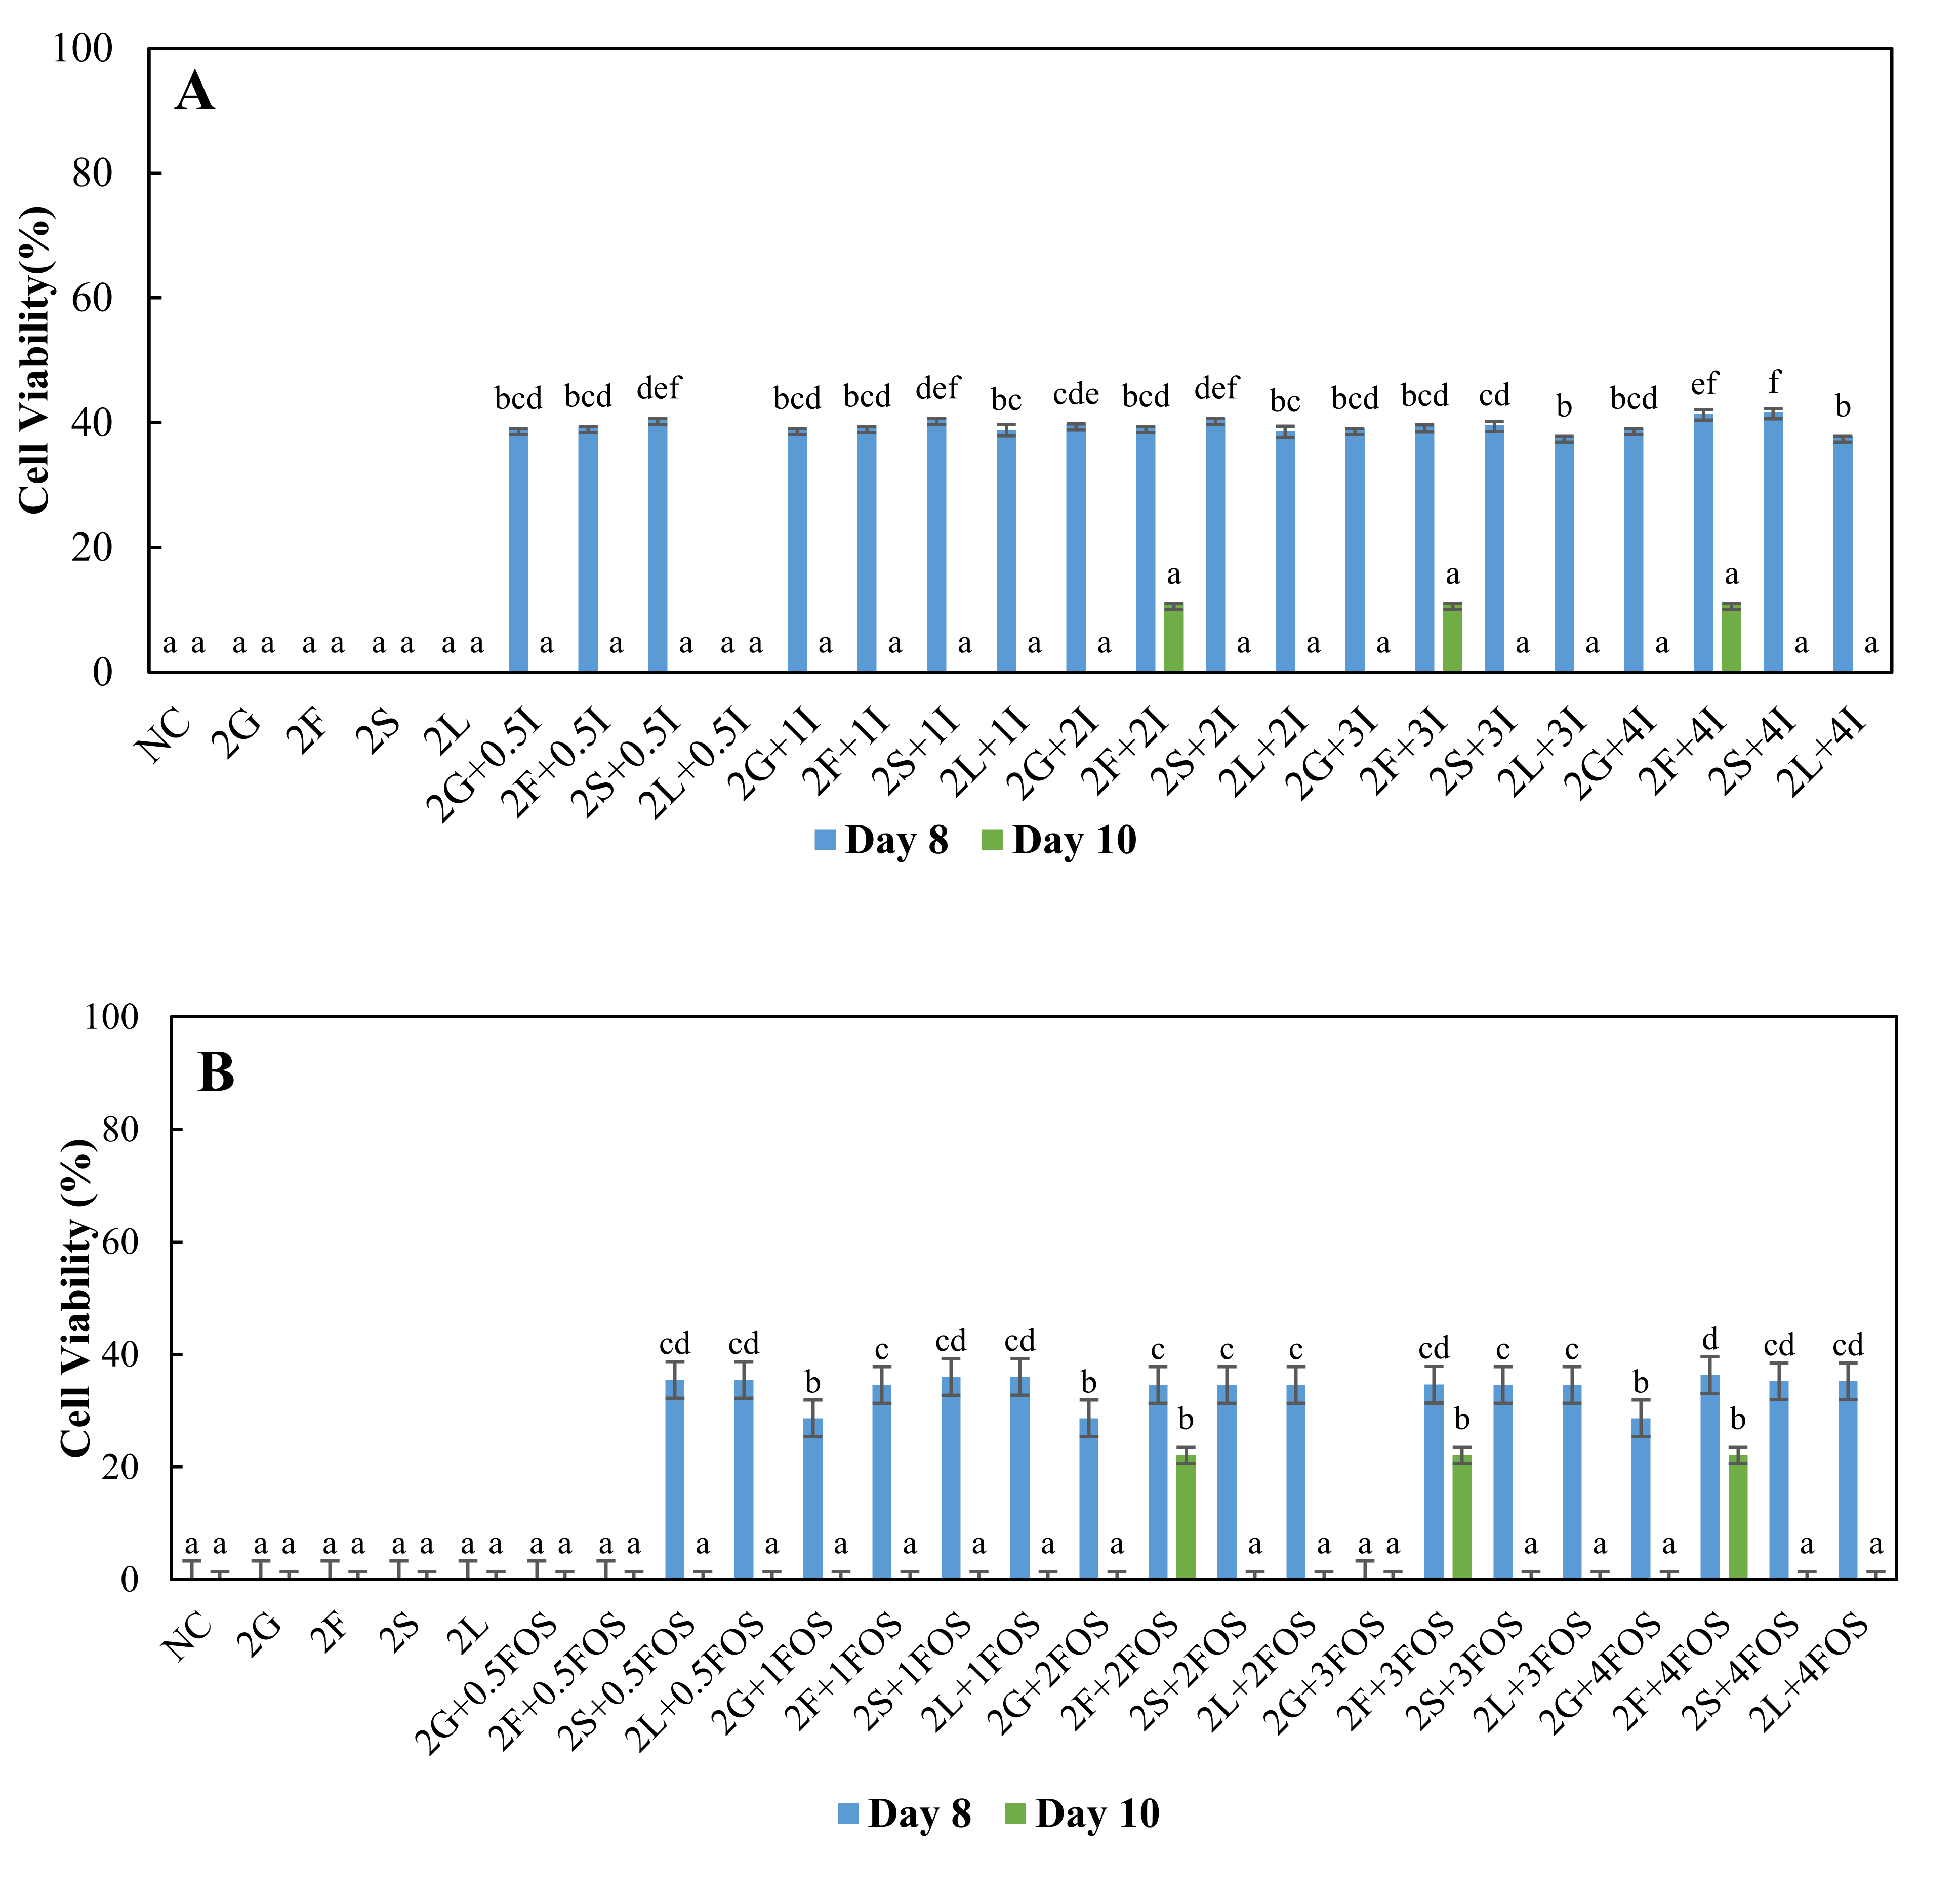
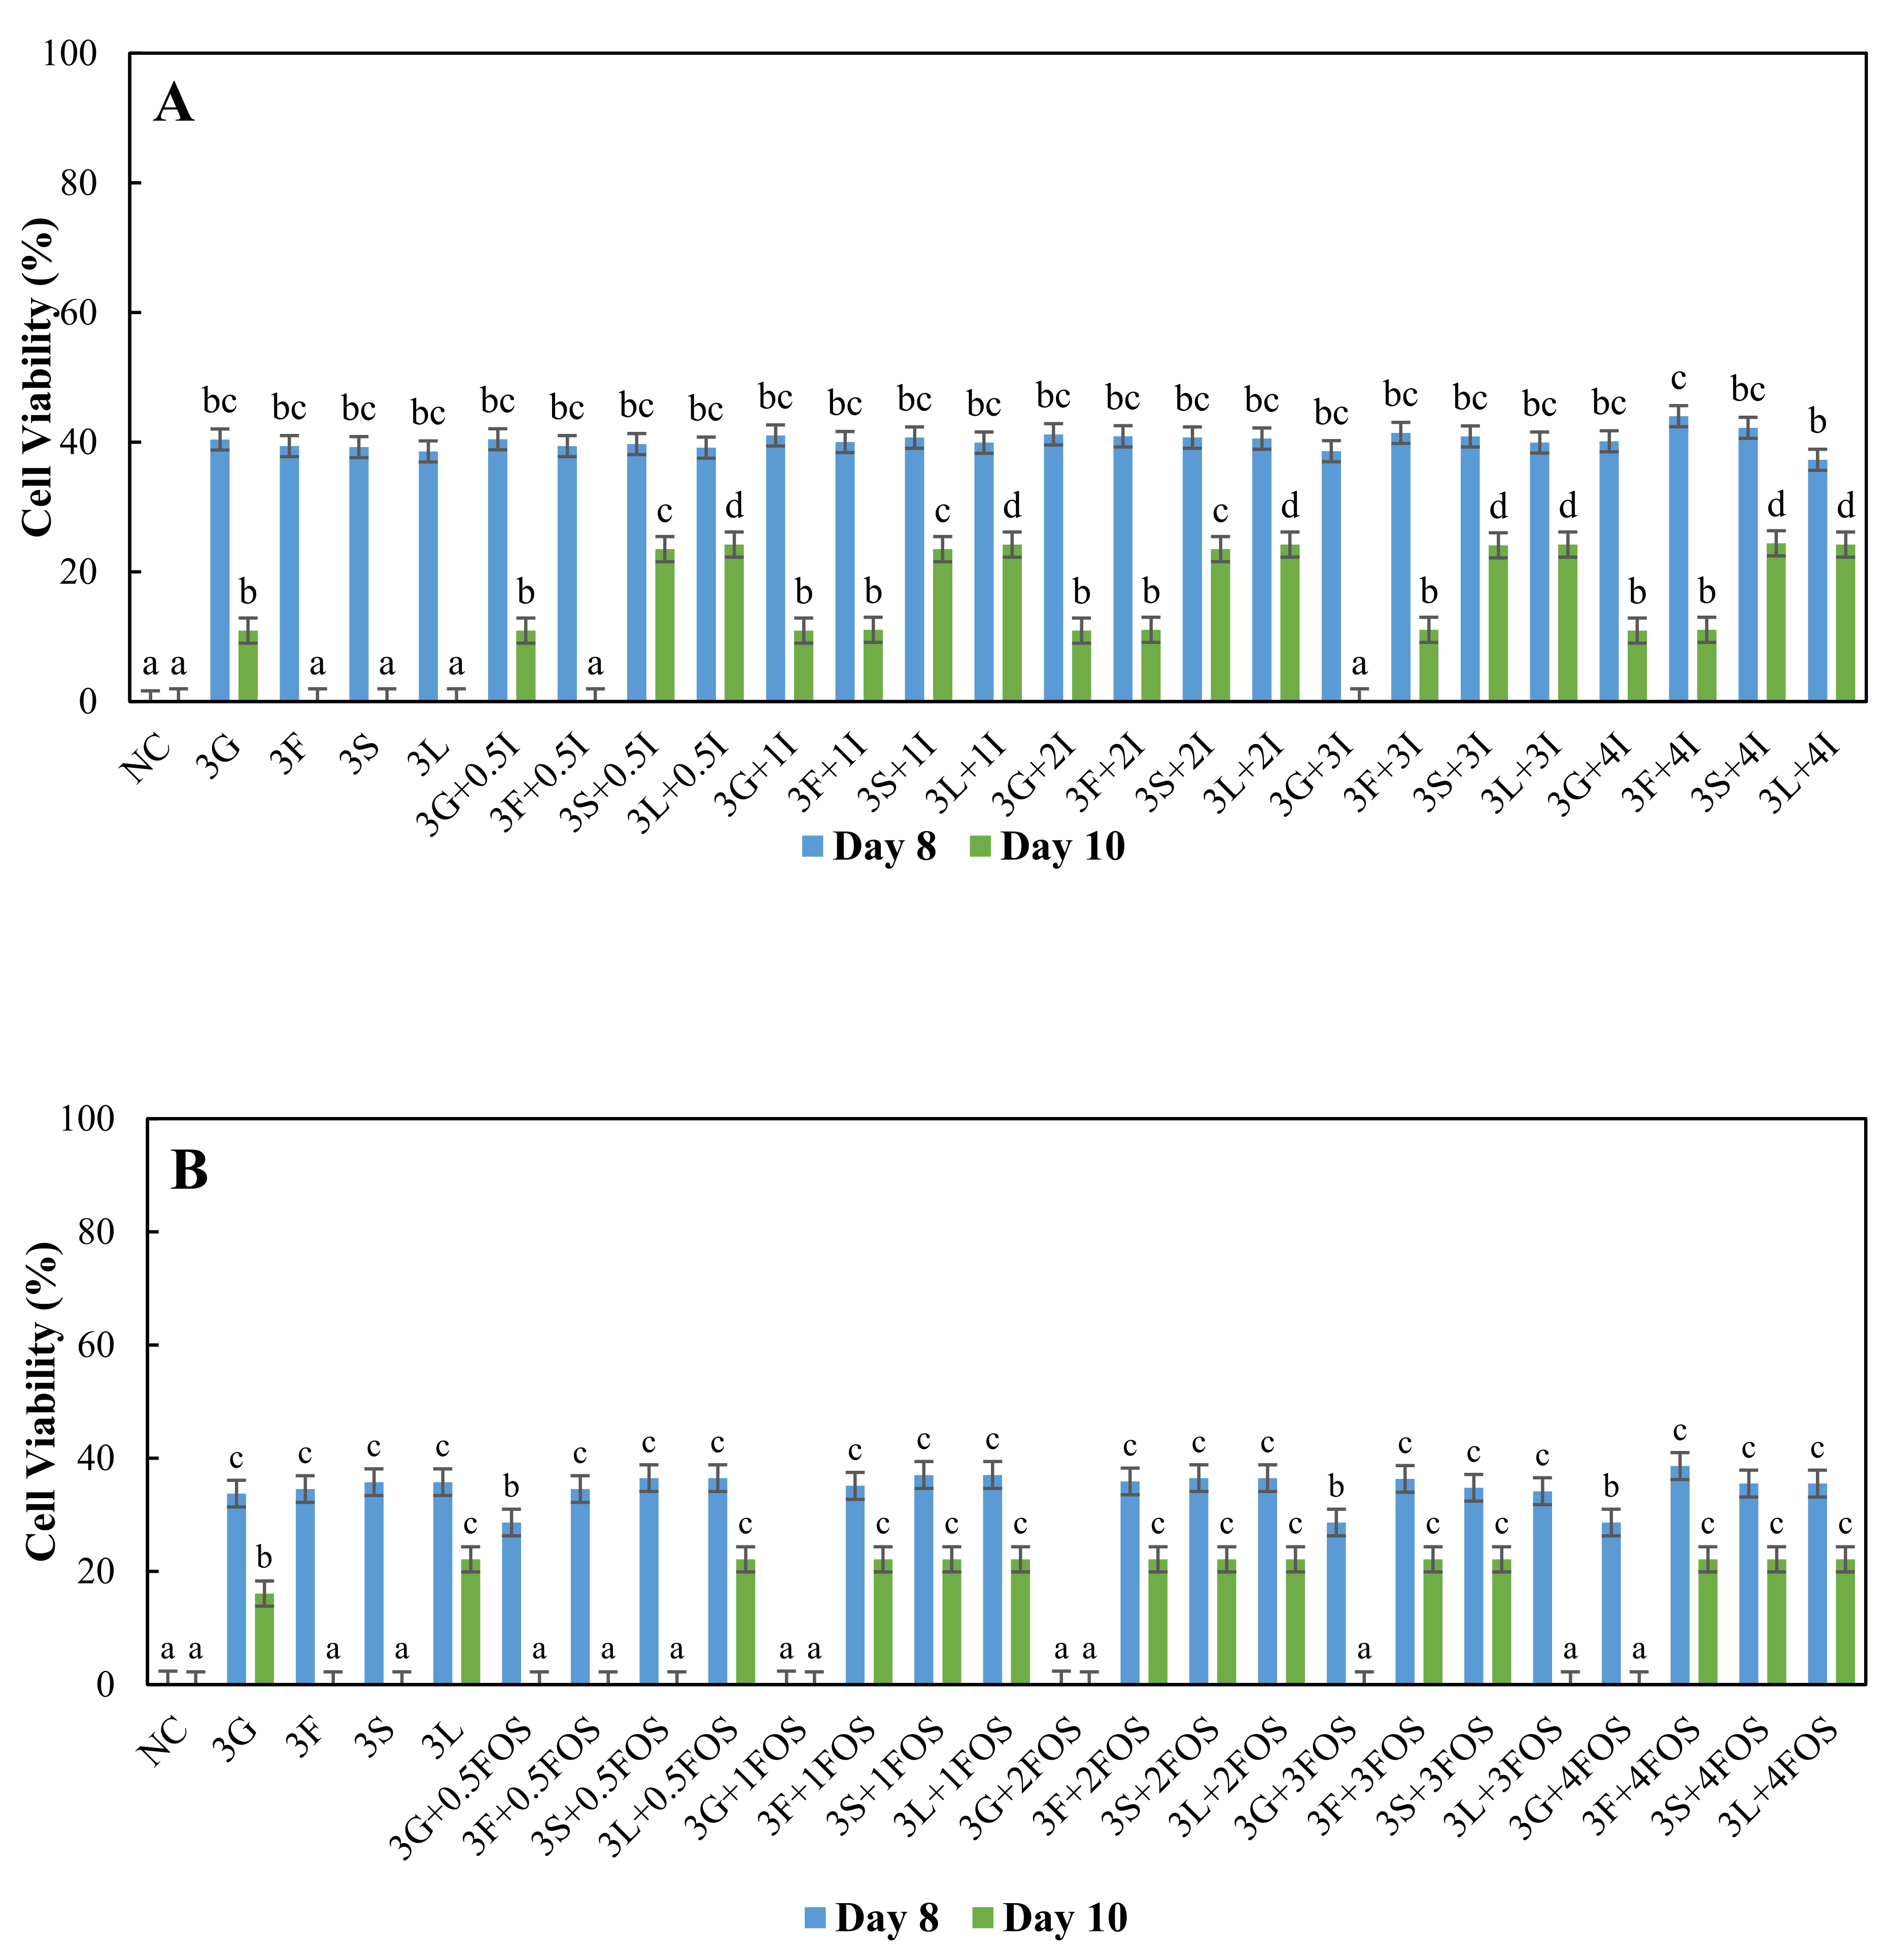
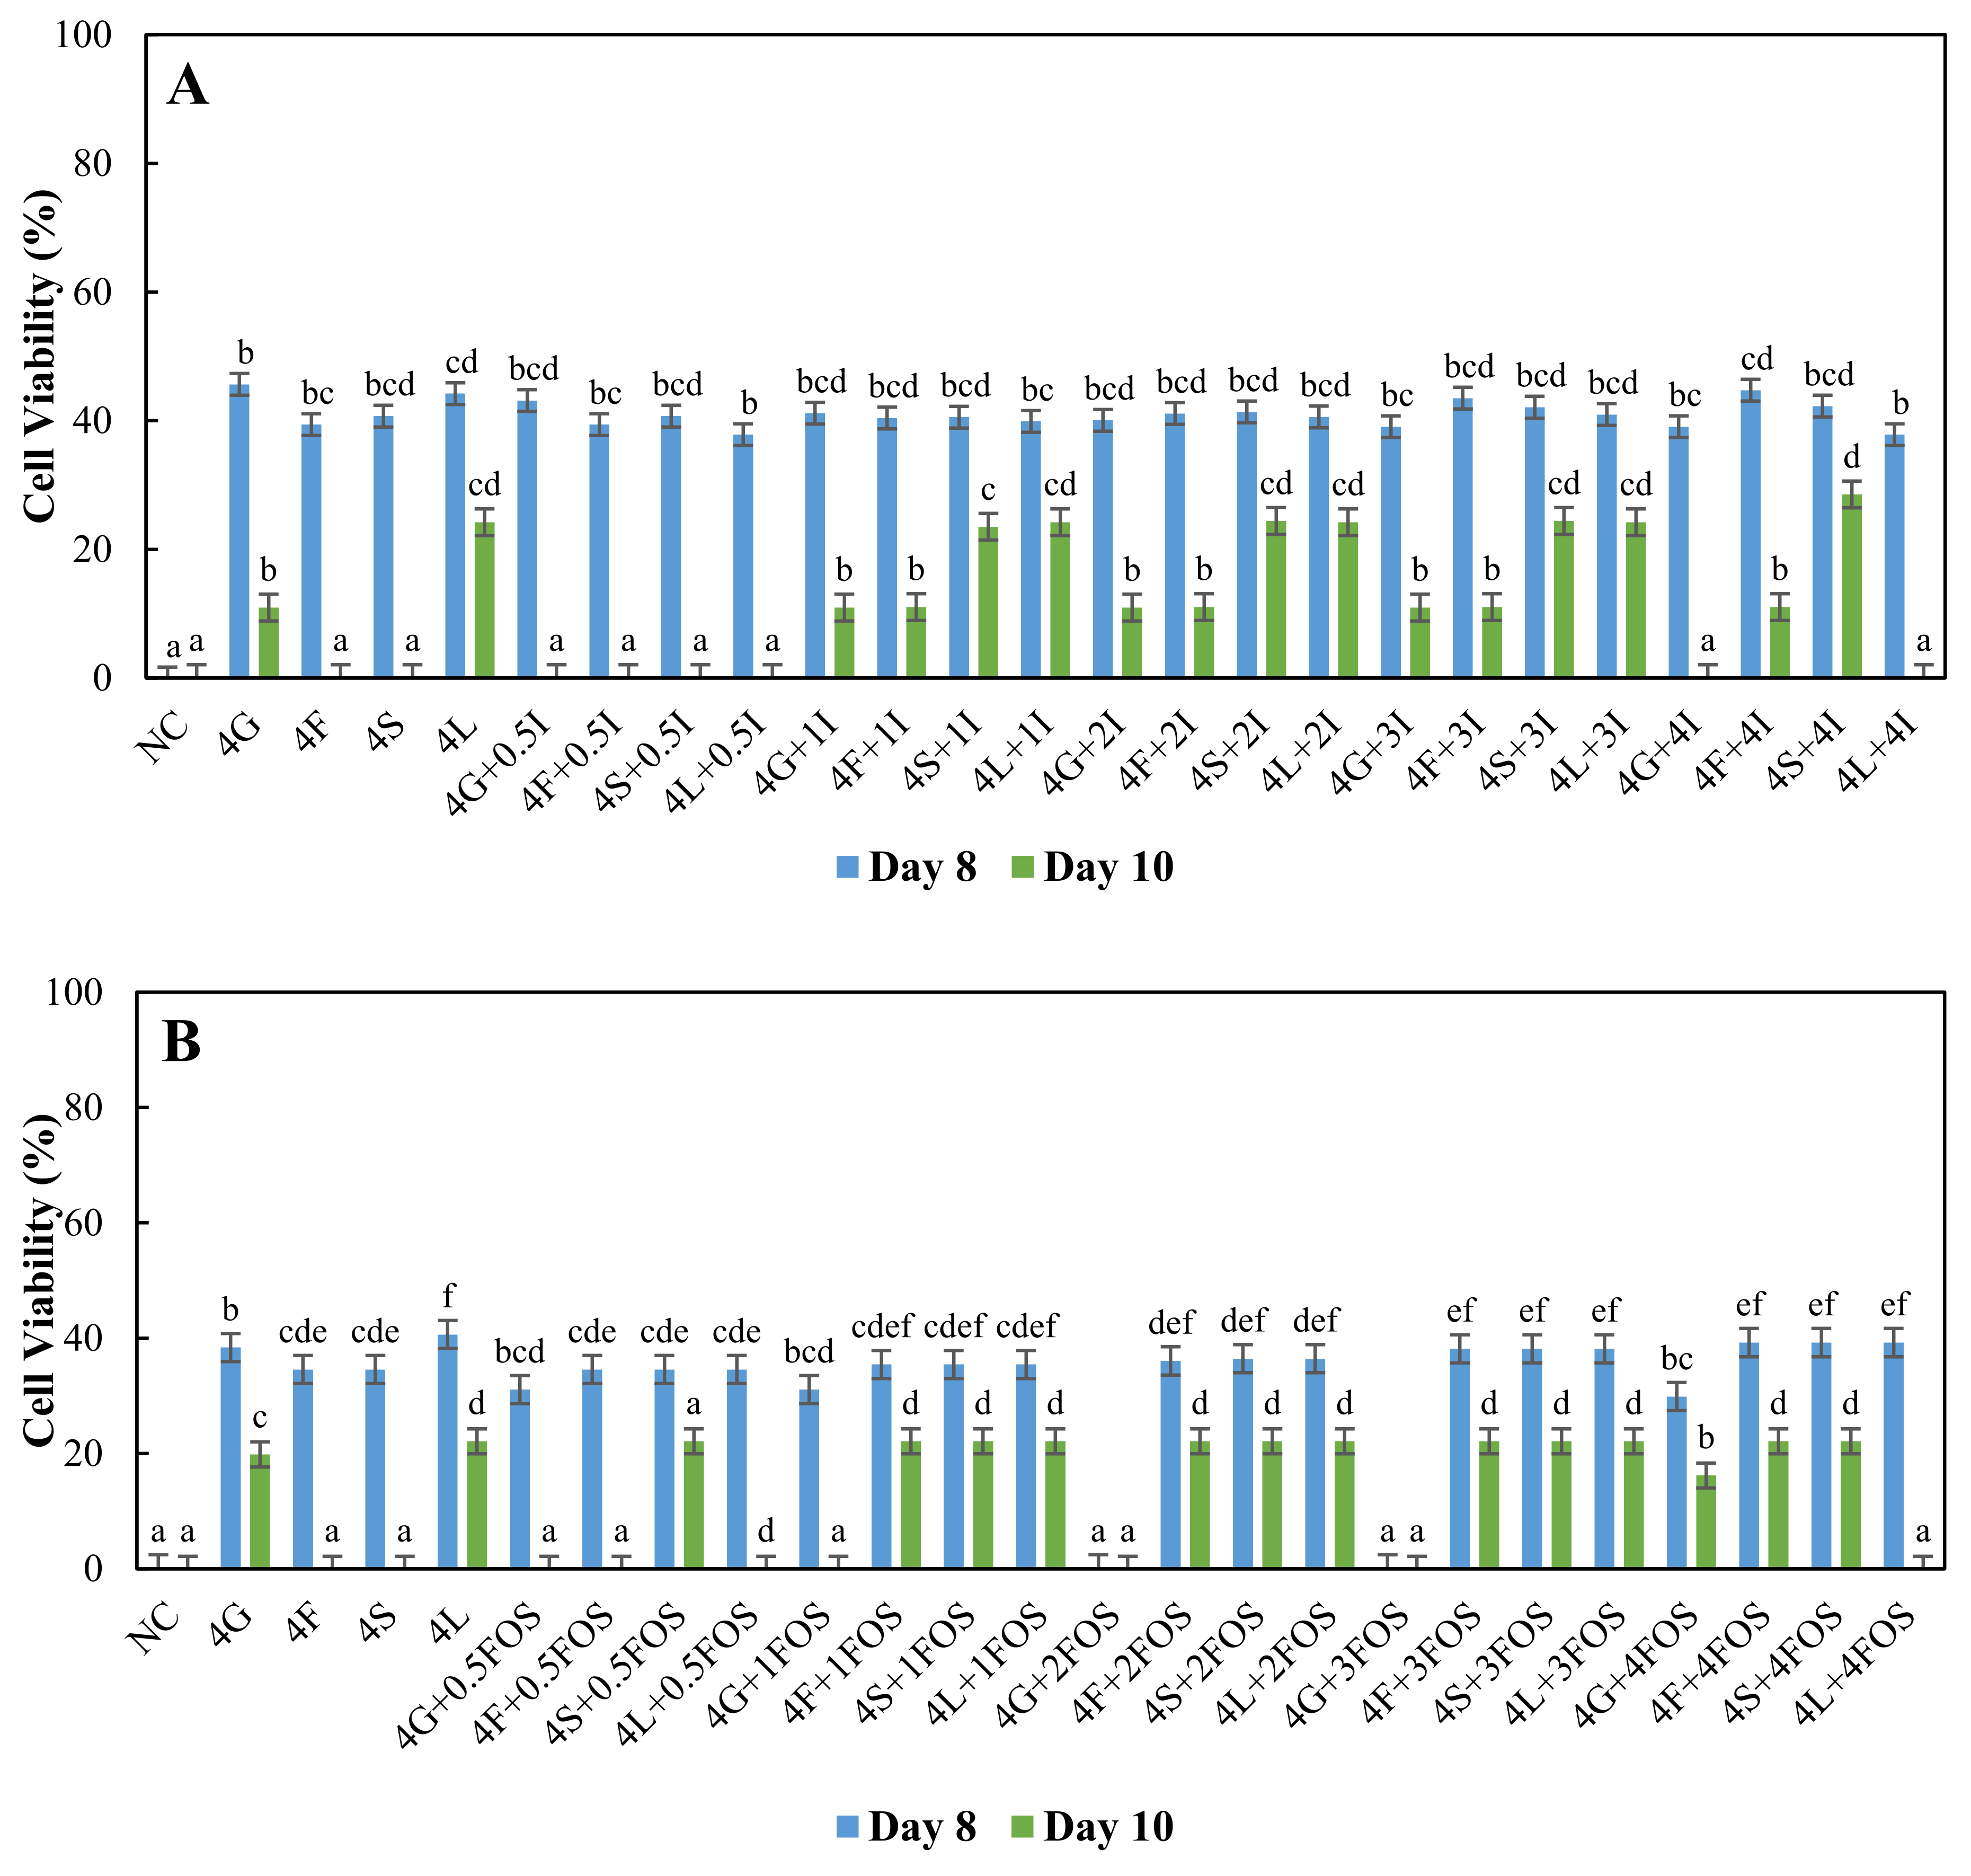
3.2. Comparison of the Survival of L. plantarum in Different Model Sugar Systems with Inulin and FOS Supplementation on Day-8 and Day-10

The cell survivability of L. plantarum increased until day two of incubation and then decreased exponentially, indicating that L. plantarum was experiencing a death phase. Figure 1, Figure 2 and Figure 3 show the comparison of the survival of L. plantarum in different model sugar systems with inulin and FOS supplementation on day eight and day ten. On day eight and day ten, L. plantarum did not survive in non-supplemented 2% sugar systems media (Figure 2), suggesting a protective effect of inulin and FOS supplementation. On day eight, with inulin supplementation, 40–50% cell viability was observed with 2% sugar systems, with few exceptions (Figure 2A). On the other hand, 35–40% cell viability was observed with 2% fructose with 1–4% FOS supplementation, 2% sucrose, and 2% lactose with 0.5–4% FOS supplementation on day eight (Figure 2B). Thus, inulin supplementation was better than FOS on day eight in the 2% sugar system based on cell viability results. Interestingly, the cell viability of L. plantarum was 11.1% and 22.1% in 2% fructose with 1–4% inulin supplementation (Figure 2A) and 2–4% FOS supplementation (Figure 2B), suggesting FOS was better in sustaining cell viability than inulin in 2% fructose system on day ten. The accumulation of organic acids and other secondary metabolites and the depletion of carbohydrates in the media may increase stress, thereby hindering the survival of L. plantarum. The >20% cell viability of L. plantarum on day 10 in inulin and FOS supplemented media suggest a protective effect. Livingston, Henson [57] earlier reported a similar protective effect of inulin and FOS against stresses, which may be due to plausible interaction of inulin or FOS and phospholipids of membrane resulting in higher membrane stability [58].
Figure 2. Cell viability (%) of L. plantarum grown in MRS broth containing 2% glucose (2G), fructose (2F), sucrose (2S) and lactose (2L) with (A) 0.5% (0.5I), 1% (1I), 2% (2I), 3% (3I) and 4% (4I) inulin, (B) 0.5% (0.5FOS), 1% (1FOS), 2% (2FOS), 3% (3FOS) and 4% (4FOS) fructooligosaccharide supplementation on the eighth day and 10th day. a–f A difference in lower case letters indicates significant differences between different treatments within a same day at p < 0.05. NC = negative control (no sugar and prebiotic).
Fermentation 07 00259 g002
For higher concentrations of sugars at 3% and 4%, L. plantarum showed 35–40% cell viability on day eight with inulin supplementation (Figure 3A and Figure 4A). As for FOS supplementation, 25–40% cell viability was observed on day eight (Figure 3B and Figure 4B). Supplementation of inulin resulted in higher cell viability of L. plantarum than FOS supplementation on day eight in 3% and 4% sugar systems. On day 10, cell viability was significantly higher (23–28%) with 3%, 4% sucrose, and lactose supplemented with 0.5%, 1%, 2%, 4% inulin compared to other systems (Figure 3A and Figure 4A). As for FOS supplementation, 16–22% cell viability of L. plantarum was observed with 3% and 4% fructose, sucrose, and lactose (Figure 3B and Figure 4B), with a few exceptions. Overall, inulin supplementation showed a 4–5% higher percentage increase in cell viability of L. plantarum than FOS supplementation in 3%, 4% sucrose, and lactose systems. In fermented foods, L. plantarum is often used as a starter culture since it utilizes lactose with high conversion rates and other nutrients such as protein present in whey [47]. This study shows a similar result whereby 25% cell viability of L. plantarum was observed in higher concentrations of 4% lactose (Figure 4). Slow transport of lactose [59] and slower utilization of lactose [60] in Lactobacillus might be advantageous, whereby lactose was available for a more extended period in comparison to other sugars resulting in viable cells until day ten. Sucrose is a disaccharide made up of fructose and glucose, previously reported as unable to be utilized efficiently or even metabolized by L. rhamnosus [49,61,62]. But here in L. plantarum, slower uptake and slower assimilation may have increased carbon source availability in the media similar to lactose and improved cell viability in inulin and FOS supplemented media. As sucrose was metabolized into glucose, a primary carbon source, and fructose, an inducer for β-fructofuranosidase, may have contributed to partial utilization of inulin and FOS, but this requires further investigation.

3.3. Effect of Inulin and FOS Supplementation on Storage Viability (log CFU/mL) and pH during 12 Weeks of Storage at 4 °C

Most commercial probiotic food products are often sold under refrigeration for limited shelf life. Therefore, it is essential to understand the effect of inulin or FOS supplementation on the viability of L. plantarum stored under refrigeration. Four selected combinations with more than 40% growth index increase were investigated in a 12-week storage study at 4 °C. All analyses in week 0 were made after 24 h growth of L. plantarum in MRS broth. L. plantarum grew well in MRS broth at week 0, but storage viability (log CFU/mL) and pH depended on the concentration of sugar and prebiotics (Table 3). In week 0, the storage viability of L. plantarum was significantly higher in MRS broth with inulin and FOS supplementation (10.21 ± 0.02–10.40 ± 0.12 log CFU/mL) than those of non-supplemented media (9.07 ± 0.01–9.29 ± 0.06 log CFU/mL) at 37 °C (Table 3). However, the storage viability of L. plantarum declined week until week four in all combinations of media. Due to the low initial pH values, MRS broth was subjected to mild lactic acidification. Exhaustion of essential growth factors or their limited availability and acidification of this complex broth are postulated as possible reasons for the decline of storage viability at week two and week four. These seem similar to the decrease in viable cell count of L. plantarum stored for week four at 4 °C in pineapple, tomato, carrot, and cherry juices [63].
Table 3. Storage viability and pH of L. plantarum grown in MRS broth media during 12-week storage assay at 4 °C.
Storage Viability (log CFU/mL)pH
Week 12
Week 0Week 12Week 0Week 12
NCAa 7.6 ± 0.1Aa 0.0 ± 0.0BCDa 6.5 ± 0.1Db 7.1 ± 0.1
3SCa 9.3 ± 0.1BCb 5.6 ± 0.0CDa 6.7 ± 0.1Cb 6.7 ± 0.1
2LCa 9.2 ± 0.1Bb 4.6 ± 0.0CDa 6.6 ± 0.1Db 7.2 ± 0.1
3LCa 9.1 ± 0.5Bb 4.8 ± 0.0Ea 6.8 ± 0.1Db 7.2 ± 0.1
3IBa 8.2 ± 0.3Db 6.9 ± 0.0BCa 6.2 ± 0.2BCb 6.9 ± 0.1
4IBa 8.7 ± 0.2Cb 6.7 ± 0.1Ba 5.9 ± 0.2ABb 6.4 ± 0.2
2FOSBa 8.7 ± 0.2Cb 6.7 ± 0.1ABa 5.9 ± 0.1BCb 6.6 ± 0.2
4FOSBa 8.3 ± 0.1Db 7.1 ± 0.0Aa 5.5 ± 0.2ABb 6.4 ± 0.0
3S+4IDa 10.4 ± 0.1Eb 8.1 ± 0.0Aa 5.6 ± 0.3Ab 5.9 ± 0.4
2L+3IDa 10.4 ± 0.1Eb 8.1 ± 0.0ABa 5.6 ± 0.1ABb 6.4 ± 0.0
3S+2FOSDa 10.2 ± 0.0Eb 8.2 ± 0.0Aa 5.3 ± 0.1ABb 6.5 ± 0.1
3L+4FOSDa 10.4 ± 0.1Eb 8.2 ± 0.7Aa 5.8 ± 0.1ABb 6.3 ± 0.0
Values are presented as means ± standard deviations (n = 3). A–E A difference in upper case letters within a column significant difference at p < 0.05. a,b A difference in lower case letters between week 0 and week 12 indicates significant difference at p < 0.05. NC: Negative control = no sugar and prebiotic. Positive controls: 3S = 3% sucrose, 2L = 2% lactose, 3L = 3% lactose, 3I = 3% inulin, 4I = 4% inulin, 2FOS = 2% FOS and 4FOS = 4% FOS.
Figure 3. Cell viability (%) of L. plantarum grown in MRS broth containing 3% glucose (3G), fructose (3F), sucrose (3S) and lactose (3L) with (A) 0.5% (0.5I), 1% (1I), 2% (2I), 3% (3I) and 4% (4I) inulin, (B) 0.5% (0.5FOS), 1% (1FOS), 2% (2FOS), 3% (3FOS) and 4% (4FOS) fructooligosaccharide supplementation on the eighth day and 10th day. a–c A difference in lower case letters indicates significant differences between different treatments within a same day at p < 0.05. NC = negative control (no sugar and prebiotic).
Fermentation 07 00259 g003
Figure 4. Cell viability (%) of L. plantarum grown in MRS broth containing 4% glucose (4G), fructose (4F), sucrose (4S) and lactose (4L) with (A) 0.5% (0.5I), 1% (1I), 2% (2I), 3% (3I) and 4% (4I) inulin, (B) 0.5% (0.5FOS), 1% (1FOS), 2% (2FOS), 3% (3FOS) and 4% (4FOS) fructooligosaccharide supplementation on the eighth day and 10th day. a–f A difference in lower case letters indicates significant differences between different treatments within a same day at p < 0.05. NC = negative control (no sugar and prebiotic).
Fermentation 07 00259 g004
Prebiotic supplementation improved storage viability and significantly preserved L. plantarum by almost three log cycles compared to non-supplemented media (Table 3). In general, the concentration of probiotics in supplemented media should be above the lowest recommended therapeutic level of 6 log CFU/mL [64] and within the minimum recommended daily dose of 108 to 109 cells [65]. In this study, the storage viability of L. plantarum at the end of 12-week storage at 4 °C was in the range of 7.29 ± 0.01 log CFU/mL to 8.40 ± 0.04 log CFU/mL for 3S+4I, 2L+3I, and 3S+2FOS, 3L+4FOS (Table 3). We speculated that inulin and FOS might form a gel matrix around the probiotic cells [66] and function as a thickener by contributing to a higher total solid content and protecting probiotics from injury during storage.
The ability of L. plantarum to tolerate pH 3.4–8.8 and temperature 12–40 °C makes it a significant commercial strain. However, the production, distribution, and storage of probiotics creates a harsh environment resulting in high mortality and low efficacy of microorganisms. The survival assay and refrigerated storage assay mimic the processing and storage environment of L. planatrum, respectively. The decrease in the cell viability of L. plantarum in the survival assay (Figure 2, Figure 3 and Figure 4) seems to be more drastic than those in the refrigerated storage assay (Table 3). The survival assay was performed for ten days at 37 °C with continuous shaking at 120 rpm. This leads to faster consumption of sugar and prebiotic, resulting in the accumulation of organic acids and other secondary metabolites and the depletion of carbohydrates in the media that may increase stress, thereby hindering the survival of L. plantarum. In the refrigerated storage assay at 4 °C, metabolism is slowed down, thus preventing the higher accumulation of organic acids and complete exhaustion of carbohydrates in the media, albeit for a duration of 12 weeks.

3.4. Sugar and Organic Acids

As anticipated, the concentration of sucrose significantly (p < 0.05) decreased during storage (Table 4). The sucrose concentration in 3S+4I was 1.4% (Table 4); this was significantly higher than 3S, which was 1% at week 0. Similarly, at week 0, lactose concentration was significantly higher in 2L+3I (1.8%) and 3L+4FOS (2.8%) than 2L and 3L (Table 4). The higher concentration of sucrose and lactose with inulin and FOS supplementation suggests that L. plantarum utilized inulin and FOS in the presence of sucrose and lactose at week 0. On week 12, sucrose concentration dropped below 0.1% with both inulin and FOS supplementation (Table 4), while storage viability was 8.1 ± 0.00 log CFU/mL and 8.2 ± 0.0 log CFU/mL (Table 3), respectively. However, on week 12, lactose concentration was significantly higher (p < 0.05) in 3L+4FOS (0.7%) than 3L (0.2%), while no significant difference was observed between 2L and 2L+3I (Table 4). This could be due to a difference in initial lactose concentration and availability of short-chain FOS in (3L+4FOS) supplemented media. The inefficient lactose utilization by some lactic acid bacteria has not been fully investigated; however, L. rhamnosus GG had been described by its slow utilization of lactose compared to glucose in several in vitro studies [49,50] and even its inability to ferment the lactose [61]. Honda et al. [59] described slow lactose transport in L. brevis KB290 as a reason for inefficient utilization of lactose. Furthermore, β-galactosidase, an inducible enzyme, was required to hydrolysis lactose into glucose and galactose [66]. In addition, complexities involved in galactose metabolism were also responsible for the slower utilization of lactose by L. acidophilus [67].
Studies of other Lactobacillus species have identified various genetic systems responsible for utilizing carbohydrates of varying complexity. For example, the simultaneous utilization of sucrose and FOS might be due to the sucrose phosphoenolpyruvate (PEP)-dependent phosphotransferase system (PTS), which transports short-chain FOS into the cytosol, and it was further digested by intracellular β-fructofuranosidase in L. plantarum WCSF1 [34]. Also, the L. acidophilus NCFM genome was coded for an ABC transport system and a putative intracellular β-fructosidase and found to hydrolyze sucrose, inulin-type fructans, or inulin [32]. Similar systems may have been induced during fermentation and storage; the simultaneous utilization of sucrose and FOS or inulin may have led to sucrose concentrations dropping to 0.05–0.1% with and without inulin and FOS supplementation while maintaining 8.13–8.21 log CFU/mL at week 12 (Table 3).
Lactic acid was the primary fermentation end product. The highest concentration of 12.52% was found in 3S+2FOS, followed by 3S+4I and 3S at week 12 (Table 4). At week 0, lactic acid concentration after 24 h fermentation was 6.56% in 3S+2FOS, followed by 4.89% in 3S+4I and 4.32% in 3S (Table 4). The lactic acid concentration was significantly higher in 3S+2FOS (12.5 ± 0.0%) compared to 3S+4I (10.8 ± 0.0%) and 3S (10.8 ± 0.0%) at week 12, suggesting that sucrose supplemented with FOS increased metabolism, and thus resulted in accumulation of lactic acid in the media (Table 4). Sucrose supplemented with inulin (3S+4I) and FOS (3S+2FOS) created a better growth medium that stimulated L. plantarum than non-supplemented media and resulted in higher (p < 0.05) production of lactic acids. This was consistent with the findings of Desai et al. [68], who found the improved metabolic activity of several species of Lactobacillus in the presence of selected prebiotics. Several authors reported that the utilization of prebiotics and the levels of primary metabolites varied depending on the strain [68,69]. The lactic acid concentration depended on the type of sugar, with sucrose giving a higher (p < 0.05) concentration than lactose. Although lactic acid production is desirable in fermented dairy foods, such a high concentration of organic acids showed no detrimental effect to 3S+4I and 3S+2FOS since the cells maintained relatively constant viability throughout storage. Furthermore, inulin and FOS sustained the metabolic activity of the culture during cold storage, maintaining higher cell viability and resulting in an increase in the production of primary metabolites such as lactic acid (Table 4).
In ethanol analysis, no peaks were observed as L. plantarum are facultative heterofermentative. L. plantarum uses glucose through the EMP to produce lactic acid, while they may also possess an inducible phosphoketolase pathway (PK) with pentose acting as inducers [70].

3.5. Auto-Aggregation, Hydrophobicity, and Co-Aggregation

One of the important characteristics of probiotics is the adhesion of microorganisms to the human intestine, preventing their immediate elimination by peristalsis and providing a competitive advantage in this ecosystem [71]. Aggregation properties are important characteristics of bacterial strains used as probiotics and have been linked to the adhesion of Lactobacillus in a previous study [72]. The auto-aggregation ability of bacteria maintains the bacterial population in the gut [73]. At week 0, auto-aggregation rate significantly increased by 28.1% (3S+4I), 37.3% (2L+3I), 35.6% (3S+2FOS), and 32% (3L+4FOS) in comparison to the non-supplemented media 3S, 2L and 3L (Table 5). As the storage study proceeds, a decline in auto-aggregation rate can be seen in all media comparative to week 0. At week 12, the auto-aggregation rate of 3S+4I, 2L+3I, 3S+2FOS, and 3L+4FOS was 16–26% higher than non-supplemented media, suggesting inulin and FOS supplementation significantly improved auto-aggregation ability of L. plantarum (Table 5). The level of adhesion determines bacterial membrane hydrophobicity to hydrocarbons. This study observed varying adhesion to xylene for L. plantarum grown in 3S+4I, 2L+3I, 3S+2FOS, and 3L+4FOS (Table 5). Hydrophobicity for L. plantarum in 3S+2FOS (90%) was highest, followed by 3S+4I (89%), 2L+3I (88%), and 3S+2FOS (86%) at week 0 (Table 5). As the storage study proceeds, a decrease in hydrophobicity was observed, similar to the auto-aggregation rate. However, a 20–40% increase in hydrophobicity was observed when L. plantarum was stored in supplemented media compared to non-supplemented media at week 12 (Table 5). Some authors have suggested that improved surface properties such as auto-aggregation and hydrophobicity correlate with their adhesive capacity [40,74]. Previously, Ramos et al. [36] reported a 61.9% auto-aggregation rate and no hydrophobicity of L. plantarum SAU96. Moreover, Kotzamanidis et al. [74] reported a 44.3% auto-aggregation rate and 61.3% hydrophobicity of L. plantarum 2035 in MRS broth, suggesting auto-aggregation and hydrophobicity of L. plantarum vary with different strains of Lactobacillus. Similar results were shown by L. paracasei 276 and L. plantarum WSFC-1, where auto-aggregation rate and hydrophobicity improved with supplementation of FOS and inulin [75]. The results in this study are also in accordance with Li et al. [76]. The carbohydrate source (sucrose) in the growth medium affected the surface parameters, henceforth influencing membrane hydrophobicity of L. plantarum.
The co-aggregation assay is a reliable method to evaluate the close interaction between Lactobacillus and pathogenic bacteria. Co-aggregation of L. plantarum with E. coli (Table 5) was better than E. faecalis (Table 5) at week 0. L. plantarum showed better coaggregation ability in 3S+4I (70.4%), 2L+3I (63.7%), 3S+2FOS (58.6%) and 3L+4FOS (64.7%) at week 0 as compared to non-supplemented media (17–57%) (Table 5). Interestingly, co-aggregation ability with both E. coli and E. faecalis increased as the storage week proceeds. At week 12, the co-aggregation ability of L. plantarum with E. coli and E. faecalis in supplemented media was 29–55%, and 8.5–35% higher than non-supplemented media suggesting inulin and FOS supplementation of significantly improved co-aggregation ability (Table 5). In this study, L. plantarum showed a high auto-aggregation percentage and hydrophobicity, which might increase the adhesion to intestinal epithelial cells. Also, L. plantarum showed higher co-aggregation with E. coli than E. faecalis.

3.6. Gastrointestinal Tolerance Assay

Probiotics are currently viewed as resistant to specific conditions occurring in the gastrointestinal tract [77]. Here we explore, the effects of exposure to the simulated gastrointestinal tract on the bacterial survival rate of L. plantarum grown and stored in inulin and FOS supplemented media, as shown in Table 3. In vitro tolerance to gastric conditions varied depending on the bacterial strain, pH value, and techniques used to determine the survival rate of bacterial cells. None of the bacterial strains showed viability or ability to grow after exposure to gastric juices at pH 1.5 (data not shown). At week 0, L. plantarum showed a significantly higher percentage difference in bacterial survival rate (BSR) with 3S+4I (21.55%), 3S+2FOS (23.66%), and 2L+3I (23.29%), 3L+4FOS (20.31%) when compared to non-supplemented media (Table 6). Similarly, Pan et al. [78] also reported that 2% FOS as the sole carbon source enhanced the survival of L. plantarum NI2L+3I02 in simulated gastrointestinal juice.
In L. plantarum, BSR (%) decreased significantly (p < 0.05) in all media combinations as the storage proceeds; the metabolic and limited nutrient stress might have affected the gastrointestinal tolerance (Table 6). Higher sensitivity has been reported for L. rhamnosus and other L. plantarum strains [79,80]. Buriti et al. [81] reported similar results, who reported higher cell viability of L. acidophilus La-5 during the gastric phase involving HCl and pepsin when the strain was incorporated in a synbiotic light mousse containing sugar and 2% inulin. However, Gomez-Mascaraque et al. [82] observed a viability loss for L. plantarum CECT using whey protein concentrate (WPC) powder as a coating agent during the gastric phase. Schell, Beermann [83] observed an increased survival of microencapsulated L. reuteri DSM 20,016 (in sweet whey and shellac) during the in-vitro gastrointestinal environment, probably due to cell structure recovery of the injured bacteria to the less stressful conditions of the enteric phase.
At week 12, L. plantarum showed a significantly higher percentage increase in BSR of 25.21% in 3L+4FOS followed by 21.33% in 2L+3I, 20% in 3S+2FOS, and 14.33% in 3S+4I as compared to non-supplemented media (Table 6). Based on BSR (%), FOS supplementation was better than inulin supplementation in the lactose system. The significant increase in BSR (%) in the in vitro gastrointestinal environment of L. plantarum during storage may be due to the slow degradation of inulin and FOS in acidic conditions, which improved probiotic survival. Gardiner et al. [84] suggested that protective extracellular polysaccharides enhance the survival of the probiotic strains during gastric transit. Therefore, prebiotic ingredients may be an alternative to improve probiotic survival through the gastrointestinal tract [85]. Besides, the survival of probiotic cells may be attributed to inulin and FOS resistance to hydrolysis by the gastrointestinal enzymes and the low solubility of long-chain inulin [86].
Moreover, these results establish that inulin and FOS supplementation significantly increased bacterial cultures’ in vitro gastrointestinal associated stress tolerance. Specifically, mild salt stress and lower pH adaptation may elicit adaptive responses that reduce and support such stress tolerance, respectively. However, adhesive assay with intestinal cell lines (HT29 and Caco2) with in vitro gastrointestinal tract assay will further elucidate the effect of inulin and FOS on probiotic survival and adhesive properties.

4. Conclusions

In growth assay and survival studies, the highest percentage increase in growth index and cell viability showed that sucrose and lactose were more suitable sugar substrates for inulin and FOS supplementation. Furthermore, sucrose and lactose systems with inulin or FOS supplementation supported and improved the stability and probiotic potential of L. plantarum during 12-week refrigerated storage at 4 °C. The higher percentage increase in bacterial survival rate showed that FOS supplementation was better than inulin supplementation in sucrose and lactose systems in the gastrointestinal tolerance study. Furthermore, hydrophobicity, auto-aggregation, co-aggregation ability of L. plantarum with E. coli and E. faecalis were improved in sucrose and lactose systems with FOS and inulin supplementation. In conclusion, using the right type and concentration of carbon source and the right kind and concentration of prebiotic for culturing L. plantarum can improve its cell viability and efficacy, as shown in gastrointestinal robustness. This study provides insight to design fermentation and storage conditions that aim to produce probiotic products with improved viability and gastrointestinal tolerance and have a higher potential to achieve their desired health beneficial effects.

Supplementary Materials

The following are available online at https://0-www-mdpi-com.brum.beds.ac.uk/2311-5637/7/4/259/s1, Table S1: Viable count (log CFU/mL) of L. plantarum grown in MRS broth containing 2%, 3% and 4% of glucose, fructose, sucrose and lactose supplemented with 0%, 0.5%, 1%, 2%, 3% and 4% of inulin during 24 h growth at 37 °C; Table S2: Viable count (log CFU/mL) of L. plantarum grown in MRS broth containing 2%, 3% and 4% of glucose, fructose, sucrose and lactose supplemented with 0%, 0.5%, 1%, 2%, 3% and 4% of fructooligosaccharide (FOS) during 24 h growth at 37 °C.

Author Contributions

Conceptualization, W.S.C.; investigation, P.P.; formal analysis, P.P.; resources, W.S.C.; writing—original draft preparation, P.P.; writing—review and editing, P.P., W.S.C. and K.P.S.; project administration, W.S.C.; funding acquisition, W.S.C.; supervision, W.S.C. and K.P.S. All authors have read and agreed to the published version of the manuscript.

Funding

This work was funded by the School of Science, Monash University Malaysia.

Institutional Review Board Statement

Not applicable.

Informed Consent Statement

Not applicable.

Data Availability Statement

Not applicable.

Conflicts of Interest

The authors declare no conflict of interest.

References

  1. Stewart, M.L.; Timm, D.A.; Slavin, J.L. Fructooligosaccharides exhibit more rapid fermentation than long-chain inulin in an in vitro fermentation system. Nutr. Res. 2008, 28, 329–334. [Google Scholar] [CrossRef]
  2. Roberfroid, M. Prebiotics: The concept revisited. J. Nutr. 2017, 137, 830S–837S. [Google Scholar] [CrossRef] [PubMed]
  3. Meyer, D.; Bayarri, S.; Tárrega, A.; Costell, E. Inulin as texture modifier in dairy products. Food Hydrocoll. 2011, 25, 1881–1890. [Google Scholar] [CrossRef]
  4. Van Den Ende, W.; Peshev, D.; De Gara, L. Disease prevention by natural antioxidants and prebiotics acting as ROS scavengers in the gastrointestinal tract. Trends Food Sci. Technol. 2011, 22, 689–697. [Google Scholar] [CrossRef]
  5. Peshev, D.; Van Den Ende, W. Fructans: Prebiotics and immunomodulators. J. Funct. Foods 2014, 8, 348–357. [Google Scholar] [CrossRef]
  6. Oliveira, R.P.; Florence, A.C.; Silva, R.C.; Perego, P.; Converti, A.; Gioielli, L.A.; Oliveira, M.N. Effect of different prebiotics on the fermentation kinetics, probiotic survival and fatty acids profiles in nonfat symbiotic fermented milk. Int. J. Food Microbiol. 2009, 128, 467–472. [Google Scholar] [CrossRef] [PubMed]
  7. Cao, P.; Wu, L.; Wu, Z.; Pan, D.; Zeng, X.; Guo, Y.; Lian, L. Effects of oligosaccharides on the fermentation properties of Lactobacillus plantarum. J. Dairy Sci. 2019, 102, 2863–2872. [Google Scholar] [CrossRef]
  8. Delavari, M.; Pourahmad, R.; Sokutifar, R. Production of low fat synbiotic yogurt containing Lactobacillus plantarum and inulin. Adv. Environ. Biol. 2014, 8, 17–24. [Google Scholar]
  9. Kariyawasam, K.M.G.M.M.; Lee, N.K.; Paik, H.D. Synbiotic yoghurt supplemented with novel probiotic Lactobacillus brevis KU200019 and fructooligosaccharides. Food Biosci. 2021, 39, 100835. [Google Scholar] [CrossRef]
  10. Bao, Y.; Zhang, Y.; Li, H.; Liu, Y.; Wang, S.; Dong, X.; Su, F.; Yao, G.; Sun, T.; Zhang, H. In vitro screen of Lactobacillus plantarum as probiotic bacteria and their fermented characteristics in soymilk. Ann. Microbiol. 2021, 62, 1311–1320. [Google Scholar] [CrossRef]
  11. Amanda, E.; Choo, W.S. Effect of refrigerated storage on the physicochemical characteristics and viability of Lactobacillus plantarum in fermented watermelon juice with or without supplementation with inulin or fructooligosaccharide. J. Food Process. Preserv. 2018, 42, 13831. [Google Scholar] [CrossRef]
  12. Russo, P.; de Chiara, M.L.V.; Capozzi, V.; Arena, M.P.; Amodio, M.L.; Rascón, A.; Dueñas, M.T.; López, P.; Spano, G. Lactobacillus plantarum strains for multifunctional oat-based foods. LWT-Food Sci. Technol. 2016, 68, 288–294. [Google Scholar] [CrossRef]
  13. Speranza, B.; Campaniello, D.; Monacis, N.; Bevilacqua, A.; Sinigaglia, M.; Corbo, M.R. Functional cream cheese supplemented with Bifidobacterium animalis subsp. lactis DSM 10140 and Lactobacillus reuteri DSM 20016 and prebiotics. Food Microbiol. 2018, 72, 16–22. [Google Scholar] [PubMed]
  14. Zheng, J.; Wittouck, S.; Salvetti, E.; Franz, C.M.; Harris, H.; Mattarelli, P.; O’Toole, P.W.; Pot, B.; Vandamme, P.; Walter, J.; et al. A taxonomic note on the genus Lactobacillus: Description of 23 novel genera, emended description of the genus Lactobacillus Beijerinck 1901, and union of Lactobacillaceae and Leuconostocaceae. Int. J. Syst. Evol. Microbiol. 2020, 70, 2782–2858. [Google Scholar] [CrossRef] [PubMed]
  15. De Vries, M.C.; Vaughan, E.E.; Kleerebezem, M.; de Vos, W.M. Lactobacillus plantarum—survival, functional and potential probiotic properties in the human intestinal tract. Int. Dairy J. 2006, 16, 1018–1028. [Google Scholar] [CrossRef]
  16. Didari, T.; Solki, S.; Mozaffari, S.; Nikfar, S.; Abdollahi, M. A systematic review of the safety of probiotics. Expert Opin. Drug Saf. 2014, 13, 227–239. [Google Scholar] [CrossRef]
  17. Makarova, K.; Slesarev, A.; Wolf, Y.; Sorokin, A.; Mirkin, B.; Koonin, E.; Pavlov, A.; Pavlova, N.; Karamychev, V.; Polouchine, N.; et al. Comparative genomics of the lactic acid bacteria. Proc. Natl. Acad. Sci. USA 2006, 103, 15611–15616. [Google Scholar] [CrossRef] [PubMed]
  18. Guimarães, A.; Santiago, A.; Teixeira, J.A.; Venâncio, A.; Abrunhosa, L. Anti-aflatoxigenic effect of organic acids produced by Lactobacillus plantarum. Int. J. Food Microbiol. 2018, 264, 31–38. [Google Scholar] [CrossRef] [PubMed]
  19. Hu, C.H.; Ren, L.Q.; Zhou, Y.; Ye, B.C. Characterization of antimicrobial activity of three Lactobacillus plantarum strains isolated from Chinese traditional dairy food. Food Sci. Nutr. 2019, 7, 1997–2005. [Google Scholar] [CrossRef] [PubMed]
  20. Barbosa, M.S.; Todorov, S.D.; Ivanova, I.V.; Belguesmia, Y.; Choiset, Y.; Rabesona, H.; Chobert, J.M.; Haertlé, T.; Franco, B.D.G.M. Characterization of a two-peptide plantaricin produced by Lactobacillus plantarum MBSa4 isolated from Brazilian salami. Food Control 2016, 60, 103–112. [Google Scholar] [CrossRef]
  21. Kwak, M.K.; Liu, R.; Kang, S.O. Antimicrobial activity of cyclic dipeptides produced by Lactobacillus plantarum LBP-K10 against multidrug-resistant bacteria, pathogenic fungi, and influenza A virus. Food Control 2018, 85, 223–234. [Google Scholar] [CrossRef]
  22. Gibson, G.R.; Hutkins, R.; Sanders, M.E.; Prescott, S.L.; Reimer, R.A.; Salminen, S.J.; Scott, K.; Stanton, C.; Swanson, K.S.; Cani, P.D. Expert consensus document: The International Scientific Association for Probiotics and Prebiotics (ISAPP) consensus statement on the definition and scope of prebiotics. Nat. Rev. Gastroenterol. Hepatol. 2017, 14, 491–502. [Google Scholar] [CrossRef] [PubMed]
  23. Bhushan, B.; Tomar, S.K.; Chauhan, A. Techno-functional differentiation of two vitamin B 12 producing Lactobacillus plantarum strains: An elucidation for diverse future use. Appl. Microbiol. Biotechnol. 2017, 101, 697–709. [Google Scholar] [CrossRef] [PubMed]
  24. Hugenschmidt, S.; Schwenninger, S.M.; Lacroix, C. Concurrent high production of natural folate and vitamin B12 using a co-culture process with Lactobacillus plantarum SM39 and Propionibacterium freudenreichii DF13. Process. Biochem. 2011, 46, 1063–1070. [Google Scholar] [CrossRef]
  25. Tallon, R.; Bressollier, P.; Urdaci, M.C. Isolation and characterization of two exopolysaccharides produced by Lactobacillus plantarum EP56. Res. Microbiol. 2003, 154, 705–712. [Google Scholar] [CrossRef]
  26. Alexander, C.; Swanson, K.S.; Fahey, G.C., Jr.; Garleb, K.A. Perspective: Physiologic Importance of Short-Chain Fatty Acids from Nondigestible Carbohydrate Fermentation. Adv. Nutr. 2019, 10, 576–589. [Google Scholar] [CrossRef]
  27. Cebeci, A.; Gürakan, C. Properties of potential probiotic Lactobacillus plantarum strains. Food Microbiol. 2003, 20, 511–518. [Google Scholar] [CrossRef]
  28. Holzapfel, W.H.; Haberer, P.; Geisen, R.; Björkroth, J.; Schillinger, U. Taxonomy and important features of probiotic microorganisms in food and nutrition. Am. J. Clin. Nutr. 2001, 73, 365s–373s. [Google Scholar] [CrossRef] [PubMed]
  29. Plumed-Ferrer, C.; Koistinen, K.M.; Tolonen, T.L.; Lehesranta, S.J.; Karenlampi, S.O.; Makimattila, E.; Joutsjoki, V.; Virtanen, V.; Von Wright, A. Comparative study of sugar fermentation and protein expression patterns of two Lactobacillus plantarum strains grown in three different media. Appl. Environ. Microbiol. 2008, 74, 5349–5358. [Google Scholar] [CrossRef] [PubMed]
  30. Chen, C.; Zhou, F.; Ren, J.; Ai, L.; Dong, Y.; Wu, Z.; Liu, Z.; Chen, W.; Guo, B. Cloning, expression and functional validation of a β-fructofuranosidase from Lactobacillus plantarum. Process. Biochem. 2014, 49, 758–767. [Google Scholar] [CrossRef]
  31. Goh, Y.J.; Lee, J.H.; Hutkins, R.W. Functional analysis of the fructooligosaccharide utilization operon in Lactobacillus paracasei 1195. Appl. Environ. Microbiol. 2007, 73, 5716–5724. [Google Scholar] [CrossRef]
  32. Barrangou, R.; Altermann, E.; Hutkins, R.; Cano, R.; Klaenhammer, T.R. Functional and comparative genomic analyses of an operon involved in fructooligosaccharide utilization by Lactobacillus acidophilus. Proc. Natl. Acad. Sci. USA 2003, 100, 8957–8962. [Google Scholar] [CrossRef]
  33. Kaplan, H.; Hutkins, R.W. Metabolism of fructooligosaccharides by Lactobacillus paracasei 1195. Appl. Environ. Microbiol. 2003, 69, 2217–2222. [Google Scholar] [CrossRef]
  34. Saulnier, D.M.; Molenaar, D.; de Vos, W.M.; Gibson, G.R.; Kolida, S. Identification of prebiotic fructooligosaccharide metabolism in Lactobacillus plantarum WCFS1 through microarrays. Appl. Environ. Microbiol. 2007, 73, 1753–1765. [Google Scholar] [CrossRef]
  35. Parhi, P.; Song, K.P.; Choo, W.S. Effect of inulin and fructooligosaccharide supplementation on the growth and survival of Lactobacillus casei in model sugar systems. J. Food Process. Preserv. 2021, 45, 15228. [Google Scholar] [CrossRef]
  36. Ramos, C.L.; Thorsen, L.; Schwan, R.F.; Jespersen, L. Strain-specific probiotics properties of Lactobacillus fermentum, Lactobacillus plantarum and Lactobacillus brevis isolates from Brazilian food products. Food Microbiol. 2013, 36, 22–29. [Google Scholar] [CrossRef] [PubMed]
  37. Nazzaro, F.; Fratianni, F.; Sada, A.; Orlando, P. Synbiotic potential of carrot juice supplemented with Lactobacillus spp. and inulin or fructooligosaccharides. J. Sci. Food Agric. 2008, 88, 2271–2276. [Google Scholar] [CrossRef]
  38. Bevilacqua, A.; Perricone, M.; Cannarsi, M.; Corbo, M.R.; Sinigaglia, M. Technological and spoiling characteristics of the yeast microflora isolated from Bella di Cerignola table olives. Int. J. Food Sci. Technol. 2009, 44, 2198–2207. [Google Scholar] [CrossRef]
  39. Bevilacqua, A.; Sinigaglia, M.; Speranza, B.; Altieri, C. Effect of prebiotic compounds on the growth and survival of bifidobacteria in a laboratory medium. Adv. J. Food Sci. Technol. 2016, 11, 770–774. [Google Scholar] [CrossRef]
  40. Kos, B.V.Z.E.; Šušković, J.; Vuković, S.; Šimpraga, M.; Frece, J.; Matošić, S. Adhesion and aggregation ability of probiotic strain Lactobacillus acidophilus M92. J. Appl. Microbiol. 2003, 94, 981–987. [Google Scholar] [CrossRef] [PubMed]
  41. Kimoto-Nira, H.; Suzuki, C.; Sasaki, K.; Kobayashi, M.; Mizumachi, K. Survival of a Lactococcus lactis strain varies with its carbohydrate preference under in vitro conditions simulated gastrointestinal tract. Int. J. Food Microbiol. 2010, 143, 226–229. [Google Scholar] [CrossRef] [PubMed]
  42. Valero-Cases, E.; Frutos, M.J. Effect of different types of encapsulation on the survival of Lactobacillus plantarum during storage with inulin and in vitro digestion. LWT-Food Sci. Technol. 2015, 64, 824–828. [Google Scholar] [CrossRef]
  43. Da Silva Sabo, S.; Converti, A.; Todorov, S.D.; Domínguez, J.M.; de Souza Oliveira, R.P. Effect of inulin on growth and bacteriocin production by Lactobacillus plantarum in stationary and shaken cultures. Int. J. Food Sci. Technol. 2015, 50, 864–870. [Google Scholar] [CrossRef]
  44. Munoz, M.; Mosquera, A.; Almeciga-Diaz, C.J.; Melendez, A.P.; Sanchez, O.F. Fructooligosaccharides metabolism and effect on bacteriocin production in Lactobacillus strains isolated from ensiled corn and molasses. Anaerobe 2012, 18, 321–330. [Google Scholar] [CrossRef]
  45. Oliveira, R.P.D.S.; Perego, P.; De Oliveira, M.N.; Converti, A. Effect of inulin as a prebiotic to improve growth and counts of a probiotic cocktail in fermented skim milk. LWT-Food Sci. Technol. 2011, 44, 520–523. [Google Scholar] [CrossRef]
  46. Perrin, S.; Warchol, M.; Grill, J.P.; Schneider, F. Fermentations of fructo-oligosaccharides and their components by Bifidobacterium infantis ATCC 15697 on batch culture in semi-synthetic medium. J. Appl. Microbiol. 2001, 90, 859–865. [Google Scholar] [CrossRef] [PubMed]
  47. Leh, M.B.; Charles, M. Lactic acid production by batch fermentation of whey permeate: A mathematical model. J. Ind. Microbiol. Biotechnol. 1989, 4, 65–70. [Google Scholar] [CrossRef]
  48. Zhang, X.; Hao, X.; Wang, H.; Li, X.; Liu, L.; Yang, W.; Zhao, M.; Wang, L.; Bora, A.F.M. The effects of Lactobacillus plantarum combined with inulin on the physicochemical properties and sensory acceptance of low-fat Cheddar cheese during ripening. Int. Dairy J. 2021, 115, 104947. [Google Scholar] [CrossRef]
  49. Corcoran, B.M.; Stanton, C.; Fitzgerald, G.F.; Ross, R.P. Survival of Probiotic Lactobacilli in Acidic Environments Is Enhanced in the Presence of Metabolizable Sugars. Appl. Environ. Microbiol. 2005, 71, 3060–3067. [Google Scholar] [CrossRef]
  50. Hedberg, M.; Hasslöf, P.; Sjöström, I.; Twetman, S.; Stecksén-Blicks, C. Sugar fermentation in probiotic bacteria—An in vitro study. Oral Microbiol. Immunol. 2008, 23, 482–485. [Google Scholar] [CrossRef] [PubMed]
  51. Kneifel, W. In vitro growth behaviour of probiotic bacteria in culture media with carbohydrates of prebiotic importance. Microb. Ecol. Health Dis. 2000, 12, 27–34. [Google Scholar]
  52. Deutscher, J.; Galinier, A.; Martin-Verstraete, I. Carbohydrate uptake and metabolism. In Bacillus Subtilis and Its Closest Relatives: From Genes to Cells; Sonenshein, A.L., Hoch, J.A., Losick, R., Eds.; ASM Press: Washington, DC, USA, 2001; pp. 129–150. [Google Scholar]
  53. Titgemeyer, F.; Hillen, W. Global control of sugar metabolism: A gram-positive solution. In Lactic Acid Bacteria: Genetics, Metabolism and Applications; Siezen, R.J., Kok, J., Abee, T., Schasfsma, G., Eds.; Springer: Dordrecht, The Netherlands, 2000; pp. 59–71. [Google Scholar]
  54. Vadeboncoeur, C.; Pelletier, M. The phosphoenolpyruvate: Sugar phosphotransferase system of oral streptococci and its role in the control of sugar metabolism. FEMS Microbiol. Rev. 1997, 19, 187–207. [Google Scholar] [CrossRef] [PubMed]
  55. Huebner, J.; Wehling, R.L.; Hutkins, R.W. Functional activity of commercial prebiotics. Int. Dairy J. 2007, 17, 770–775. [Google Scholar] [CrossRef]
  56. Krasaekoopt, W.; Watcharapoka, S. Effect of addition of inulin and galactooligosaccharide on the survival of microencapsulated probiotics in alginate beads coated with chitosan in simulated digestive system, yogurt and fruit juice. LWT-Food Sci. Technol. 2014, 57, 761–766. [Google Scholar] [CrossRef]
  57. Livingston, D.P., III; Henson, C.A. Apoplastic sugars, fructans, fructan exohydrolase, and invertase in winter oat: Responses to second-phase cold hardening. Plant Physiol. 1998, 116, 403–408. [Google Scholar] [CrossRef]
  58. Vereyken, I.J.; Chupin, V.; Islamov, A.; Kuklin, A.; Hincha, D.K.; de Kruijff, B. The effect of fructan on the phospholipid organization in the dry state. Biophys. J. 2003, 85, 3058–3065. [Google Scholar] [CrossRef]
  59. Honda, H.; Yajima, N.; Saito, T. Characterization of lactose utilization and β-Galactosidase in Lactobacillus brevis KB290, the hetero-fermentative lactic acid bacterium. Curr. Microbiol. 2012, 65, 679–685. [Google Scholar] [CrossRef]
  60. Srinivas, D.; Mital, B.K.; Garg, S.K. Utilization of sugars by Lactobacillus acidophilus strains. Int. J. Food Microbiol. 1990, 10, 51–57. [Google Scholar] [CrossRef]
  61. Goldin, B.R.; Gorbach, S.L.; Saxelin, M.; Barakat, S.; Gualtieri, L.; Salminen, S. Survival of Lactobacillus species (strain GG) in human gastrointestinal tract. Dig. Dis. Sci. 1992, 37, 121–128. [Google Scholar] [CrossRef] [PubMed]
  62. Haukioja, A.; Söderling, E.; Tenovuo, J. Acid production from sugars and sugar alcohols by probiotic lactobacilli and bifidobacteria in vitro. Caries Res. 2008, 42, 449–453. [Google Scholar] [CrossRef] [PubMed]
  63. Filannino, P.; Cardinali, G.; Rizzello, C.G.; Buchin, S.; De Angelis, M.; Gobbetti, M.; Di Cagno, R. Metabolic responses of Lactobacillus plantarum strains during fermentation and storage of vegetable and fruit juices. Appl. Environ. Microbiol. 2014, 80, 2206–2215. [Google Scholar] [CrossRef]
  64. Neysens, P.; Messens, W.; Gevers, D.; Swings, J.; De Vuyst, L. Biphasic kinetics of growth and bacteriocin production with Lactobacillus amylovorus DCE 471 occur under stress conditions. Microbiology 2003, 149, 1073–1082. [Google Scholar] [CrossRef]
  65. De Vuyst, L. Technology aspects related to the application of functional starter cultures. Food Technol. Biotechnol. 2000, 38, 105–112. [Google Scholar]
  66. Sodini, I.; Lucas, A.; Oliveira, M.N.; Remeuf, F.; Corrieu, G. Effect of milk base and starter culture on acidification, texture, and probiotic cell counts in fermented milk processing. J. Dairy Sci. 2002, 85, 2479–2488. [Google Scholar] [CrossRef]
  67. Buntin, N.; Hongpattarakere, T.; Ritari, J.; Douillard, F.P.; Paulin, L.; Boeren, S.; Shetty, S.A.; de Vos, W.M. An inducible operon is involved in inulin utilization in Lactobacillus plantarum strains, as revealed by comparative proteogenomic and metabolic profiling. Appl. Environ. Microbiol. 2017, 83, e02402-16. [Google Scholar] [CrossRef]
  68. Desai, A.B.; Powell, I.B.; Shah, N.P. Survival and activity of probiotic lactobacilli in skim milk containing prebiotics. J. Funct. Foods 2004, 69, 57–60. [Google Scholar] [CrossRef]
  69. Bruno, F.A.; Lankaputhra, W.E.V.; Shah, N.P. Growth, viability and activity of Bifidobacterium spp. in skim milk containing prebiotics. J. Funct. Foods 2002, 67, 2740–2744. [Google Scholar] [CrossRef]
  70. Fugelsang, K.C. The lactic acid bacteria. In Wine Microbiology; Springer: Boston, MA, USA, 1997; pp. 3–47. [Google Scholar]
  71. Alander, M.; Satokari, R.; Korpela, R.; Saxelin, M.; Vilpponen-Salmela, T.; Mattila-Sandholm, T.; von Wright, A. Persistence of colonization of human colonic mucosa by a probiotic strain, Lactobacillus rhamnosus GG, after oral consumption. Appl. Environ. Microbiol. 1999, 65, 351–354. [Google Scholar] [CrossRef] [PubMed]
  72. García-Cayuela, T.; Korany, A.M.; Bustos, I.; de Cadiñanos, L.P.G.; Requena, T.; Peláez, C.; Martínez-Cuesta, M.C. Adhesion abilities of dairy Lactobacillus plantarum strains showing an aggregation phenotype. Food Res. Int. 2014, 57, 44–50. [Google Scholar] [CrossRef]
  73. Rickard, A.H.; Gilbert, P.; High, N.J.; Kolenbrander, P.E.; Handley, P.S. Bacterial co-aggregation: An integral process in the development of multi-species biofilms. Trends Microbiol. 2003, 11, 94–100. [Google Scholar] [CrossRef]
  74. Kotzamanidis, C.; Kourelis, A.; Litopoulou-Tzanetaki, E.; Tzanetakis, N.; Yiangou, M. Evaluation of adhesion capacity, cell surface traits and immunomodulatory activity of presumptive probiotic Lactobacillus strains. Int. J. Food Microbiol. 2010, 140, 154–163. [Google Scholar] [CrossRef]
  75. Pan, M.; Kumaree, K.K.; Shah, N.P. Physiological changes of surface membrane in Lactobacillus with prebiotics. J. Funct. Foods 2017, 82, 744–750. [Google Scholar]
  76. Li, H.; Lu, M.; Guo, H.; Li, W.; Zhang, H. Protective effect of sucrose on the membrane properties of Lactobacillus casei Zhang subjected to freeze-drying. J. Food Prot. 2010, 73, 715–719. [Google Scholar] [CrossRef] [PubMed]
  77. FAO/WHO (Food and Agriculture Organization/World Health Organization). Joint FAO/WHO Working Group Report on Drafting Guidelines for the Evaluation of Probiotics in Food; WHO: London, ON, Canada, 2002. [Google Scholar]
  78. Pan, X.; Wu, T.; Zhang, L.; Cai, L.; Song, Z. Influence of oligosaccharides on the growth and tolerance capacity of lactobacilli to simulated stress environment. Lett. Appl. Microbiol. 2009, 48, 362–367. [Google Scholar] [CrossRef]
  79. Succi, M.; Tremonte, P.; Reale, A.; Sorrentino, E.; Grazia, L.; Pacifico, S.; Coppola, R. Bile salt and acid tolerance of Lactobacillus rhamnosus strains isolated from Parmigiano Reggiano cheese. FEMS Microbiol. Lett. 2005, 244, 129–137. [Google Scholar] [CrossRef] [PubMed]
  80. Georgieva, R.N.; Iliev, I.N.; Chipeva, V.A.; Dimitonova, S.P.; Samelis, J.; Danova, S.T. Identification and in vitro characterisation of Lactobacillus plantarum strains from artisanal Bulgarian white brined cheeses. J. Basic Microbiol. 2008, 48, 234–244. [Google Scholar] [CrossRef]
  81. Buriti, F.C.; Castro, I.A.; Saad, S.M. Viability of Lactobacillus acidophilus in synbiotic guava mousses and its survival under in vitro simulated gastrointestinal conditions. Int. J. Food Microbiol. 2010, 137, 121–129. [Google Scholar] [CrossRef] [PubMed]
  82. Gomez-Mascaraque, L.G.; Morfin, R.C.; Pérez-Masiá, R.; Sanchez, G.; Lopez-Rubio, A. Optimization of electrospraying conditions for the microencapsulation of probiotics and evaluation of their resistance during storage and in-vitro digestion. LWT-Food Sci. Technol. 2016, 69, 438–446. [Google Scholar] [CrossRef]
  83. Schell, D.; Beermann, C. Fluidized bed microencapsulation of Lactobacillus reuteri with sweet whey and shellac for improved acid resistance and in-vitro gastrointestinal survival. Food Res. Int. 2014, 62, 308–314. [Google Scholar] [CrossRef]
  84. Gardiner, G.; Stanton, C.; Lynch, P.B.; Collins, J.K.; Fitzgerald, G.; Ross, R.P. Evaluation of cheddar cheese as a food carrier for delivery of a probiotic strain to the gastrointestinal tract. J. Dairy Sci. 1999, 82, 1379–1387. [Google Scholar] [CrossRef]
  85. Hernández-Hernández, O.; Muthaiyan, A.; Moreno, F.J.; Montilla, A.; Sanz, M.L.; Ricke, S.C. Effect of prebiotic carbohydrates on the growth and tolerance of Lactobacillus. Food Microbiol. 2012, 30, 355–361. [Google Scholar] [CrossRef] [PubMed]
  86. Pinto, S.S.; Verruck, S.; Vieira, C.R.; Prudêncio, E.S.; Amante, E.R.; Amboni, R.D. Influence of microencapsulation with sweet whey and prebiotics on the survival of Bifidobacterium-BB-12 under simulated gastrointestinal conditions and heat treatments. LWT-Food Sci. Technol. 2015, 64, 1004–1009. [Google Scholar] [CrossRef]
Table 1. Growth index (%) of L. plantarum grown in MRS broth containing 2%, 3%, and 4% of glucose, fructose, sucrose, and lactose supplemented with 0%, 0.5%, 1%, 2%, 3%, and 4% of inulin during 24 h growth at 37 °C.
Inulin
0%0.5%1%2%3%4%
Negative Control0%Aa 35.5 ± 2.3Dc 68.0 ± 0.4Dd 72.2 ± 0.4Bd 74.0 ± 0.6Ac 67.6 ± 0.5Ab 61.7 ± 1.0
Glucose2%Fb 84.7 ± 0.7GHc 87.8 ± 0.6Gd 91.0 ± 0.4Fd 91.7 ± 0.7Ca 81.7 ± 0.5Ca 82.2 ±1.2
3%Fb 86.1 ± 0.7IJc 90.9 ± 1.2Gc 91.9 ± 1.3Fc 92.9 ± 0.7Db 85.3 ± 1.2Ca 81.2 ± 1.1
4%Ge 100.0 ± 0.5Jd 93.6 ± 0.9Gc 90.9 ± 0.7Eb 87.2 ± 0.7Db 85.4 ± 0.2Ca 82.4 ± 1.1
Fructose2%Ea 73.9 ± 0.5Fbc 81.2 ± 0.5Fc 83.5 ± 1.3Ed 87.2 ± 0.4Cbc 82.0 ± 0.3BCb 79.5 ± 1.0
3%Fb 85.0 ± 1.8GHIbc 88.0 ± 1.4Gc 90.7 ± 1.8Ebc 88.8 ± 1.0BCa 80.3 ± 0.6BCa 80.0 ± 0.7
4%Gc 96.3 ± 1.4Gb 86.2 ± 0.8Fa 82.9 ± 0.7Da 82.9 ± 0.1Ca 80.9 ± 1.0BCa 80.2 ± 1.0
Sucrose2%Ec 71.1 ± 0.4CDa 65.1 ± 0.4BCb 68.1 ± 0.3Bd 73.3 ± 1.0Ce 81.4 ± 0.6Ce 82.1 ± 0.4
3%Da 62.9 ± 0.6Eb 75.9 ± 0.3Eb 76.1 ± 0.4Dc 82.1 ± 0.3Dd 86.1 ± 1.0De 93.9 ± 0.5
4%Da 60.3 ± 0.4HIe 89.7 ± 0.9Fd 86.5 ± 0.8Dc 82.1 ± 0.6Cc 82.7 ± 0.4BCb 79.6 ± 0.4
Lactose2%Ba 49.1 ± 1.9Aa 50.0 ± 0.6Ab 64.2 ± 0.2Ac 68.6 ± 0.9Cd 81.2 ± 0.4BCd 80.7 ± 0.7
3%Ca 54.5 ± 0.4Cb 63.3 ± 1.2ABb 65.4 ± 2.1Cc 78.7 ± 0.7BCc 80.2 ± 0.7Cc 80.9 ± 0.2
4%Ca 55.6 ± 0.9Ba 58.4 ± 0.8CDb 69.3 ± 0.9Ab 69.4 ± 1.6Bc 78.1 ± 0.9Bc 77.8 ± 0.8
Values are presented as means ± standard deviations (n = 3). a–e A difference in lower case letters within a row indicates a significant difference at p < 0.05. A–J A difference in upper case letters within a column indicates a significant difference at p < 0.05.
Table 2. Growth index (%) of L. plantarum grown in MRS broth containing 2%, 3%, and 4% of glucose, fructose, sucrose, and lactose supplemented with 0.5%, 1%, 2%, 3%, and 4% of fructooligosaccharide (FOS) during 24 h growth at 37 °C.
Fructooligosaccharide (FOS)
0%0.5%1%2%3%4%
Negative Control0%Aa 35.7 ± 1.9Ab 69.0 ± 0.8ABc 75.3 ± 0.2Ad 80.0 ± 0.5ABd 79.4 ± 0.4Ac 73.2 ± 0.1
Glucose2%Fab 83.7 ± 0.1EFb 85.2 ± 0.4DEc 88.3 ± 1.1Fc 90.8 ± 1.1Dab 84.1 ± 1.5DEa 82.0 ± 0.6
3%Gc 86.7 ± 0.4FGc 87.2 ± 0.6Cb 83.0 ± 0.7ABb 83.0 ± 1.6Aa 77.9 ± 0.1Ba 76.9 ± 0.8
4%Id 100.0 ± 0.5Hc 92.5 ± 1.2Eb 88.9 ± 1.2DEFb 88.3 ± 0.6DEa 84.7 ± 0.5EFa 83.7 ± 0.9
Fructose2%Ea 78.3 ± 0.7Dab 80.7 ± 0.9Cbc 81.4 ± 0.3BCDd 85.3 ± 0.9DEFd 85.2 ± 0.7EFcd 83.3 ± 1.0
3%Fb 83.7 ± 0.2Gd 93.2 ± 0.2Dc 85.8 ± 0.7BCb 83.7 ± 0.8CDbc 83.7 ± 0.9BCDa 79.5 ± 0.6
4%Hd 97.1 ± 0.6Hc 92.1 ± 1.3Eb 88.6 ± 1.2CDEb 86.8 ± 0.8BCa 81.3 ± 0.2BCa 78.4 ± 0.9
Sucrose2%Da 65.7 ± 0.5Hc 87.7 ± 0.2Fd 93.1 ± 0.1EFc 89.1 ± 0.9FGc 87.3 ± 1.0EFb 84.0 ± 0.5
3%Da 65.0 ± 0.8Ebc 84.3 ± 0.6Fd 92.5 ± 0.4Ge 95.2 ± 0.1DEFGc 86.0 ± 1.1EFb 83.5 ± 0.5
4%Ca 61.4 ± 0.6EFGc 86.0 ± 0.5DEe 88 ± 0.7CDEcd 86.4 ± 0.5DEc 84.5 ± 0.1CDb 80.6 ± 0.9
Lactose2%Ba 54.9 ± 0.3BCb 77.0 ± 0.6Bb 77.5 ± 0.4Bc 83.1 ± 0.8DEFGd 85.4 ± 0.6Ge 88.8 ± 0.7
3%Ba 53.6 ± 1.1CDb 78.4 ± 0.3Bb 77.7 ± 0.3BCDc 85.7 ± 1.2EFGc 86.9 ± 0.1Hd 93.1 ± 0.9
4%Ba 53.4 ± 0.2Bb 75.2 ± 0.5Ab 74.3 ± 0.5ABc 82.8 ± 0.6Gd 87.9 ±0.8Fe 84.7 ± 0.3
Values are presented as means ± standard deviations (n = 3). a–e A difference in lower case letters within a row indicates a significant difference at p < 0.05. A–I A difference in upper case letters within a column indicates a significant difference at p < 0.05.
Table 4. Sucrose concentration (%), lactose concentration (%), fructose concentration (%), and lactic acid (%) of L. plantarum during 12-week storage at 4 °C grown in MRS broth.
SucroseLactoseFructoseLactic Acid
Week 0Week 12Week 0Week 12Week 0Week 12Week 0Week 12
NCAa 0.0 ± 0.0Aa 0.0 ± 0.0Aa 0.0 ± 0.0Aa 0.0 ± 0.0Aa 0.0 ± 0.0Aa 0.0 ± 0.0Aa 0.0 ± 0.0Aa 0.0 ± 0.0
3SCa 1.0 ± 0.0Bb 0.0 ± 0.0----Ca 4.3 ± 0.0Eb 10.8 ± 0.0
2L--Ba 1.4 ± 0.0Ab 0.1 ± 0.1--Aa 0.0 ± 0.0BCb 1.7 ± 0.0
3L--Da 2.5 ± 0.0Ab 0.2 ± 0.2--Ba 1.6 ± 0.1Db 4.7 ± 0.0
3I----Aa 0.0 ± 0.0Aa 0.0 ± 0.0Aa 0.0 ± 0.0BCb 1.7 ± 0.0
4I----Aa 0.0 ± 0.0Aa 0.1 ± 0.1Aa 0.0 ± 0.0Cb 2.4 ± 0.2
2FOS----Aa 0.0 ± 0.0Aa 0.1 ± 0.1Aa 0.0 ± 0.0Cb 2.7 ± 0.2
4FOS----Aa 0.1 ± 0.0Aa 0.2 ± 0.2Aa 0.0 ± 0.0Bb 1.3 ± 0.0
3S+4IDa 1.4 ± 0.0Bb 0.1 ± 0.1--BCa 0.2 ± 0.0Aa 0.3 ± 0.4Ca 4.9 ± 0.1Eb 10.8 ± 0.0
2L+3I--Ca 1.8 ± 0.0Ab 0.3 ± 0.0Ca 0.3 ± 0.1Aa 0.1 ± 0.0Aa 0.2 ± 0.1BCb 2.1 ± 0.0
3S+2FOSBa 0.5 ± 0.1Bb 0.1 ± 0.0--BCa 0.2 ± 0.0Aa 0.2 ± 0.2Da 6.6 ± 0.0Fb 12.5 ± 0.0
3L+4FOS--Ea 2.8 ± 0.0Bb 0.7 ± 0.1Da 0.4 ± 0.1Aa 0.1 ± 0.0Ba 1.3 ± 0.1Db 4.2 ± 0.1
Values are presented as means ± standard deviations (n = 3). A–F A difference in upper case letters within a column significant difference at p < 0.05. a,b A difference in lower case letters between week 0 and week 12 indicates significant difference at p < 0.05. NC: Negative control = no sugar and prebiotic. Positive controls: 3S = 3% sucrose, 2L = 2% lactose, 3L = 3% lactose, 3I = 3% inulin, 4I = 4% inulin, 2FOS = 2% FOS and 4FOS = 4% FOS.
Table 5. Auto-aggregation, hydrophobicity, and co-aggregation of L. plantarum with E. coli and E. faecalis in MRS broth during 12-week storage assay at 4 °C.
Auto-Aggregation (%)Hydrophobicity (%)Co-Aggregation (%) with E. coliCo-Aggregation (%) with E. faecalis
Week 0Week 12Week 0Week 12Week 0Week12Week 0Week 12
NCAa 46.8 ± 0.1Ab 0.0 ± 0.1Aa 52.6 ± 0.1Ab 0.5 ± 0.1Aa 11.6 ± 0.0Ab 0.3 ± 0.0Aa 16.1 ± 0.0Ab 0.8 ± 0.0
3SBa 59.4 ± 0.0Bb 66.2 ± 0.0Ba 57.7 ± 0.0Ab 39.6 ± 0.0Ca 34.0 ± 0.1Cb 47.4 ± 0.0Ba 27.3 ± 0.0Cb 54.0 ± 0.7
2LBa 52.3 ± 0.0Ab 57.0 ± 0.0Ca 68.4 ± 0.0Bb 51.0 ± 0.0Ba 17.4 ± 0.0Bb 34.9 ± 0.0Aa 17.8 ± 0.0Bb 34.6 ± 0.1
3LCa 63.1 ± 0.1Bb 67.2 ± 0.2Ca 69.3 ± 0.3Bb 54.0 ± 0.0Ba 17.6 ± 0.2Bb 38.0 ± 0.0Aa 17.9 ± 0.0Bb 34.6 ± 0.3
3ICa 64.3 ± 0.2Ba 63.7 ± 0.2Ca 69.5 ± 0.2Cb 60.0 ± 0.2Da 47.6 ± 0.2Cb 51.1 ± 0.0Ba 28.5 ± 0.0Cb 55.1 ± 0.3
4ICa 65.5 ± 0.1Bb 67.3 ± 0.2Da 74.5 ± 0.2Cb 60.6 ± 0.2Ea 52.8 ± 0.2CDb 57.6 ± 0.1Ba 28.7 ± 0.1Cb 55.3 ± 0.6
2FOSCa 67.0 ± 0.2Ba 67.9 ± 0.1Da 75.9 ± 0.2CDb 62.8 ± 0.2Ea 57.8 ± 0.2Db 61.8 ± 0.1BCa 29.6 ± 0.1Cb 58.6 ± 0.7
4FOSDa 87.4 ± 0.1Bb 69.4 ± 0.1Da 77.9 ± 0.3Db 68.4 ± 0.0Ea 57.9 ± 0.2Db 62.9 ± 0.0Ca 31.3 ± 0.0Db 60.7 ± 0.9
3S+4IDa 87.5 ± 0.1Cb 82.5 ± 0.2Fa 89.6 ± 0.1Eb 77.6 ± 0.1Ga 70.4 ± 0.0Eb 76.4 ± 0.0Ca 33.6 ± 0.0Db 62.5 ± 0.1
2L+3IDa 89.6 ± 0.1Cb 83.5 ± 0.0Fa 88.3 ± 0.2Eb 78.1 ± 0.1Fa 63.7 ± 0.2Gb 89.8 ± 0.0Ca 33.8 ± 0.0Db 64.3 ± 0.3
3S+2FOSEa 95.0 ± 0.0Cb 85.8 ± 0.0Fa 90.0 ± 0.0Fb 81.1 ± 0.0Ea 58.6 ± 0.0Eb 78.1 ± 0.0Da 38.7 ± 0.0Eb 68.1 ± 0.1
3L+4FOSEa 95.1 ± 0.1Cb 85.9 ± 0.1EFa 86.0 ± 0.1Fb 82.4 ± 0.1Fa 64.5 ± 0.1Fb 80.1 ± 0.0Ea 41.8 ± 0.1Eb 69.4 ± 0.1
Values are presented as means ± standard deviations (n = 3). A–F A difference in upper case letters within a column significant difference at p < 0.05. a,b A difference in lower case letters between week 0 and week 12 indicates significant difference at p < 0.05. NC: Negative control = no sugar and prebiotic. Positive controls: 3S = 3% sucrose, 2L = 2% lactose, 3L = 3% lactose, 3I = 3% inulin, 4I = 4% inulin, 2FOS = 2% FOS and 4FOS = 4% FOS.
Table 6. Bacterial survival rate (%) after gastrointestinal tolerance assay of L. plantarum during 12-week storage at 4°C grown in MRS broth.
Week 0Week 2Week 4Week 6Week 8Week 10Week 12
NCAc 65.0 ± 1.8Ab 55.3 ± 1.1Aa 53.7 ± 1.5Aa 52.0 ± 1.0Aa 51.3 ± 0.6Aa 51.0 ± 0.0Aa 51.0 ± 0.0
3SCbc 70.0 ± 1.0Db 67.2 ± 1.5Db 65.7 ± 1.2Db 65.2 ± 1.3Db 64.7 ± 1.5Da 62.7 ± 1.2Da 60.3 ± 0.6
2LBd 67.5 ± 0.1Cc 63.0 ± 1.7Bb 59.3 ± 1.2Bb 58.3 ± 1.2Db 58.0 ± 1.0Ca 56.0 ± 1.0Ba 55.3 ± 0.6
3LBd 68.7 ± 0.5Dd 67.6 ± 1.5Cc 62.0 ± 1.0Cb 60.7 ± 1.2Dab 59.7 ± 1.2Ca 58.3 ± 1.2Ca 57.3 ± 0.6
3IAd 65.5 ± 1.5Bc 58.7 ± 1.1Bc 57.3 ± 0.6Bb 55.7 ± 1.5Ba 53.3 ± 1.5Ba 53.0 ± 1.0Aa 52.7 ± 0.6
4IDc 72.7 ± 1.2Ec 71.3 ± 1.5Dbc 69.7 ± 1.5Eb 68.3 ± 1.3Db 66.7 ± 1.5Da 63.8 ± 2.0Da 61.9 ± 0.3
2FOSEd 75.7 ± 0.6Fd 75.0 ± 1.7Ed 74.0 ± 2.0Fc 72.7 ± 1.1Ec 72.3 ± 1.3Eb 69.3 ± 0.6Ea 63.0 ± 1.4
4FOSFd 79.7 ± 1.5Gcd 78.3 ± 0.6Fcd 78.0 ± 1.0Gc 77.3 ± 1.2Fc 77.0 ± 1.0Fb 72.7 ± 1.2Fa 66.6 ± 0.5
3S+4IHe 91.5 ± 1.1Id 86.0 ± 1.6Gc 83.7 ± 0.7Hc 83.7 ± 0.8Gb 80.7 ± 1.5Gb 79.0 ± 1.0Ga 74.7 ± 0.6
2L+3IHd 90.8 ± 1.1Hbc 84.3 ± 1.2Gbc 84.4 ± 1.0Hb 83.0 ± 1.0Gb 82.7 ± 0.6Hb 83.7 ± 0.9Ha 76.7 ± 0.6
3S+2FOSId 93.7 ± 0.1Ic 88.0 ± 1.7Hbc 86.7 ± 0.6Ibc 86.3 ± 0.6Hb 85.3 ± 1.2Ibc 87.7 ± 0.6Ia 80.3 ± 0.6
3L+4FOSGc 89.0 ± 0.0Ic 87.7 ± 1.2Ic 88.7 ± 0.6Ic 88.7 ± 0.6Ic 88.7 ± 0.6Ib 86.0 ± 1.5Ja 82.6 ± 0.8
Values are presented as means ± standard deviations (n = 3). a–c A difference in lower case letters within a row indicates significant difference at p < 0.05. A–J A difference in upper case letters within a column indicates significant difference at p < 0.05. NC: Negative control = no sugar and prebiotic. Positive controls: 3S = 3% sucrose, 2L = 2% lactose, 3L = 3% lactose, 3I = 3% inulin, 4I = 4% inulin, 2FOS = 2% FOS and 4FOS = 4% FOS.
Publisher’s Note: MDPI stays neutral with regard to jurisdictional claims in published maps and institutional affiliations.

