Article

Fermented Myriophyllum aquaticum and Lactobacillus plantarum Affect the Distribution of Intestinal Microbial Communities and Metabolic Profile in Mice

1
Beijing Key Laboratory of Bioactive Substances and Functional Foods, Department of Food Science, College of Biochemical Engineering, Beijing Union University, Beijing 100023, China
2
Internal Trade Food Science and Technology (Beijing) Co., Ltd., Beijing 102209, China
3
Department of Physics and Astronomy, University of Manitoba, Winnipeg, MB R3T 2N2, Canada
4
Research Center for Eco-Environmental Sciences, Chinese Academy of Sciences, Beijing 100085, China
5
College of Animal Science and Technology, China Agricultural University, Beijing 100193, China
*
Author to whom correspondence should be addressed.
Submission received: 10 March 2022 / Revised: 22 April 2022 / Accepted: 26 April 2022 / Published: 5 May 2022
(This article belongs to the Special Issue Applied Microorganisms and Industrial/Food Enzymes)

Abstract

:
This research explores the effects of fermented Myriophyllum aquaticum (F) and Lactobacillus plantarum BW2013 (G) as new feed additives on the gut microbiota composition and metabolic profile of mice. Crude protein (p = 0.045), lipid (p = 0.000), and ash (p = 0.006) contents in Myriophyllum aquaticum (N) were improved, whereas raw fiber (p = 0.031) content was decreased after solid-state fermentation by G. Mice were fed with no additive control (CK), 10%N (N), 10%N + G (NG), 10%F (F), and 10%F + G (FG). High-throughput sequencing results showed that, compared with the CK group, Parabacteroides goldsteinii was increased in treatment groups and that Lactobacillus delbrueckii, Bacteroides vulgatus, and Bacteroides coprocola were increased in the F and FG groups. Bacteroides vulgatus and Bacteroides coprocola were increased in the F group compared with the N group. Metabolomic results showed that vitamin A, myricetin, gallic acid, and luteolin were increased in the F group compared with the N group. Reduction in LPG 18:1 concentration in the N and F groups could be attenuated or even abolished by supplementation with G. Furthermore, 9-oxo-ODA was upregulated in the FG group compared with the F group. Collectively, N, F, and G have beneficial effects on gut microbiota and metabolic profile in mice, especially intake of FG.

1. Introduction

Myriophyllum aquaticum is a heterophyllic amphibious aquatic plant species commonly found in streams, canals, and freshwater lakes [1]. M. aquaticum has strong reproductive ability and can be cultivated in most natural water bodies, particularly those enriched with nutrients commonly found in wastewater from pigs [2]. It has been shown that M. aquaticum can be used to treat wastewaters high in NH4+-N by absorbing nutrients [3]. However, M. aquaticum has a prominent population advantage when it is suitable for water habitat conditions, which is manifested in efficient reproduction. It can pose a threat to native aquatic species diversity and fauna composition by passing from non-invaded to invaded habitats [4]. Administration of this species can be quite expensive, and M. aquaticum can produce new plants by reproducing in its own waste [5]. Fortunately, M. aquaticum contains a high content of crude protein and crude fiber and is rich in essential amino acids and minerals [3]. Therefore, it can be used as an animal feed material or filler, which can not only effectively relieve the shortage of feed resources but also reduce its threat to native aquatic biodiversity.
Probiotics are active microorganisms that provide a benefit to their host by changing the composition of a certain part of gut microbiota [6]. Liu et al. reported that supplementation of Lactobacillus plantarum Y44 may have potential for alleviating lipid metabolism disorders and intestinal inflammation in association with modulating gut microbiota [7]. Furthermore, the nutritional quality of feed fermentation can be improved by using probiotics such as Lactobacillus [8,9]. L. plantarum is frequently used in the food and feed industries as an inoculant, which positively influences different quality parameters, such as pH value, organic acid, dry matter, and protein content in feed [10,11]. In addition, research has shown that food and animal feed fermented by probiotics have beneficial effects on the body, including stabilizing intestinal barrier function [12] as well as maintaining gut microbial balance [13]. Zhong et al. reported that probiotic-fermented blueberry juice may have anti-obesity and anti-hyperglycemia benefits by modulating the gut microbiota [14]. Intakes of kimchi fermented by L. plantarum PNU was shown to regulate metabolic parameters and colon health [15]. Therefore, fermentation by L. plantarum is not only a sustainable method for preserving food and feed but also a biotechnology that is increasingly used for improving the nutritional content of food and feed. Currently, M. aquaticum, a nutrient-rich plant with significant biomass, is used as an animal feed crude material [16]. However, low-cost roughage cannot be entirely utilized by animals [17], and the palatable flavours and potential health-promoting properties of plant-based fermented food and feed are increasing in popularity [18]. In this study, the L. plantarum BW2013 strain, extracted from fermented Chinese cabbage, was used as a starter culture for M. aquaticum solid-state fermentation in this study.
Analysing metabolites in a biological system is possible using metabolomics, a new method that delivers detailed quantitative profiles of metabolites [19]. Additionally, high-throughput sequencing can be used to determine changes in microbial community composition within the intestines. The application of these two methods can effectively evaluate the impact of feed on animal intestines. A study showed the effects of polysaccharides from fermented Momordica charantia L. with Lactobacillus plantarum NCU116 on gut microbiota and fecal metabolic profile in obese rats using the above two methods [20]. Being a novel candidate feed, the effects of fermented M. aquaticum and L. plantarum on the gut microbiota and metabolites of mice have not been fully elucidated. In this study, we determined the effect of M. aquaticum and L. plantarum BW2013, as a dietary supplement, on the distribution of gut microbiota and metabolites of mice.

2. Materials and Methods

2.1. Bacterial Cultures

The strain L. plantarum BW2013 (CGMCC NO.9462) used for solid-state fermentation was isolated from fermented Chinese cabbage. The strains were grown under anaerobic conditions in de Man–Rogosa–Sharpe (MRS, Beijing Land Bridge Technology Co., LTD., China) medium at 37 °C. The bacteria were incubated and grown to the maximum concentration in shaking flasks. For L. plantarum BW2013 strain cultures, a centrifuge with 8000× g was used for 15 min, followed by two phosphate-buffered saline (PBS) washings, and a suspension of 1 × 10⁸ CFU/mL in PBS.

2.2. Solid-State Fermentation and Conditions Optimization

The M. aquaticum used in this study was supplied by the Institute of Subtropical Agriculture, Chinese Academy of Sciences. The washed M. aquaticum was dried to adjust its moisture content to 65%, and then cut into 1.0 ± 0.5 cm sections. The count of L. plantarum BW2013 inoculated in samples was about 1.0 × 10⁸ CFU per g. The samples were then mixed with 6% (w/w) sucrose and anaerobically incubated at 30 °C and 35 °C. The pH value, dry matter, raw protein, and organic acid (lactic acid, acetic acid, propionic acid, and butyric acid) contents were measured in samples from 0–10 days (0 d, 1 d, 3 d, 5 d, 7 d, and 10 d). The contents of protein, raw fat, crude fiber, ash, phosphorus, and calcium were determined after the fresh M. aquaticum and fermented production were dried.
The pH value was determined using a pH meter (Sanxin, Shanghai, China). The dry matter was determined by oven drying at 105 °C for 16 h. The organic acids were determined in a L-3000 HPLC (RIGOL Co., LTD., Beijing, China) with an Shodex RSpak KC-811 column (8.0 mmI.D. × 300 mm) and a UV detector, using 210 nm as the determining wavelength. Separation was conducted using a gradient elution with two mobile phases at a flow rate of 1.0 mL/min at 50 °C. Samples were injected at a volume of 5.0 μL after filtration. Mobile phase A was 3 mM HClO4 and mobile phase B was methanol. Ammonia nitrogen (NH3-N) was determined by an indophenol blue method using a continuous flow chemistry analyzer [21].
After digestion with concentrated sulfuric acid, the total protein content of M. aquaticum was determined by the Kjeldahl procedure [22]. The Soxhlet extraction was used for raw fat extraction from samples [23]. Crude fiber is the loss on ignition of the dried residue remaining after digestion of the sample with 1.25% H2SO4 and 1.25% NaOH solutions under specific conditions [24]. The dried M. aquaticum were mineralized at 550 ± 25 °C for about 30 min and then weighed to determine the ash content. The phosphorus content of the ash was determined using molybdenum blue spectrophotometry [25]. To determine the calcium content, the ash was dissolved in HCl (50%) plus HNO3 (50%), filtered, and filled to volume (25 mL) with distilled water. Extracts were analysed by atomic absorption spectroscopy using an Inductively Coupled Plasma Optical Emission Spectrometer (ICP-OES) [26].

2.3. Animal Experiment

Male ICR mice (4-week-old) were purchased from the Beijing Vital River Laboratory Animal Technology Co., Ltd. (Beijing, China). All mice were kept in a specific pathogen-free (SPF) facility in the National Health Food Function Testing Center of Beijing Union University and were allowed free access to food and water under a 12 h light cycle. After a 7-day adaptation period, sixty ICR mice were randomly assigned to 5 groups (12 for each group): the CK group (normal control group), the N group (10% M. aquaticum), the NG group (10% M. aquaticum + 2 × 10⁹ CFU/mL/d L. plantarum BW2013), the F group (10% M. aquaticum fermentation products), and the FG group (10% M. aquaticum fermentation products + 2 × 10⁹ CFU/mL/d L. plantarum BW2013). M. aquaticum and its fermentation products were added to the normal mouse feed at 10% addition. Mice in the FG and NG groups were intragastrically administered the same L. plantarum BW2013 during the whole experimental period. The weights of mice were recorded every week. All groups were treated for 5 weeks, and blood was collected from the eyeballs before slaughter. Centrifugation at 3000× g for 15 min collected a serum sample for measurement of alkaline phosphatase (ALP), aspartate aminotransferase (AST), creatinine (CRE), urea (UREA), cholesterol (CHO), and blood glucose (GLU) using an automatic biochemical analyzer (ACA, Hitachi Co., Ltd., Tokyo, Japan).

2.4. 16S rDNA Sequencing

The fecal DNA was extracted using the CTAB/SDS method. Concentration and integrity of extracted DNA were measured using agarose gel electrophoresis. Analysis of the data and sequences was performed by Beijing Novogene (Beijing, China). The 16S rRNA genes of distinct regions (16S V4) were amplified with specific primers 515F (5′-GTGCCAGCMGCCGCGGTAA-3′) and 806R (5′-GGACTACHVGGGTWTCTAAT-3′). The purified amplicons were pooled in equidensity ratios. Using the TruSeq® DNA PCR-Free Sample Preparation Kit (Illumina, San Diego, CA, USA), sequencing libraries were prepared and index codes were added. Quality assessment of the library was conducted using a Qubit@ 2.0 Fluorometer (Thermo Fisher Scientific, Waltham, MA, USA) and an Agilent Bioanalyzer 2100 system. Paired-end sequencing of the library was performed on the Illumina NovaSeq platform.
Uparse software (Uparse v7.0.1001, http://drive5.com/uparse/ (accessed on 19 January 2020)) was used to analyze sequences [27]. OTUs (Operational Taxonomic Units) cluster with 97% identity. The taxonomy of representative sequences was determined based on bacterial SILVA data sets [28]. QIIME (Version 1.7.0) and R software (Version 2.15.3) were used to calculate the alpha diversities (the indicators ACE and Shannon represent richness and diversity of intestinal bacterial, respectively). Based on weighted UniFrac distance metrics analysis, non-metric multi-dimensional scaling (NMDS) was performed to distinguish the individuals of the five groups. Weighted UniFrac were calculated by QIIME software (Version 1.9.1). Non-metric multi-dimensional scaling (NMDS) analysis was performed by the vegan package in R software (Version 2.15.3). Permutation tests were completed at each classification level (Phylum, Class, Order, Family, Genus, Species) using the R software (Version 1.9.1) to test differences in the gut microbiota of the mice and to obtain the p-value.

2.5. Metabolomics

One-hundred milligrams of liquid nitrogen-ground samples were placed in an Eppendorf tube. The homogenate was resuspended with 500 μL of prechilled 80% methanol and 0.1% formic acid by vortexing and shaking. The samples were incubated in an ice bath for 5 min and then were centrifuged at 15,000× g at a temperature of 4 °C for 5 min. The amount of supernatant was diluted with LC–MS grade water to a methanol concentration of 53%. Afterwards, the samples were transferred to a new Eppendorf tube and centrifuged for 10 min at 15,000× g, 4 °C. The supernatant was collected and injected into LC–MS for analysis. LC–MS/MS analyses were performed using a Vanquish UHPLC system (Thermo Fisher Scientific, Waltham, MA, USA) coupled with an Orbitrap Q Exactive series mass spectrometer (Thermo Fisher Scientific). A 16 min linear gradient flow rate of 0.2 mL/min was used to inject samples into a Hyperil Gold column (100 × 2.1 mm, 1.9 μm). Eluents A (0.1% FA in water) and B (methanol) were used for the positive polarity mode. Eluent A (5 mM ammonium acetate, pH 9.0) and eluent B (methanol) were used for the negative polarity mode. Solvent gradient: 2% B, 1.5 min; 2–100% B, 14.0 min; 100% B, 14.1 min; 100%–2% B, 14.1 min; 2% B, 17 min. The Q Exactive series mass spectrometer operated with 3.2 kV spray voltage, 320 °C capillary temperature, 35 arb sheath gas flow rate, and 10 arb aux gas flow rate. Analysis of the data followed the same approach as Cao et al. [29]. The metabolites with VIP > 1 and a p-value < 0.05 and fold change (FC) ≥ 1.5 or FC ≤ 0.6 were differentially expressed.

2.6. KEGG Pathways

KEGG database was used to study the functions of these metabolites and metabolic pathways. When the p-value of a metabolic pathway was less than 0.05, the metabolic pathway was considered to enrich differential metabolites with statistical significance.

2.7. Statistical Analysis

Statistical analyses were performed using SPSS software (Version 26). The results for the analysis of variance (ANOVA) were considered significant with p < 0.05.

3. Results and Discussion

3.1. Analysis of Solid-State Fermentation of M. aquaticum

The fermentation and nutritional quality of M. aquaticum were analysed. After fermentation, the stem and leaf structure of the fermented M. aquaticum in each group was complete; the colour was yellow-green, there was no mildew, no stickiness, a good texture, and an obvious sour fragrance. The three most essential indices of fermentation quality evaluation are pH, lactic acid content, and the ratio of ammonia nitrogen/total nitrogen (NH3-N/N) [10]. The changes in pH value, dry matter, crude protein, organic acid content, and NH3-N/N over the fermentation period are shown in Table 1. On the fifth day at 30 °C, the pH value (4.11) was lowest, so sustained fermentation by bacteria was achieved. As soon as the pH value exceeded 5.0, fermentation was considered to have failed [10]. The concentration of organic acid increased during fermentation. It can be concluded that the bacterium grew well on M. aquaticum and decreased the pH by secreting these types of organic acids in M. aquaticum. Protein from the fermentation substrate is converted into NH3-N by microorganisms, thus the value of NH3-N reflects the amount of protein decomposition during fermentation. Generally, a high-quality fermented feed should have a ratio of ammonia nitrogen (NH3-N) to total nitrogen (N) of less than 7 [10]. The contents of dry matter and crude protein were directly related to the nutritional quality of the fermented feed. Fermented feeds that had high dry matter and crude protein contents had better nutritional quality. As a result of the increased dry matter and crude protein, fewer nutrients were lost during fermentation. The higher dry matter contents were observed on the first day at 35 °C and the fifth day at 30 °C. The highest crude protein contents were observed on the fifth and seventh days at 30 °C. Complicated assessments involving multiple indices and different donations were generally processed by a weighted mean. The assessment score was calculated by the weighted mean [30]. Based on the highest score, the optimal fermentation conditions were as follows: fermentation at 30 °C for 5 days.
This study detected the major constituents and the mineral element (phosphorus and calcium) contents of M. aquaticum (fermented and non-fermented) (Table 2). A significantly higher proportion of crude proteins (p = 0.045), lipids (p = 0.000), and ash (p = 0.006) were found in fermented M. aquaticum than in non-fermented M. aquaticum. The raw fiber (p = 0.031) content dropped after fermentation from 13.20% to 11.20% (w/w). There is a possibility that fiber serves as a nutrient source for microbes. Raw fiber is associated with digestibility and feed intake, and reduction in raw fiber content could promote the feed intake of animals [11]. These results indicated that fermentation appears to have the ability to alter the nutritional composition of M. aquaticum.

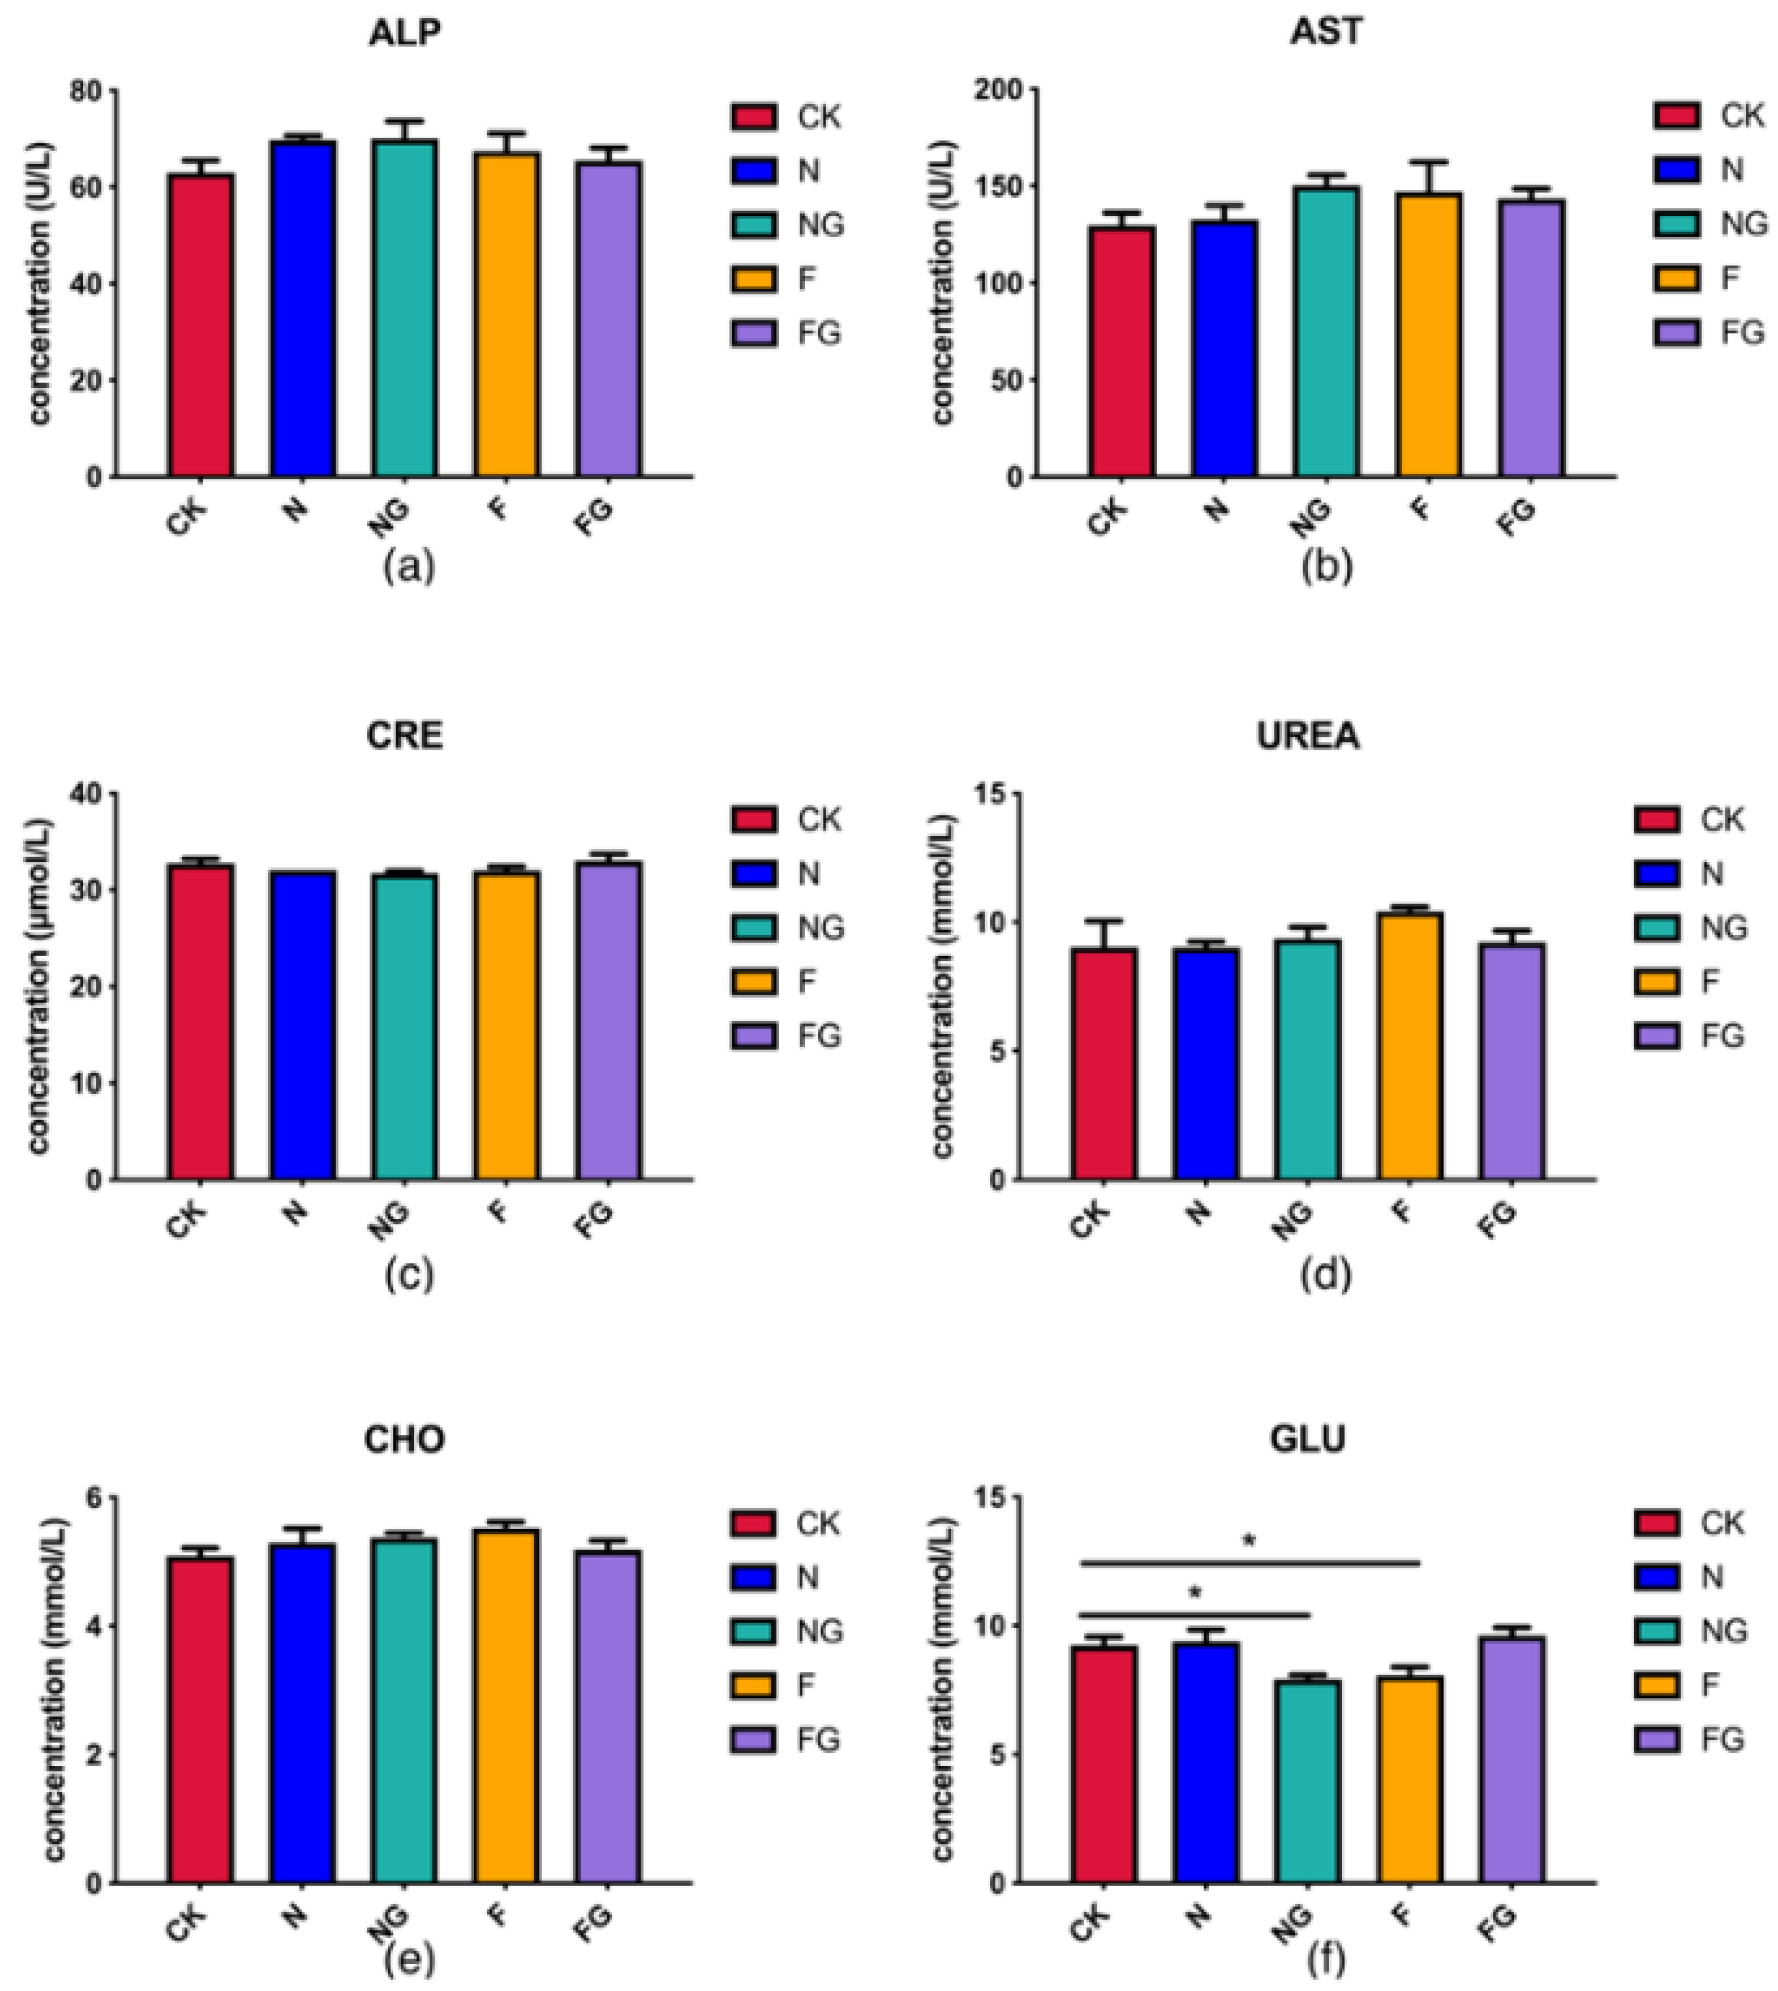
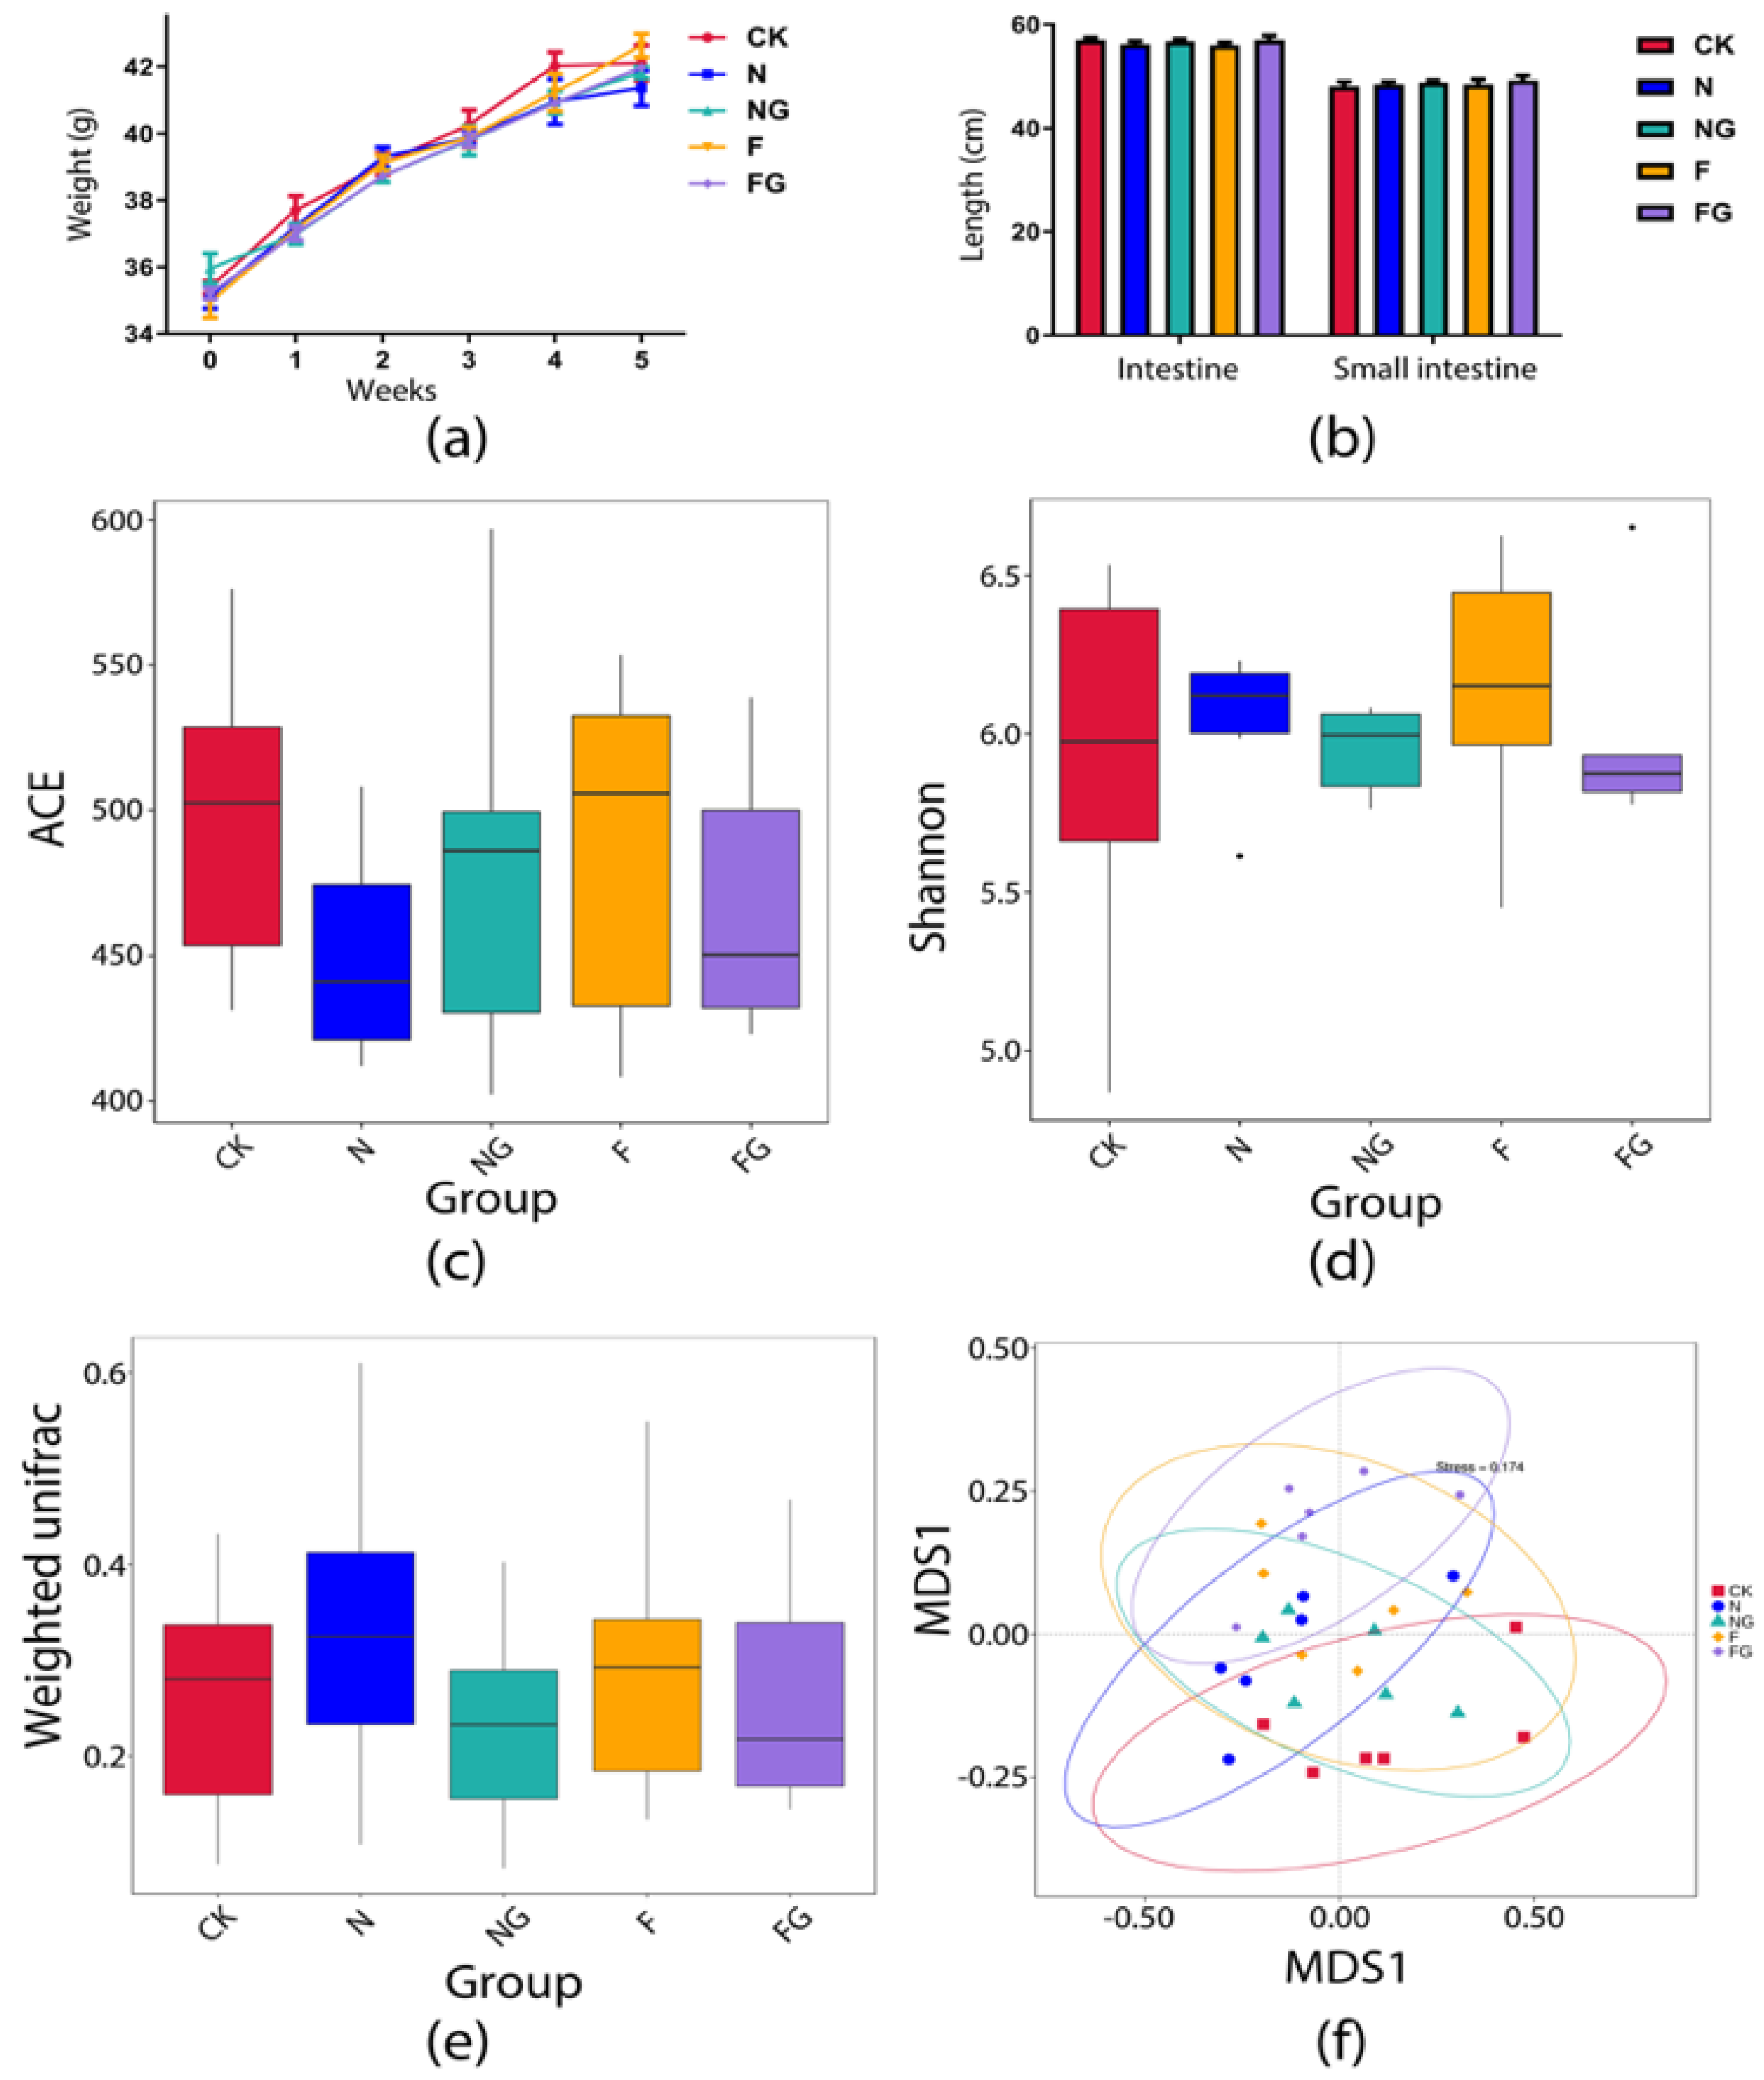
3.2. Effects of Dietary Intervention on Serum Markers, Body Weight (BW), and Intestinal Length

Alkaline phosphatase (ALP) and aspartate aminotransferase (AST) were analysed to check for possible effects of the diets and/or probiotic supplementation on liver function. Meanwhile, creatinine (CRE) and urea (UREA) are related to kidney function. No significant differences were detected in the levels of AST, ALP, UREA, CRE, and cholesterol (CHO) among all groups. However, blood glucose (GLU) was significantly reduced in the NG and F groups compared with the CK group (Figure 1). BW of all experimental mice can give an overview of their overall health and provide a rough description of their physical condition. During the first 4 weeks of the study, all mice continued to gain weight. In the fifth week, BW was increased markedly in the F group compared with the N group (Figure 2a). The intestinal length of the mice was analysed to check for possible effects of the dietary interventions on the digestion and absorption capacity of the intestines. The results showed that the small intestine length of the mice increased slightly in the NG and FG groups compared with the CK group (Figure 2b). Therefore, it is possible to replace part of the mice feed with M. aquaticum and its fermentation products.

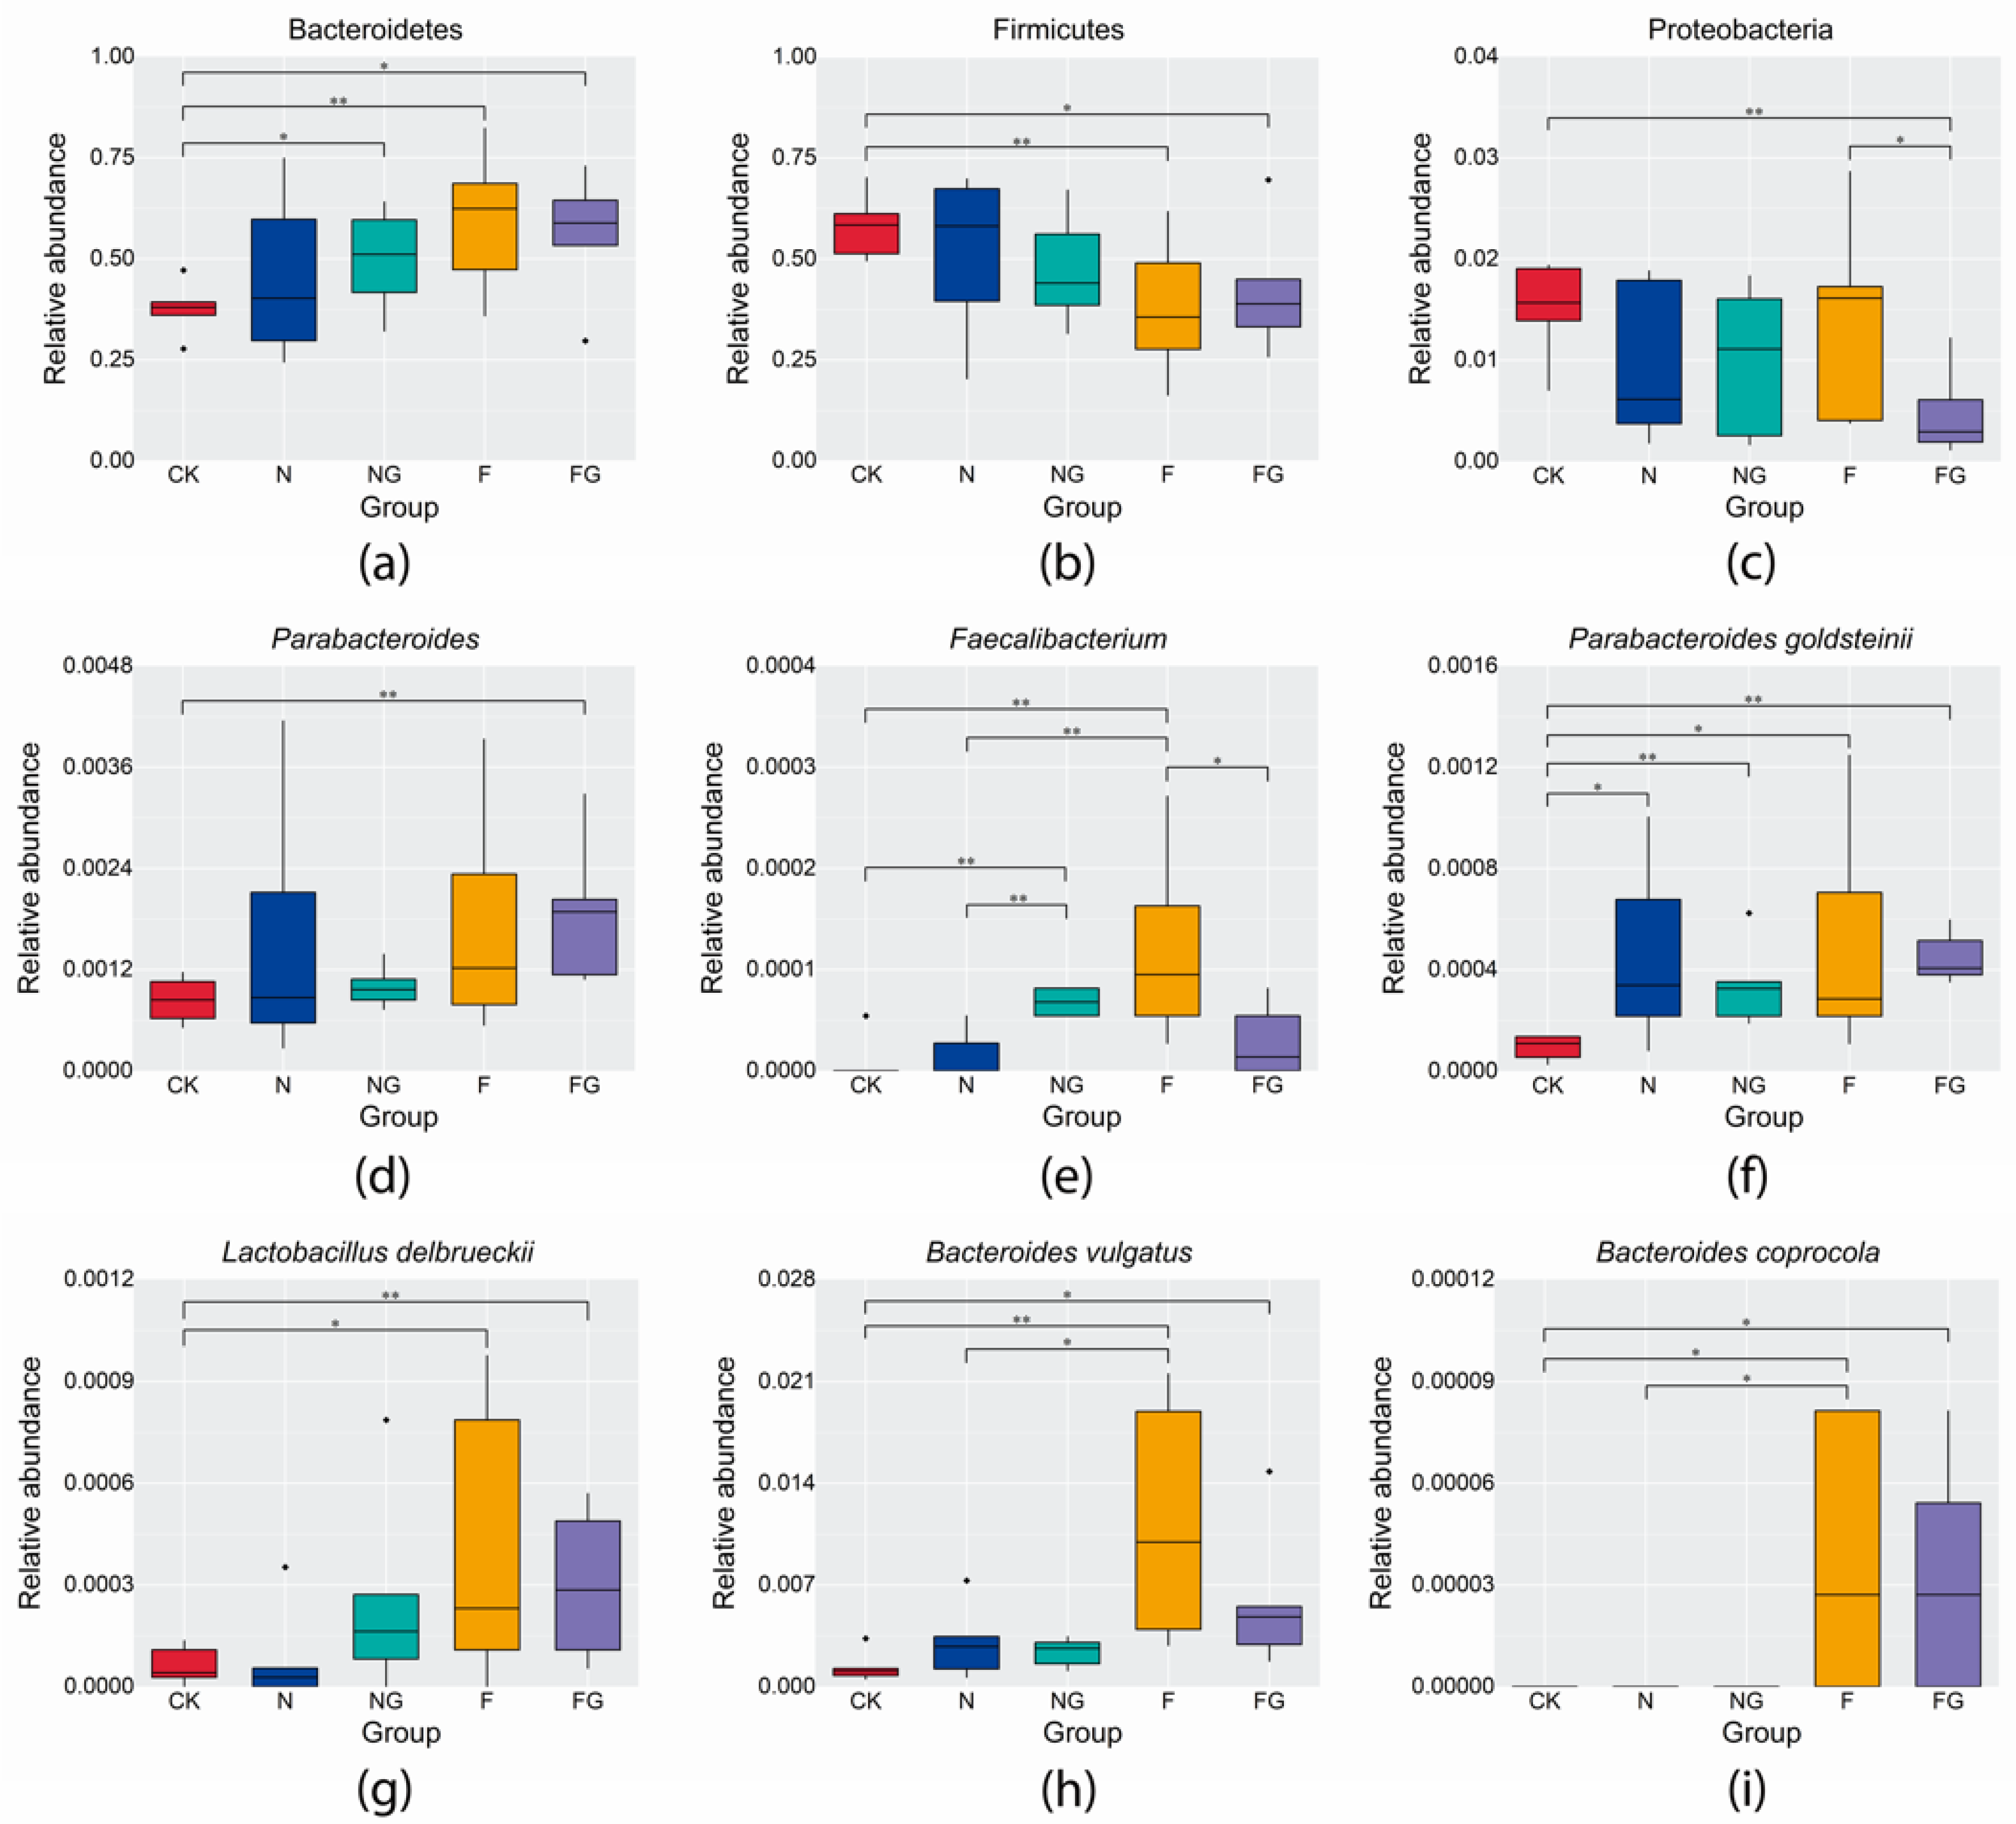
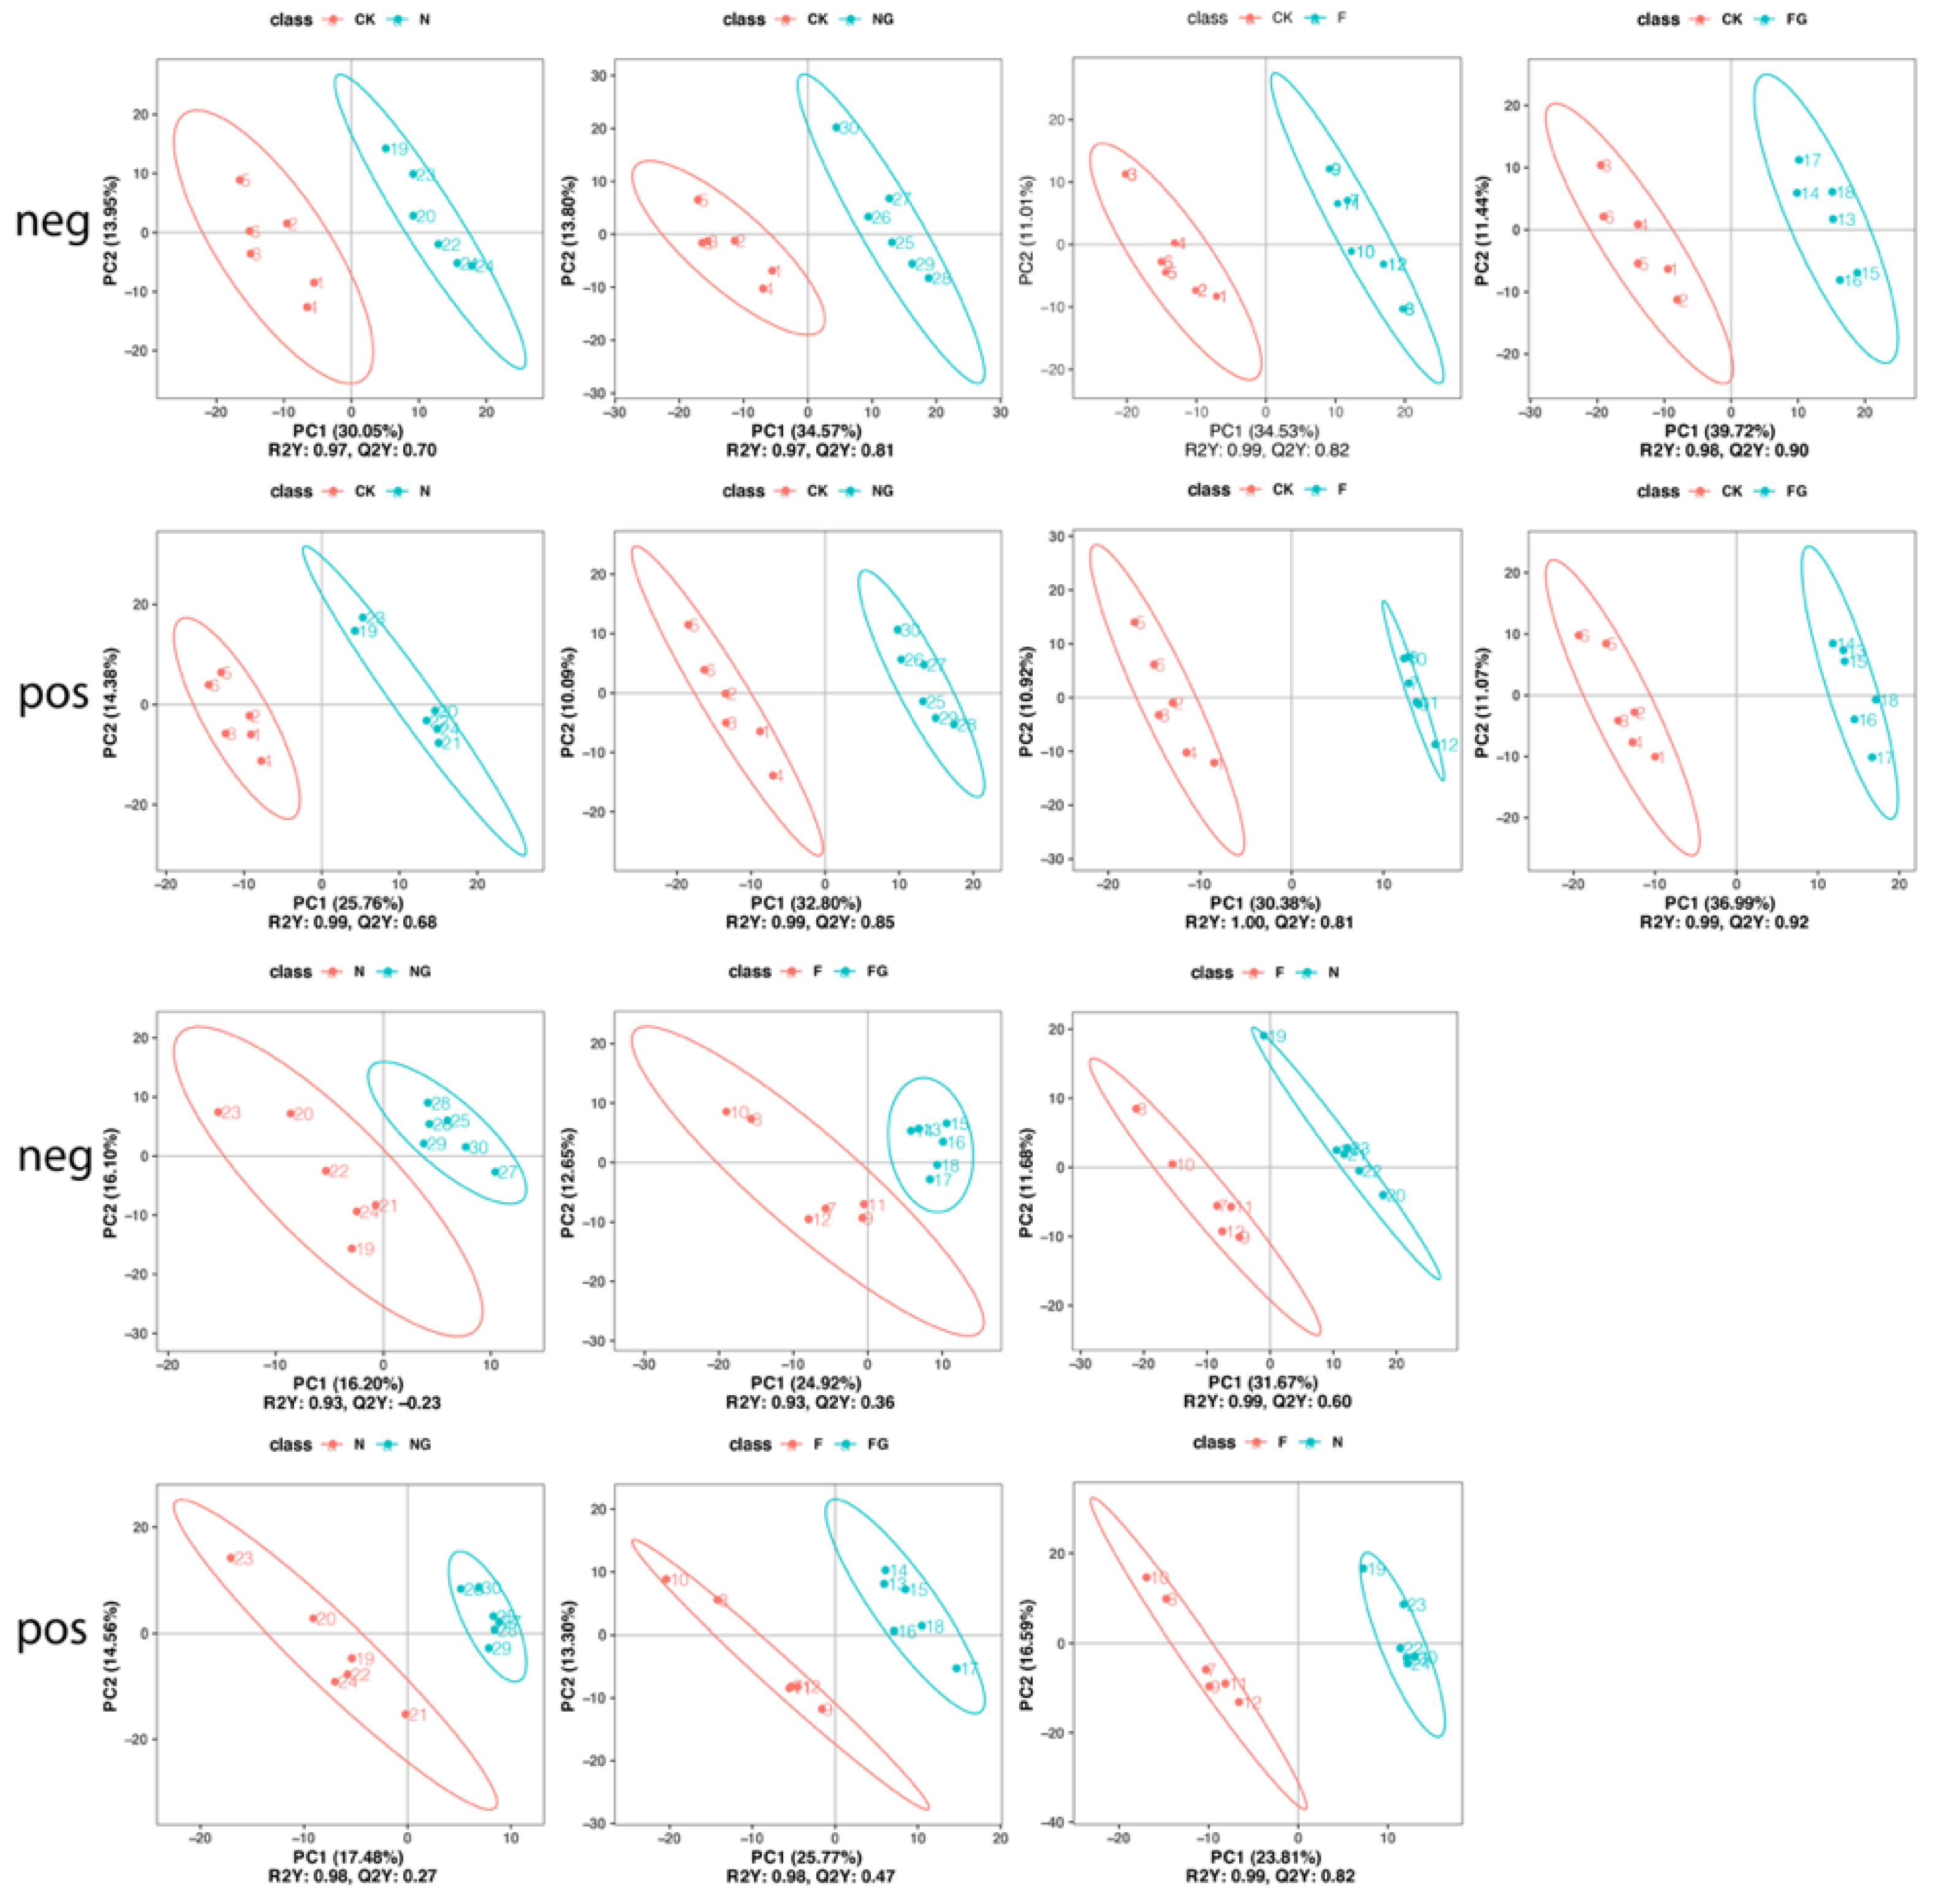
3.3. Effects of Dietary Intervention on Gut Microbiota in Mice

High-throughput sequencing analysis was performed to investigate the effect of M. aquaticum and L. plantarum BW2013 supplementation on gut microbiota composition in mice. α-diversity was measured using two metrics: the ACE index (Figure 2c) and the Shannon index (Figure 2d), which reflect community richness and species diversity, respectively, did not significantly change among the five groups. A beta diversity analysis of the gut microbiota discovered no significant changes among the five groups at OTU levels (Figure 2e). The NMDS plot of beta diversity showed clear separation of the CK and FG groups of mice based on their fecal microbiota (Figure 2f). Furthermore, the potential differences in the groups at week 5 were investigated through a MetaStat analysis. At the phylum level (Figure 3a–c), the relative abundance of Bacteroidetes was significantly increased in the NG, F, and FG groups (p = 0.023 for the NG group, p = 0.006 for the F group, and p = 0.011 for the FG group), whereas the relative abundance of Firmicutes was significantly decreased in the F and FG groups (p = 0.008 for the F group and p = 0.026 for the FG group) compared with the CK group. Meanwhile, Proteobacteria was significantly reduced in the FG group compared with the CK and F groups (p = 0.001 for the CK group and p = 0.035 for the F group). At the genus level (Figure 3d,e), the relative abundance of Faecalibacterium was significantly increased in the NG and F groups (p = 0.023 for the NG group and p = 0.006 for the F group) compared with the CK group, while the relative abundance of Parabacteroides was significantly increased in the FG group relative to the CK group. The relative abundance of Faecalibacterium was significantly increased in the NG and F groups compared with the N group (p < 0.001 for the NG group and p = 0.09 for the F group). However, the relative abundance of Faecalibacterium was reduced in the FG group compared with the F group (p = 0.023). At the species level (Figure 3f–i), the relative abundance of Parabacteroides goldsteinii was significantly increased in the N, NG, F, and FG groups when compared with the CK group (p = 0.015 for the N group, p = 0.002 for the NG group, p = 0.032 for the F group, and p < 0.001 for the FG group). The relative abundance of Lactobacillus delbrueckii was significantly increased in the F and FG groups when compared with the CK group (p = 0.044 for the F group and p = 0.006 for the FG group). The relative abundance of Bacteroides vulgatus and Bacteroides coprocola was significantly increased in the F (p = 0.004 for B. vulgatus and p = 0.020 for B. coprocola) and FG (p = 0.021 for B. vulgatus and p = 0.031 for B. coprocola) groups when compared with the CK group. In addition, compared with the N group, the relative abundances of B. vulgatus (p = 0.015) and B. coprocola (p = 0.020) were significantly increased in the F group.
The composition of gut microbiota in mice was improved after the treatment with M. aquaticum and L. plantarum BW2013 for 5 weeks. Firmicutes and Bacteroidetes were two dominant bacterial phyla which represented more than 90% of the total gut microbiome. Proteobacteria is a group of bacteria causing chronic colitis that are reported to have a low relative abundance in healthy individuals [31]. Faecalibacterium is a functionally important genus containing anti-inflammatory bacteria [32]. Bacteroides, Parabacteroides, and Faecalibacterium were the main genera responsible for donor engraftment in studies on fecal microbiota transplantation for Clostridium difficile infection [33]. P. goldsteinii is a novel probiotic bacterium with the potential to treat obesity as well as metabolic syndrome [34]. Probiotic L. delbrueckii could efficiently hydrolyze casein and modulate the intestinal immune system [35,36]. Moreover, treatment with live B. vulgatus and B. dorei may help prevent coronary artery disease by preventing microbial lipopolysaccharide synthesis [37]. It is believed that diet has an important impact on gut microbiota. Our results showed that different kinds and amounts of components in feed may affect gut microbiota differently. There have been multiple studies exploring the effects of different carbohydrate sources, especially fiber, on gut microbiota [38]. A higher abundance of Bacteroidetes and a lower abundance of Firmicutes were associated with a positive effect of fiber derived from apple in intestinal microbiota in obese rats [39]. Compared with the CK group, the relative abundances of Bacteroidetes, Faecalibacterium, L. delbrueckii, B. vulgatus, and B.coprocola in the F group increased, whereas a reduction in the relative abundance of Firmicutes was found in this study. In addition, P. goldsteinii was significantly increased in the N and F groups compared with the CK group. These results may be due to M. aquaticum and its fermented production, which contains a higher fiber content. Similarly, intake of kimchi increased the abundance of Faecalibacterium [15]. Bacteroides species could break down food to produce bioactive compounds and energy [40]. B. coprocola produces extracellular enzymes to help its host break down some polysaccharides in plants, including cellulose and hemicellulose [41]. We found that the relative abundances of Faecalibacterium, B. vulgatus, and B. coprocola were increased in the F group compared with the N group. Thus, L. plantarum BW2013 fermentation may help M. aquaticum in regulating the gut environment. A higher abundance of Faecalibacterium was associated with a strengthening of epithelial defense functions among piglets supplemented with L. plantarum ZLP001 [42]. The NG group had a higher level of Faecalibacterium than the N group. In contrast, the relative abundance of Faecalibacterium was higher in the F group compared to the FG group. Thus, the synergy effects of M. aquaticum and L. plantarum BW2013 should be explored. In contrast to the CK group, the relative abundances of Bacteroidetes, Faecalibacterium, P. goldsteinii, L. delbrueckii, B. vulgatus, and B. coprocola were increased, while the relative abundance of Firmicutes was decreased in the NG group. Meanwhile, the relative abundances of Bacteroidetes, Parabacteroides, P. goldsteinii, L. delbrueckii, B. vulgatus, and B. coprocola were increased, whereas the relative abundances of Firmicutes and Proteobacteria were decreased in the FG group. It is worth noting that the relative abundance of P. goldsteinii was increased in all treatment groups compared with the CK group. These results indicated that M. aquaticum, as a feed additive, has beneficial effects on gut microbiota in mice, especially intakes of fermented M. aquaticum and L. plantarum BW2013.

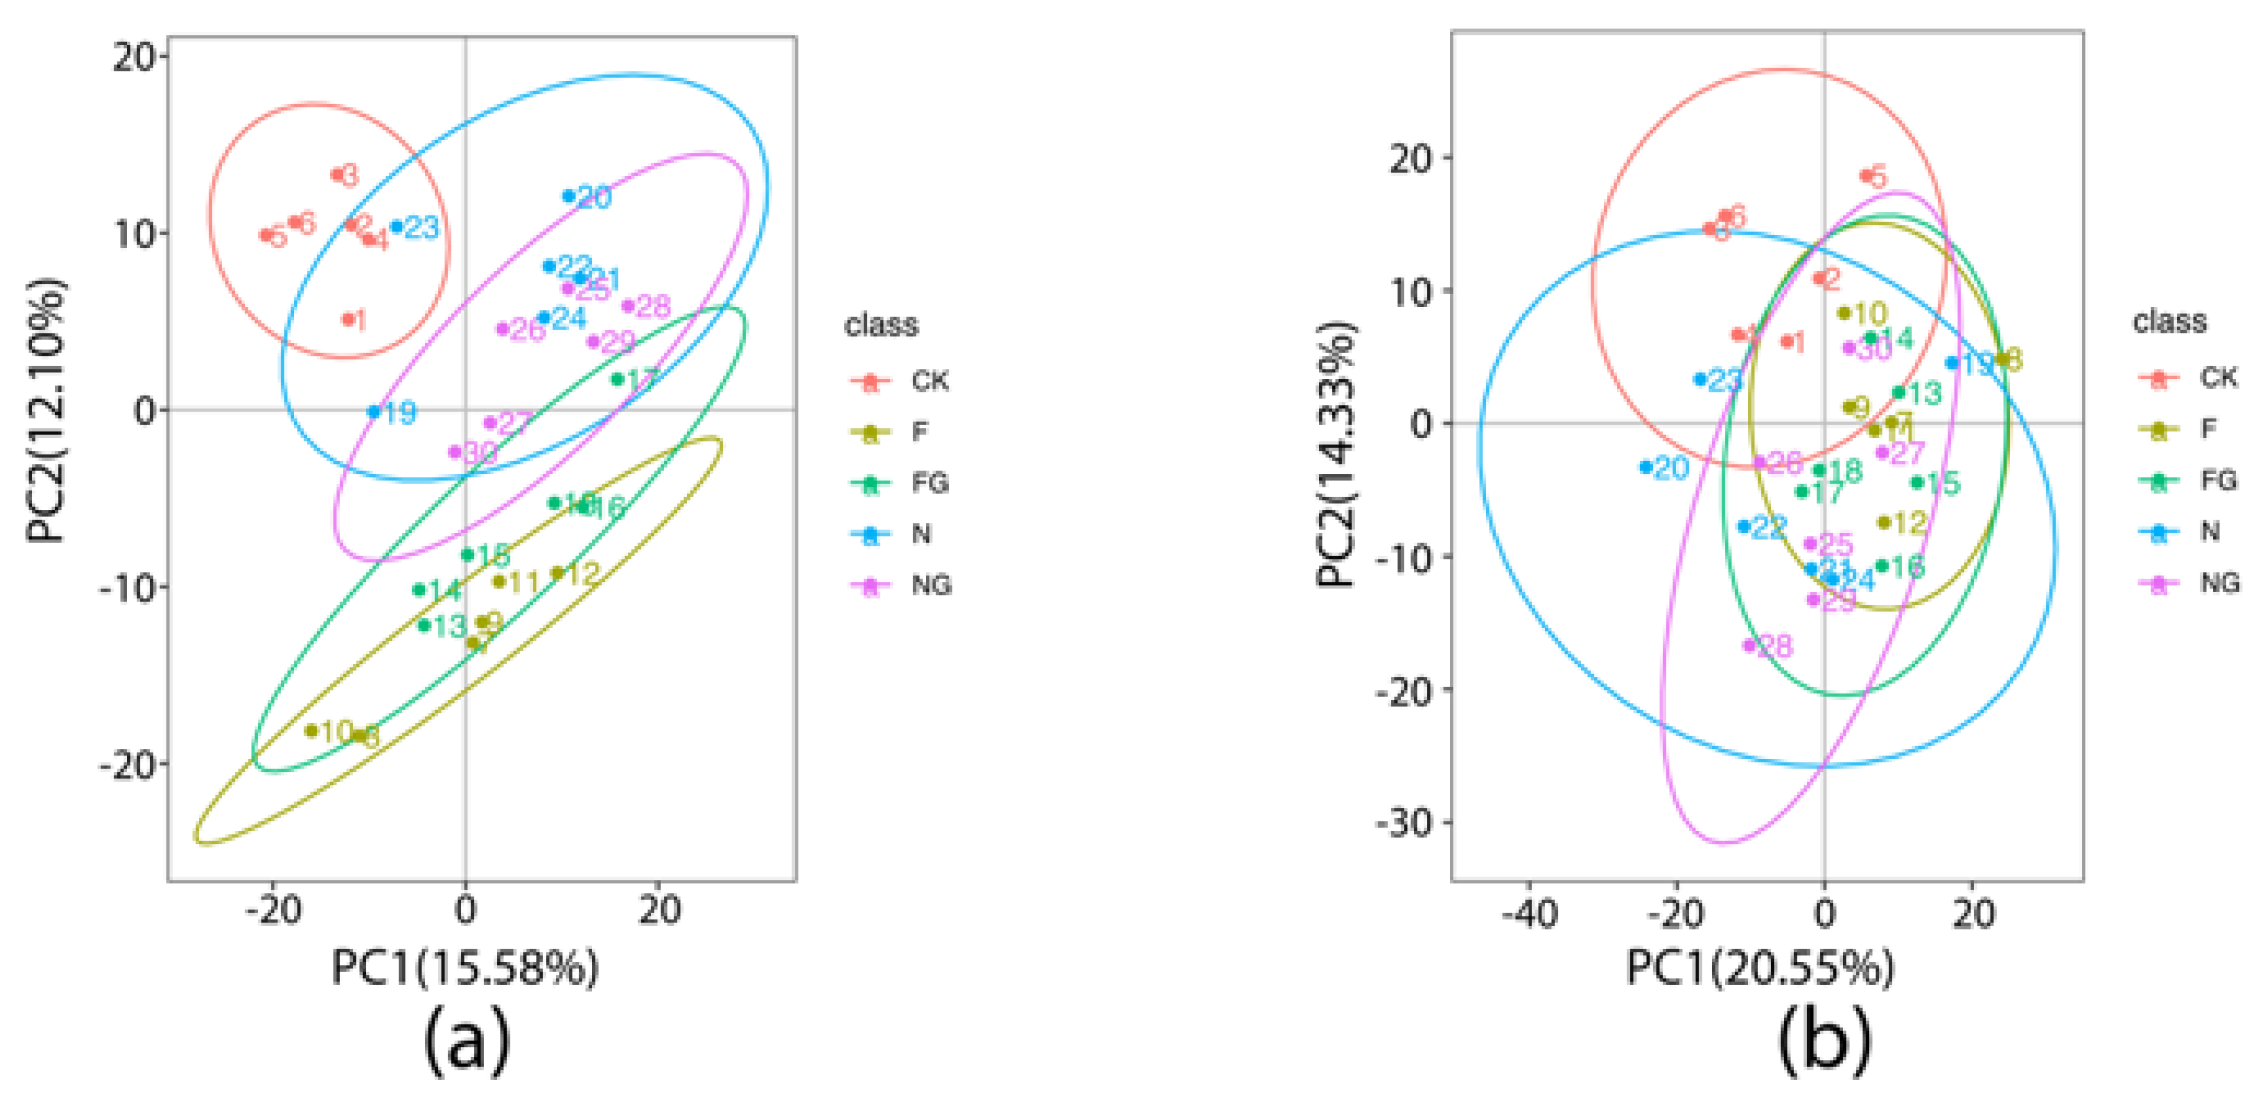
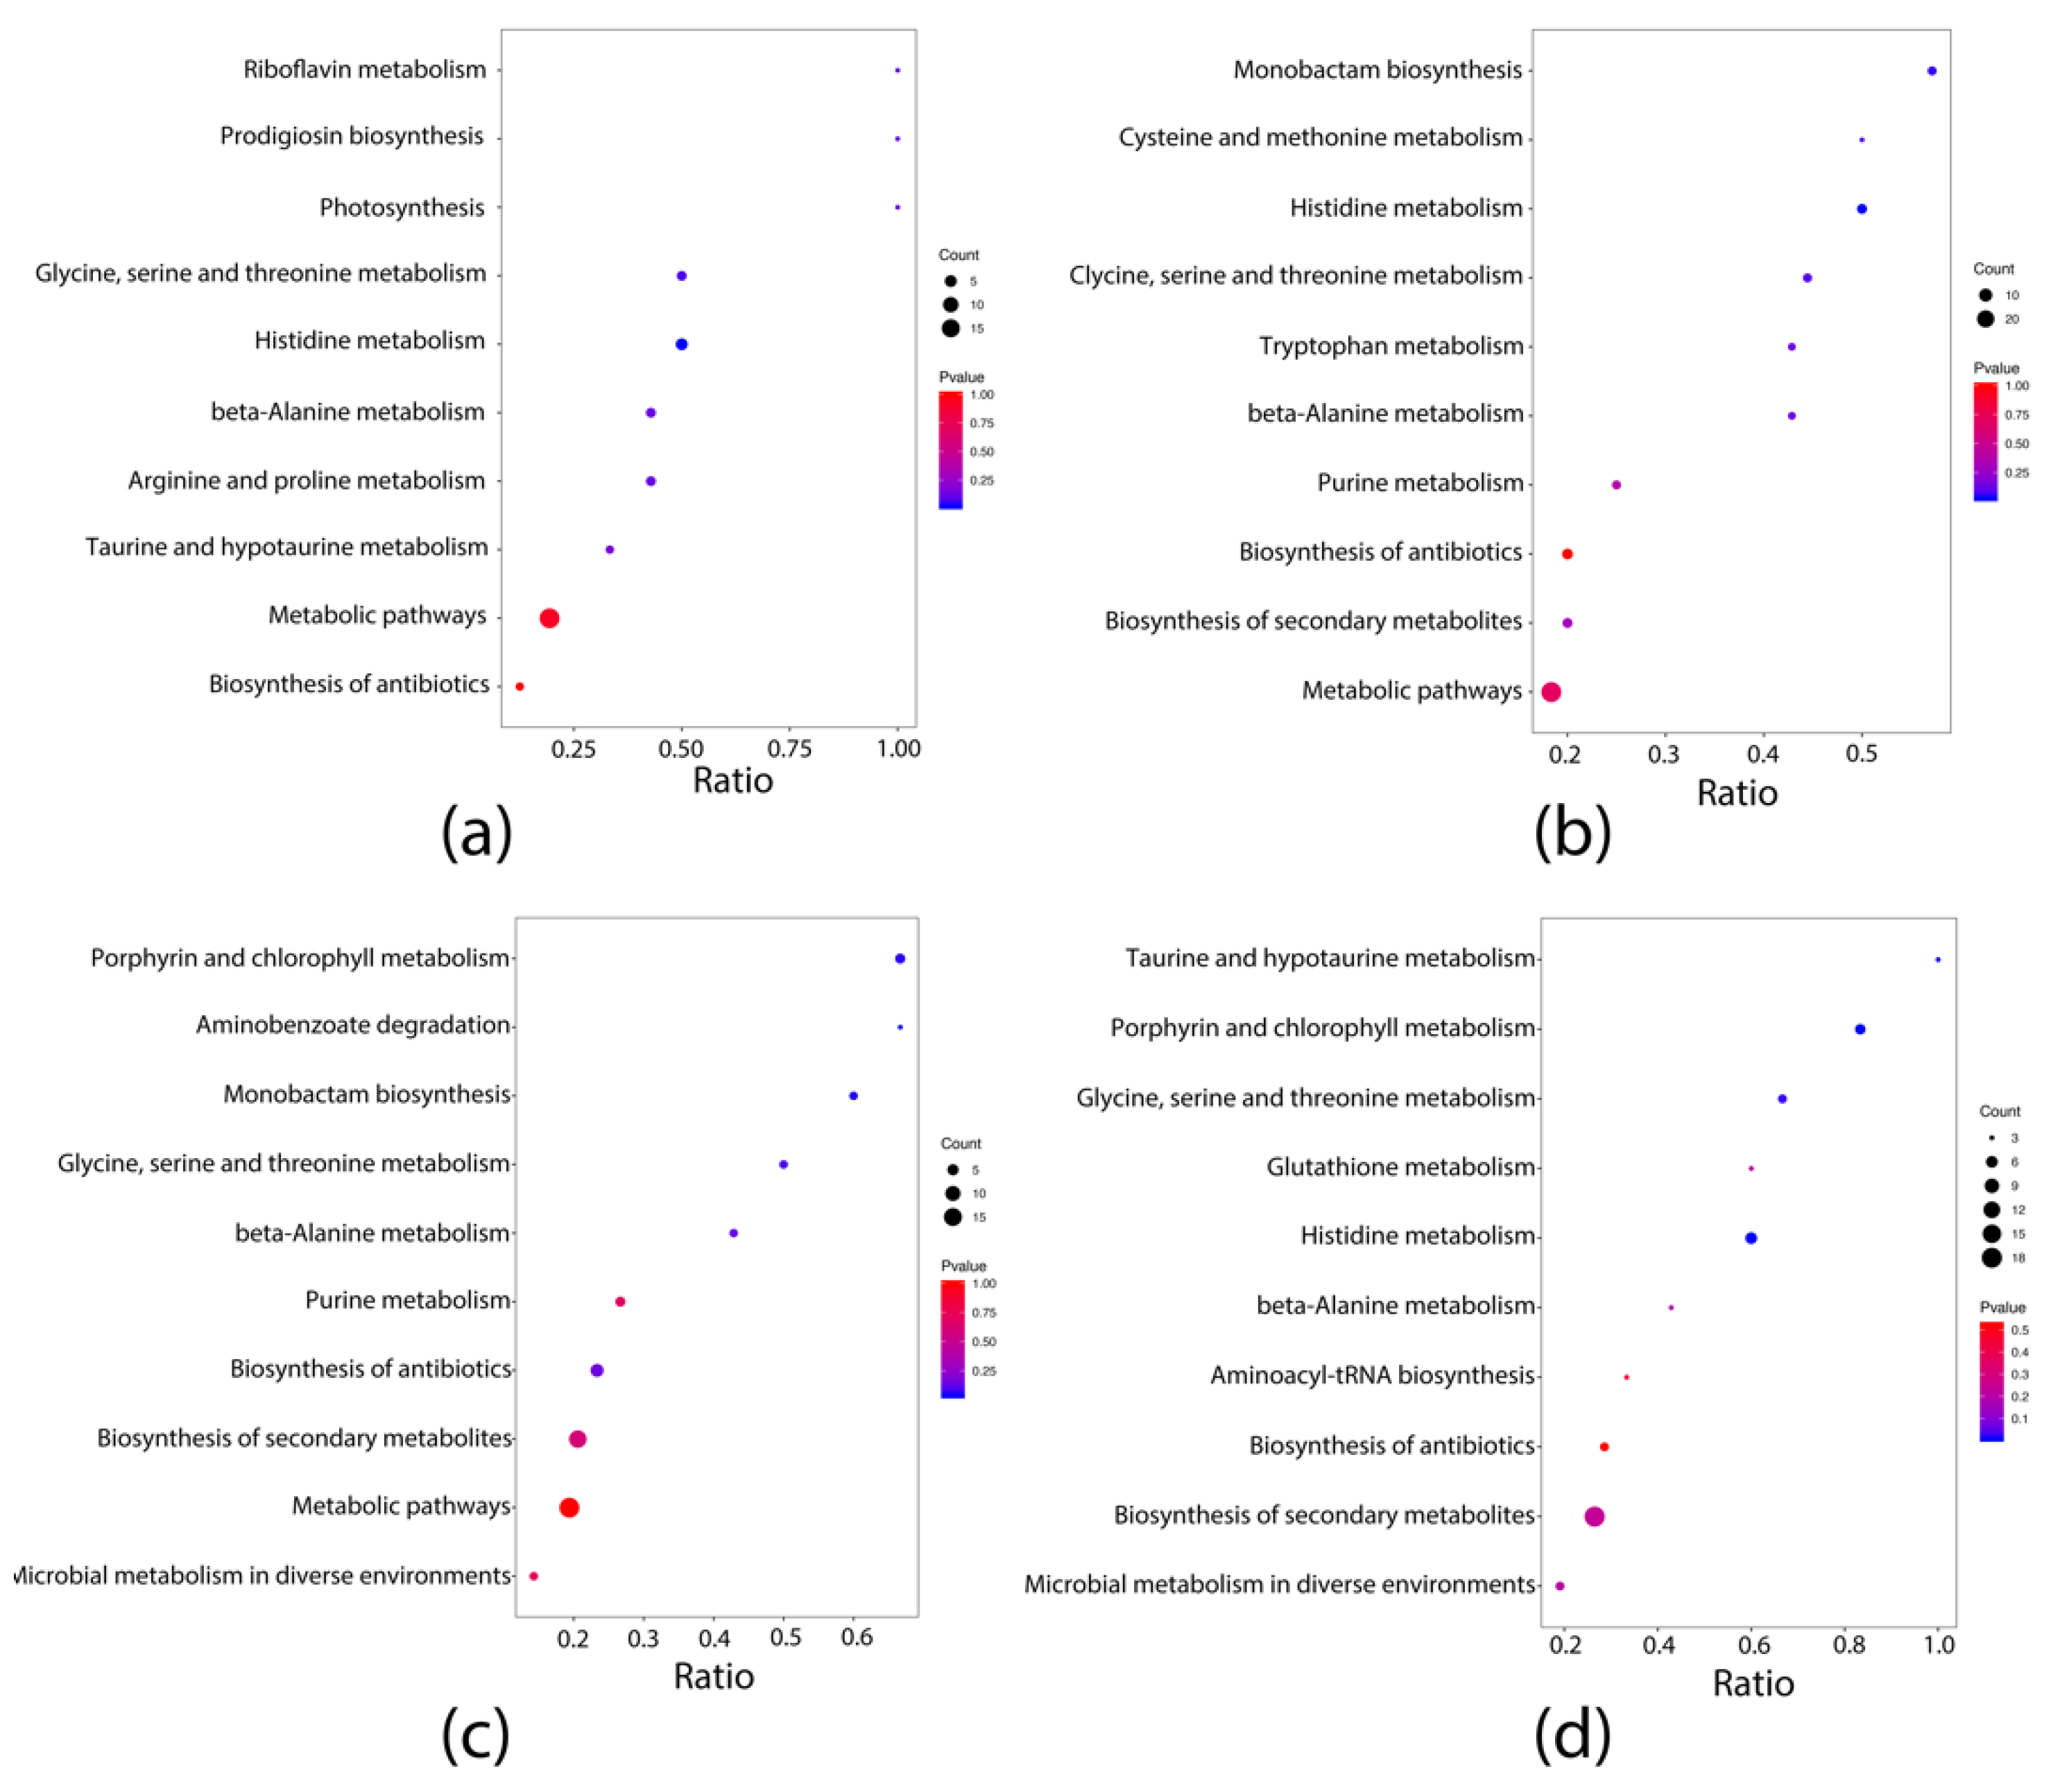
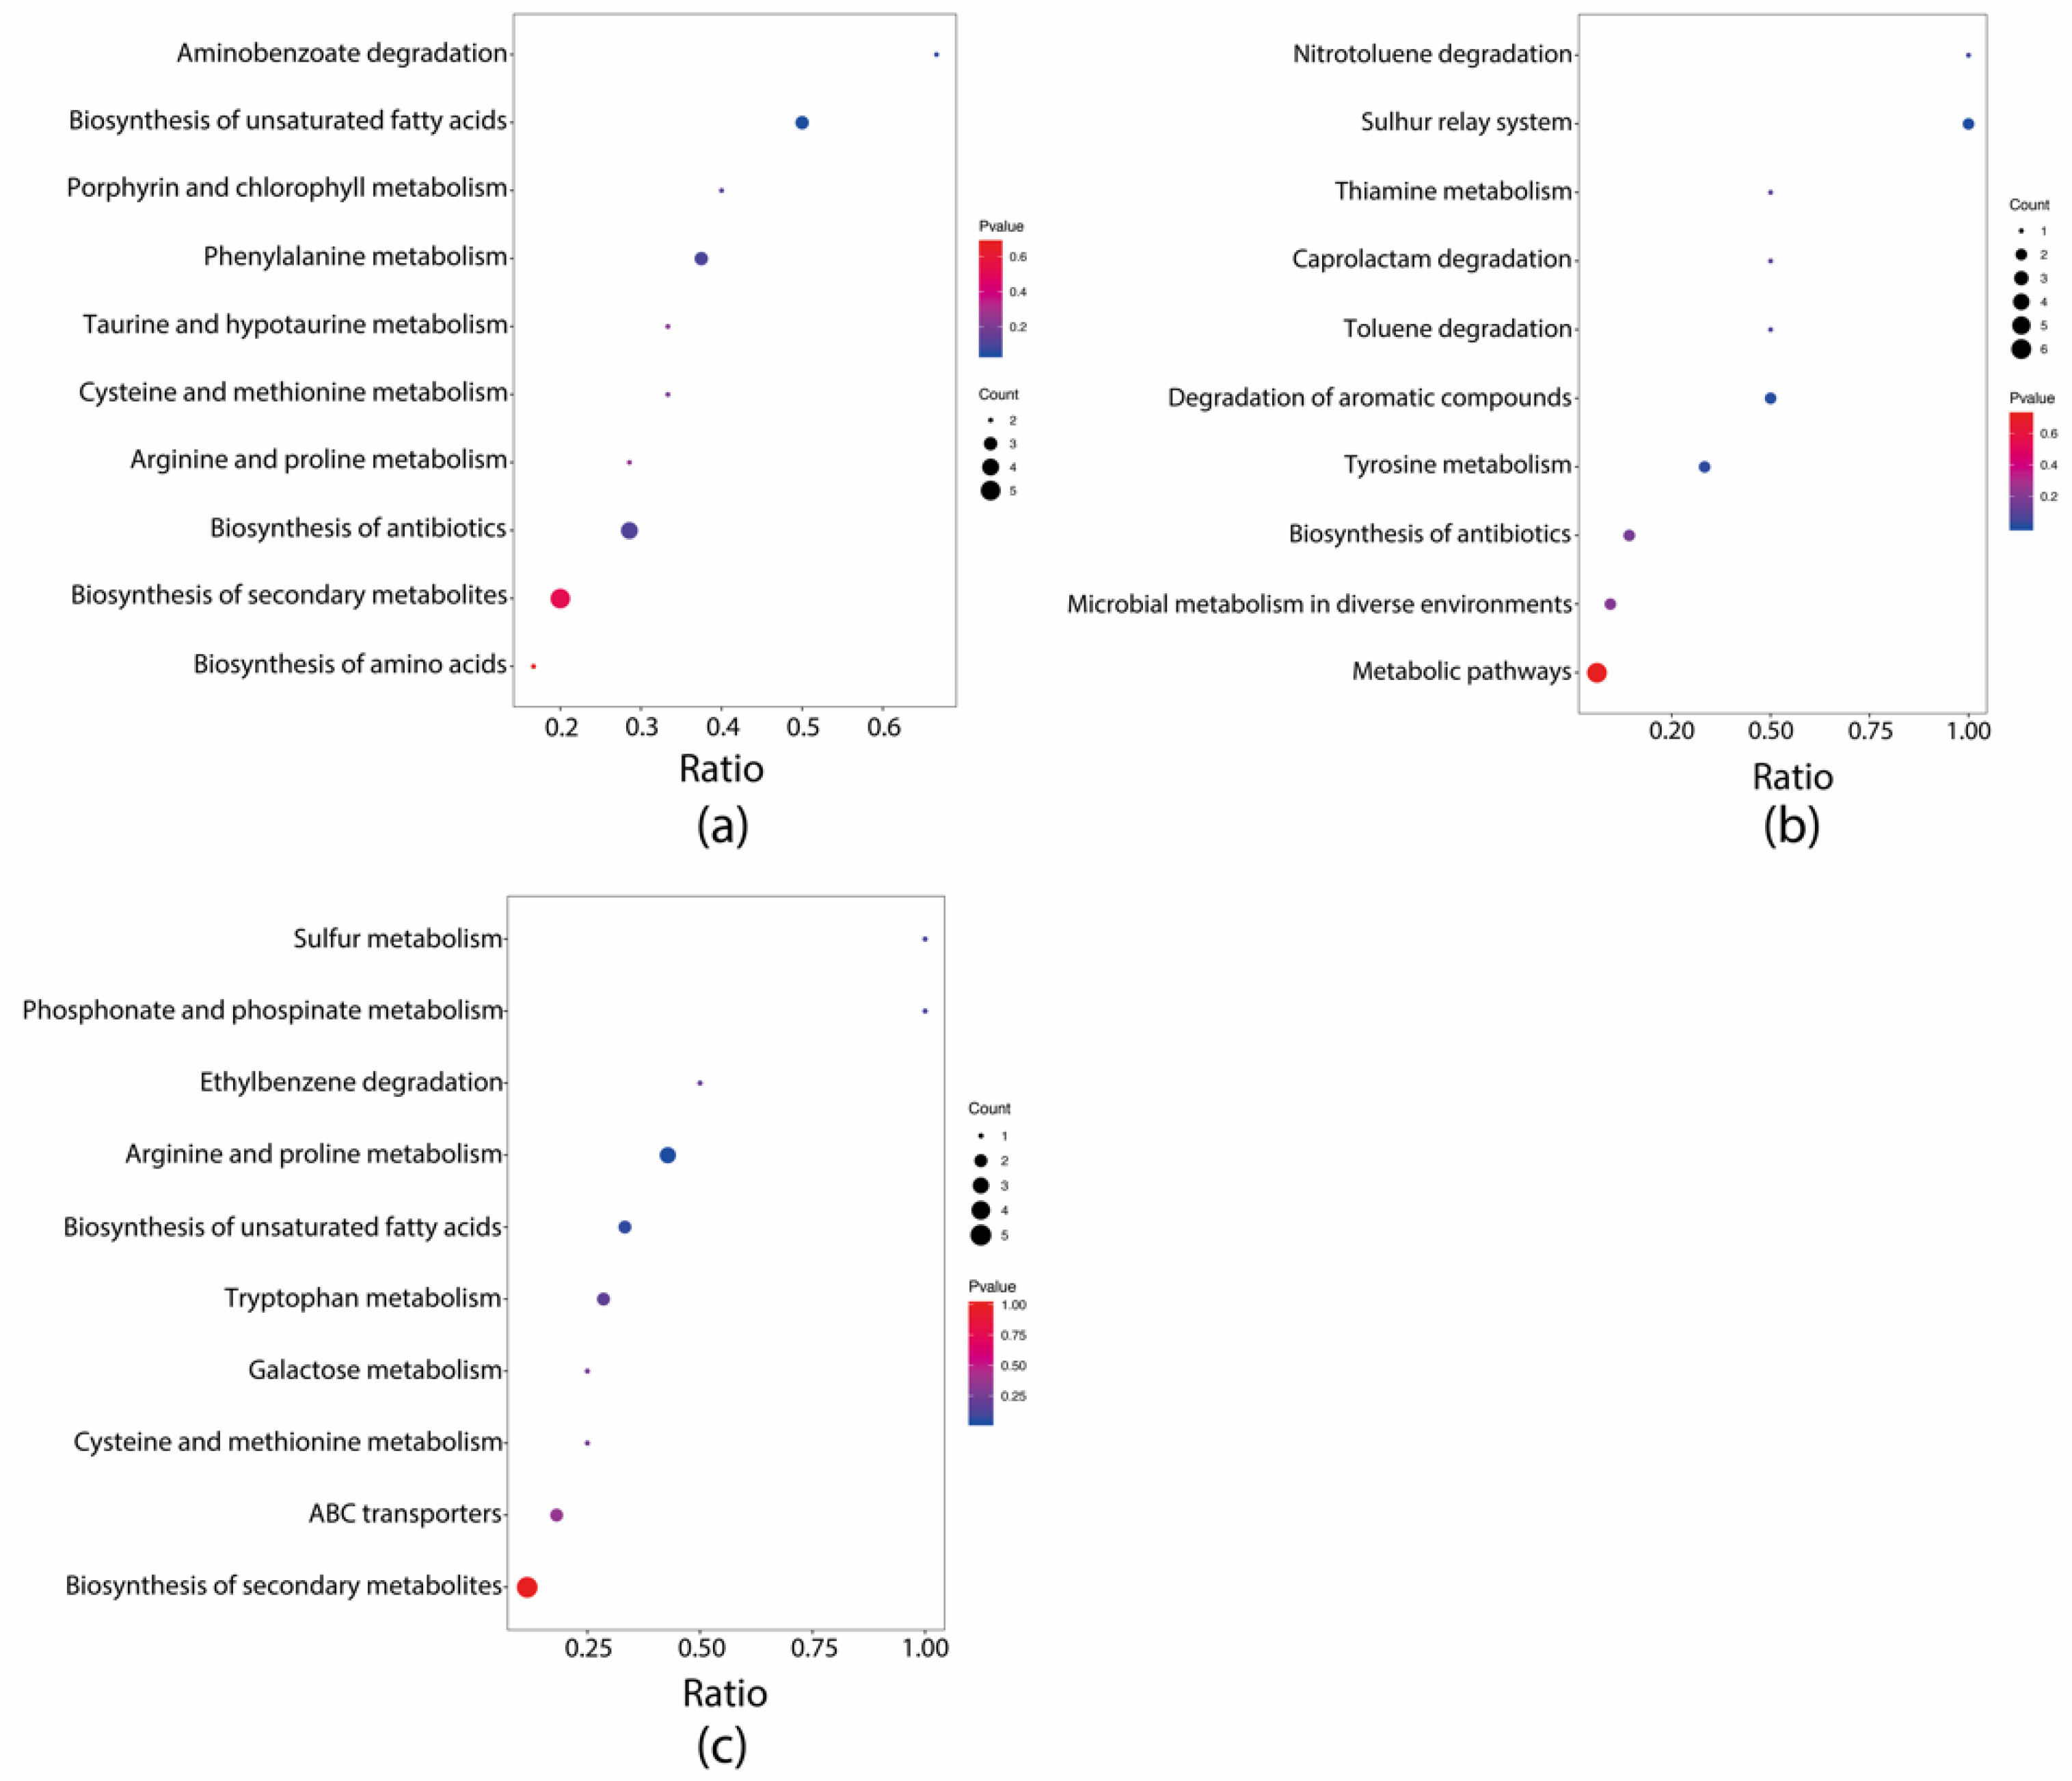
3.4. Effects of Dietary Intervention on Fecal Metabolites in Mice

Fecal samples were analyzed with untargeted metabolomics to further explore the effects of M. aquaticum and L. plantarum on the intestinal metabolic profile of mice. The PCA score plots showed a clear separation among the CK, N, NG, F, and FG groups (Figure 4). The supervised PLS-DA analysis showed differences in fecal metabolic characteristics between each of the two comparison groups (Figure 5). These results suggested that M. aquaticum and L. plantarum BW2013 intervention significantly affected the fecal metabolic profile in mice. Individual metabolite analysis identified nine significantly changed fecal metabolites: L-aspartate, L-threonine, vitamin A, myricetin, gallic acid, luteolin, lysophosphatidylglycerol 18:1 (LPG (18:1)), and 9-oxo-10,12-octadecadienoic acid (9-oxo-ODA) (Table 3). L-aspartic acid, L-threonine, vitamin A, myricetin, gallic acid, and luteolin were significantly upregulated in all treatment groups compared with the CK group. The F group showed significantly higher levels of vitamin A, myricetin, gallic acid, and luteolin than the N group. LPG (18:1) was downregulated in the N and F groups. However, LPG (18:1) was significantly upregulated in the NG group compared with the N group. Additionally, LPG (18:1) was significantly upregulated in the FG group compared with the F group. Furthermore, 9-oxo-ODA was upregulated in the FG group compared with the F group.
L-aspartic acid and L-threonine metabolites are converted from ingested dietary protein and endogenous protein by intestinal microbes [43]. L-aspartic acid is one major fuel in the intestine that yields ATP for enterocytes, protecting the intestinal barrier from lipopolysaccharide damage [44]. An increased level of threonine could also lead to an increase in mucin synthesis, which strengthens the interaction between microbiota and the metabolome on the surface of the small intestine for more efficient gut function and immune development [45]. Vitamin A is converted from dietary proteinoid carotenoids, which may play a role in regulating gut microbiota composition, relieving inflammation and enhancing the intestinal epithelial barrier in necrotizing enterocolitis [46]. Myricetin, gallic acid, and luteolin belong to the polyphenol famliy, and are bioactive compounds found in fruits and vegetables. Myricetin exhibits therapeutic effects against many diseases, including cancers of different types, inflammatory diseases, atherosclerosis, thrombosis, cerebral ischemia, diabetes, Alzheimer’s disease, and pathogenic bacterial infections [47]. The beneficial effects of gallic acid can be observed in cardiovascular protection, immune regulation, and gastrointestinal protection [48]. Luteolin is a flavonoid found in plants and may improve intestinal dysbiosis by inhibiting α-glucosidase. Luteolin has shown anti-cancer activity in cancer cell lines and in vivo models [49,50]. Notably, relative quantities of vitamin A, myricetin, gallic acid, and luteolin were upregulated in the F group compared with the N group. It is possible that the more favorable results found in the F group of our study might be due to the fermented M. aquaticum. Furthermore, LPG 18:1 was upregulated in the NG group compared with the N group. Similar results were found in the FG group compared with the F group. LPG, a lysophospholipid, was found to be important in some physiological processes [51]. Ye et al. reported that reduction in LPG in oleate-treated macrophages could be attenuated or even abolished by WY-14643 and/or pioglitazone treatment (two drugs used to treat metabolic diseases) [52]. In this study, LPG (18:1) was significantly downregulated in the N and F groups compared with the CK group. However, LPG (18:1) was upregulated in the NG group compared with the N group and in the FG group compared with the F group. It is suggested that reduction in LPG concentration in the N and F groups could be attenuated or even abolished by supplementation with L. plantarum BW2013. In addition, 9-oxo-ODA was upregulated in the FG group compared with the F group. As a PPARα agonist, 9-oxo-ODA could promote fatty acid oxidation to consequently inhibit triglyceride accumulation [53]. Therefore, four dietary interventions may have potential for intestinal protection as well as anti-inflammatory and anti-cancer benefits. Intakes of fermented M. aquaticum may be more efficient than M. aquaticum with respect to anti-inflammatory, anti-cancer, and intestinal protection by regulating vitamin A, myricetin, gallic acid, and luteolin favorably. Intakes of M. aquaticum and L. plantarum BW2013 may be more efficient than M. aquaticum in metabolic balance by regulating LPG (18:1). Similarly, intakes of fermented M. aquaticum and L. plantarum BW2013 may be more efficient than fermented M. aquaticum in metabolic balance by regulating LPG (18:1). In addition, intakes of fermented M. aquaticum and L. plantarum BW2013 may be more efficient than fermented M. aquaticum in anti-obesity by regulating 9-oxo-ODA.

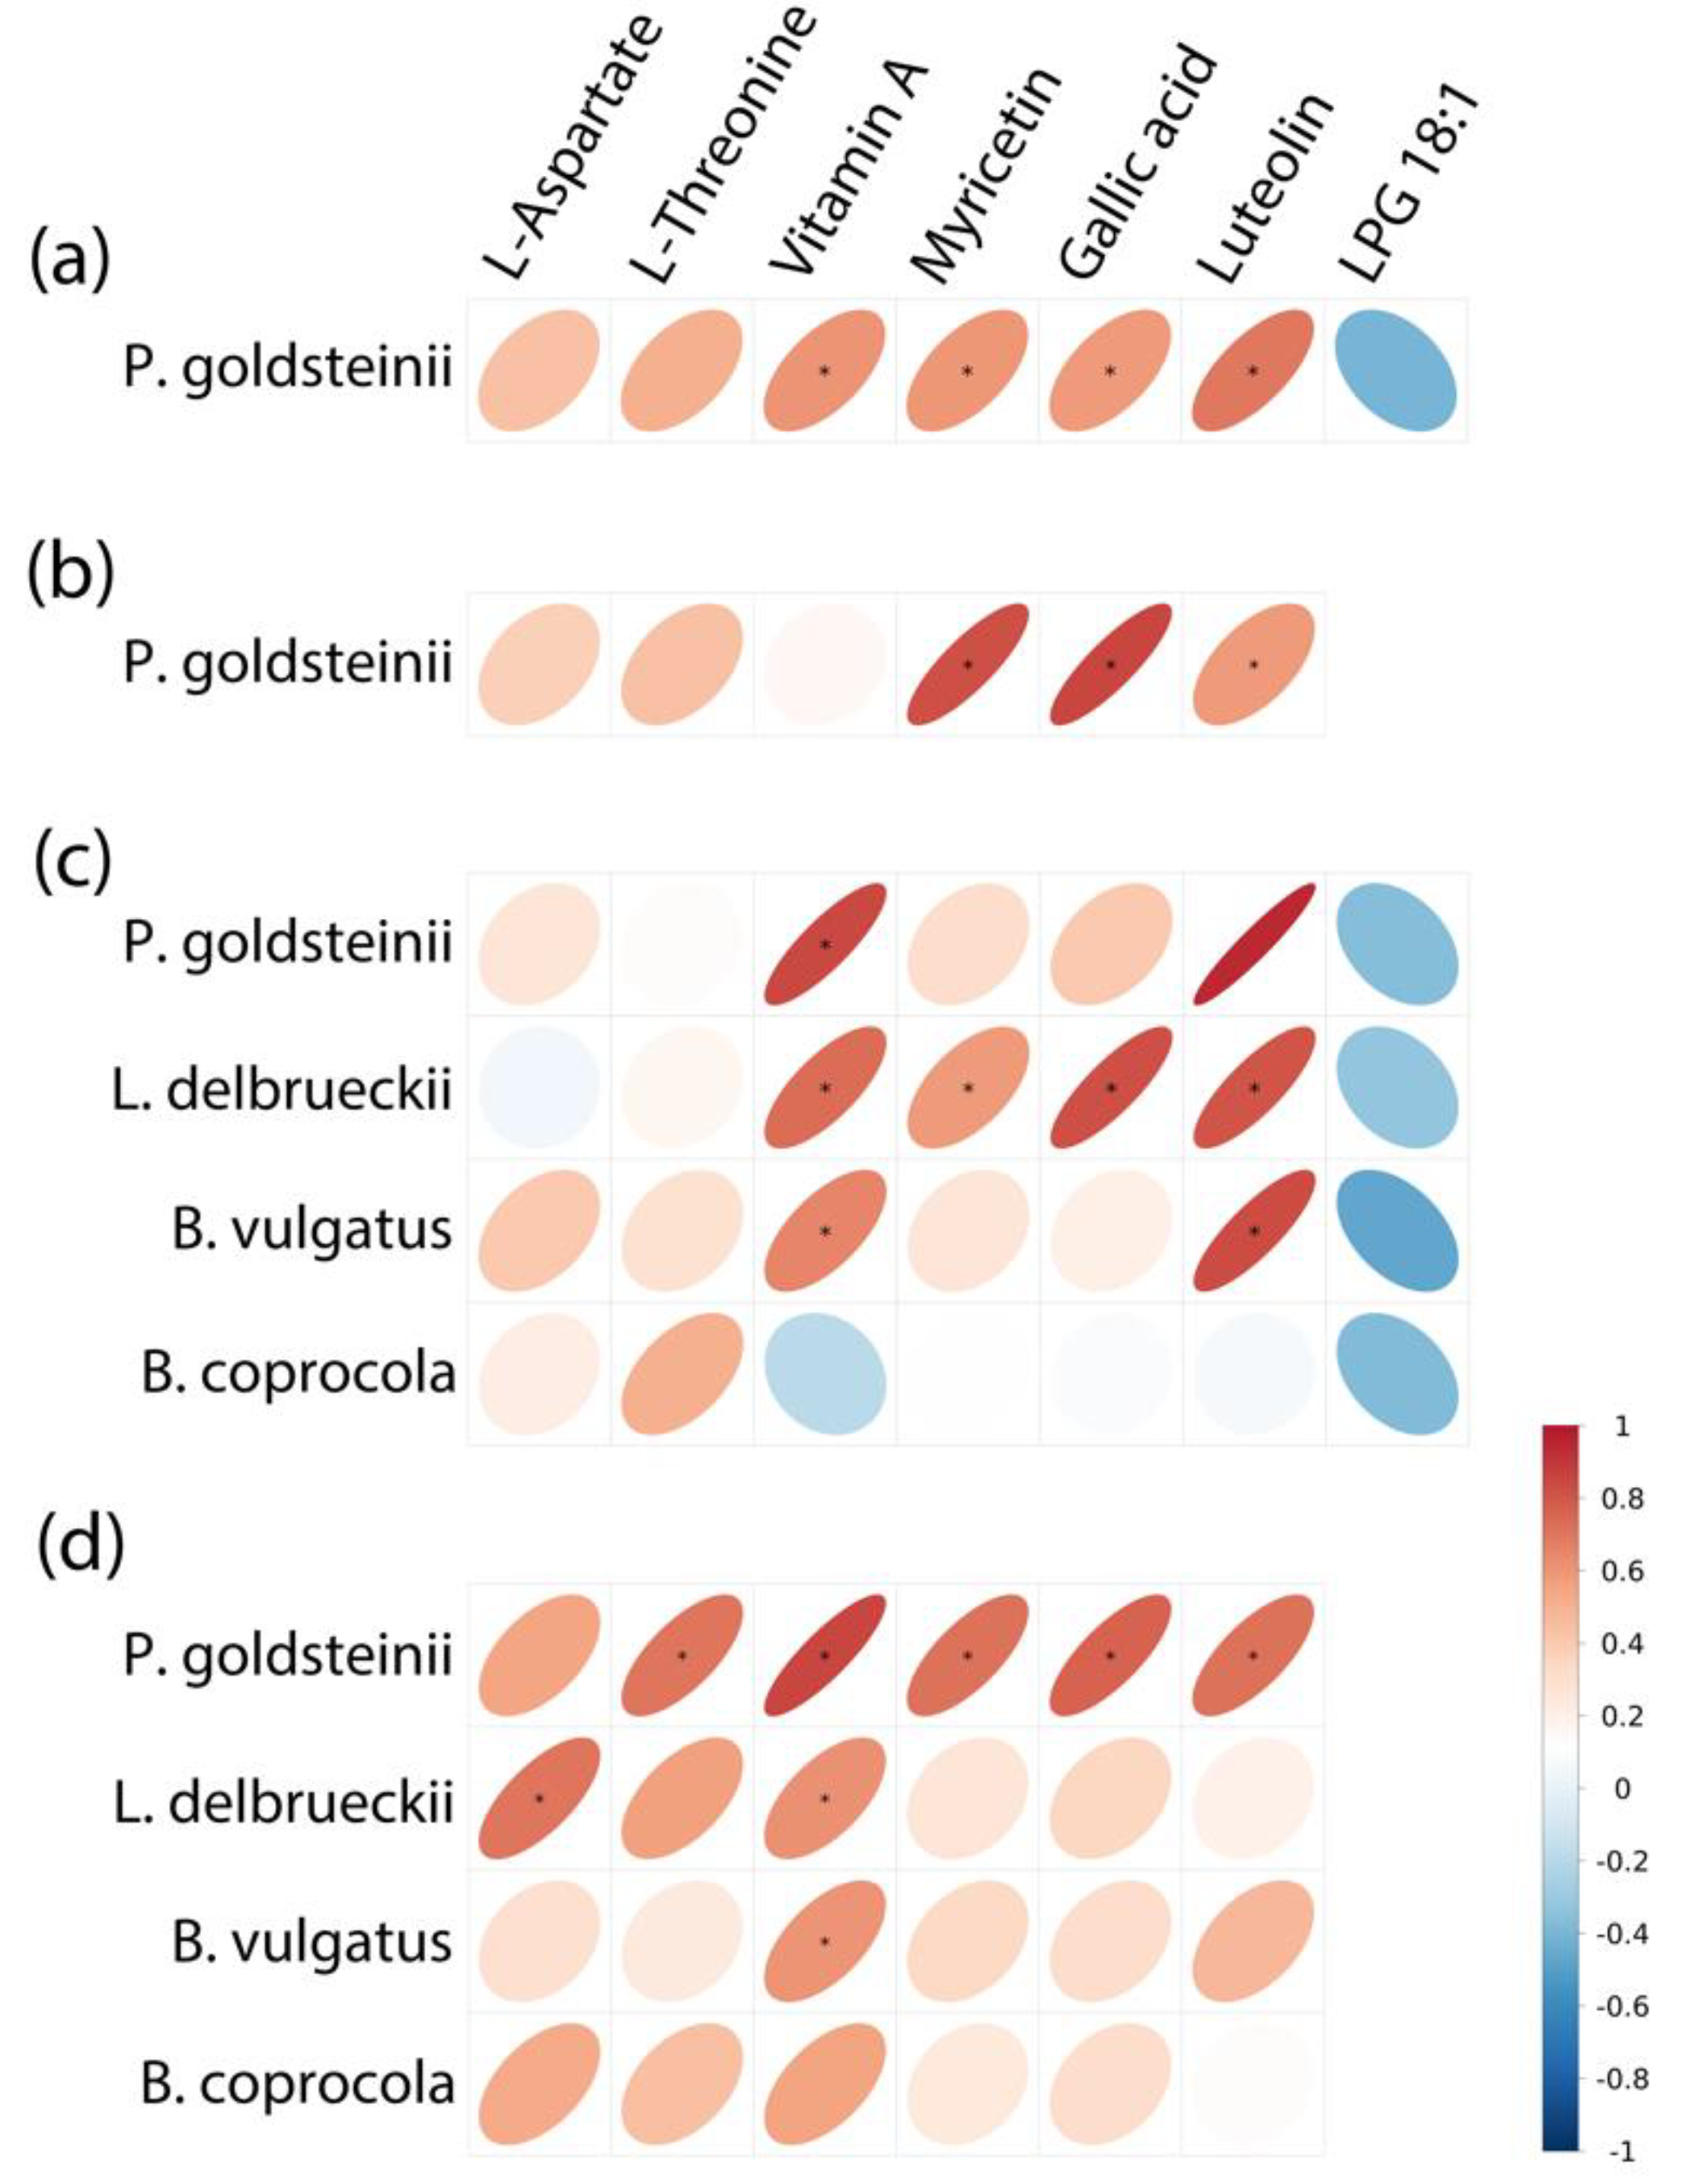
3.5. The Correlation of Gut Microbiota and Fecal Metabolites

Biochemical metabolic pathways involved in differential metabolites can be identified using KEGG pathway enrichment analysis. The top five enriched pathways were identified by KEGG pathway analysis between each group pairing. The N, NG, F, and FG groups displayed significantly higher enrichment of one, one, three, and four pathways, respectively, compared to the CK group (Figure 6). Pathway enrichment analysis showed that the pathway “Histidine metabolism” was enriched with statistical significance in the N group (p < 0.05); “Histidine metabolism” was enriched with statistical significance in the NG group (p < 0.05); “Porphyrin and chlorophyll metabolism”, “Aminobenzoate degradation”, and “Monobactam biosynthesis” were enriched with statistical significance in the F group (p < 0.05); “Taurine and hypotaurine metabolism”, “Porphyrin and chlorophyll metabolism”, “Glycine, serine, and threonine metabolism”, and “Histidine metabolism” were enriched with statistical significance in the FG group (p < 0.05) compared with the CK group. Moreover, “Biosynthesis of unsaturated fatty acids” was significantly enriched in the F group compared with the N group (p < 0.05). “Nitrotoluene degradation”, “Sulfur relay system”, “Degradation of aromatic compounds”, and “Tyrosine metabolism” were significantly enriched in the NG group compared with the N group (p < 0.05). “Arginine and proline metabolism” was significantly enriched in the FG group compared with the F group (p < 0.05) (Figure 7).
The correlation between gut microbiota and fecal metabolites is helpful in explaining the close relationship between gut microbiota and hosts. Spearman correlation analysis (Figure 8) showed that the change in P. goldsteinii was positively associated with changes in vitamin A (r = 0.60, p = 0.038), myricetin (r = 0.59, p = 0.043), gallic acid (r = 0.58, p = 0.046), and luteolin (r = 0.70, p = 0.012) contents in the N group compared with the CK group. The change in P. goldsteinii was positively associated with change in myricetin (r = 0.83, p < 0.001), gallic acid (r = 0.85, p < 0.001), and luteolin (r = 0.59, p = 0.045) in the NG group compared with the CK group. The change in P. goldsteinii was positively associated with change in vitamin A (r = 0.84, p < 0.001); the change in L. delbrueckii was positively associated with change in vitamin A (r = 0.74, p = 0.006), myricetin (r = 0.58, p = 0.048), gallic acid (r = 0.83, p < 0.001), and luteolin (r = 0.81, p = 0.001); and the change in B. vulgatus was positively associated with change in vitamin A (r = 0.66, p = 0.021) and luteolin (r = 0.83, p < 0.001) in the F group compared with the CK group. The change in P. goldsteinii was positively associated with change in L-threonine (r = 0.70, p = 0.011), vitamin A (r = 0.86, p < 0.001), myricetin (r = 0.72, p = 0.008), gallic acid (r = 0.76, p = 0.004), and luteolin (r = 0.72, p = 0.008); the change in L. delbrueckii was positively associated with the change in L-aspartate (r = 0.71, p = 0.010) and vitamin A (r = 0.62, p = 0.032); and the change in B. vulgatus was positively associated with change in vitamin A (r = 0.60, p = 0.039) in the FG group compared with the CK group.
According to the current situation with regard to basic metabolism, intestinal microbiota were able to enhance nutrient uptake in the four treatment groups, in contrast with the CK group. However, different treatments would cause different results. “Histidine metabolism” and “Glycine, serine, and threonine metabolism” belong to amino acid metabolism. As a result of increased amino acid metabolism, the capacity for protein digestion and absorption was enhanced, greatly contributing to basic growth metabolism [54]. Our results showed that, compared with the CK group, F increased gallic acid significantly. Gallic acid showed a positive correlation with L. delbrueckii and was involved in aminobenzoate degradation. Therefore, F might regulate aminobenzoate degradation by mediating L. delbrueckii. Compared with the CK group, L-threonine and L-aspartate were significantly increased in the FG group. L-threonine was positively associated with P. goldsteinii and involved in “Porphyrin and chlorophyll metabolism” and “Glycine, serine, and threonine metabolism”. L-aspartate was positively associated with L. delbrueckii and involved in “Histidine metabolism” and “Glycine, serine, and threonine metabolism”. Therefore, FG might regulate “Porphyrin and chlorophyll metabolism” and “Glycine, serine, and threonine metabolism” by mediating P. goldsteinii as well as regulating “Histidine metabolism” and “Glycine, serine, and threonine metabolism” by mediating L. delbrueckii.

4. Conclusions

In conclusion, the quality of M. aquaticum as a feed additive was improved by L. plantarum BW2013 solid-state fermentation. High-throughput sequencing and metabolomic results showed that M. aquaticum and L. plantarum BW2013, as new feed additives, could promote the intestinal health of mice by modulating microbiota composition and regulating fecal metabolic profiles. Intakes of fermented M. aquaticum and L. plantarum BW2013, especially, may have potential for intestinal protection as well as anti-inflammatory, anti-obesity, and anti-cancer benefits by increasing populations of beneficial microorganisms (Parabacteroides, P. goldsteinii, L. delbrueckii, B.vulgatus, and B.coprocola) and decreasing populations of harmful microorganisms (Proteobacteria). Meanwhile, FG might regulate “Porphyrin and chlorophyll metabolism” and “Glycine, serine, and threonine metabolism” by mediating P. goldsteinii as well as regulating “Histidine metabolism” and “Glycine, serine, and threonine metabolism” by mediating L. delbrueckii. Moreover, the correlation analysis of gut microbiota and metabolites showed that P. goldsteinii has a positive correlation with L-threonine, vitamin A, myricetin, gallic acid, and luteolin; L. delbrueckii has a positive correlation with L-aspartate and vitamin A; and B. vulgatus has a positive correlation with vitamin A. This study could be used as a reference for future developments of beneficial feed additives for animals. Future work may include safety assessments of M. aquaticum for humans.

5. Patents

There is a patent (202111462076.2, China) resulting from the work reported in this manuscript.

Author Contributions

Writing—original draft, writing—review and editing, and data curation, Y.L. (Yueyang Li); investigation and data curation, Y.L. (Yuxi Ling); supervision, J.L.; writing—review and editing, M.Z.; project administration, funding acquisition, and writing—review and editing, Z.L.; formal analysis and methodology, Z.B., Z.W. (Zhenlong Wu) and R.X.; conceptualization and visualization, Z.W. (Zhichao Wu), Y.W. and Q.Z. All authors have read and agreed to the published version of the manuscript.

Funding

This paper was supported by the Beijing Natural Science Foundation (grant number 6173033), the Beijing Union University Foundation (grant number 12213611605-001), Academic Research Projects of Beijing Union University (grant number ZK70202003), and Internal Trade Food Science and Technology (Beijing) Co., Ltd. Cooperation Projects (grant number 202116).

Institutional Review Board Statement

This study followed the recommendations of the Animal Welfare Committee of Beijing Union University (Beijing, China). The protocol was approved by the Animal Welfare Committee of Beijing Union University (protocol code: 20191101).

Informed Consent Statement

Not applicable.

Data Availability Statement

All 16S rRNA sequences were submitted to the National Center for Biotechnology Information (NCBI) Sequence Read Archive with the accession number PRJNA801077.

Conflicts of Interest

The authors declare no conflict of interest.

References

  1. Colzi, I.; Lastrucci, L.; Rangoni, M.; Coppi, A.; Gonnelli, C. Using Myriophyllum aquaticum (Vell.) Verdc. to Remove Heavy Metals from Contaminated Water: Better Dead or Alive? J. Environ. Manag. 2018, 213, 320–328. [Google Scholar] [CrossRef] [PubMed]
  2. Luo, P.; Liu, F.; Zhang, S.; Li, H.; Chen, X.; Wu, L.; Jiang, Q.; Xiao, R.; Wu, J. Evaluating Organics Removal Performance from Lagoon-Pretreated Swine Wastewater in Pilot-Scale Three-Stage Surface Flow Constructed Wetlands. Chemosphere 2018, 211, 286–293. [Google Scholar] [CrossRef] [PubMed]
  3. Liu, F.; Zhang, S.; Luo, P.; Zhuang, X.; Chen, X.; Wu, J. Purification and Reuse of Non-Point Source Wastewater via Myriophyllum-Based Integrative Biotechnology: A Review. Bioresour. Technol. 2018, 248, 3–11. [Google Scholar] [CrossRef]
  4. Lastrucci, L.; Lazzaro, L.; Dell’Olmo, L.; Foggi, B.; Cianferoni, F. Impacts of Myriophyllum aquaticum Invasion in a Mediterranean Wetland on Plant and Macro-Arthropod Communities. Plant Biosyst. 2017, 152, 427–435. [Google Scholar] [CrossRef]
  5. Lastrucci, L.; Valentini, E.; Dell’Olmo, L.; Vietina, B.; Foggi, B. Hygrophilous Vegetation and Habitats of Conservation Interest in the Area of the Lake Porta (Tuscany, Central Italy). Atti Soc. Toscana Sci. Nat. Mem. Ser. B 2015, 122, 131–146. [Google Scholar]
  6. Gareau, M.G.; Sherman, P.M.; Walker, W.A. Probiotics and the Gut Microbiota in Intestinal Health and Disease. Nat. Rev. Gastroenterol. Hepatol. 2010, 7, 503–514. [Google Scholar] [CrossRef] [Green Version]
  7. Liu, Y.; Gao, Y.; Ma, F.; Sun, M.; Mu, G.; Tuo, Y. The Ameliorative Effect of Lactobacillus plantarum Y44 Oral Administration on Inflammation and Lipid Metabolism in Obese Mice Fed with a High Fat Diet. Food Funct. 2020, 11, 5024–5039. [Google Scholar] [CrossRef]
  8. Kim, J.S.; Lee, Y.H.; Kim, Y.I.; Ahmadi, F.; Oh, Y.K.; Park, J.M.; Kwak, W.S. Effect of Microbial Inoculant or Molasses on Fermentative Quality and Aerobic Stability of Sawdust-Based Spent Mushroom Substrate. Bioresour. Technol. 2016, 216, 188–195. [Google Scholar] [CrossRef]
  9. Ni, K.; Wang, F.; Zhu, B.; Yang, J.; Zhou, G.; Pan, Y.; Tao, Y.; Zhong, J. Effects of Lactic Acid Bacteria and Molasses Additives on the Microbial Community and Fermentation Quality of Soybean Silage. Bioresour. Technol. 2017, 238, 706–715. [Google Scholar] [CrossRef]
  10. Pan, T.; Xiang, H.; Diao, T.; Ma, W.; Shi, C.; Xu, Y.; Xie, Q. Effects of Probiotics and Nutrients Addition on the Microbial Community and Fermentation Quality of Peanut Hull. Bioresour. Technol. 2019, 273, 144–152. [Google Scholar] [CrossRef]
  11. Puntillo, M.; Gaggiotti, M.; Oteiza, J.M.; Binetti, A.; Massera, A.; Vinderola, G. Potential of Lactic Acid Bacteria Isolated From Different Forages as Silage Inoculants for Improving Fermentation Quality and Aerobic Stability. Front. Microbiol. 2020, 11, 3091. [Google Scholar] [CrossRef] [PubMed]
  12. Wang, Y.; Du, W.; Lei, K.; Wang, B.; Wang, Y.; Zhou, Y.; Li, W. Effects of Dietary Bacillus licheniformis on Gut Physical Barrier, Immunity, and Reproductive Hormones of Laying Hens. Probiotics Antimicrob. Proteins 2017, 9, 292–299. [Google Scholar] [CrossRef] [PubMed]
  13. Zeng, Y.; Zeng, D.; Zhang, Y.; Ni, X.Q.; Wang, J.; Jian, P.; Zhou, Y.; Li, Y.; Yin, Z.Q.; Pan, K.C.; et al. Lactobacillus plantarum BS22 Promotes Gut Microbial Homeostasis in Broiler Chickens Exposed to Aflatoxin B1. J. Anim. Physiol. Anim. Nutr. 2018, 102, e449–e459. [Google Scholar] [CrossRef] [PubMed]
  14. Zhong, H.; Deng, L.; Zhao, M.; Tang, J.; Liu, T.; Zhang, H.; Feng, F. Probiotic-Fermented Blueberry Juice Prevents Obesity and Hyperglycemia in High Fat Diet-Fed Mice in Association with Modulating the Gut Microbiota. Food Funct. 2020, 11, 9192–9207. [Google Scholar] [CrossRef]
  15. Kim, H.Y.; Park, K.Y. Clinical Trials of Kimchi Intakes on the Regulation of Metabolic Parameters and Colon Health in Healthy Korean Young Adults. J. Funct. Foods 2018, 47, 325–333. [Google Scholar] [CrossRef]
  16. Nsenga Kumwimba, M.; Dzakpasu, M.; Li, X. Potential of Invasive Watermilfoil (Myriophyllum Spp.) to Remediate Eutrophic Waterbodies with Organic and Inorganic Pollutants. J. Environ. Manag. 2020, 270, 110919. [Google Scholar] [CrossRef]
  17. Rajoka, M.I.; Ahmed, S.; Hashmi, A.S.; Athar, M. Production of Microbial Biomass Protein from Mixed Substrates by Sequential Culture Fermentation of Candida utilis and Brevibacterium lactofermentum. Ann. Microbiol. 2012, 62, 1173–1179. [Google Scholar] [CrossRef]
  18. Wuyts, S.; van Beeck, W.; Allonsius, C.N.; van den Broek, M.F.; Lebeer, S. Applications of Plant-Based Fermented Foods and Their Microbes. Curr. Opin. Biotechnol. 2020, 61, 45–52. [Google Scholar] [CrossRef]
  19. Zha, M.; Li, K.; Zhang, W.; Sun, Z.; Kwok, L.Y.; Menghe, B.; Chen, Y. Untargeted Mass Spectrometry-Based Metabolomics Approach Unveils Molecular Changes in Milk Fermented by Lactobacillus plantarum P9. LWT Food Sci. Technol. 2021, 140, 110759. [Google Scholar] [CrossRef]
  20. Wen, J.J.; Li, M.Z.; Gao, H.; Hu, J.L.; Nie, Q.X.; Chen, H.H.; Zhang, Y.L.; Xie, M.Y.; Nie, S.P. Polysaccharides from Fermented Momordica charantia L. with Lactobacillus plantarum NCU116 Ameliorate Metabolic Disorders and Gut Microbiota Change in Obese Rats. Food Funct. 2021, 12, 2617–2630. [Google Scholar] [CrossRef]
  21. Guedes, C.M.; Gonçalves, D.; Rodrigues, M.A.M.; Dias-da-Silva, A. Effects of a Saccharomyces Cerevisiae Yeast on Ruminal Fermentation and Fibre Degradation of Maize Silages in Cows. Anim. Feed Sci. Technol. 2008, 145, 27–40. [Google Scholar] [CrossRef]
  22. Marcó, A.; Rubio, R.; Compañó, R.; Casals, I. Comparison of the Kjeldahl Method and a Combustion Method for Total Nitrogen Determination in Animal Feed. Talanta 2002, 57, 1019–1026. [Google Scholar] [CrossRef]
  23. Manirakiza, P.; Covaci, A.; Schepens, P. Comparative Study on Total Lipid Determination Using Soxhlet, Roese-Gottlieb, Bligh & Dyer, and Modified Bligh & Dyer Extraction Methods. J. Food Compos. Anal. 2001, 14, 93–100. [Google Scholar]
  24. Rodríguez, R.; Jiménez, A.; Fernández-Bolaños, J.; Guillén, R.; Heredia, A. Dietary Fibre from Vegetable Products as Source of Functional Ingredients. Trends Food Sci. Technol. 2006, 17, 3–15. [Google Scholar] [CrossRef]
  25. Fuentes-Soriano, P.; Bellido-Milla, D.; García-Guzmán, J.J.; Hernández-Artiga, M.P.; Gallardo-Bernal, J.J.; Palacios-Santander, J.M.; Espada-Bellido, E. A Simple Phosphorus Determination in Walnuts and Assessment of the Assimilable Fraction. Talanta 2019, 204, 57–62. [Google Scholar] [CrossRef]
  26. Chahdoura, H.; Morales, P.; Barreira, J.C.M.; Barros, L.; Fernández-Ruiz, V.; Ferreira, I.C.F.R.; Achour, L. Dietary Fiber, Mineral Elements Profile and Macronutrients Composition in Different Edible Parts of Opuntia microdasys (Lehm.) Pfeiff and Opuntia macrorhiza (Engelm.). LWT Food Sci. Technol. 2015, 64, 446–451. [Google Scholar] [CrossRef] [Green Version]
  27. Edgar, R.C. UPARSE: Highly Accurate OTU Sequences from Microbial Amplicon Reads. Nat. Methods 2013, 10, 996–998. [Google Scholar] [CrossRef]
  28. Quast, C.; Pruesse, E.; Yilmaz, P.; Gerken, J.; Schweer, T.; Yarza, P.; Peplies, J.; Glöckner, F.O. The SILVA Ribosomal RNA Gene Database Project: Improved Data Processing and Web-Based Tools. Nucleic Acids Res. 2013, 41, 590–596. [Google Scholar] [CrossRef]
  29. Cao, Y.; Liu, Y.; Dong, Q.; Wang, T.; Niu, C. Alterations in the Gut Microbiome and Metabolic Profile in Rats Acclimated to High Environmental Temperature. Microb. Biotechnol. 2022, 15, 276–288. [Google Scholar] [CrossRef]
  30. Wang, J.; Cao, F.; Su, E.; Zhao, L.; Qin, W. Improvement of Animal Feed Additives of Ginkgo Leaves through Solid-State Fermentation Using Aspergillus niger. Int. J. Biol. Sci. 2018, 14, 736. [Google Scholar] [CrossRef] [Green Version]
  31. Shin, N.R.; Whon, T.W.; Bae, J.W. Proteobacteria: Microbial Signature of Dysbiosis in Gut Microbiota. Trends Biotechnol. 2015, 33, 496–503. [Google Scholar] [CrossRef] [PubMed]
  32. Zhou, L.; Zhang, M.; Wang, Y.; Dorfman, R.G.; Liu, H.; Yu, T.; Chen, X.; Tang, D.; Xu, L.; Yin, Y.; et al. Faecalibacterium prausnitzii Produces Butyrate to Maintain Th17/Treg Balance and to Ameliorate Colorectal Colitis by Inhibiting Histone Deacetylase 1. Inflamm. Bowel Dis. 2018, 24, 1926–1940. [Google Scholar] [CrossRef] [PubMed] [Green Version]
  33. Staley, C.; Kaiser, T.; Vaughn, B.P.; Graiziger, C.; Hamilton, M.J.; Kabage, A.J.; Khoruts, A.; Sadowsky, M.J. Durable Long-Term Bacterial Engraftment Following Encapsulated Fecal Microbiota Transplantation to Treat Clostridium difficile Infection. mBio 2019, 10, e01586-19. [Google Scholar] [CrossRef] [PubMed] [Green Version]
  34. Wu, T.R.; Lin, C.S.; Chang, C.J.; Lin, T.L.; Martel, J.; Ko, Y.F.; Ojcius, D.M.; Lu, C.C.; Young, J.D.; Lai, H.C. Gut Commensal Parabacteroides goldsteinii Plays a Predominant Role in the Anti-Obesity Effects of Polysaccharides Isolated from Hirsutella sinensis. Gut 2019, 68, 248–262. [Google Scholar] [CrossRef] [PubMed]
  35. Elean, M.; Albarracín, L.; Cataldo, P.G.; Londero, A.; Kitazawa, H.; Saavedra, L.; Villena, J.; Hebert, E.M. New Immunobiotics from Highly Proteolytic Lactobacillus delbrueckii Strains: Their Impact on Intestinal Antiviral Innate Immune Response. Benef. Microbes 2020, 11, 375–390. [Google Scholar] [CrossRef] [PubMed]
  36. Lee, N.Y.; Joung, H.C.; Kim, B.K.; Kim, B.Y.; Park, T.S.; Suk, K.T. Lactobacillus lactis CKDB001 Ameliorate Progression of Nonalcoholic Fatty Liver Disease through of Gut Microbiome: Addendum. Gut Microbes 2020, 12, 1829449. [Google Scholar] [CrossRef]
  37. Yoshida, N.; Emoto, T.; Yamashita, T.; Watanabe, H.; Hayashi, T.; Tabata, T.; Hoshi, N.; Hatano, N.; Ozawa, G.; Sasaki, N.; et al. Bacteroides vulgatus and Bacteroides dorei Reduce Gut Microbial Lipopolysaccharide Production and Inhibit Atherosclerosis. Circulation 2018, 138, 2486–2498. [Google Scholar] [CrossRef]
  38. Makki, K.; Deehan, E.C.; Walter, J.; Bäckhed, F. The Impact of Dietary Fiber on Gut Microbiota in Host Health and Disease. Cell Host Microbe 2018, 23, 705–715. [Google Scholar] [CrossRef] [Green Version]
  39. Jiang, T.; Gao, X.; Wu, C.; Tian, F.; Lei, Q.; Bi, J.; Xie, B.; Wang, H.Y.; Chen, S.; Wang, X. Apple-Derived Pectin Modulates Gut Microbiota, Improves Gut Barrier Function, and Attenuates Metabolic Endotoxemia in Rats with Diet-Induced Obesity. Nutrients 2016, 8, 126. [Google Scholar] [CrossRef] [Green Version]
  40. Wexler, H.M. Bacteroides: The Good, the Bad, and the Nitty-Gritty. Clin. Microbiol. Rev. 2007, 20, 593–621. [Google Scholar] [CrossRef] [Green Version]
  41. Kitahara, M.; Sakamoto, M.; Ike, M.; Sakata, S.; Benno, Y. Bacteroides plebeius Sp. Nov. and Bacteroides coprocola Sp. Nov., Isolated from Human Faeces. Int. J. Syst. Evol. Microbiol. 2005, 55, 2143–2147. [Google Scholar] [CrossRef] [PubMed] [Green Version]
  42. Wang, J.; Ji, H.; Wang, S.; Liu, H.; Zhang, W.; Zhang, D.; Wang, Y. Probiotic Lactobacillus plantarum Promotes Intestinal Barrier Function by Strengthening the Epithelium and Modulating Gut Microbiota. Front. Microbiol. 2018, 9, 1953. [Google Scholar] [CrossRef] [PubMed] [Green Version]
  43. Macfarlane, G.T.; Cummings, J.H.; Allison, C. Protein Degradation by Human Intestinal Bacteria. Microbiology 1986, 132, 1647–1656. [Google Scholar] [CrossRef] [PubMed] [Green Version]
  44. Kang, P.; Liu, Y.; Zhu, H.; Li, S.; Shi, H.; Chen, F.; Leng, W.; Pi, D.; Hou, Y.; Yi, D. The Effect of Aspartate on the Energy Metabolism in the Liver of Weanling Pigs Challenged with Lipopolysaccharide. Eur. J. Nutr. 2014, 54, 581–588. [Google Scholar] [CrossRef] [PubMed]
  45. Li, Z.; Wang, X.; Zhang, T.; Si, H.; Nan, W.; Xu, C.; Guan, L.; Wright, A.D.G.; Li, G. The Development of Microbiota and Metabolome in Small Intestine of Sika Deer (Cervus nippon) from Birth to Weaning. Front. Microbiol. 2018, 9, 4. [Google Scholar] [CrossRef] [PubMed] [Green Version]
  46. Xiao, S.; Li, Q.; Hu, K.; He, Y.; Ai, Q.; Hu, L.; Yu, J. Vitamin A and Retinoic Acid Exhibit Protective Effects on Necrotizing Enterocolitis by Regulating Intestinal Flora and Enhancing the Intestinal Epithelial Barrier. Arch. Med. Res. 2018, 49, 1–9. [Google Scholar] [CrossRef] [PubMed]
  47. Song, X.; Tan, L.; Wang, M.; Ren, C.; Guo, C.; Yang, B.; Ren, Y.; Cao, Z.; Li, Y.; Pei, J. Myricetin: A Review of the Most Recent Research. Biomed. Pharmacother. 2021, 134, 111017. [Google Scholar] [CrossRef]
  48. Li, D.; Lv, B.; Wang, D.; Xu, D.; Qin, S.; Zhang, Y.; Chen, J.; Zhang, W.; Zhang, Z.; Xu, F. Network Pharmacology and Bioactive Equivalence Assessment Integrated Strategy Driven Q-Markers Discovery for Da-Cheng-Qi Decoction to Attenuate Intestinal Obstruction. Phytomedicine 2020, 72, 153236. [Google Scholar] [CrossRef]
  49. Wilsher, N.E.; Arroo, R.R.; Matsoukas, M.T.; Tsatsakis, A.M.; Spandidos, D.A.; Androutsopoulos, V.P. Cytochrome P450 CYP1 Metabolism of Hydroxylated Flavones and Flavonols: Selective Bioactivation of Luteolin in Breast Cancer Cells. Food Chem. Toxicol. 2017, 110, 383–394. [Google Scholar] [CrossRef] [Green Version]
  50. Yan, J.; Zhang, G.; Pan, J.; Wang, Y. α-Glucosidase Inhibition by Luteolin: Kinetics, Interaction and Molecular Docking. Int. J. Biol. Macromol. 2014, 64, 213–223. [Google Scholar] [CrossRef]
  51. Shen, J.; Li, P.; Liu, S.; Liu, Q.; Li, Y.; Zhang, Z.; Yang, C.; Hu, M.; Sun, Y.; He, C.; et al. The Chemopreventive Effects of Huangqin-Tea against AOM-Induced Preneoplastic Colonic Aberrant Crypt Foci in Rats and Omics Analysis. Food Funct. 2020, 11, 9634–9650. [Google Scholar] [CrossRef] [PubMed]
  52. Ye, G.; Yang, B.C.; Gao, H.; Wu, Z.; Chen, J.; Ai, X.Y.; Huang, Q. Metabolomics Insights into Oleate-Induced Disorders of Phospholipid Metabolism in Macrophages. J. Nutr. 2021, 151, 503–512. [Google Scholar] [CrossRef] [PubMed]
  53. Shama, S.; Liu, W. Omega-3 Fatty Acids and Gut Microbiota: A Reciprocal Interaction in Nonalcoholic Fatty Liver Disease. Dig. Dis. Sci. 2020, 65, 906–910. [Google Scholar] [CrossRef] [PubMed] [Green Version]
  54. Wang, M.; Chen, Y.; Wang, Y.; Li, Y.; Zhang, X.; Zheng, H.; Ma, F.; Ma, C.W.; Lu, B.; Xie, Z.; et al. Beneficial Changes of Gut Microbiota and Metabolism in Weaned Rats with Lactobacillus acidophilus NCFM and Bifidobacterium lactis Bi-07 Supplementation. J. Funct. Foods 2018, 48, 252–265. [Google Scholar] [CrossRef]
Figure 1. (af) Effects of dietary intervention on serum markers. * Indicates statistical significance at p < 0.05.
Fermentation 08 00210 g001
Figure 2. Changes in weight (a) and intestinal length (b) in the mice. Alpha diversity index of gut microbiota in mice: (c) ACE index; (d) Shannon index. Changes in global gut microbiota after intervention in each group: (e) Beta diversity on weighted UniFrac. (f) NMDS score plot based on Bray–Curtis distance at the operational taxonomic unit (OTU) level. Stress < 2 means that NMDS can accurately reflect the degree of difference between groups.
Fermentation 08 00210 g002
Figure 3. Changes in the relative abundance of individual phyla (ac), genera (d,e), and species (fi) among groups. * Indicates statistical significance at p < 0.05. ** Indicates statistical significance at p < 0.01.
Fermentation 08 00210 g003
Figure 4. PCA score plots for the CK, F, FG, N, and NG groups in positive (a) and negative (b) mode.
Fermentation 08 00210 g004
Figure 5. PLS-DA score plots comparing the fecal metabolites between group pairings. R2Y and Q2Y represent the interpretation rate and predictive ability of the PLS-DA model. Higher R2Y than Q2Y values indicate that the PLS–DA model is stable.
Fermentation 08 00210 g005
Figure 6. KEGG pathways enrichment integrative analysis between groups: (a) N vs. CK; (b) NG vs. CK; (c) F vs. CK; (d) FG vs. CK.
Fermentation 08 00210 g006
Figure 7. KEGG pathways enrichment integrative analysis between groups: (a) F vs. N; (b) NG vs. N; (c) FG vs. G.
Fermentation 08 00210 g007
Figure 8. Significant associations between changes in metabolites and changes in abundance of species as measured by Spearman correlations: (a) N vs. CK; (b) NG vs. CK; (c) F vs. CK; (d) FG vs. CK.
Fermentation 08 00210 g008
Table 1. Fermentation quality of M. aquaticum.
Fermentation ConditionspHLactic Acid (μg/mL)Acetic Acid (μg/mL)Propionic Acid (μg/mL)Dry Matter (g/30 g)Crude Protein (%)NH3-N/N (%)Score
0 d30 °C5.56 ± 0.04 a0.11 ± 0.01 b43.7 ± 2.78 e1.84 ± 0.12 b8.44 ± 0.15 ab21.6 ± 0.38 ab3.30 ± 0.17 c00.0
35 °C5.56 ± 0.04 a0.11 ± 0.01 b43.7 ± 2.78 e1.84 ± 0.12 b8.44 ± 0.15 ab21.6 ± 0.38 ab3.30 ± 0.17 c00.0
1 d30 °C5.05 ± 0.02 b0.42 ± 0.05 b61.5 ± 9.70 cde2.06 ± 0.17 ab8.53 ± 0.12 ab21.8 ± 0.51 ab4.56 ± 0.32 bc40.0
35 °C5.08 ± 0.03 b0.42 ± 0.01 b51.9 ± 2.06 de2.20 ± 0.31 ab9.71 ± 0.94 a22.2 ± 0.90 ab4.68 ± 0.56 bc53.0
3 d30 °C4.34 ± 0.03 d1.09 ±0.35 a85.4 ± 23.7 bcd2.53 ± 0.87 ab8.26 ± 0.49 b21.0 ± 0.40 ab5.38 ± 0.12 ab56.9
35 °C4.26 ± 0.03 d1.13 ± 0.10 a92.0 ± 17.4 bc2.31 ± 0.13 ab8.48 ± 0.34 ab21.8 ± 0.90 ab5.69 ± 0.61 ab59.1
5 d30 °C4.11 ± 0.03 e1.11 ± 0.10 a110 ± 16.8 ab2.37 ± 0.16 ab9.18 ± 0.52 ab22.3 ± 0.40 a5.60 ± 0.37 ab76.4
35 °C4.22 ± 0.03 d1.16 ± 0.10 a94.8 ± 6.20 bc2.44 ± 0.47 ab8.40 ± 0.25 ab20.0 ± 0.75 b6.70 ± 0.33 a55.3
7 d30 °C4.43 ± 0.03 c1.24 ± 0.10 a114 ± 17.1 ab2.57 ± 0.35 ab8.70 ± 0.33 ab22.3 ± 0.78 a5.53 ± 1.41 ab73.0
35 °C4.42 ± 0.04 c1.22 ± 0.10 a117 ± 12.2 ab2.98 ± 0.48 a8.44 ± 0.34 ab21.3 ± 0.97 ab6.96 ± 0.52 a60.3
10 d30 °C4.45 ± 0.03 c1.08 ± 0.04 a135 ± 14.0 a2.82 ± 0.30 ab8.73 ± 0.78 ab21.5 ± 0.42 ab6.90 ± 0.07 a60.4
35 °C4.46 ± 0.03 c1.24 ± 0.04 a134 ± 12.0 a2.52 ± 0.23 ab8.99 ± 0.60 ab21.2 ± 1.22 ab6.91 ± 1.14 a62.3
a–e Means with different superscripts within the same row differ based on Tukey’s test (p < 0.05).
Table 2. Nutritional components of M. aquaticum and its fermentation products.
AnalysisNFMFMTrendsp-Value
Values Shown Per 100 g
Crude protein18.1 ± 1.20 g20.5 ± 0.80 g↑ 13.3%0.045 *
Lipids3.00 ± 0.14 g4.60 ± 0.22 g↑ 53.3%0.000 **
Ash12.4 ± 0.90 g15.9 ± 0.72 g↑ 28.2%0.006 **
Raw Fiber13.2 ± 0.80%11.2 ± 0.70%↓ 15.2%0.031 *
Phosphorus653 ± 6.00 mg657 ± 4.00 mg↑ <0.01%0.391
Calcium2.07 ± 0.03 g2.09 ± 0.04 g↑ <0.01%0.510
* Indicates statistical significance at p < 0.05. ** Indicates statistical significance at p < 0.01.
Table 3. Fold changes (FCs) in differential metabolites in mice after five weeks of feeding.
No.MetabolitesGroup N-CKGroup NG-CKGroup F-CKGroup FG-CKGroup F-NGroup NG-NGroup FG-F
FCSig.FCSig.FCSig.FCSig.FCSig.FCSig.FCSig.
1L-Aspartate2.010.042.100.042.060.042.090.031.02ns1.04ns1.02ns
2L-Threonine2.450.011.960.032.280.022.740.010.93ns0.80ns0.83ns
3Vitamin A3.50<0.014.53<0.0186.4<0.0110.35<0.0124.70.031.30ns8.35ns
4Myricetin3.430.016.39<0.0173.2<0.0197.5<0.0121.3<0.011.86ns0.75ns
5Gallic acid3.23<0.015.56<0.0116.7<0.019.09<0.015.160.031.72ns0.54ns
6Luteolin4.21<0.015.03<0.019.49<0.018.70<0.012.260.031.19ns1.09ns
7LPG 18:10.310.020.52ns0.18<0.010.81ns0.60ns1.700.024.46<0.01
89-oxo-ODA1.01ns0.70ns0.72ns1.12ns0.71ns0.69ns1.560.049
ns: no significance.
Publisher’s Note: MDPI stays neutral with regard to jurisdictional claims in published maps and institutional affiliations.

