Article

Optimization of cis-9-Heptadecenoic Acid Production from the Oleaginous Yeast Yarrowia lipolytica

1
TIMR (Integrated Transformations of Renewable Matter), Centre de Recherche Royallieu, Université de Technologie de Compiègne, ESCOM—CS 60319, CEDEX, 60203 Compiègne, France
2
Laboratoire CTA, UR TVA, Centre d’Analyses et de Recherche, Faculté des Sciences, Université Saint-Joseph, Beyrouth 1104 2020, Lebanon
3
Micalis Institute, INRAE, AgroParisTech, Université Paris-Saclay, 78350 Jouy-en-Josas, France
*
Authors to whom correspondence should be addressed.
Submission received: 2 May 2022 / Revised: 18 May 2022 / Accepted: 20 May 2022 / Published: 25 May 2022
(This article belongs to the Special Issue Yeast, Biofuels, and Value-Added Products)

Abstract

:
Odd-chain fatty acids (OCFA) have been studied for their therapeutic and nutritional properties, as well as for their potential use in the chemical industry for the production of biofuel. Genetic modification strategies have demonstrated an improved production of OCFA by oleaginous microorganisms. In this study, the production of OCFA-enriched lipids by fermentation using a genetically engineered Yarrowia lipolytica strain was investigated. The major fatty acid produced by this strain was the cis-9-heptadecenoic acid (C17:1). Its biosynthesis was optimized using a design of experiment strategy involving a central composite design. The optimal responses maximizing the cell density (optical density at 600 nm) and the C17:1 content (%) in lipids were found using 52.4 g/L sucrose, 26.9 g/L glycerol, 10.4 g/L sodium acetate, 5 g/L sodium propionate, and 4 g/L yeast extract. Under these conditions, in a 5 L scale bioreactor, the respective contents of lipids and C17:1 in culture medium were 2.52 ± 0.05 and 0.82 ± 0.01 g/L after 96 h fermentation. The results obtained in this work pave the way toward the process upscale of C17:1 and encourage its industrial production.

1. Introduction

Nowadays, microbial oils, also called single cell oils (SCOs), are considered promising renewable alternatives to fossil fuels and can be used for the production of biofuels or oleochemicals [1,2]. They present multiple advantages over plant oils or animal fats, such as non-competitiveness with the food crops, no influence of seasonal changes, and high scalability [3].
SCOs are produced by oleaginous microorganisms, such as yeast, bacteria, and microalgae [4,5]. The cultivation of microalgae is relatively costly and results in low biomass concentration [6]. In addition, the available data for the transformation strategies to engineer reliable models of algal strains capable of producing high lipid yields are still insufficient [7]. Moreover, the use of bacteria for oil production is also limited, since they accumulate lipids in their membrane, which makes the extraction of oil difficult [8]. Therefore, among the oleaginous microorganisms, yeasts are the most favorable in terms of oil production and accumulation.
Yarrowia lipolytica is a non-conventional oleaginous yeast that is grown in various types of substrates to produce value-added compounds, such as lipids [9], organic acids [10], alkanes [11], and polyalcohols [12]. In addition, Y. lipolytica has a well-studied genome and metabolism that allow the engineering of high lipid accumulation strains [13]. Therefore, for some engineered strains, lipid accumulation in Y. lipolytica can reach up to 80% dry weight basis [14].
Despite the consequent achievements in improving oil production by Y. lipolytica, its industrial exploitation is still facing the high cost of substrates and both upstream and downstream costly processing steps. To overcome the cost drawback, one of the solutions was to redirect the fatty acid synthesis toward the production of unusual and high-value-added fatty acids, such as odd-chain fatty acids (OCFA) [15,16]. The occurrence of OCFA in nature is very scarce despite their multiple applications (e.g., precursors for several compounds, such as biocides, plasticizers, and industrial chemicals) and the health-related benefits that make them be on the verge of commercialization [16,17,18]. In a recent work, Y. lipolytica was engineered to produce OCFA by using sodium propionate as precursor [16]. It was demonstrated that the deletion of the PHD1 gene, encoding the 2-methylcitrate dehydratase in the methyl citrate cycle, prevented the degradation of propionyl-CoA, which promotes the production of OCFA. Producing OCFA was also successful in other microorganisms, which was well summarized in a recent review paper [19]. Among OCFA, the cis-9-heptadecenoic acid (C17:1) and its salts have been described as high-value-added compounds known for their anti-inflammatory effects and their efficacy in treating prophylaxis, psoriasis, allergies, and autoimmune diseases [17,20].
Due to the high potential of C17:1, the purpose of this study was to improve its production by fermentation using an engineered strain of Y. lipolytica. Experimental design methodology was used, meaning a central composite design for the study of five factors, including carbon and nitrogen substrates. Optimal conditions were tested and validated using a 5 L bioreactor.

2. Materials and Methods

2.1. Oleaginous Yeast Strain

The oleaginous yeast strain Y. lipolytica JMY7877 used in this study was constructed from OCFA-producing strain, JMY7780 [21]. The strain was further engineered for the utilization of sucrose by overexpressing two genes (SUC2 and HXK1). This allows its ability to metabolize sucrose-rich industrial by-products, such as sugar beet and sugar cane molasses, which may contribute to reducing the production cost. In order to remove selective markers in JMY7780 strain, the Cre-lox system was used with JME547 plasmid (pUB-Cre-Hygro) [22]. After removing URA3 and LEU2 marker genes in JMY7780 strain, two gene expression cassettes, invertase SUC2 from Saccharomyces cerevisiae (JME2347, JMP62-LEU2 ex-pTEF-ScSUC2-Tlip2 [23]), and hexokinase HXK1 from Y. lipolytica (JME2103, JMP62-URA3 ex-pTEF-YlHXK1-Tlip2 [24]) were introduced to the genome of Y. lipolytica, resulting in the JMY7877 strain (Table 1. The integration of gene expression cassettes was verified by colony PCR with specific primer pairs (SUC2, pTEF-internal-Fw/SUC2-internal-Rev; HXK1, pTEF-internal-Fw/HXK1-internal-Rev) (Table 2).

2.2. Culture Conditions

2.2.1. Growth Media Composition

Growth media was composed of sucrose and glycerol as main carbon substrates, yeast extract as organic nitrogen substrate, ammonium chloride as inorganic nitrogen substrate, sodium acetate as precursor of acetyl-CoA, sodium propionate as precursor of propionyl-CoA for OCFA synthesis, and saline solution 1x (for 1000x concentration, the composition was the following for 1 L added, in the order: H3PO4 85% liquid: 107 g, water: 650 mL, KCl: 20 g, NaCl: 20 g, MgSO4.7H2O: 27 g, ZnSO4.7H2O: 7.7 g, MnSO4.H2O: 0.47 g, CoCl2.6H2O: 0.3 g, CuSO4.5H2O: 0.6 g, Na2MoO4.2H2O): 0.094 g, H3BO: 0.3 g, water up to 1 L).
Na2HPO4 (0.05 M) and KH2PO4 (0.05 M) were added to the media to adjust the pH to 6 when the cultures were performed in Erlenmeyer flasks, whereas for the cultures performed in the bioreactor, the pH was adjusted automatically using NaOH (1 M) and H2SO4 (1 M).

2.2.2. Yeast Culture in Erlenmeyer Flasks (Design of Experiment)

A central composite experimental design was used to optimize the concentrations of five variables (substrates concentrations): sucrose (X1, (20–100) g/L), pure glycerol (X2, (10–50) g/L), sodium acetate (X3, (10–30) g/L), sodium propionate (X4, (3–7) g/L), and yeast extract (X5, (1–5) g/L). The ranges of concentrations were set according to a previous screening design (not shown in this work). The responses studied for this experimental design were the maximization of the cell density (optical density (OD) at 600 nm) (Y1) and the C17:1 content (%) in lipids (Y2). The central composite design (25−1 + star) resulted in 26 experimental points (16 points of the fractional factorial design and 10 star points), 4 center points (repetitions for the statistical analysis), and 6 test points for the validation of the models. Considering 5 variables and 2 responses, the experimental data were fitted to obtain a second-degree regression model with the form of Equation (1):
Y = b 0 + i = 1 5 b i X i + i = 1 4 j = i + 1 5 b ij X i X j + i = 1 5 b ii X i 2         with   j > i
where Y is the predicted response, Xi refers to the variables from 1 to 5, b0 is the constant coefficient, bi refers to the linear term coefficients, bij presents the interaction term coefficients, and bii presents the quadratic effect term coefficients. The analyses of the experimental design, the optimal path, and the desirability functions to reach the optimal composition of the fermentation medium were performed using NEMRODW software (v.2017). The general scheme of experiments is presented in Figure 1.
The fermentation experiments of the experimental design were performed in 500 mL Erlenmeyer flasks, each containing 100 mL of culture medium. In addition to the five variables studied, NH4Cl (0.5 g/L) and saline solution 1 × (0.1 mL/100 mL) were added to each flask. These concentrations were kept constant for all the experiments according to a screening design performed prior to this study and demonstrating no impact of these constituents, when varying their concentrations, on growth and C17:1 content (%).
Inoculation of the culture media was performed by adding 2 mL of a stock cell culture (prepared from one colony in a modified YPD medium (sucrose 20 g/L, yeast extract 10 g/L, peptone 20 g/L, KH2PO4 0.05 M, and Na2HPO4 0.05 M) to each flask (initial OD600nm = 0.08 ± 0.01), 24 h incubation at 170 rpm and 28 °C, and storage at −80 °C in 25% glycerol). The Erlenmeyer flasks of the experimental design (performed 12 by 12) were incubated in a shaker at 28 °C, 170 rpm agitation, and for 96 h. Samples were taken periodically from each flask to measure cell density at 600 nm using a cell density meter (Ultrospec 10, Biochrom). C17:1 content analysis, recovered from cells, was performed by centrifuging 1 mL of each sample for 10 min at 13,500 rpm (Micro Star 12, VWR, Rosny-Sous-Bois, France). All the pellets were washed 3 times with 1 mL ultrapure water, followed by centrifugation under the same conditions. After freeze drying (Alpha 1–4 LD Plus, Martin Christ, Osterode am Harz, Germany) for 3 days, all the pellets were processed for lipid extraction and fatty acid composition analysis.

2.2.3. Yeast Culture in Bioreactor

The optimal conditions giving the maximal cell density and C17:1 content found using the experimental design were first verified using 500 mL Erlenmeyer flasks (100 mL culture volume) over 96 h, at 28 °C temperature and 170 rpm agitation, and then up-scaled to a 5 L bioreactor (Biostat B Plus, Sartorius Stedim Biotech, Göttingen, Germany). The twin bioreactors each containing 4.75 L of the culture medium were first sterilized at 121 °C for 20 min using an HMC HV 110L autoclave (HMC Europe GmbH, Tüßling, Germany). After cooling down to 28 °C, saturating the medium with oxygen, and calibrating the pH to 6, a volume of 250 mL mid-exponential-phase pre-cultures (each cultivated for 24 h in a 1 L Erlenmeyer flask, as described in Section 2.2.1) was added to inoculate the medium. The temperature was maintained at 28 °C using a double jacket and circulating cooling water, whereas the agitation speed and the air flow rate were set to 400 rpm and 2.5 L/min, respectively (the values were set in order to avoid foam formation). During fermentation, samples were taken from the bioreactor and used to determine cell density (OD600nm) and C17:1 content (%) in lipids. A non-inoculated medium was used for the blank of the spectrophotometer and for the dilution of the samples to measure the OD600nm. In addition, 1 mL of each sample was centrifuged for 10 min at 13,500 rpm. The supernatant was stored at −20 °C and used later to determine the substrates consumption kinetics, whereas the pellet was washed with 1 mL ultrapure water, freeze dried, and used to quantify the biomass dry weight and the C17:1 content in lipids.

2.3. Determination of Substrate Consumption during Fermentation

The concentrations of glycerol, sucrose, glucose, and fructose (generated from sucrose hydrolysis by the action of the extracellular invertase produced by the yeast), as well as sodium acetate and sodium propionate, were determined by HPLC using an Agilent 1260 Infinity II system equipped with an Aminex HPX-87H column coupled to a refractive index (RI) detector. The mobile phases used were ultrapure water for the analysis of sugars and glycerol, and sulfuric acid (5 mM) for the analysis of sodium acetate and sodium propionate in isocratic mode with a flow rate of 0.6 mL/min. The temperature of the column was fixed at 35 °C. For all analyses, the samples were filtered before injection using 0.45 µm filters, diluted in ultrapure water (for sugars and glycerol quantification) and in sulfuric acid (5 mM) (for sodium acetate and sodium propionate quantification), and injected with a volume of 10 µL. The compounds’ assignation and quantification were performed using pre-established standard curves of glycerol, sucrose, glucose, fructose, sodium acetate, and sodium propionate.

2.4. Lipid Extraction and Fatty Acids Analysis

2.4.1. Lipid Extraction from Y. lipolytica Biomass

Yeast biomass samples (taken during fermentation) obtained after freeze drying were weighted and used to extract the accumulated lipids. For each sample, an amount of ≈30 mg dry biomass was introduced into a 2 mL screw tube in the presence of two stainless-steel beads (4.9 mm diameter). Lipid extraction was performed by adding 1 mL of cyclohexane/isopropanol mixture (2:1, v:v), followed by cell disruption for 5 min at 30 Hz using a bead miller (Retsch MM400, Haan, Germany). After centrifugation for 15 min at 13,500 rpm (MicroStar12 centrifuge, VWR, Rosny-Sous-Bois, France), the supernatant was transferred to a 10 mL glass tube, and the extraction was repeated twice under the same conditions. The supernatants collected (3 mL) were evaporated under nitrogen flow at 60 °C, and the extracted lipid was subjected to transmethylation.
In addition, lipid content (dry weight basis) accumulated in yeasts after 96 h fermentation conducted in the 5 L bioreactors was determined using Soxhlet’s method, as previously reported [25]. Briefly, 5 g of lyophilized biomass was grinded in the bead miller (Retsch MM400, Haan, Germany) for 3 × 5 min at 30 Hz and then washed with 250 mL n-hexane for 24 h. After evaporation of n-hexane at 60 °C and reduced pressure using a rotary evaporation system, oil content (%) was determined, according to Equation (2).
O i l   c o n t e n t   ( % ) = m a s s   o f   r e c o v e r e d   o i l   m a s s   o f   t h e   s a m p l e   × 100

2.4.2. Preparation and Quantification of Fatty Acid Methyl Esters (FAMEs)

For each tube containing the extracted lipids, 300 μL toluene (Carlo Erba, Val-de-Reuil, France) and 1 mL methanolic HCl (3 M) (Sigma Aldrich, Saint-Quentin-Fallavier, France) were added. After flushing with nitrogen to avoid oxidation, the tubes were tightly capped and placed in an oven at 80 °C for 2 h for the transmethylation process. The reaction was then stopped by adding 500 µL sodium bisulfite (Acros Organics, Fisher Scientific France, Illkirch, France) (5% w/v in water), and the samples were vortexed for 10 s. To extract FAMEs, 1.7 mL cyclohexane (Carlo Erba, Val-de-Reuil, France) was added, followed by rigorous vortexing for 1 min and centrifugation for 2 min at 2000 rpm. From the upper phase containing FAMEs, 100 µL was taken, evaporated under nitrogen flow at room temperature, and resuspended in 1 mL cyclohexane.
FAMEs were analyzed using gas chromatography equipment (Agilent Technologies 7890A, Les Ulis, France) coupled with a flame ionization detector (GC-FID). The GC oven equipped with a capillary column 50% cyanopropyl-50% methyl polysiloxane (60 m × 320 μm × 0.25 μm) was first set at 150 °C and held for 2 min, and then increased to 220 °C at a ramp of 1.5 °C/min and held for 30 min. Helium was used as carrier gas at a flow rate of 30 mL/min, and injection volume was 2 µL. Standard solutions of cis-9-heptadecenoic acid (Cayman Chemical Company, Ann Arbor, MI, USA), cis-10-nonadecenoic acid (Merck, Fontenay Sous Bois, France), methyl nonadecanoate (Merck, Fontenay Sous Bois, France), and Supelco 37 FAME mix (Merck, Fontenay Sous Bois, France) containing, among others, cis-10-heptadecenoic acid, were used to determine the retention time of FAMEs. The standards ordered in the acid form were transmethylated, similarly to the extracted lipids.

2.5. Statistical Analyses

One-way analysis of variance (ANOVA) was used to determine the significant differences using StatPlus V6 software for Macintosh systems.

3. Results and Discussion

3.1. Impact of the Fermentation Conditions on Yeast Growth and C17:1 Biosynthesis

3.1.1. Models’ Validation and Fitting

The central composite design was used for the optimization of the culture conditions of Y. lipolytica. Two responses were maximized: cell density (OD600nm) and % of C17:1 in lipids. Table 3 presents the experimental conditions, as well as the measured responses of the experimental design.
The experimental plan was validated using the test points corresponding to the experiments 31–36. The analysis of the residues showed non-significant differences between the measured responses and the predicted ones (Table 4). The measured responses of the test points were then included in the models provided using NEMRODW software as follows (* means significant coefficient):
YCell density (OD600 nm) = 13.95 − 0.53 X1 − 0.44 X2 + 0.84 X3 − 0.6 X4 + 1.64 X5 − 0.11 X1 × X2 −0.23 X1 × X3 − 0.11 X1 × X4 − 0.09
X1 × X5 − 0.25 X2 × X3 − 0.07 X2 × X4 − 0.24 X2 × X5 + 0.15 X3 × X4 − 0.32 X3 × X5 − 0.08 X4 × X5 + 0.62* (X1)2 + 0.68 (X2)2 + 0.39
(X3)2 + 0.74 (X4)2 + 0.02 (X5)2
Y%C17:1 = 32.19 − 0.46 X1 − 0.96 X2 − 3.27 X3 + 2.11 X4 − 1.73 X5 + 0.52 X1 × X2 − 0.2 X1 × X3 + 0.77 X1 × X4 − 0.39 X1 × X5
0.11 X2 × 3 + 0.41 X2 × X4 + 0.37 X2 × X5 + 0.39 X3 × X4 − 0.1 X3 × X5 − 0.11 X4 × X5 − 0.95 (X1)2 − 1.25 (X2)2 − 0.68 (X3)2 − 1.40
(X4)2 + 0.17 (X5)2
According to the Pareto charts presented in Figure 2a,b, all the constituents had significant linear effects for both response parameters OD600nm and C17:1. Figure 2a shows negative linear effects and positive quadratic effects for sucrose, glycerol, and sodium propionate, while sodium acetate and yeast extract had positive linear effects without any quadratic effects. Figure 2b shows negative linear effects and negative quadratic effects for sucrose and glycerol, a positive linear effect and a negative quadratic effect for sodium propionate, while sodium acetate and yeast extract had negative linear effects without any quadratic effects. The inserts in Figure 2b illustrate the variations of OD600nm and C17:1, respectively, according to each constituent between the low level (−1) and the high level (+1); the other constituents are fixed at the central level (0). Furthermore, Figure 2 does not show any significant interaction effects between the constituents.
In addition, the two inserts of Figure 2a,b demonstrate that sucrose and glycerol had nearly the same effect on the two response parameters OD600nm and % of C17:1. In this sense, the increase in these two constituents led to a decrease in the growth of microorganisms (OD600nm) and in the production of C17:1. The other three constituents had an opposite effect on the two response parameters: the increase in sodium acetate and yeast extract increased the OD600nm and lowered their oil content, while the increase in sodium propionate decreased the OD600nm and increased oil production.
Results of ANOVA (Table 5 and Table 6) show that there are significant differences (p < 0.05) between the regression and the residue, whereas no significant differences (p > 0.05) were observed between the lack of fit and the pure error. These results reveal the validation of the models reported in Equations (3) and (4). In addition, the R2 values were equal to 0.942 and 0.969 for the responses of cell density (OD600nm), and C17:1 content, respectively, indicating a good fit of the models.

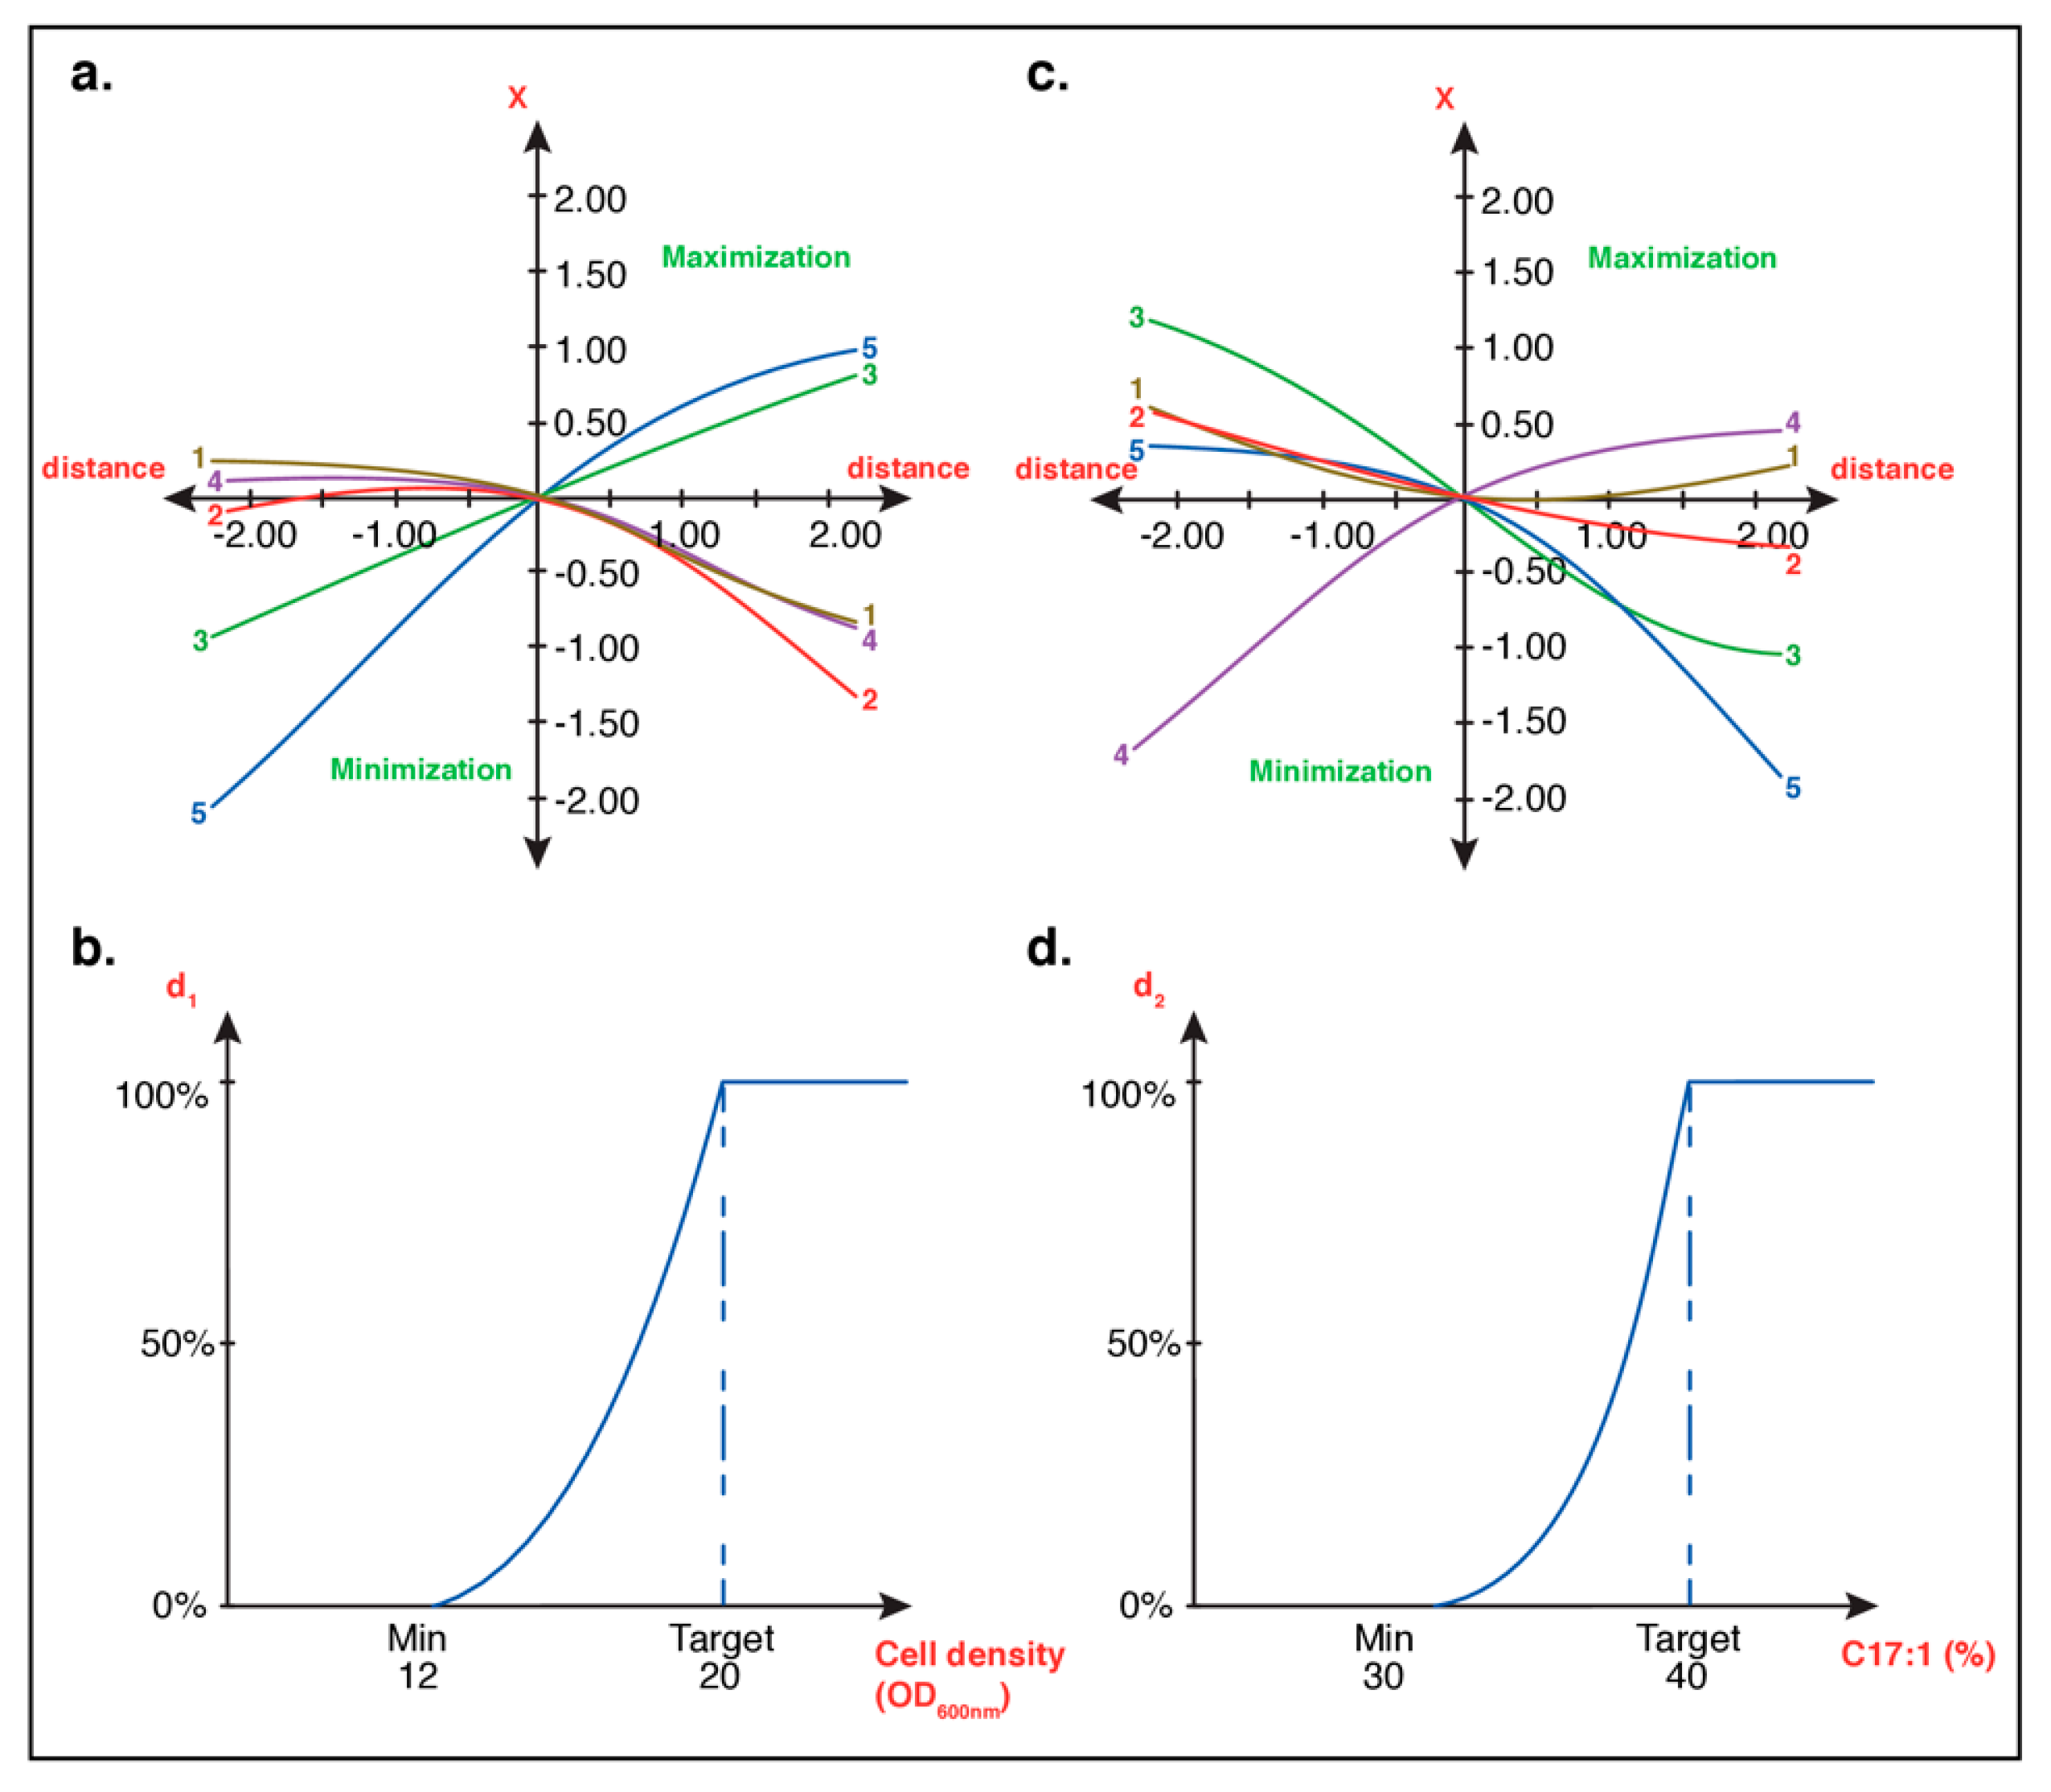
3.1.2. Optimal Culture Conditions Analyses

As mentioned before, the objectives of the current study were the maximization of both cell density (OD600nm) and C17:1 content (%) in lipids. The optimal paths provided by NEMRODW software for each response are given in Figure 3.
Figure 3 shows that the maximization of cell density requires an increase in the concentrations of sodium acetate (factor 3) and yeast extract (factor 5), and a decrease in the concentrations of sucrose (factor 1), glycerol (factor 2), and sodium propionate (factor 4). On the other hand, the maximization of C17:1 content requires an increase in the concentrations of sucrose (factor 1) and sodium propionate (factor 4), and a decrease in the concentrations of glycerol (factor 2), sodium acetate (factor 3), and yeast extract (factor 4). It should be noted that yeast extract is a source of nitrogen that favors cell growth and limits the accumulation of lipids. Several review papers have shown that TAG lipogenesis begins when a non-carbon nutrient, such as phosphorus, oxygen, sulfur, and especially nitrogen, becomes growth limiting [26,27,28,29,30,31].
During nitrogen starvation, the activation of lipogenesis begins with a decrease by ≈95% in the concentration of adenosine monophosphate (AMP) due to an increase in the activity of AMP deaminase. This decrease in AMP is accompanied by the deactivation of the AMP-regulated mitochondrial isocitrate dehydrogenase ICDH (NAD+), which creates an excess of mitochondrial citrate. This metabolite will then be transported from the mitochondria to the cytosol and will serve as a substrate for the production of cytosolic acetyl-CoA by ATP-citrate lyase (ACL) [32,33]. Similarly, increasing both the concentrations of sucrose and glycerol contributes to decreasing cell growth. This is probably due to an increase in osmotic pressure, which can affect oxygen uptake by the cells and decrease the culture growth [34,35,36,37,38]. This fact was previously reported by many authors. For instance, a decrease in the growth rate of Saccharomyces cerevisiae was observed when the concentration of glucose was increased from 200 g/L to 300 g/L [39]. Similarly, the impact of sugar concentration on both biomass accumulation and lipid content in Trichosporon fermentans was studied [40]. It was reported that the highest values were obtained using 15% total sugar concentration. Beyond it, a decrease in biomass accumulation and lipid content was observed. In addition, when Y. lipolytica Po1g was cultivated in defatted rice bran hydrolysate with sugar concentrations varying from 20 g/L to 40 g/L, the maximum biomass accumulation and lipid content were obtained at 30 g/L. Further rise in the total sugar concentration inhibited the growth of yeast and resulted in lower lipid content [41]. Similar trend was reported for glycerol concentration. For example, the growth of oleaginous yeast Candida viswanathii Y-E4 was limited when glycerol concentration exceeded 15% in the fermentation medium [42].
On the other hand, sodium acetate and sodium propionate are the respective precursors of acetyl-CoA and propionyl-CoA. Increasing the concentration of sodium acetate will contribute to a decrease in OCFA; however, it is required to constitute the fatty acid backbone and for the synthesis of lipids in the cell membranes, whereas increasing the concentration of sodium propionate will contribute to increasing the content in OCFA, but it will reduce cell growth due to its toxicity at high concentrations. For example, it has been shown in a previous study that propionate had an inhibitory effect on the growth of Y. lipolytica JMY2900 when its concentration exceeded 10 g/L [16]. In another work, the strain Y. lipolytica CICC31596 was more sensitive to the presence of propionate and had an inhibitory effect at 5 g/L [43]. Due to the abovementioned observations, a compromise must be made to determine the optimal concentrations of the different compounds constituting the culture medium. For this purpose, the desirability function was used in NEMRODW software to find the optimal conditions allowing maximizing both cell density (OD600nm) and the content in C17:1 (Figure 2). The optimal substrates concentrations generated are the following: (sucrose) = 52.4 g/L, (glycerol) = 26.9 g/L, (sodium acetate) = 10.4 g/L, (sodium propionate) = 5 g/L, and (yeast extract) = 4 g/L. They correspond in coded variables to X1 = −0.386, X2 = −0.305, X3 = −1.92, X4 = 0.044, and X5 = 1.012, respectively. Under these conditions, the predicted responses are: cell density (OD600nm) = 16.3 ± 1.54 and C17:1 content (%) = 34.7% ± 2.31.

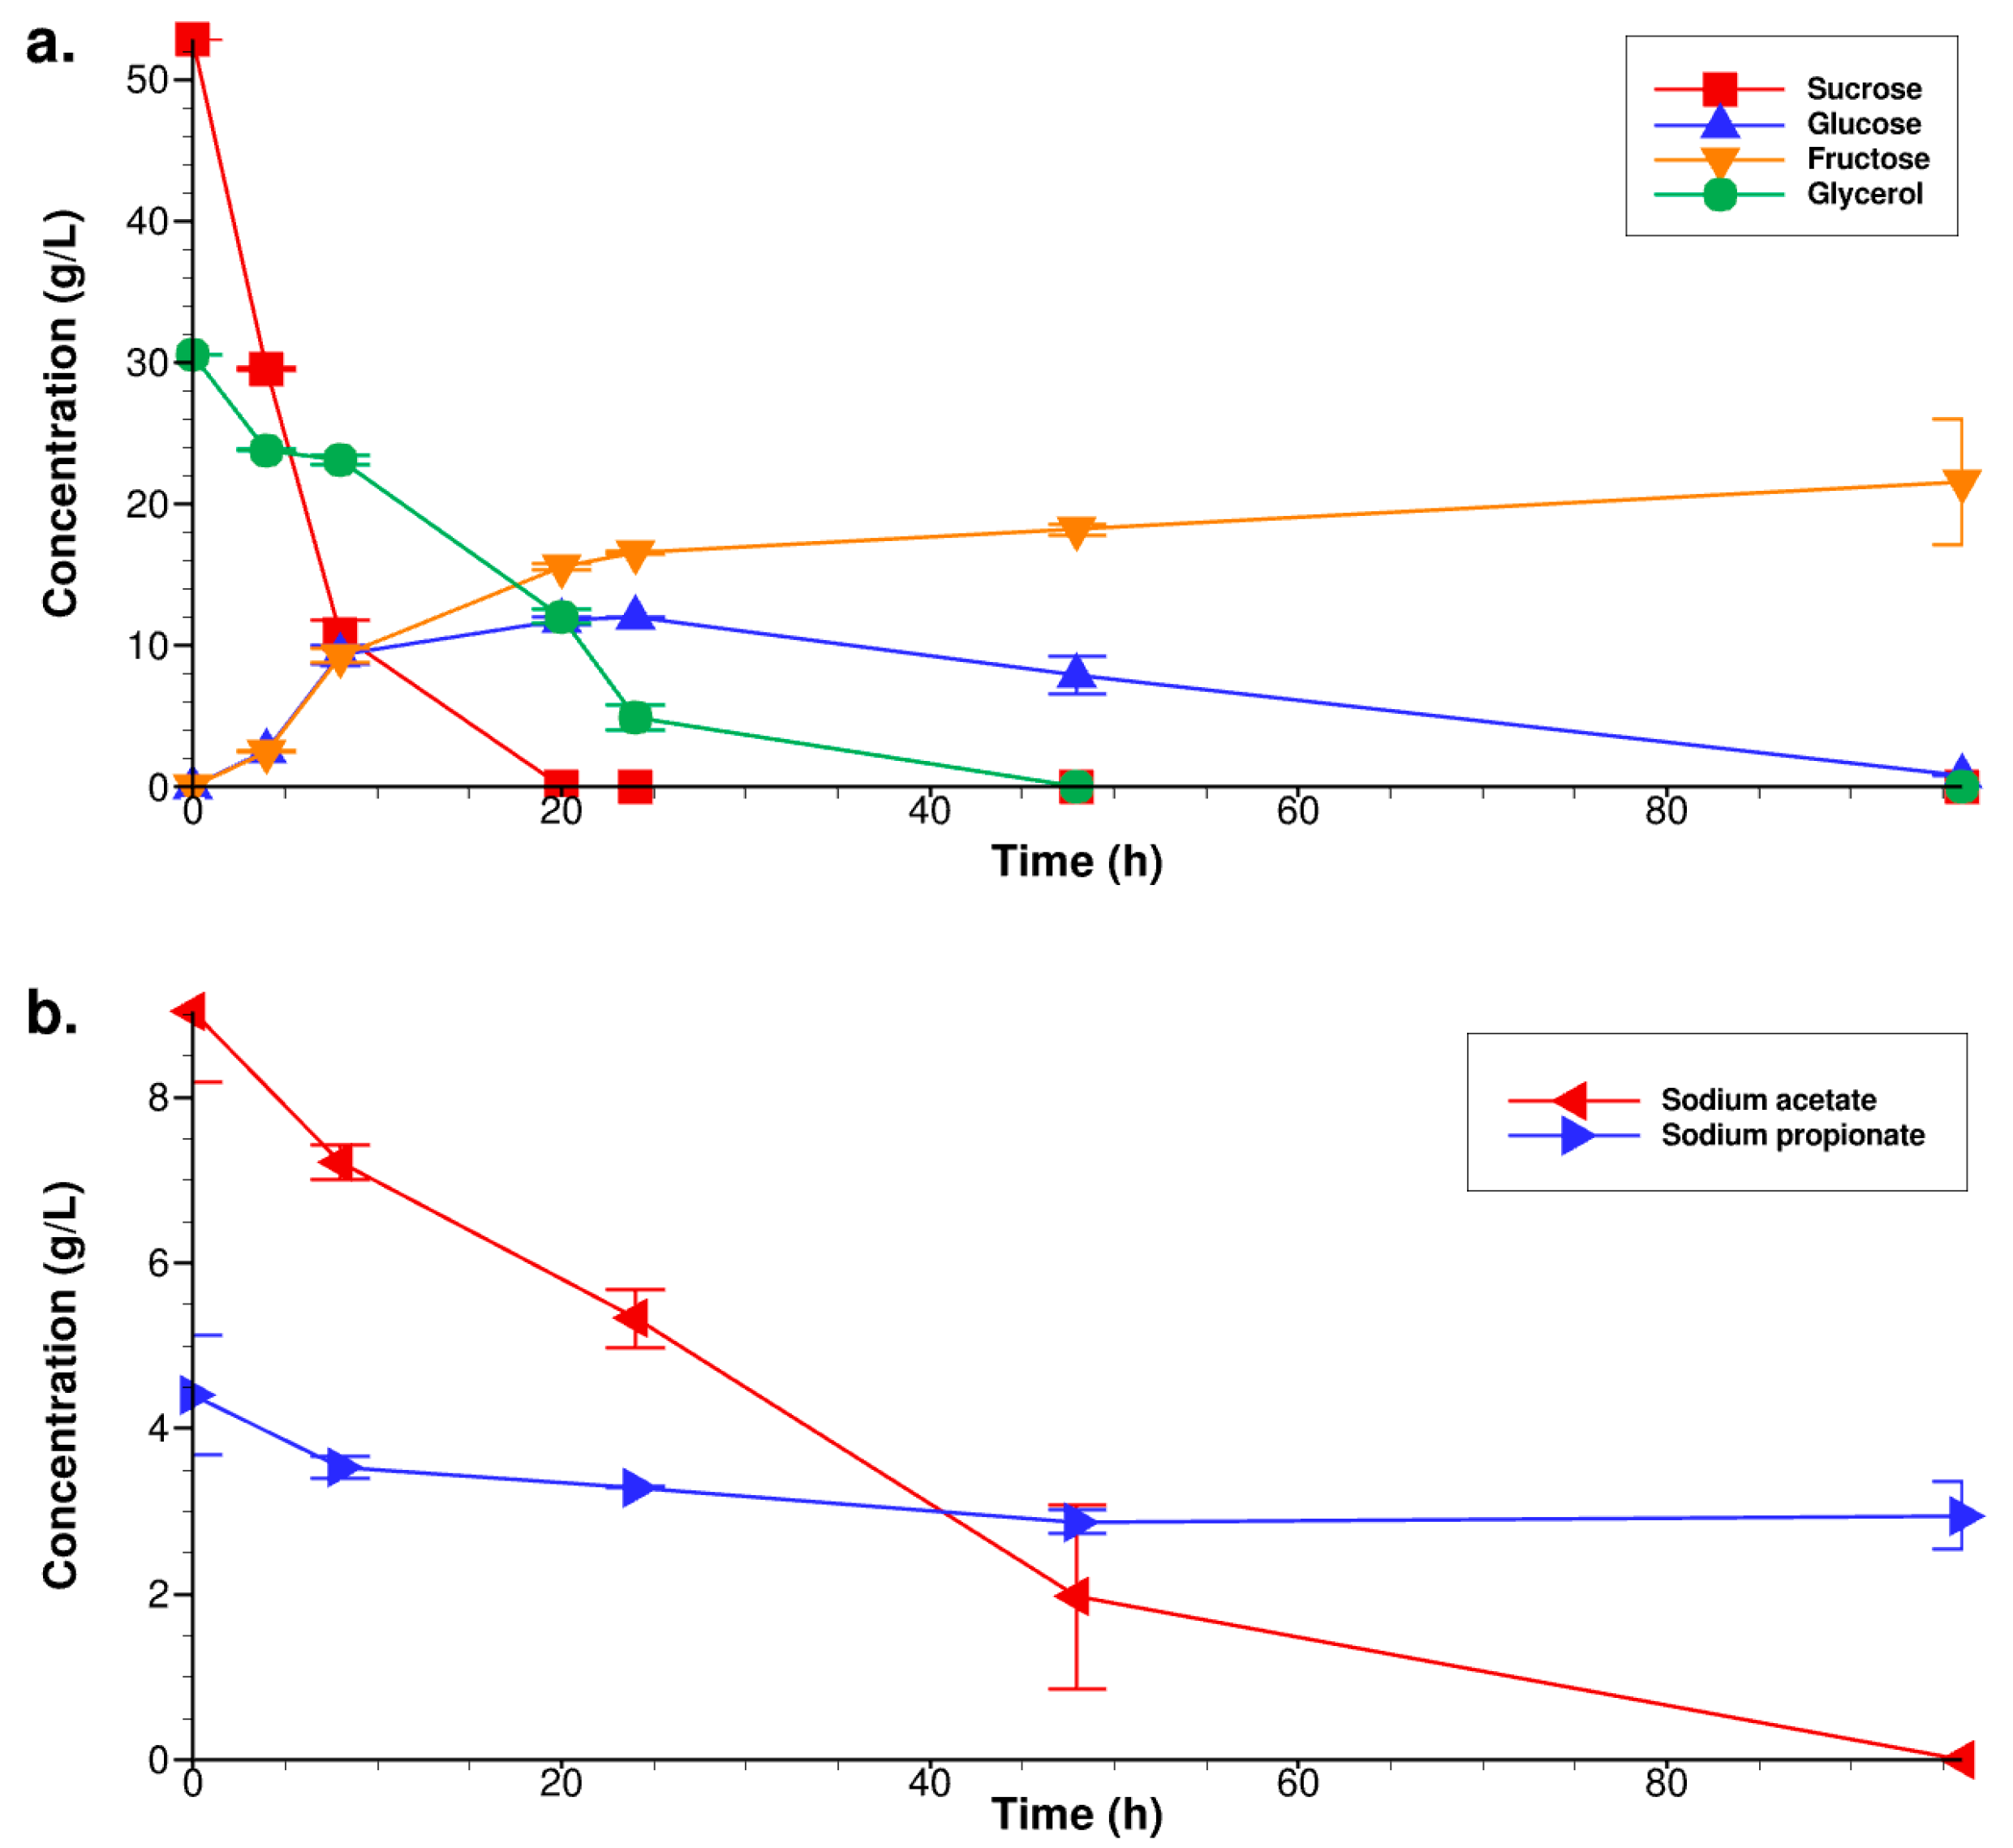
3.2. Fermentation under the Optimal Culture Conditions

The validation of the optimal culture conditions was performed by conducting fermentations using the optimal substrates’ concentrations, first in 500 mL Erlenmeyer flasks (100 mL culture medium) and then in continuous stirred-tank bioreactors (5 L culture medium). After 96 h of fermentation, the measured cell density (OD600nm) was 17.86 ± 0.34 in Erlenmeyer flasks and 17.52 ± 0.28 in the bioreactor. These values concur with the predicted ones found using NEMRODW (16.3 ± 1.54), showing no significant differences. The concentrations of glycerol, sucrose, glucose, fructose, sodium acetate, and sodium propionate were determined during fermentation in 5 L bioreactors up to 96 h (Figure 4).
Results show that sucrose was actively hydrolyzed by the secreted invertase in the medium to generate glucose and fructose. The strain used, JMY7877, showed more affinity to glucose rather than fructose, as it was completely consumed after 96 h fermentation, whereas the concentration of fructose remained relatively high, at ≈20 g/L. The same behavior of glucose consumption was observed for glycerol and sodium acetate, which were completely consumed after 48 h and 96 h of fermentation, respectively. However, the consumption of sodium propionate was lower, reaching ≈3 g/L in the medium after 96 h fermentation. Increasing the membrane transport of fructose and sodium propionate by genetic engineering could be a potential way to improve cell growth and lipid accumulation in yeast.
Lipid content after 96 h of fermentation in 5 L bioreactors, analyzed using the Soxhlet method, was 2.52 ± 0.05 g/L of the culture medium. Fatty acid composition was also analyzed using the lyophilized biomass (Table 7). The results obtained showed non-significant differences between the cultures performed in Erlenmeyer flasks and in 5 L bioreactors. The respective C17:1 content in lipids was 31.62% ± 1.15 and 31.62% ± 0.94, which was non-significantly different (p < 0.05) from the predicted value found using NEMRODW software (34.7% ± 2.31). The C17:1 obtained was higher than that reported by Zhang et al. (the highest value reported was 26.42% ± 0.03) [44] and lower than that reported by Kolouchová et al. (37% but low lipid content of 0.23 g/L) [45]. OCFA content in both cultures represents ≈ 60% of the total fatty acids in lipids, which corresponds to ≈ 1.5 g/L of culture medium. In a recent work, Park et al. (2021) found 1.87 g OCFA/L of culture medium; however, the fermentation time was longer (192 h) compared to one used in this study (96 h), and the main carbon source was glucose.

4. Conclusions

In this study, the production of cis-9-heptadecenoic acid (C17:1) by Y. lipolytica was optimized using a central composite design. When performing the experiments in 5 L bioreactors, and after 96 h fermentation using the optimal composition, the respective concentrations of lipids and OCFA were 2.52 g/L and 1.5 g/L of the culture medium. The content of C17:1 in lipids was 0.82 g/L of the culture medium. Further process improvements could be attained by either performing the experiments in fed-batch mode or using longer fermentation time (accumulating higher lipid content in the cells). Replacing pure sucrose and glycerol with low-cost by-products, obtained from the sugar industry and from oil biorefinery, respectively, will further reduce the production cost. In addition, genetic engineering modifications, such as improving the membrane transport of fructose and propionate, may lead to improved lipid and OCFA contents in yeast cells.

Author Contributions

Conceptualization, M.K. and J.-M.N.; methodology, W.A.S., S.E.K. and Y.-K.P.; software, N.L.; validation, M.K., N.L. and S.E.K.; investigation, M.K. and S.E.K.; writing—original draft preparation, M.K., S.E.K. and W.A.S.; writing—review and editing, M.K., N.L., J.-M.N., Y.-K.P., S.E.K., A.K. and W.A.S.; supervision, M.K.; funding acquisition, M.K. All authors have read and agreed to the published version of the manuscript.

Funding

This work was performed within the project YaLiOl supported by the ANR grant “ANR-20-CE43-0007” of the French National Research Agency (ANR) in France.

Institutional Review Board Statement

Not applicable.

Informed Consent Statement

Not applicable.

Conflicts of Interest

The authors declare no conflict of interest.

References

  1. Abghari, A.; Chen, S. Yarrowia lipolytica as an Oleaginous Cell Factory Platform for Production of Fatty Acid-Based Biofuel and Bioproducts. Front. Energy Res. 2014, 2, 21. [Google Scholar] [CrossRef]
  2. Koubaa, M.; Imatoukene, N.; Drévillon, L.; Vorobiev, E. Current Insights in Yeast Cell Disruption Technologies for Oil Recovery: A Review. Chem. Eng. Process.-Process Intensif. 2020, 150, 107868. [Google Scholar] [CrossRef]
  3. Li, Q.; Du, W.; Liu, D. Perspectives of Microbial Oils for Biodiesel Production. Appl. Microbiol. Biotechnol. 2008, 80, 749–756. [Google Scholar] [CrossRef] [PubMed]
  4. Cohen, Z.; Ratledge, C. Single Cell Oils: Microbial and Algal Oils; AOCS Press: Champaign, IL, USA, 2010; ISBN 978-1-893997-73-8. [Google Scholar]
  5. Thevenieau, F.; Nicaud, J.-M. Microorganisms as Sources of Oils. OCL 2013, 20, D603. [Google Scholar] [CrossRef]
  6. Li, Y.; Horsman, M.; Wu, N.; Lan, C.Q.; Dubois-Calero, N. Biofuels from Microalgae. Biotechnol. Prog. 2008, 24, 815–820. [Google Scholar] [CrossRef] [PubMed]
  7. Xue, J.; Balamurugan, S.; Li, T.; Cai, J.X.; Chen, T.T.; Wang, X.; Yang, W.D.; Li, H.Y. Biotechnological Approaches to Enhance Biofuel Producing Potential of Microalgae. Fuel 2021, 302, 121169. [Google Scholar] [CrossRef]
  8. Meng, X.; Yang, J.; Xu, X.; Zhang, L.; Nie, Q.; Xian, M. Biodiesel Production from Oleaginous Microorganisms. Renew. Energy 2009, 34, 1–5. [Google Scholar] [CrossRef]
  9. Amalia, L.; Zhang, Y.-H.; Ju, Y.-H.; Tsai, S.-L. Enhanced Lipid Production in Yarrowia lipolytica Po1g by over-Expressing Lro1 Gene under Two Different Promoters. Appl. Biochem. Biotechnol. 2020, 191, 104–111. [Google Scholar] [CrossRef]
  10. Papanikolaou, S.; Muniglia, L.; Chevalot, I.; Aggelis, G.; Marc, I. Yarrowia lipolytica as a Potential Producer of Citric Acid from Raw Glycerol. J. Appl. Microbiol. 2002, 92, 737–744. [Google Scholar] [CrossRef]
  11. Blazeck, J.; Liu, L.; Knight, R.; Alper, H.S. Heterologous Production of Pentane in the Oleaginous Yeast Yarrowia lipolytica. J. Biotechnol. 2013, 165, 184–194. [Google Scholar] [CrossRef]
  12. Rakicka, M.; Rywińska, A.; Cybulski, K.; Rymowicz, W. Enhanced Production of Erythritol and Mannitol by Yarrowia lipolytica in Media Containing Surfactants. Braz. J. Microbiol. 2016, 47, 417–423. [Google Scholar] [CrossRef] [PubMed] [Green Version]
  13. Ledesma-Amaro, R.; Dulermo, T.; Nicaud, J.M. Engineering Yarrowia lipolytica to Produce Biodiesel from Raw Starch. Biotechnol. Biofuels 2015, 8, 148. [Google Scholar] [CrossRef] [PubMed] [Green Version]
  14. Nicaud, J.-M. Yarrowia lipolytica. Yeast 2012, 29, 409–418. [Google Scholar] [CrossRef]
  15. Ledesma-Amaro, R.; Nicaud, J.-M. Yarrowia lipolytica as a Biotechnological Chassis to Produce Usual and Unusual Fatty Acids. Prog. Lipid Res. 2016, 61, 40–50. [Google Scholar] [CrossRef]
  16. Park, Y.-K.; Dulermo, T.; Ledesma-Amaro, R.; Nicaud, J.-M. Optimization of Odd Chain Fatty Acid Production by Yarrowia lipolytica. Biotechnol. Biofuels 2018, 11, 158. [Google Scholar] [CrossRef] [PubMed] [Green Version]
  17. Degwert, J.; Jacob, J.; Steckel, F. Use of Cis-9-Heptadecenoic Acid for Treating Psoriasis and Allergies. International Patent Application No. WO1994021247A1, 13 January 1998. [Google Scholar]
  18. Clausen, C.A.; Coleman, R.D.; Yang, V.W. Fatty Acid-Based Formulations for Wood Protection against Mold and Sapstain. For. Prod. J. 2010, 60, 301–304. [Google Scholar] [CrossRef]
  19. Zhang, L.-S.; Liang, S.; Zong, M.-H.; Yang, J.-G.; Lou, W.-Y. Microbial Synthesis of Functional Odd-Chain Fatty Acids: A Review. World J. Microbiol. Biotechnol. 2020, 36, 35. [Google Scholar] [CrossRef]
  20. Jenkins, B.; West, J.A.; Koulman, A. A Review of Odd-Chain Fatty Acid Metabolism and the Role of Pentadecanoic Acid (C15:0) and Heptadecanoic Acid (C17:0) in Health and Disease. Molecules 2015, 20, 2425–2444. [Google Scholar] [CrossRef] [Green Version]
  21. Park, Y.-K.; Bordes, F.; Letisse, F.; Nicaud, J.-M. Engineering Precursor Pools for Increasing Production of Odd-Chain Fatty Acids in Yarrowia lipolytica. Metab. Eng. Commun. 2021, 12, e00158. [Google Scholar] [CrossRef]
  22. Fickers, P.; Le Dall, M.T.; Gaillardin, C.; Thonart, P.; Nicaud, J.M. New Disruption Cassettes for Rapid Gene Disruption and Marker Rescue in the Yeast Yarrowia lipolytica. J. Microbiol. Methods 2003, 55, 727–737. [Google Scholar] [CrossRef]
  23. Lazar, Z.; Rossignol, T.; Verbeke, J.; Crutz-Le Coq, A.-M.; Nicaud, J.-M.; Robak, M. Optimized Invertase Expression and Secretion Cassette for Improving Yarrowia lipolytica Growth on Sucrose for Industrial Applications. J. Ind. Microbiol. Biotechnol. 2013, 40, 1273–1283. [Google Scholar] [CrossRef] [PubMed] [Green Version]
  24. Lazar, Z.; Dulermo, T.; Neuvéglise, C.; Crutz-Le Coq, A.-M.; Nicaud, J.-M. Hexokinase—A Limiting Factor in Lipid Production from Fructose in Yarrowia lipolytica. Metab. Eng. 2014, 26, 89–99. [Google Scholar] [CrossRef] [PubMed]
  25. AFNOR. Céréales et Produits Céréaliers: Détermination de la Teneur en Matières Grasses Totales; Paris La Défense: Pairs, France, 1986. [Google Scholar]
  26. Beopoulos, A.; Cescut, J.; Haddouche, R.; Uribelarrea, J.-L.; Molina-Jouve, C.; Nicaud, J.-M. Yarrowia lipolytica as a Model for Bio-Oil Production. Prog. Lipid Res. 2009, 48, 375–387. [Google Scholar] [CrossRef]
  27. Rios, L.F.; Klein, B.C.; Luz, L.F.; Maciel Filho, R.; Wolf Maciel, M.R. Nitrogen Starvation for Lipid Accumulation in the Microalga Species Desmodesmus sp. Appl. Biochem. Biotechnol. 2015, 175, 469–476. [Google Scholar] [CrossRef] [PubMed]
  28. Calvey, C.H.; Su, Y.-K.; Willis, L.B.; McGee, M.; Jeffries, T.W. Nitrogen Limitation, Oxygen Limitation, and Lipid Accumulation in Lipomyces starkeyi. Bioresour. Technol. 2016, 200, 780–788. [Google Scholar] [CrossRef] [Green Version]
  29. González-García, Y.; Rábago-Panduro, L.M.; French, T.; Camacho-Córdova, D.I.; Gutiérrez-González, P.; Córdova, J. High Lipids Accumulation in Rhodosporidium toruloides by Applying Single and Multiple Nutrients Limitation in a Simple Chemically Defined Medium. Ann. Microbiol. 2017, 67, 519–527. [Google Scholar] [CrossRef]
  30. Fakankun, I.; Mirzaei, M.; Levin, D.B. Impact of Culture Conditions on Neutral Lipid Production by Oleaginous Yeast. Methods Mol. Biol. 2019, 1995, 311–325. [Google Scholar]
  31. Wang, X.; Fosse, H.K.; Li, K.; Chauton, M.S.; Vadstein, O.; Reitan, K.I. Influence of Nitrogen Limitation on Lipid Accumulation and EPA and DHA Content in Four Marine Microalgae for Possible Use in Aqauafeed. Front. Mar. Sci. 2019, 6, 95. [Google Scholar] [CrossRef]
  32. Boulton, C.A.; Ratledge, C. 1981 Correlation of Lipid Accumulation in Yeasts with Possession of ATP: Citrate Lyase. Microbiology 1981, 127, 169–176. [Google Scholar] [CrossRef] [Green Version]
  33. Dulermo, T.; Lazar, Z.; Dulermo, R.; Rakicka, M.; Haddouche, R.; Nicaud, J.-M. Analysis of ATP-Citrate Lyase and Malic Enzyme Mutants of Yarrowia lipolytica Points out the Importance of Mannitol Metabolism in Fatty Acid Synthesis. Biochim. Biophys. Acta (BBA)-Mol. Cell Biol. Lipids 2015, 1851, 1107–1117. [Google Scholar] [CrossRef] [Green Version]
  34. Meesters, P.A.E.P.; Huijberts, G.N.M.; Eggink, G. High-Cell-Density Cultivation of the Lipid Accumulating Yeast Cryptococcus curvatus Using Glycerol as a Carbon Source. Appl. Microbiol. Biotechnol. 1996, 45, 575–579. [Google Scholar] [CrossRef]
  35. Li, Y.; Zhao, Z.; Bai, F. High-Density Cultivation of Oleaginous Yeast Rhodosporidium toruloides Y4 in Fed-Batch Culture. Enzym. Microb. Technol. 2007, 41, 312–317. [Google Scholar] [CrossRef]
  36. Papanikolaou, S.; Fakas, S.; Fick, M.; Chevalot, I.; Galiotou-Panayotou, M.; Komaitis, M.; Marc, I.; Aggelis, G. Biotechnological Valorisation of Raw Glycerol Discharged after Bio-Diesel (Fatty Acid Methyl Esters) Manufacturing Process: Production of 1,3-Propanediol, Citric Acid and Single Cell Oil. Biomass Bioenergy 2008, 32, 60–71. [Google Scholar] [CrossRef]
  37. Liang, Y.; Cui, Y.; Trushenski, J.; Blackburn, J.W. Converting Crude Glycerol Derived from Yellow Grease to Lipids through Yeast Fermentation. Bioresour. Technol. 2010, 101, 7581–7586. [Google Scholar] [CrossRef]
  38. Back, A.; Rossignol, T.; Krier, F.; Nicaud, J.-M.; Dhulster, P. High-Throughput Fermentation Screening for the Yeast Yarrowia lipolytica with Real-Time Monitoring of Biomass and Lipid Production. Microb. Cell Factories 2016, 15, 147. [Google Scholar] [CrossRef]
  39. D’Amato, D.; Corbo, M.R.; Nobile, M.A.D.; Sinigaglia, M. Effects of Temperature, Ammonium and Glucose Concentrations on Yeast Growth in a Model Wine System. Int. J. Food Sci. Technol. 2006, 41, 1152–1157. [Google Scholar] [CrossRef]
  40. Zhu, L.Y.; Zong, M.H.; Wu, H. Efficient Lipid Production with Trichosporon fermentans and Its Use for Biodiesel Preparation. Bioresour. Technol. 2008, 99, 7881–7885. [Google Scholar] [CrossRef]
  41. Tsigie, Y.A.; Wang, C.-Y.; Kasim, N.S.; Diem, Q.-D.; Huynh, L.-H.; Ho, Q.-P.; Truong, C.-T.; Ju, Y.-H. Oil Production from Yarrowia lipolytica Po1g Using Rice Bran Hydrolysate. J. Biomed. Biotechnol. 2012, 2012, e378384. [Google Scholar] [CrossRef]
  42. Guerfali, M.; Ayadi, I.; Sassi, H.-E.; Belhassen, A.; Gargouri, A.; Belghith, H. Biodiesel-Derived Crude Glycerol as Alternative Feedstock for Single Cell Oil Production by the Oleaginous Yeast Candida viswanathii Y-E4. Ind. Crops Prod. 2020, 145, 112103. [Google Scholar] [CrossRef]
  43. Gao, R.; Li, Z.; Zhou, X.; Cheng, S.; Zheng, L. Oleaginous Yeast Yarrowia lipolytica Culture with Synthetic and Food Waste-Derived Volatile Fatty Acids for Lipid Production. Biotechnol. Biofuels 2017, 10, 247. [Google Scholar] [CrossRef]
  44. Zhang, L.-S.; Xu, P.; Chu, M.-Y.; Zong, M.-H.; Yang, J.-G.; Lou, W.-Y. Using 1-Propanol to Significantly Enhance the Production of Valuable Odd-Chain Fatty Acids by Rhodococcus opacus PD630. World J. Microbiol. Biotechnol. 2019, 35, 164. [Google Scholar] [CrossRef] [PubMed]
  45. Kolouchová, I.; Schreiberová, O.; Sigler, K.; Masák, J.; Řezanka, T. Biotransformation of Volatile Fatty Acids by Oleaginous and Non-Oleaginous Yeast Species. FEMS Yeast Res. 2015, 15, fov076. [Google Scholar] [CrossRef] [PubMed] [Green Version]
Figure 1. Experimental set-up for the optimization of culture conditions to maximize cell density (OD600nm) and the C17:1 content (%) in lipids.
Fermentation 08 00245 g001
Figure 2. Standardized Pareto chart for OD600nm (a) and for % of C17:1 (b). Vertical lines indicate statistically significant parameters with more than 95% confidence. (+) indicates positive effect, (−) indicates negative effect. Inserts show the variation of response parameters, OD600nm (a) and % of C17:1 (b), as a function of each ingredient.
Fermentation 08 00245 g002
Figure 3. (a) Optimal path for the response to cell density (OD600nm), (b) Desirability function for the optimization of the response to cell density (OD600nm), (c) Optimal path for the response to C17:1 content (%), (d) Desirability function for the optimization of the response to C17:1 content (%).
Fermentation 08 00245 g003
Figure 4. Growth kinetics and substrates consumption during the fermentations conducted in a 5 L bioreactor under the optimal conditions of (sucrose) = 52.4 g/L, (glycerol) = 26.9 g/L, (sodium acetate) = 10.4 g/L, (sodium propionate) = 5 g/L, and (yeast extract) = 4 g/L. (a) Consumption kinetics of sucrose, glucose, fructose, and glycerol. (b) Consumption kinetics of sodium acetate and sodium propionate.
Fermentation 08 00245 g004
Table 1. Plasmids and strains used in this study.
StrainDescriptionReference
E. coli
JME547pUB-Cre-Hygro[22]
JME2103JMP62-URA3 ex-pTEF-YlHXK1-Tlip2[24]
JME2347JMP62-LEU2 ex-pTEF-ScSUC2-Tlip2[23]
Y. lipolytica
JMY7780Δphd1 Δmfe1 Δtgl4 pTEF-DGA2
pTEF-GPD1 hp4d-LDP1-URA3 ex pTEF-Repct-LEU2 ex
[21]
JMY7829Δphd1 Δmfe1 Δtgl4 pTEF-DGA2
pTEF-GPD1 hp4d-LDP1 pTEF-Repct
This study
JMY7877JMY7829 pTEF-ScSUC2-LEU2 ex pTEF-YlHXK1-URA3 exThis study
Table 2. Sequence of primers used in this study.
NameSequence
pTEF-internal-FwTCTGGAATCTACGCTTGTTCA
SUC2-internal-RevGCAGATTCTAGCTTCCAGGAC
HXK1-internal-RevCTCATCTTCTCGAAGGTCTGCTG
Table 3. Experimental plan and measured responses. Coded variables are provided in parentheses.
Experiment Sucrose (g/L)Glycerol
(g/L)
Sodium
Acetate (g/L)
Sodium
Propionate (g/L)
Yeast Extract (g/L)Cell
Density (OD600nm)
C17:1 Content (%)
140 (−1)20 (−1)15 (−1)4 (−1)4 (+ 1)19.231.7
280 (+1)20 (−1)15 (−1)4 (−1)2 (−1)14.031.2
340 (−1)40 (+1)15 (−1)4 (−1)2 (−1)14.429.3
480 (+1)40 (+1)15 (−1)4 (−1)4 (+1)17.826.4
540 (−1)20 (−1)25 (+1)4 (−1)2 (−1)16.827.4
680 (+1)20 (−1)25 (+1)4 (−1)4 (+1)19.419.7
740 (−1)40 (+1)25 (+1)4 (−1)4 (+1)19.221.3
880 (+1)40 (+1)25 (+1)4 (−1)2 (−1)14.821.1
940 (−1)20 (−1)15 (−1)6 (+1)2 (−1)13.034.7
1080 (+1)20 (−1)15 (−1)6 (+1)4 (+1)17.030.7
1140 (−1)40 (+1)15 (−1)6 (+1)4 (+1)17.030.4
1280 (+1)40 (+1)15 (−1)6 (+1)2 (−1)12.234.2
1340 (−1)20 (−1)25 (+1)6 (+1)4 (+1)20.026.5
1480 (+1)20 (−1)25 (+1)6 (+1)2 (−1)15.029.3
1540 (−1)40 (+1)25 (+1)6 (+1)2 (−1)15.626.4
1680 (+1)40 (+1)25 (+1)6 (+1)4 (+1)16.025.1
1720 (−2)30 (0)20 (0)5 (0)3 (0)17.629.5
18100 (+2)30 (0)20 (0)5 (0)3 (0)15.828.3
1960 (0)10 (−2)20 (0)5 (0)3 (0)17.829.4
2060 (0)50 (+2)20 (0)5 (0)3 (0)16.025.8
2160 (0)30 (0)10 (−2)5 (0)3 (0)13.836.6
2260 (0)30 (0)30 (+2)5 (0)3 (0)17.623.1
2360 (0)30 (0)20 (0)3 (−2)3 (0)18.221.5
2460 (0)30 (0)20 (0)7 (+2)3 (0)16.232.9
2560 (0)30 (0)20 (0)5 (0)1 (−2)12.038.2
2660 (0)30 (0)20 (0)5 (0)5 (+2)16.428.7
2760 (0)30 (0)20 (0)5 (0)3 (0)15.032.1
2860 (0)30 (0)20 (0)5 (0)3 (0)14.632.2
2960 (0)30 (0)20 (0)5 (0)3 (0)14.831.2
3060 (0)30 (0)20 (0)5 (0)3 (0)13.232.0
3142.7 (−0.866)25 (−0.5)18.2 (−0.3535)4.7 (−0.2739)2.8 (−0.2236)14.032.3
3277.3 (+0.866)25 (−0.5)18.2 (−0.3535)4.7 (−0.2739)2.8 (−0.2236)13.232.4
3360 (0)40 (+1)18.2 (−0.3535)4.7 (−0.2739)2.8 (−0.2236)13.631.6
3460 (0)30 (0)25.3 (+1.0607)4.7 (−0.2739)2.8 (−0.2236)15.028.4
3560 (0)30 (0)20 (0)6.1 (+1.0955)2.8 (−0.2236)12.832.4
3660 (0)30 (0)20 (0)5 (0)4.1 (+1.118)15.830.1
Table 4. Validation of the models using the test points.
Cell Density (OD600nm)% C17:1
ExperimentYmeasuredYpredictedYmeasuredYpredicted
311415.0232.2933.27
3213.214.4432.4131.76
3313.614.3131.6330.49
341515.5128.3927.45
3512.814.2732.4333.30
3615.816.1430.0730.49
Table 5. The analysis of variance (ANOVA) for cell density. * means significant differences (p < 0.05).
Source of VariationSum of SquaresDegrees of FreedomMean SquaresF-Ratiop-Value
Regression149.27207.4612.22<0.01 *
Residue9.16150.61
Lack of fit7.16120.590.8961.9
Pure error2.030.66
Total158.4335
Table 6. The analysis of variance (ANOVA) for C17:1 content (%). * means significant differences (p < 0.05).
Source of VariationSum of SquaresDegrees of FreedomMean SquaresF-Ratiop-Value
Regression637.212031.8623.34<0.01 *
Residue20.47151.36
Lack of fit19.87121.658.375.3
Pure error0.5930.19
Total657.6835
Table 7. Fatty acid composition of lipids extracted from Y. lipolytica cultures after 96 h fermentation in Erlenmeyer flasks and in 5 L bioreactors. Culture conditions were those provided by the design of experiment approach: (sucrose) = 52.4 g/L, (glycerol) = 26.9 g/L, (sodium acetate) = 10.4 g/L, (sodium propionate) = 5 g/L, and (yeast extract) = 4 g/L.
FAME% in Erlenmeyer% in 5 L Bioreactors
C15:05.03 ± 0.195.37 ± 0.34
C16:07.78 ± 0.159.37 ± 1.59
C16:11.00 ± 0.061.29 ± 0.30
C17:019.71 ± 0.4218.00 ± 1.71
C17:131.62 ± 1.1531.62 ± 0.94
C18:010.02 ± 0.249.85 ± 0.27
C18:117.30 ± 0.2717.87 ± 0.56
C18:22.59 ± 0.182.61 ± 0.17
C19:02.72 ± 0.062.64 ± 0.10
C19:11.41 ± 0.071.39 ± 0.13
Publisher’s Note: MDPI stays neutral with regard to jurisdictional claims in published maps and institutional affiliations.

