
Increasing Anaerobic Digestion Efficiency Using Food-Waste-Based Biochar


Department of Environmental Research, Korea Institute of Civil Engineering and Building Technology 283, Goyang-daero, Ilsanseo-gu, Goyang-si 10223, Gyeong-gi-do, Korea
*
Author to whom correspondence should be addressed.
Fermentation 2022, 8(6), 282; https://0-doi-org.brum.beds.ac.uk/10.3390/fermentation8060282
Submission received: 9 May 2022
/
Revised: 14 June 2022
/
Accepted: 14 June 2022
/
Published: 16 June 2022
(This article belongs to the Special Issue Anaerobic Fermentation – a Biological Route towards Achieving Net Neutrality)
Abstract
:The efficiency of methane production by anaerobic digestion (AD), during which energy is generated from organic waste, can be increased in various ways. Recent research developments have increased the volume of gas production during AD using biochar. Previous studies have used food waste itself in AD, or, added wood-biochar or sewage sludge charcoal as an accelerant of the AD process. The application of food-waste biochar in AD using activated sludge has not yet been studied and is considered a potential method of utilizing food waste. Therefore, this study investigated the use of biochar prepared by the thermal decomposition of food waste as an additive to AD tanks to increase methane production. The addition of food-waste biochar at 1% of the digestion tank volume increased the production of digestion gas by approximately 10% and methane by 4%. We found that food-waste biochar served as a medium with trace elements that promoted the proliferation of microorganisms and increased the efficiency of AD.
1. Introduction
Anaerobic digestion (AD) is one of the best methods to utilize various organic waste materials for energy production [1]. Numerous methods have been applied to the process to increase bioenergy production from biomass waste [2].
The surplus sludge generated by sewage treatment produces biogas through AD. Therefore, energy can be recovered from the sludge, contributing to organic waste management—the production of biogas increases or decreases depending on the management of the AD tank. Accordingly, technologies are being developed to improve energy recovery and increase biogas production [3]. Most previous studies on increasing biogas production have focused on improving the microorganism activity or increasing the number of microorganisms [4].
Various AD studies have been conducted using food waste to produce biogas. When food waste is single-digested by AD, the accumulation of volatile fatty acids (VFAs) and the suppression of ammonia inhibit the digestion tank reactions [5,6]. The AD tank reactions are also inhibited by the salt concentrations of the food waste used in AD [7,8]. In addition, the high biodegradability of food waste inhibits reactions that produce methane [9].
Recent studies have focused on improving the yield of biogas by using various additives such as bio-based carbon materials including biochar, activated sludge, granulated activated carbon, and carbon cloth [2,10]. These additives improve the stability of active sludge in AD and increase biogas production [11,12]. Activated carbon increases sludge reduction and methane production [13], and biochar improves the rate of methane production [14,15].
Among these additives, biochar can negatively affect sludge production because of the composition of biomass in the AD, but positively affects methane production and can be used to recycle organic waste by biochar [16] Biochar, produced through pyrolysis of biomass, is an eco-friendly material with a high carbon content, porous structure, large specific surface area, and good biocompatibility. Biochar was reported to improve the efficiency of methane production by 32%, when added to the AD [17,18]. Wood-biochar or sewage sludge charcoal have been added to improve the methane production efficiency in AD [19,20].
However, in Korea, more than 50% of lignocellulosic waste is processed using paint, oil, and preservatives, and there is a limit in manufacturing biochar. In addition, sewage sludge contains heavy metals; therefore, continuous addition of sewage sludge to AD can lead to the accumulation of heavy metals [21].
To overcome these limitations, there is a need to use biochar using food waste. Because the generation of food waste is increasing, the production and use of biochar from food waste has been examined. The production of food-waste-based biochar has been studied to convert food waste into resources to be used as a soil conditioner or fuel [22,23]. The components of food-waste biochar can increase microorganism activity during the digestion process. Although the application of food-waste biochar in AD using activated sludge has not been evaluated, this method shows potential for utilizing food waste.
Therefore, in this study, we analyzed the physical properties of food-waste-based biochar to determine which trace elements are necessary for AD, and to evaluate whether it is useful as media in Brunauer, Emmett, Teller analysis. In addition, the biochemical methane potential (BMP) test confirmed that the amount of biogas generated was determined by the amount of biochar injected. The methane production potential confirmed the methane gas generation characteristics. We examined the effect of biochar produced by the thermal decomposition of food waste on the improvement of methane yield during AD.
2. Materials and Methods
2.1. Production of Biochar from Food Waste
The biochar used in the experiment was produced using primarily processed (screened, crushed, and dried) food waste at the resource recycling center in City Gimpo, Korea. The raw material contained 70.66% volatile matter, 9.35% ash, 10.74% fixed carbon, and 9.26% moisture.
Food waste usually has a high salt content. The food waste used in this study contained 1.2–1.8 g·L−1 salt (average 1.52 g·L−1). After thermal decomposition, the resulting biochar contained 0.3–1.0 g·L−1 salt (average 0.78 g·L−1). According to Gao et al. [24], the change in the digestion efficiency is insignificant when the salt content is below 5 g·L−1. Roberts et al. [25] reported that the effect of salt on microorganisms is not significant when the content is below 1 g·L−1. The salt tolerance of the microorganisms increased to 10 g·L−1 with adaption to salt. The current study did not consider the effect of salt on microorganisms in AD.
The biochar was prepared by slow pyrolysis by carbonizing the raw material at 500 °C for 10 min. The hopper of the pyrolizer was designed to minimize the inflow of external air. Nitrogen was used as a carrier gas to meet anoxic conditions and a “three-screw”-type internal system was created to facilitate heat transfer and mixing.
A proximate analysis was conducted to determine the composition of biochar, X-ray fluorescence spectrometry (XRF) was used to identify trace elements affecting digestion efficiency, and the Brunauer, Emmett, Teller (BET) analysis was used to examine porosity.
2.2. Operating Conditions for the BMP Test
The digestion efficiency was examined based on the volume of biogas produced and the methane content. For this, the BMP test was performed as suggested by Owen [26] and Shelton and Tiedje [27]. The microorganisms applied in the BMP test were seeded using sludge from the digestion tank operated in the field. The surplus and digested sludge used for the test were collected from the sewage treatment plant in City Ilsan, Korea. Table 1 shows the sludge properties.
Experiments were performed under six different conditions to examine the volume of gas produced based on the quantity of biochar used (0% control, 0.1%, 0.5%, 1.0%, 3.0%, and 5.0% of the volume ratio (v/v%), respectively). The ratio of conditions to microorganisms was the same in all conditions: 150 mL of surplus sludge and 200 mL of digested sludge (microorganisms). At this time, the organic material load for each case was 4.83 g COD/L, and the VS load was 3.21 g VS/L. To prevent a pH decrease due to acid production during AD, 1.2 g·L−1 sodium bicarbonate (NaHCO3) was added. A 500-mL serum bottle was thoroughly purged with nitrogen gas to ensure that no oxygen remained in the headspace of the bottle and the bottle was sealed with a butyl rubber and aluminum cap. A BMP test was performed at 40 °C and 65 rpm until no gas was produced (60 days).
2.3. Analysis of Gas Production and Composition
The volume of digestion gas produced was measured simultaneously every day for the first seven days (24-h intervals), after which the time interval was adjusted according to the gas production rate. The volume of gas generated was measured using a gas syringe with capillary tube (capacity: 100 mL). The methane content was measured by analyzing the concentrations of N2, CH4, and CO2 in the digestion gas. The gas chromatograph used in the gas analysis was a CTGC 1000 (Chemtekins Co. Ltd., Seoul, Korea). The maximum temperature of the oven inside the GC was 280 °C. A thermal conductivity detector with a minimum detection limit of 50 pg was used.
2.4. Analysis of Biochar before and after the Biochemical Methane Potential (BMP) Test
Surface and elemental analyses were performed to predict the change in biochar during the BMP test. A field emission scanning electron microscope (JEOL-7610F-Plus, JEOL Ltd., Tokyo, Japan) was used for surface analysis, and pre-treatment (lyophilization) was conducted before the analysis to consider the microorganisms that could be present in the biochar. Additionally, energy dispersive spectrometry (EDS) was used during the surface analysis to investigate changes in the biochar.
2.5. Analysis of Methane Production Potential
This study analyzed the effect of the addition of biochar on the methane generation potential using experimental data from the cumulative production curves of methane gas. The cumulative production curves obtained from the BMP test were applied to the modified Gompertz model [28], and the best-fit method by trial and error was used to estimate various parameters included in the model equation. Equation (1) is the modified Gompertz model [29].
where: M, cumulative methane production (mL); P, methane production potential (mL); Rm, methane production rate (mL·day−1); e, exp(1); λ, lag growth phase time (days), and t, time (days).
2.6. Statistical Analyses
Experimental data were statistically analyzed using Microsoft Excel (2016). The means and standard deviations of the biogas production and methane content were calculated. The samples were analyzed thrice or more to ensure precision.
3. Results and Discussion
3.1. Biochar Composition
Proximate analysis revealed that the food-waste biochar contained 41.63% fixed carbon, 30.42% volatile matter, 26.82% ash, and 1.12% moisture. It consisted of 42.54% C, 7.28% H, and 3.46% N. Table 2 shows the component analysis results using XRF. Due to the characteristics of food waste, Ca was the highest, at approximately 60%, followed by Cl. Notably, it included trace elements such as Ti, Cu, Cr, and Zn, which are not found in wood-biochar [17].
The trace elements in the biochar, including Ca, Fe, Cu, and Zn, exhibited the following characteristics with regard to AD microorganisms:
- Ca is a key component for the growth of some methanogens and is critical for the formation of microbial aggregates [30];
- Trace elements act as a cofactor for enzymes involved in methane formation [31];
- Trace elements facilitate methane production [32];
- Trace elements play an important role in the growth and metabolism of anaerobes [33];
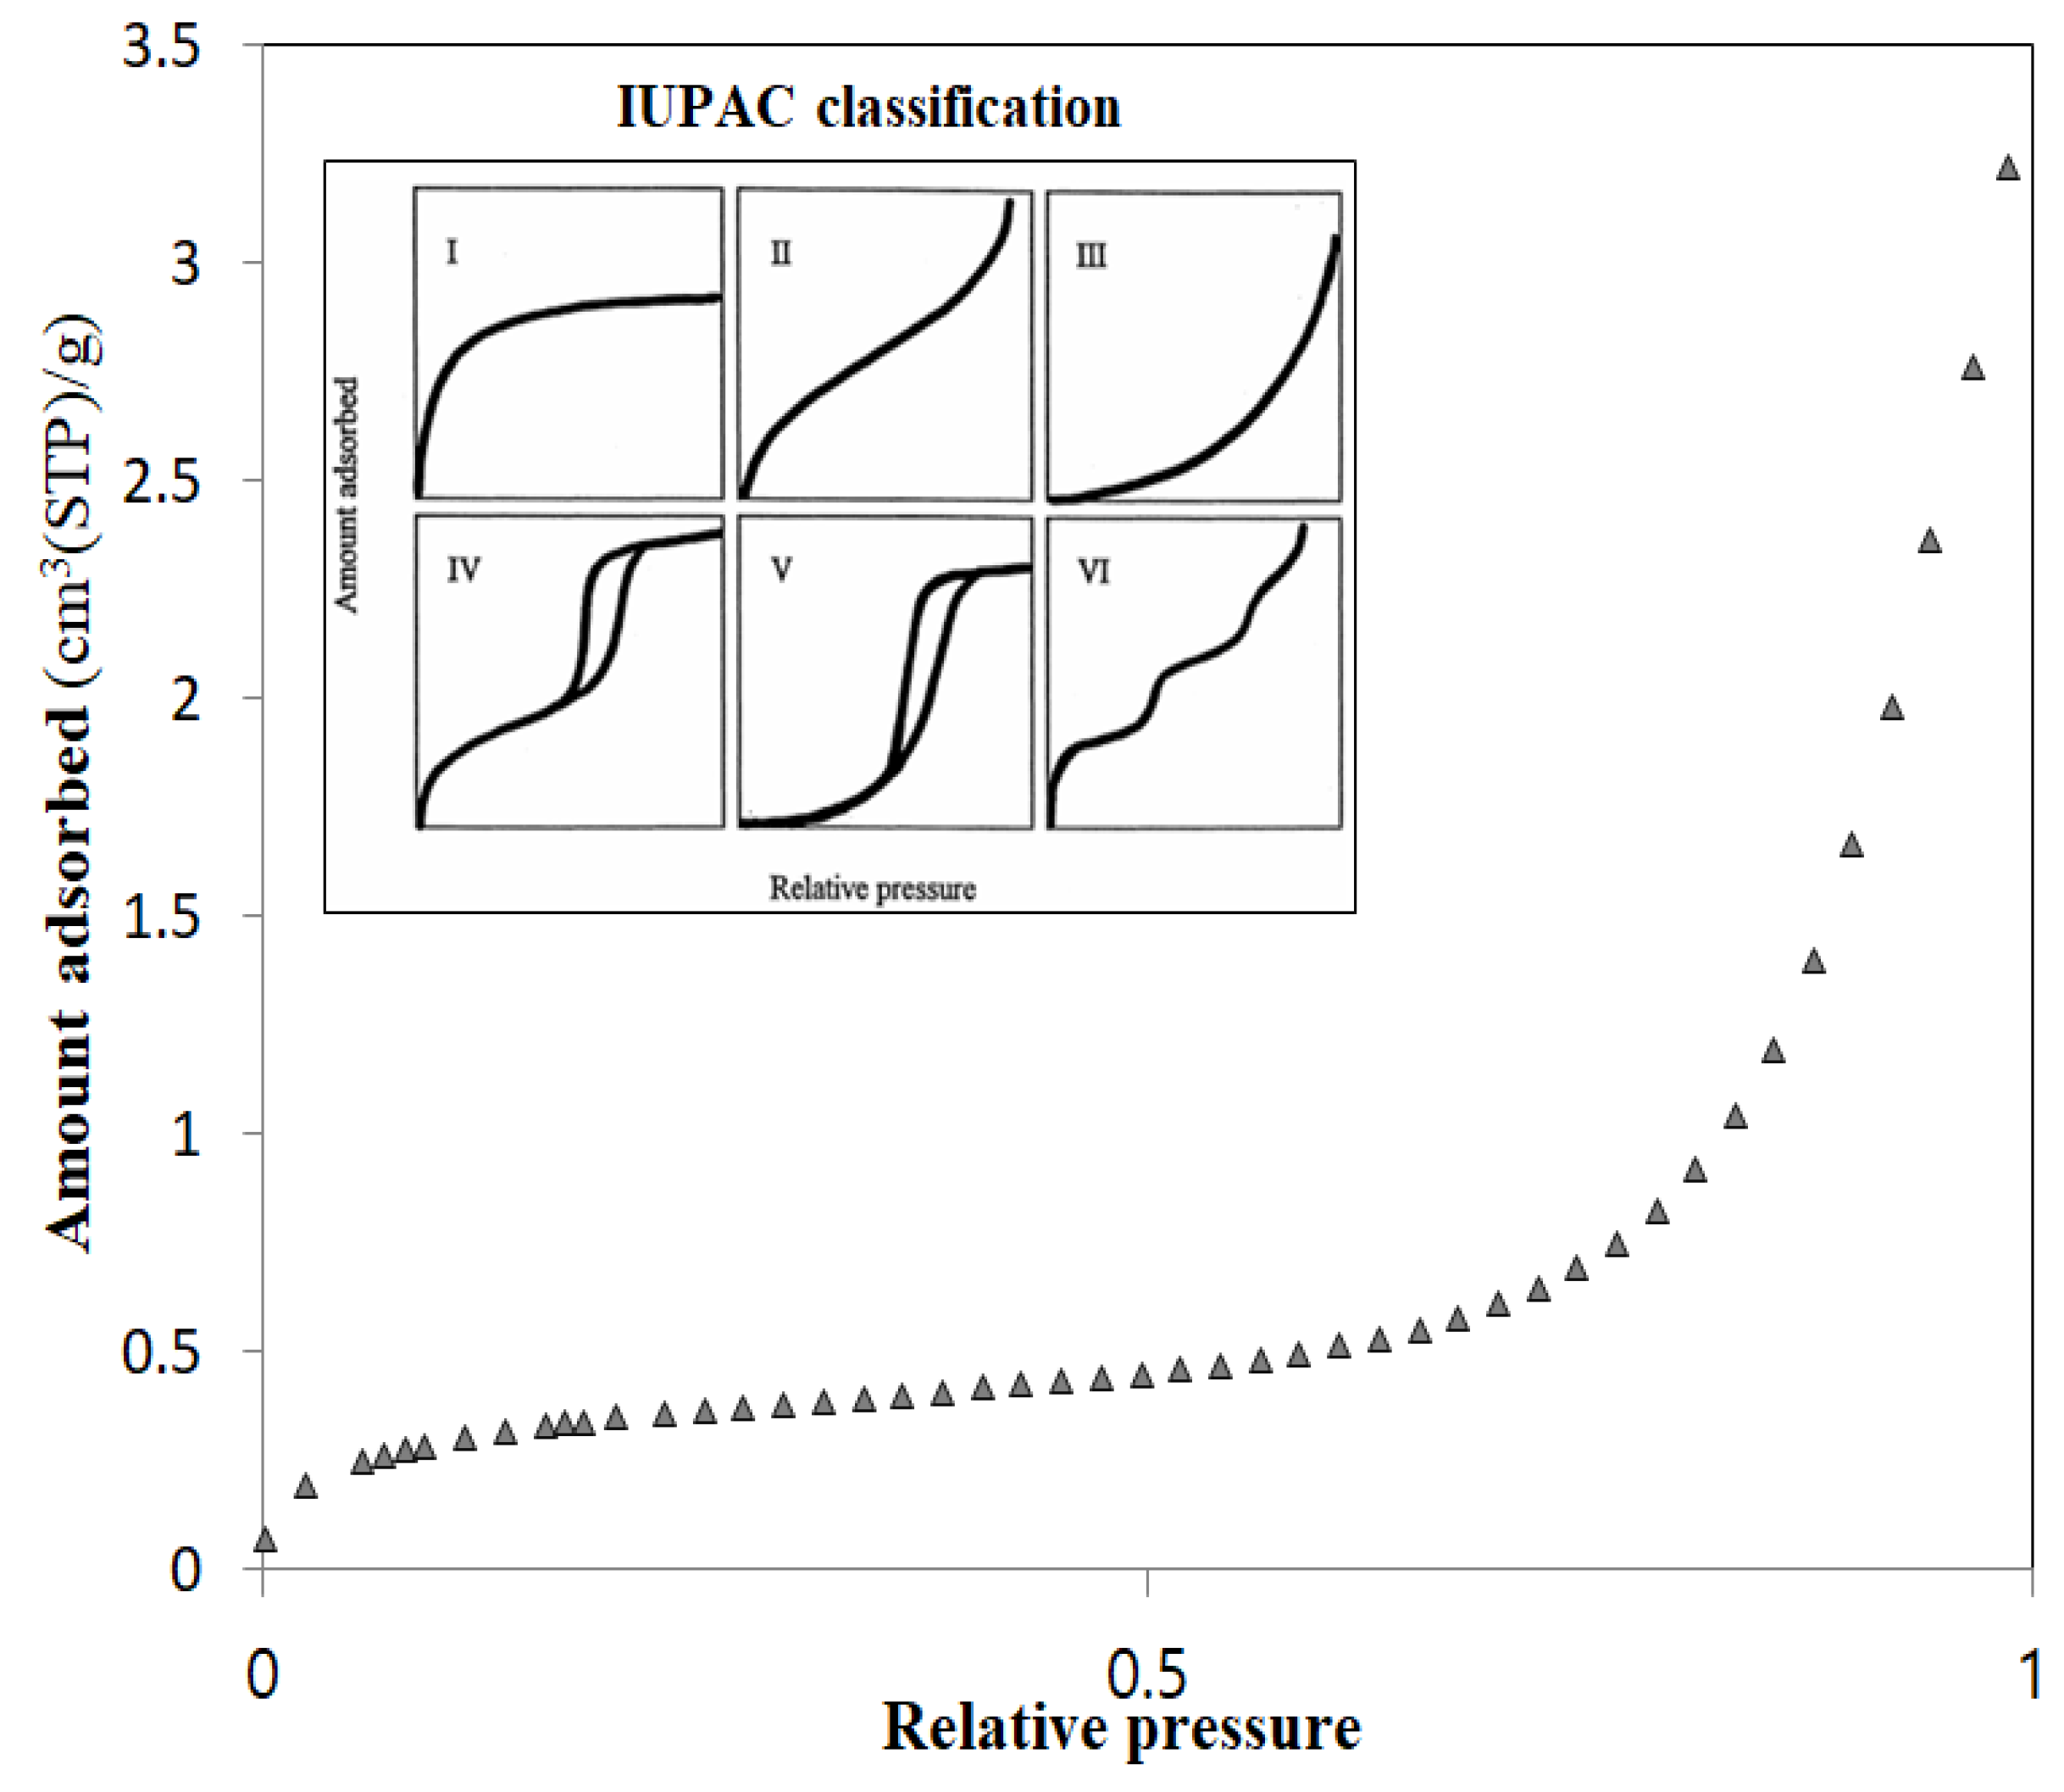
The BET analysis of the biochar indicated that the surface area was 1.2969 m2·g−1, the total pore volume was 0.004982 cm3·g−1, the adsorption average pore width was 153.6522 nm, and the adsorption average pore diameter was 179.996 nm. The graph of nitrogen isothermal adsorption (Figure 1) suggests Type II, according to the IUPAC classification [41]. According to Rouquerol et al. [42], biochar with such characteristics has mesopores, indicating that abundant pores were formed inside the biochar. As Yue [17] reported, the insides of the pores provide a beneficial environment for microbial growth [43,44].
3.2. Results of Digestion Gas Production
3.2.1. Trend in Gas Generation
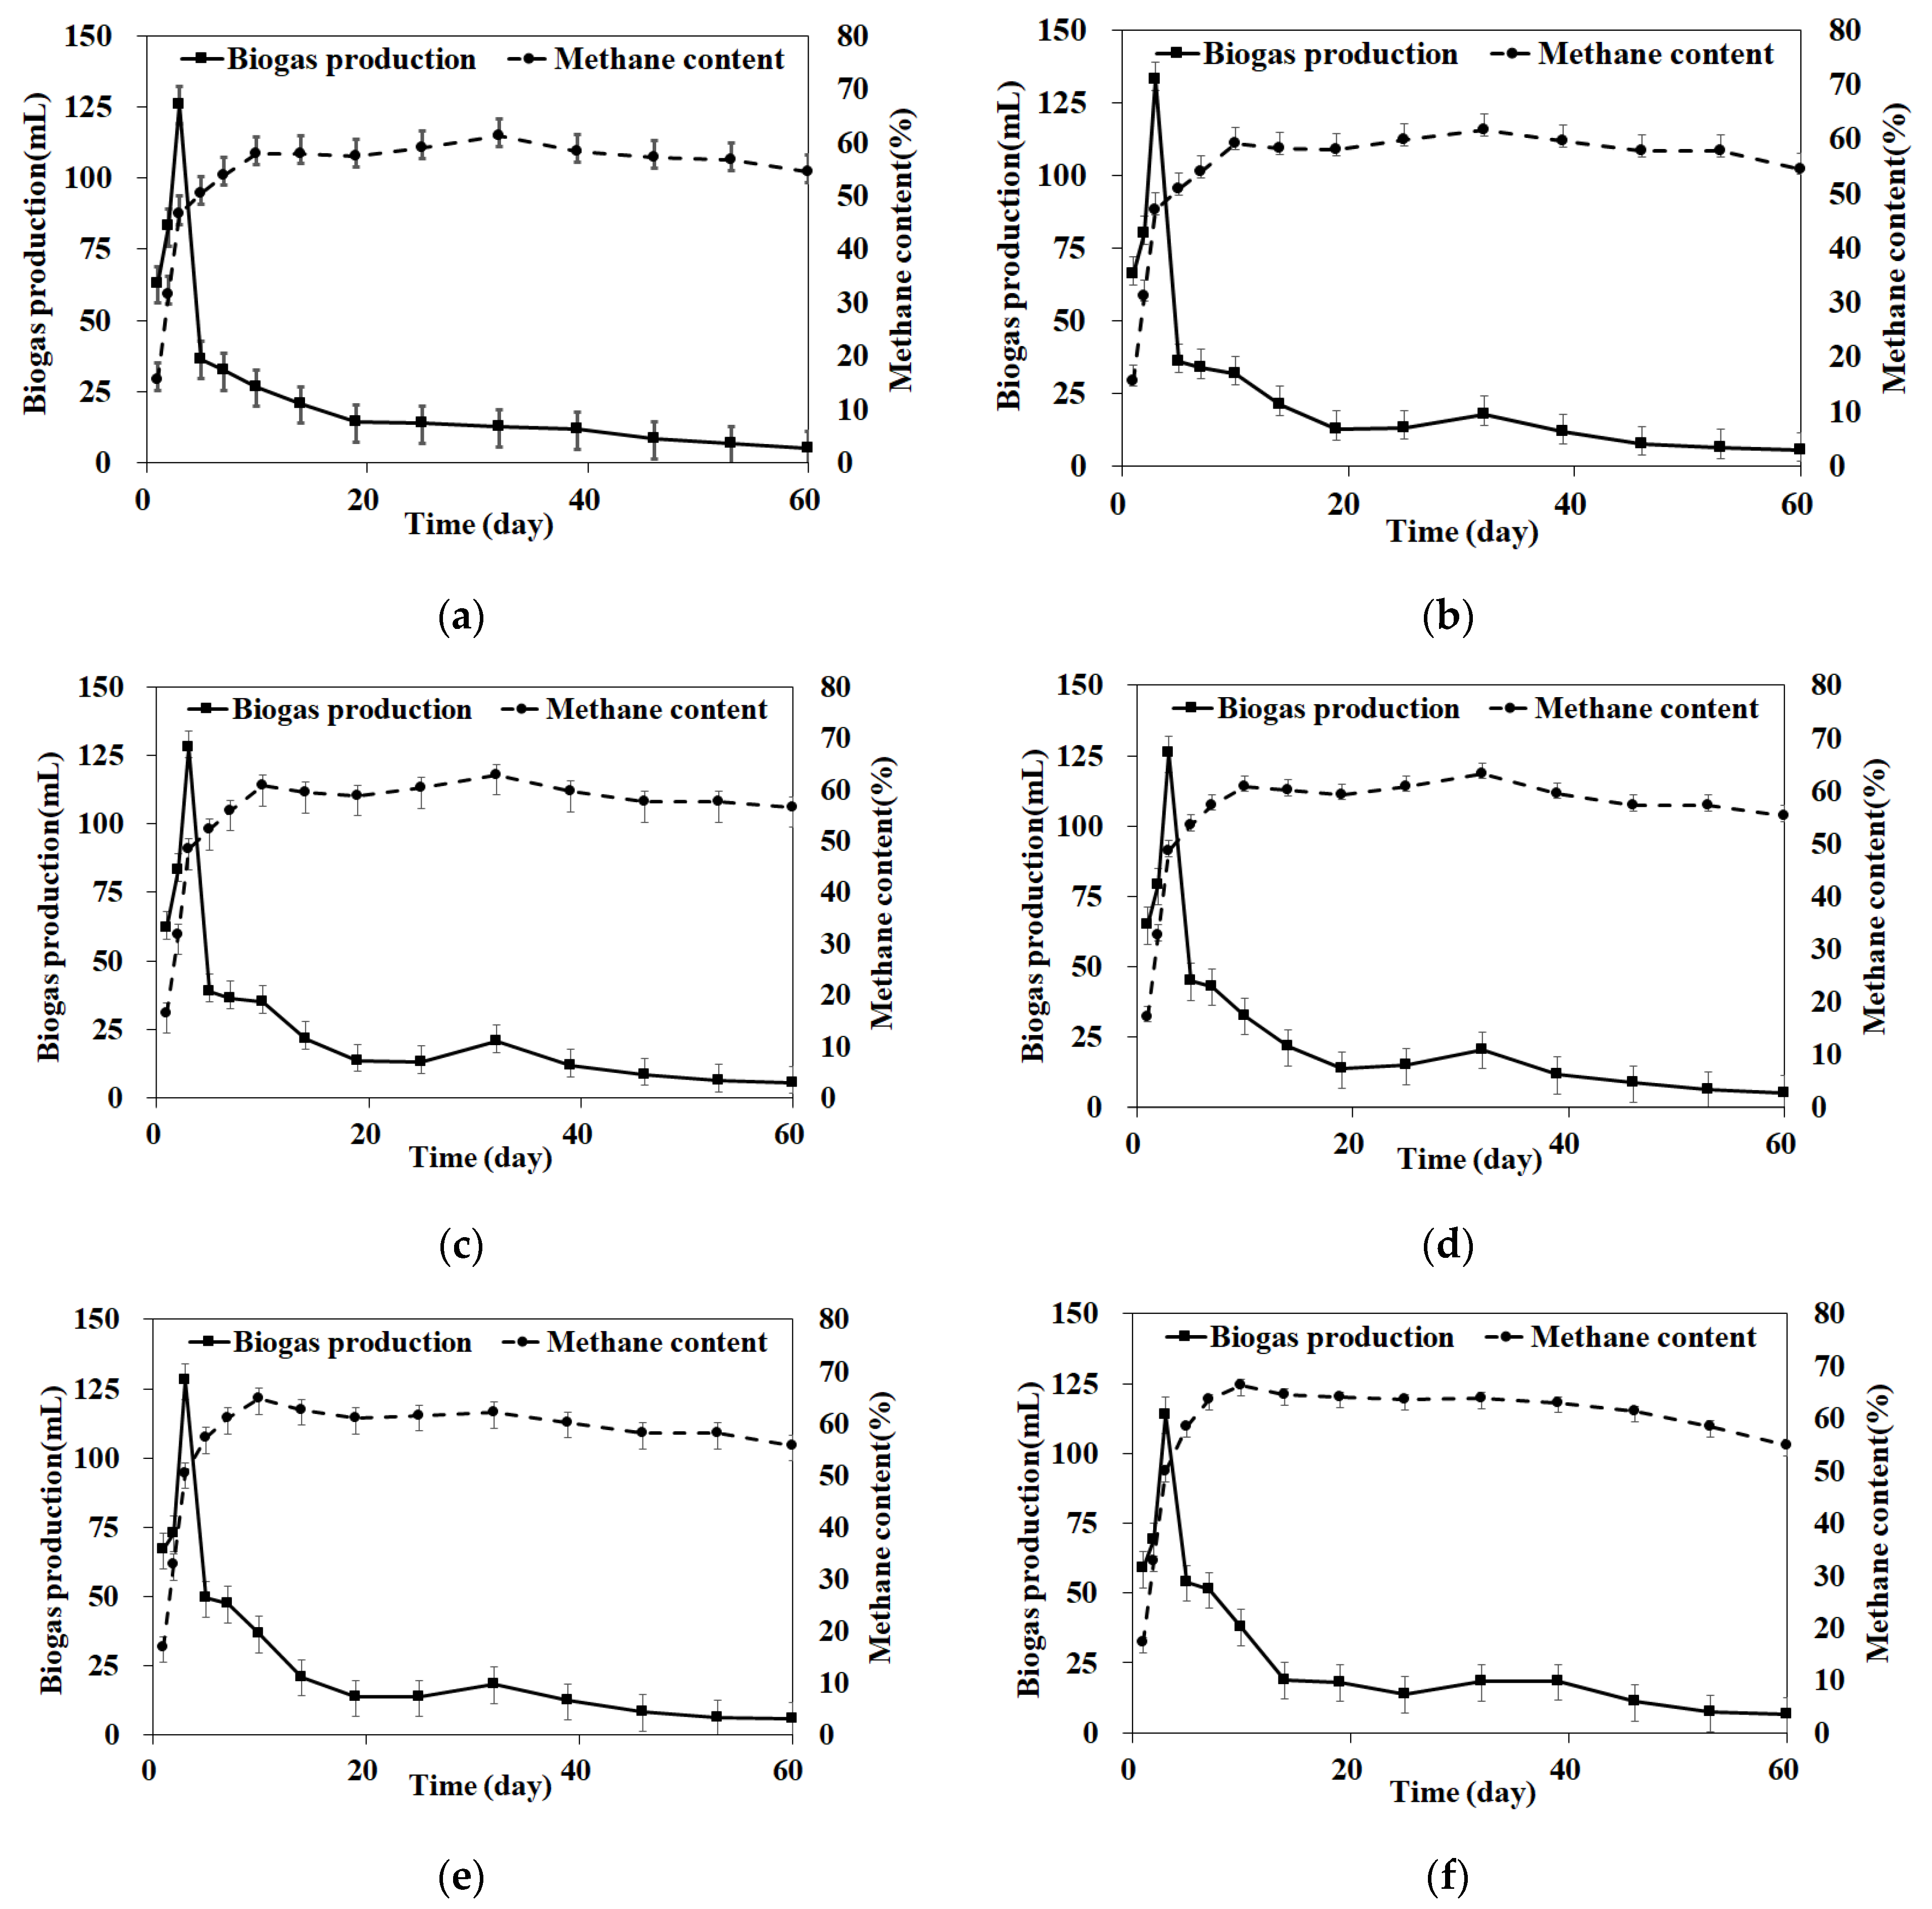
Figure 2 shows the digestion gas generated with different quantities of biochar. The first two days were the stabilization phase, with little difference in the volume of gas produced in the control and experimental conditions. The 5% biochar condition produced 15 mL less digestion gas than the control condition due to increased trace elements and a high level of biochar, which suppressed microbial activity [45].
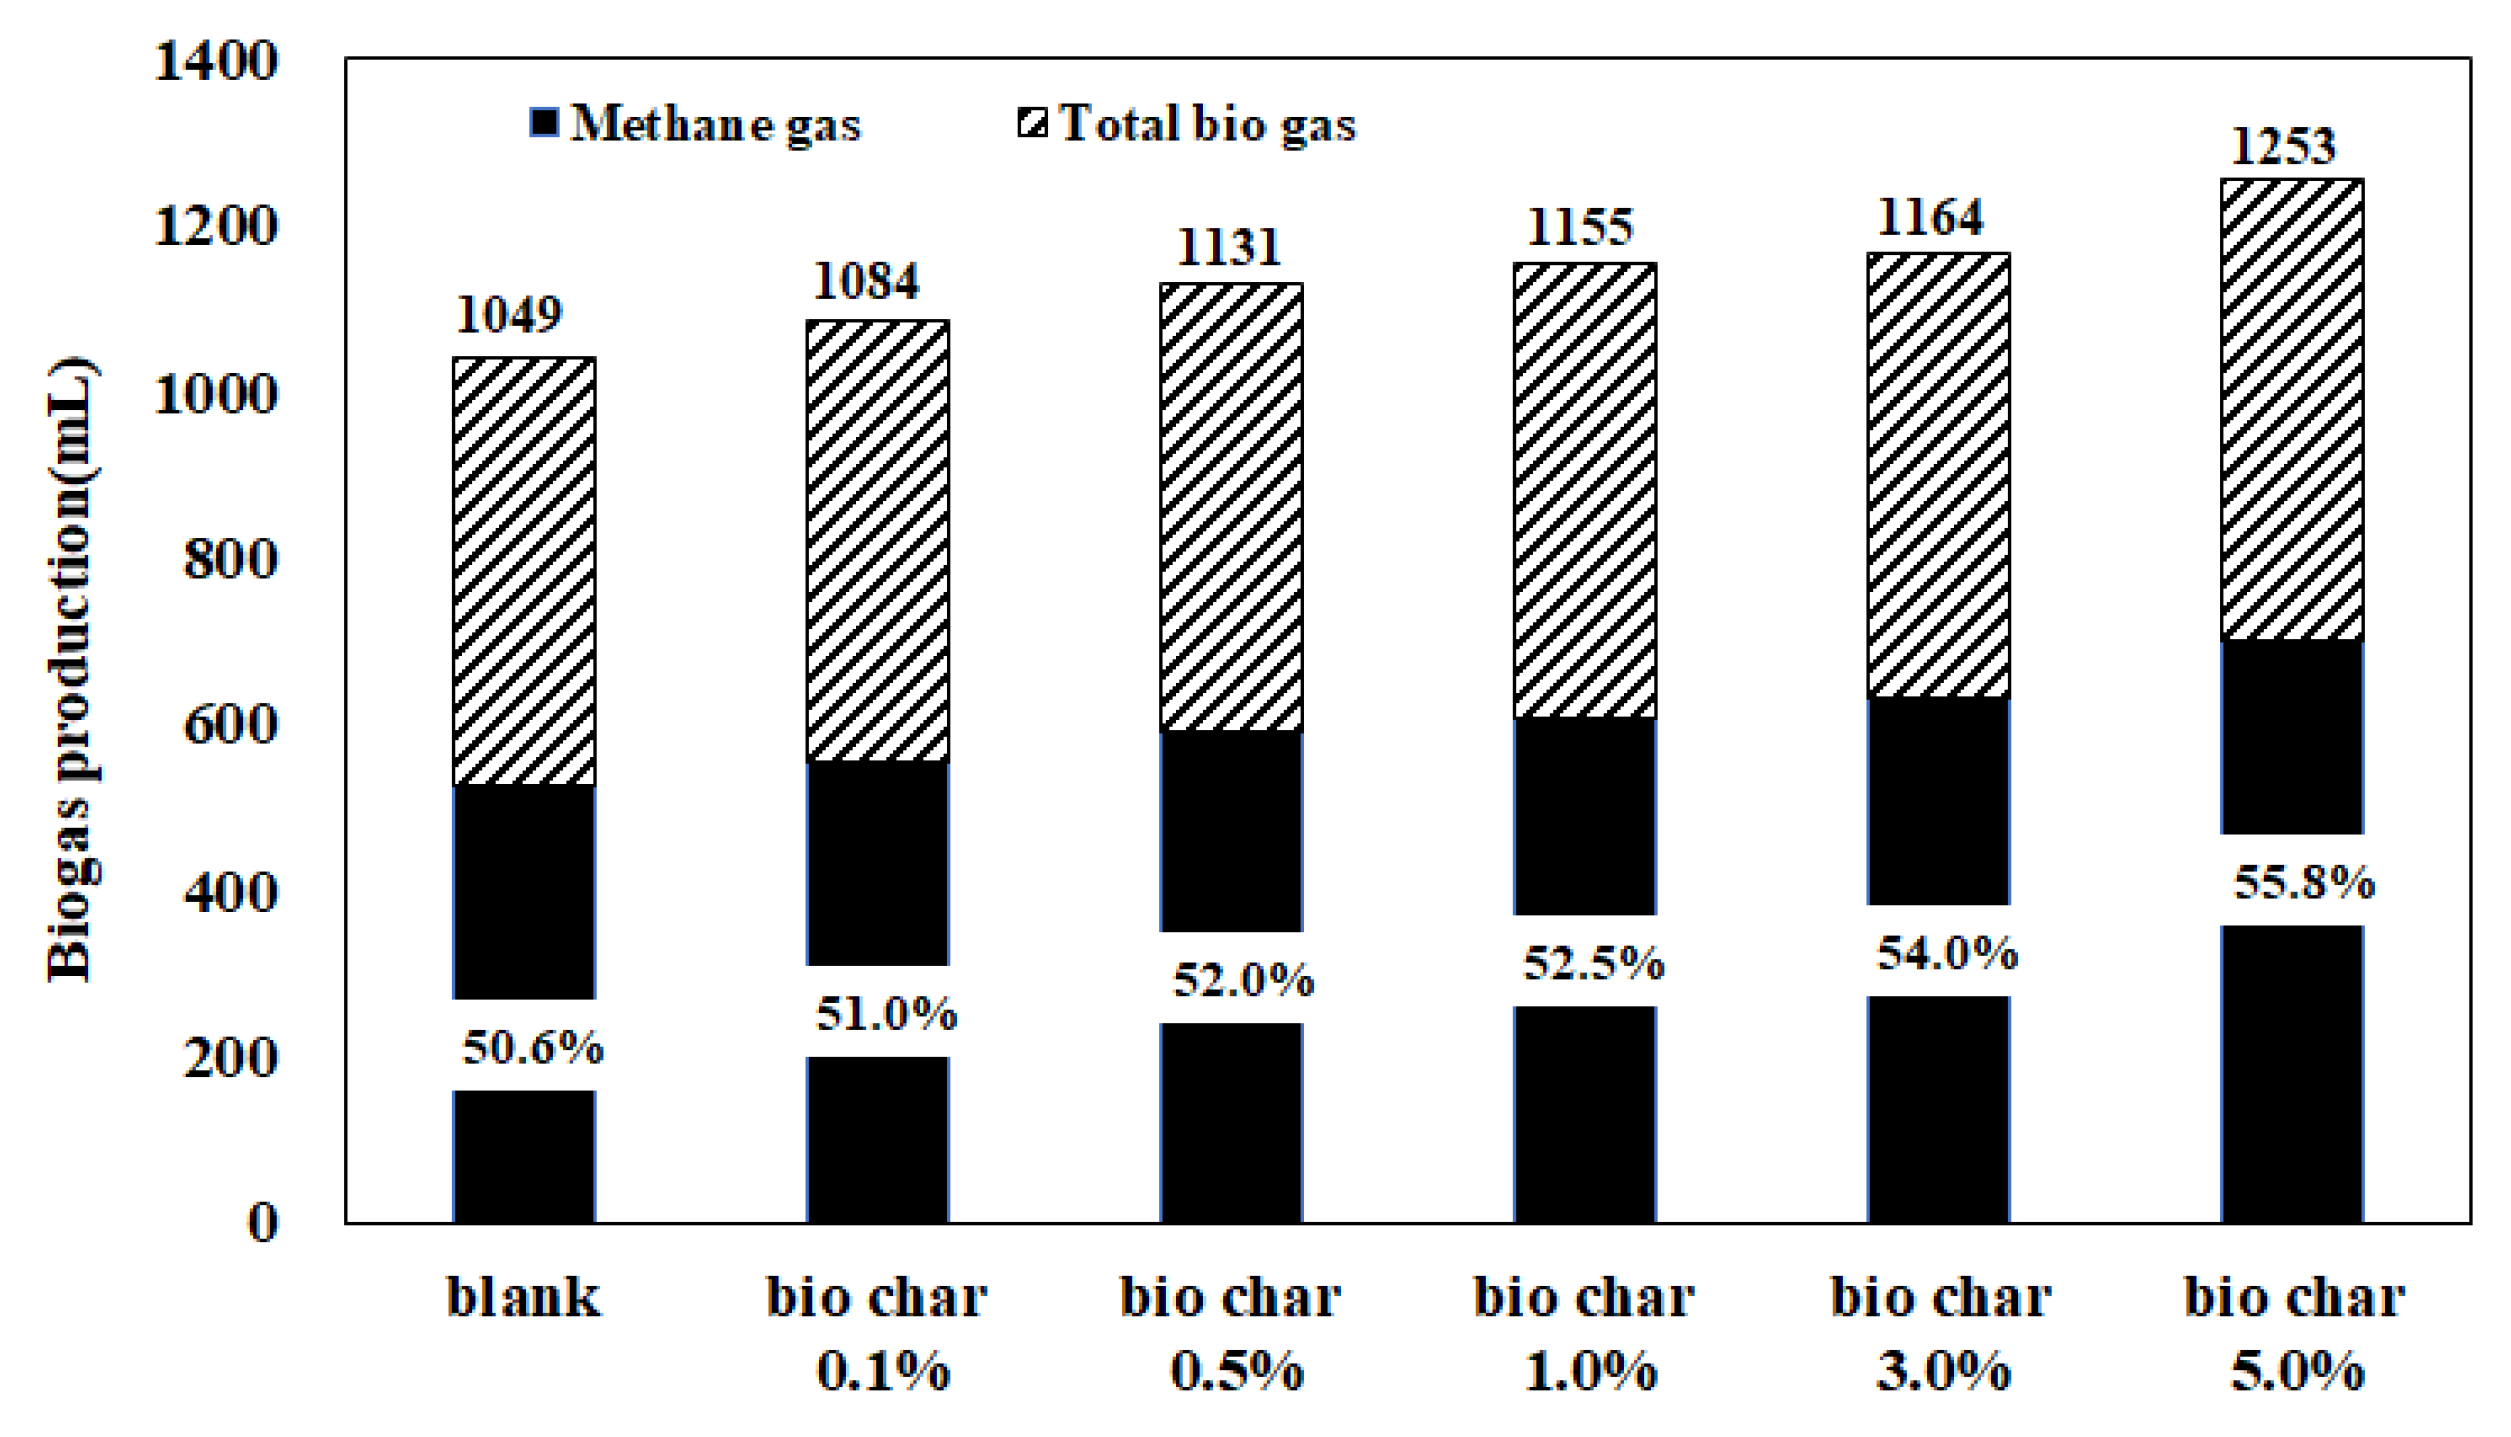
All conditions recorded the maximum volume of gas generation on day 4, which gradually decreased thereafter. The maximum volume of gas was higher in the added-biochar conditions than in the control condition. The less the biochar, the greater the maximum volume of gas generated on day 4 (133 mL at 0.1% biochar compared with 114 mL at 5.0%). In terms of the total amount of biogas generated during the period (Figure 3), however, increasing the amount of biochar increased the gas production (control condition: 1049 mL, 0.1%: 1084 mL, 0.5%: 1131 mL, 1.0%: 1155 mL, 3.0%: 1164 mL, and 5.0%: 1253 mL).
The volume of digestion gas produced was converted into unit volume per initial volatile suspended solids (VSS): 116, 120, 125, 128, 129, and 139 mL CH4·g−1 VSSin, increasing from the control with increasing quantities of biochar, respectively. The unit amount increased with increasing biochar, with the largest increase at 0.5% biochar.
Similar to gas production, the methane content (Figure 2) was low at 16.5% for the first two days due to the stabilization of the reactor and the generation of N2 by denitrification. However, from day 3, the methane content was maintained at 50% or higher. The average methane content of the control condition and the 0.1–5.0% biochar conditions (excluding the first two days of the stabilization phase) increased to 55.6%, 56.5%, 57.5%, 57.7%, 59.4%, and 61.1%, respectively (Figure 3).
The maximum daily gas production occurred on the third day with 0.1% biochar, while the methane content was highest at 5.0% on day 10. Zhang et al. [46] reported that the growth and activity of anaerobes could be increased by supplying trace elements. Therefore, it can be inferred that trace substances were eluted from the biochar, leading to the growth of methane-producing microorganisms and the continuous increase in the number of microorganisms.
3.2.2. Changes in Total Suspended Solids and Volatile Suspended Solids
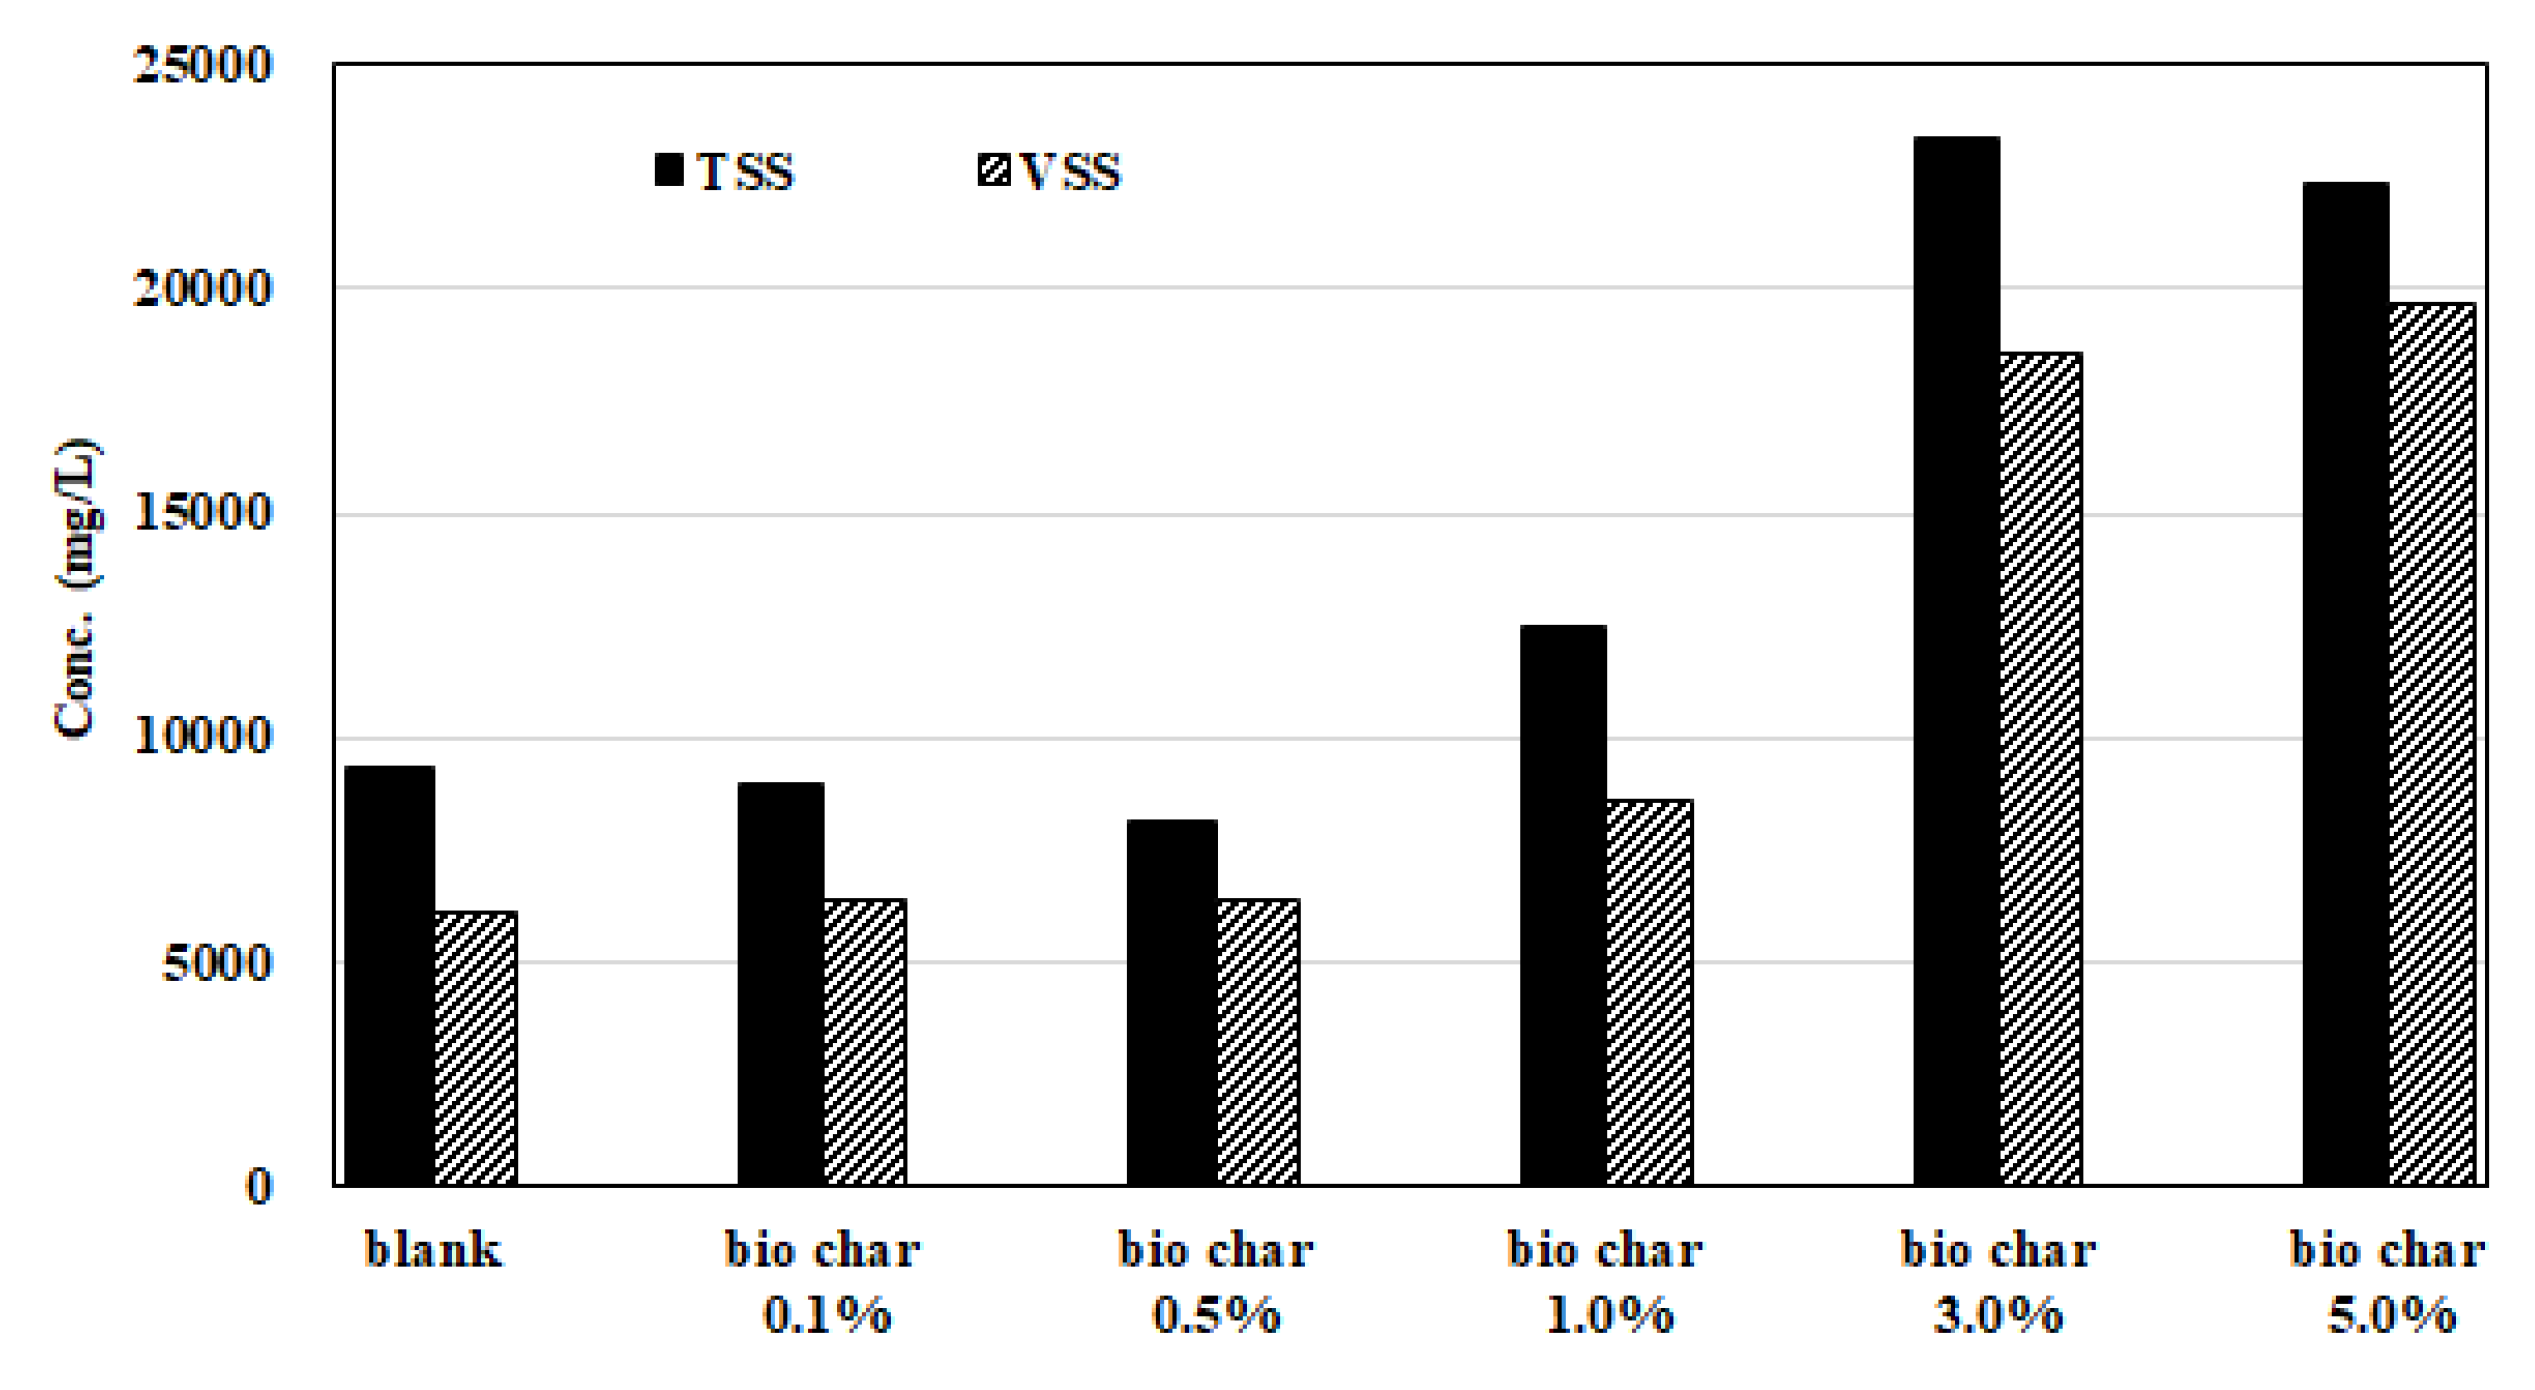
Total suspended solids (TSS) and VSS before and after the BMP test were analyzed to examine sludge reduction in the digestion reaction. TSS and VSS after the BMP test were analyzed including biochar (Figure 4). Both TSS and VSS decreased in biochar in the various conditions up to 0.5% and increased rapidly when 3% biochar was added. The VSS was lower than the initial value of 9020 mg·L−1 when less than 3% biochar was added; however, it increased with more than 3% biochar. These results are opposite to the typical AD digestion reaction, in which the decomposition of organic matter increases with gas production, and thus the VSS decreases. Biochar is reported to serve as a medium when it is added to the digestion tank [47], and according to Montalvo [48], the population of microorganisms increases when zeolite, which plays the role of medium, is put into the digestion tank.
3.3. Changes in Biochar before and after the Biochemical Methane Potential Test
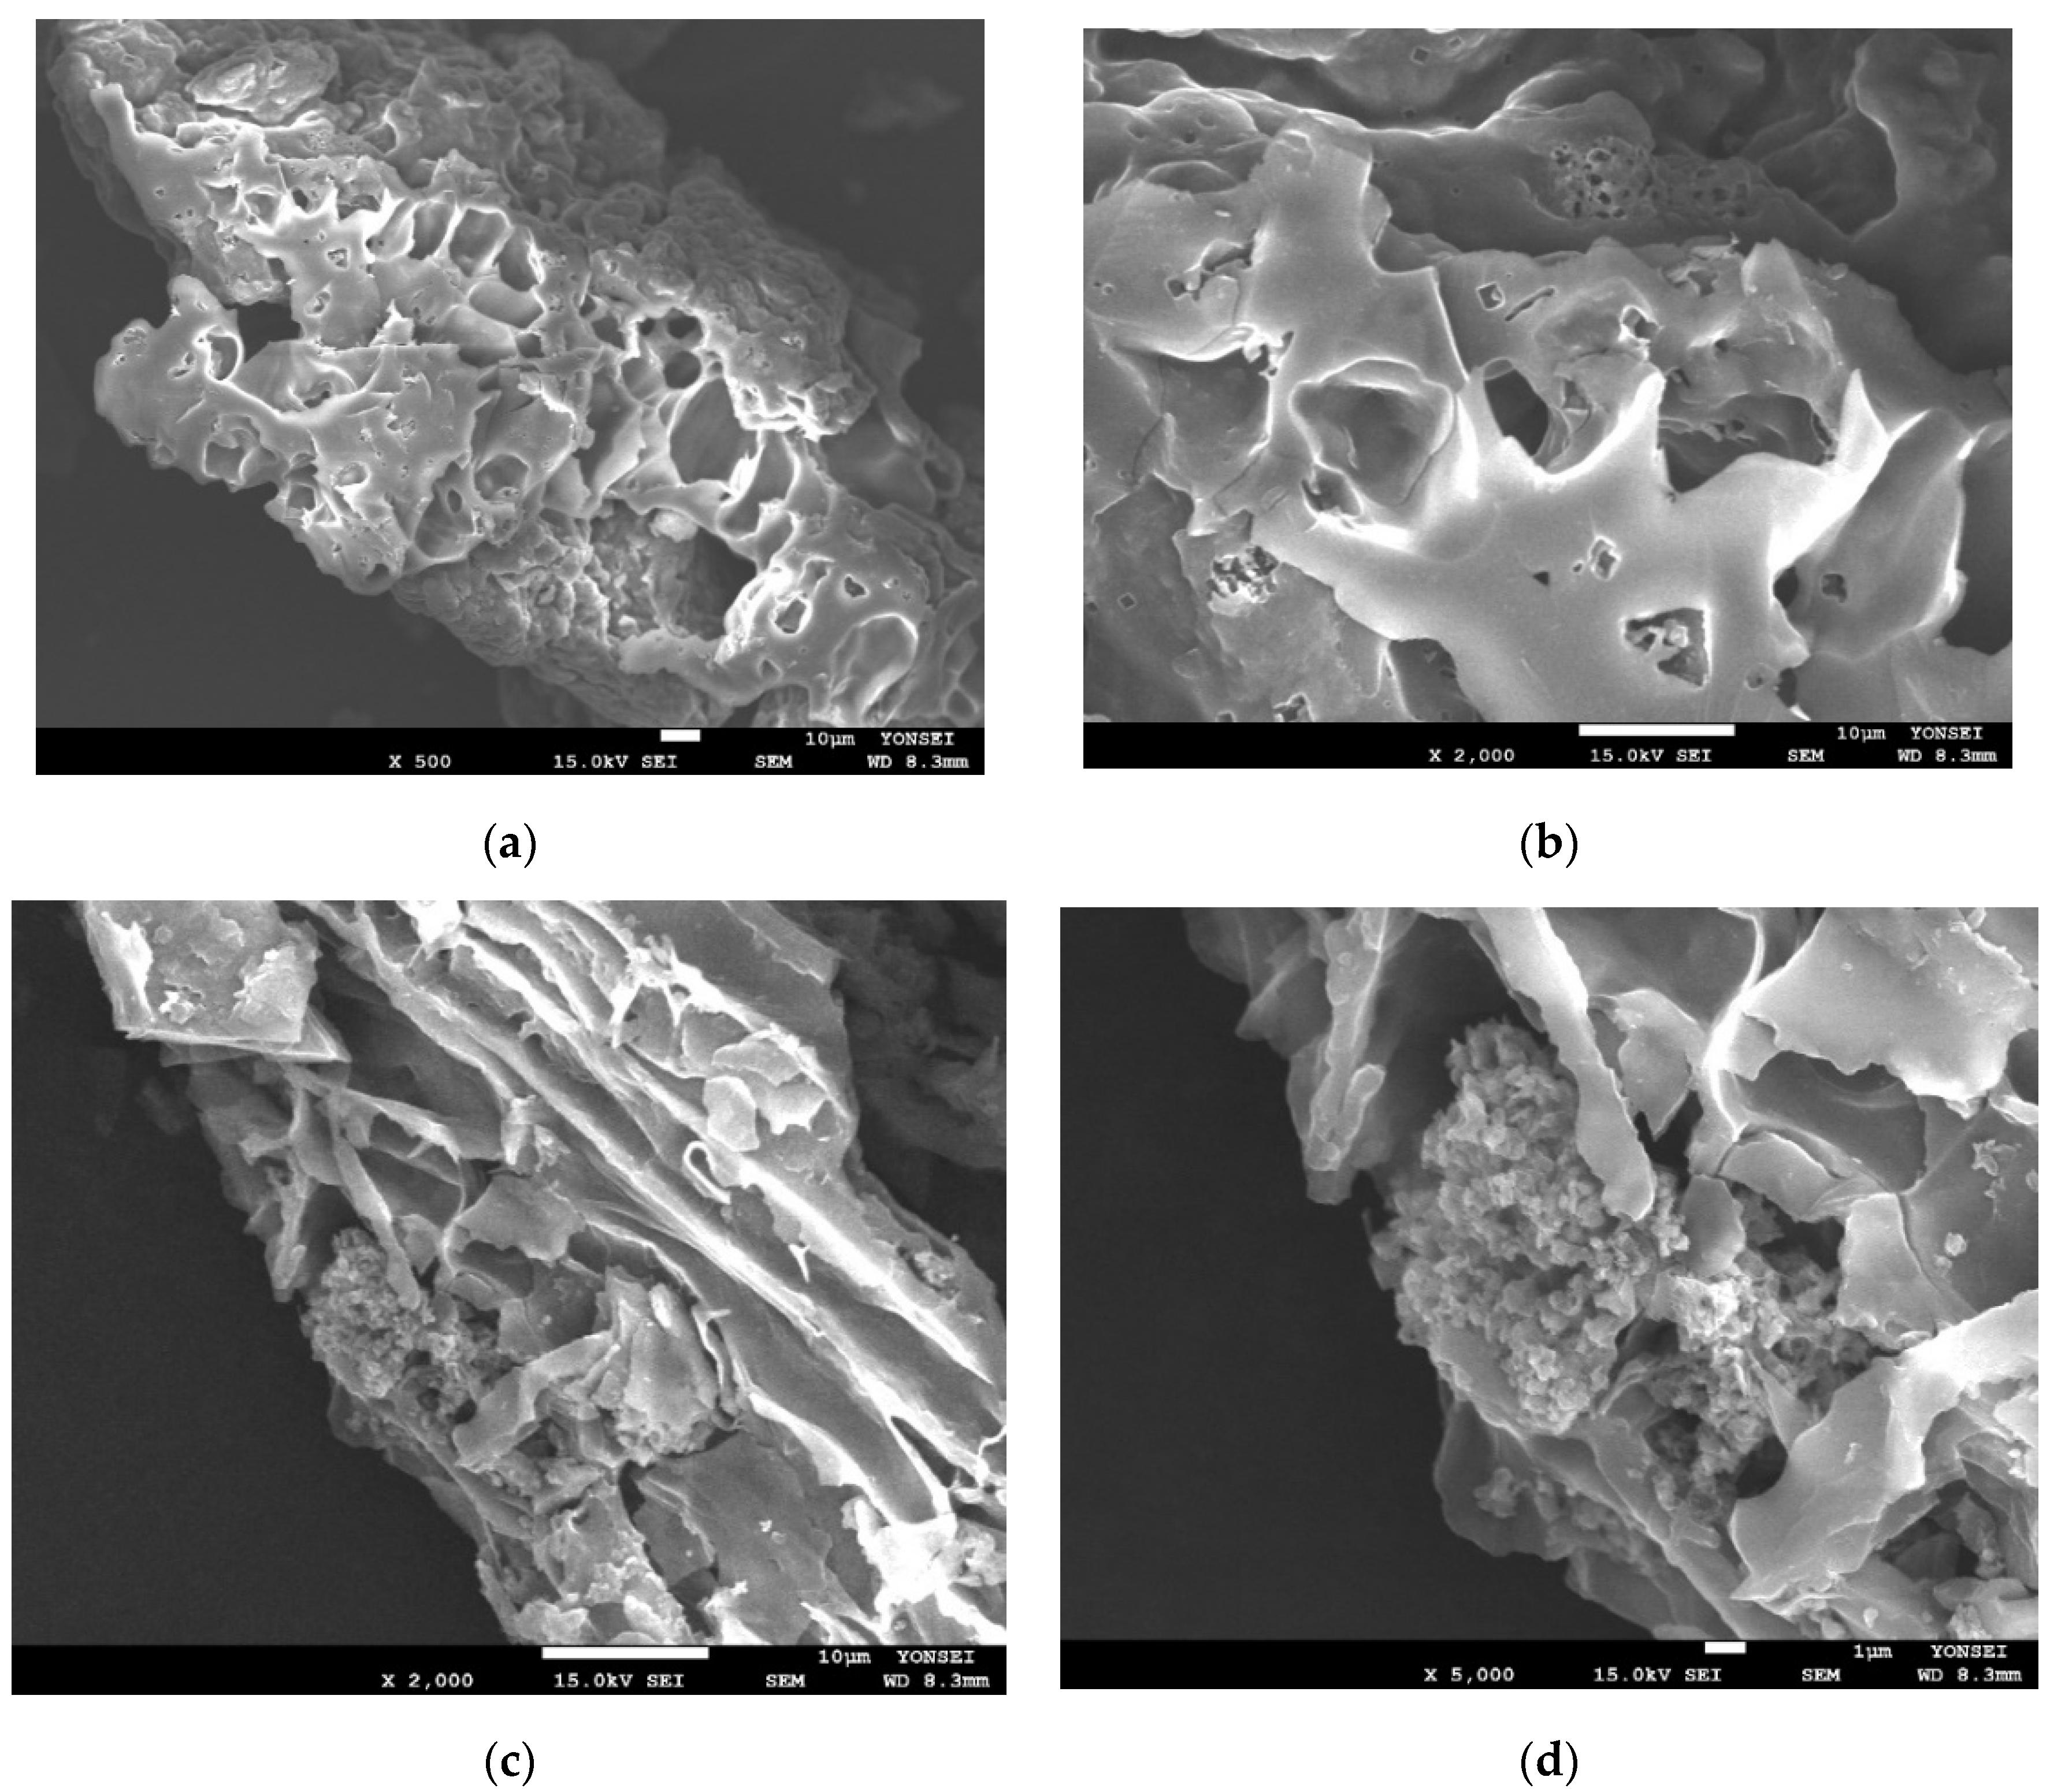
Figure 5 shows the results of the scanning electron microscopy (SEM) analysis performed to examine the changes in biochar before and after digestion (biochar was added to increase digestion efficiency.) As in the biochemical methane potential analysis, many pores were found in the biochar (Figure 5a,b), which appeared similar to those of the ceramic carrier suggested by Sun et al. [49]. Foreign substances were attached to the pores and surfaces after the digestion reaction (Figure 5c,d). The substances were similar to the images of methane-forming microorganisms reported by Yu et al. [50].
The EDS analysis indicated that O and P content, constituting significant proportions of the microorganisms, increased after the BMP test, leading to a relative reduction in C content (Table 3). Other trace substances, including Na, Mg, Al, and K, were not found after the BMP test.
3.4. Results of Methane Production Potential
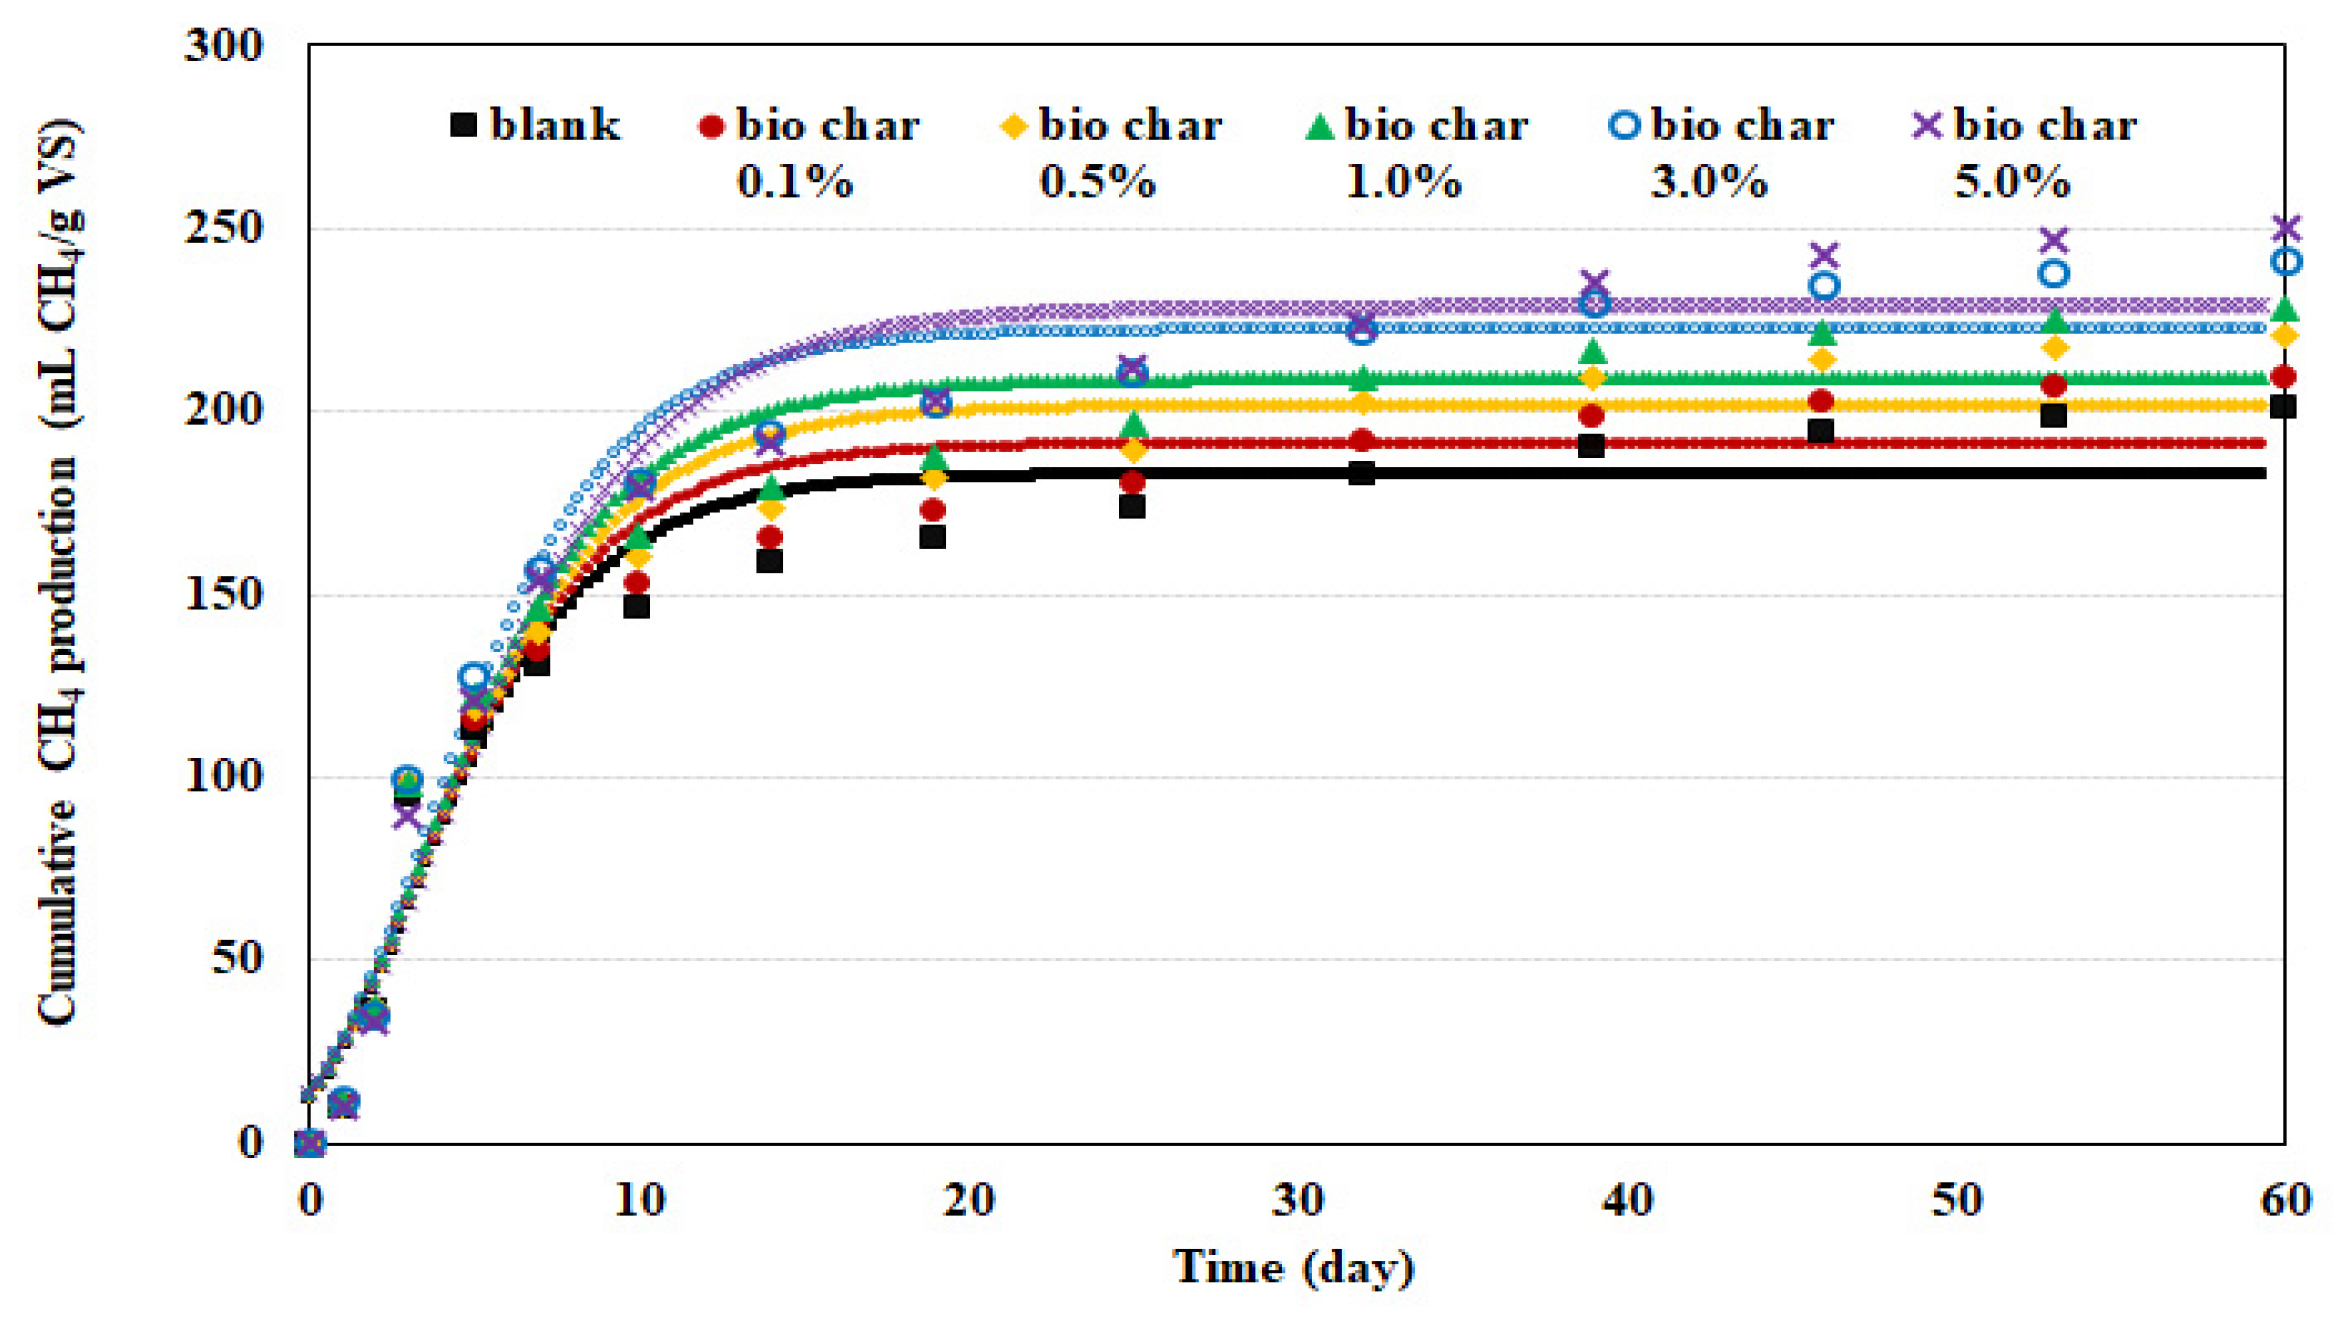
Applying the cumulative production curves of methane gas obtained from the BMP test to the modified Gompertz model for optimization showed that R2 was 0.95 or higher (maximum 0.9673), indicating that the results of the BMP test on methane production with organic waste were correctly simulated (Figure 6). Accordingly, the methane potential (the volume of methane produced) increased as biochar was added (182.8, 191.2, 201.9, 209.1, 222.3, and 228.8 mL CH4·g−1 VS), and the highest methane production rates were 21.5, 21.8, 22.1, 22.8, 25.0, and 22.5 mL CH4·g−1 g VS per day. Based on the methane potential and the highest methane production rates, 3% biochar achieved the highest efficiency. The rates increased up to 3% biochar but decreased at 5%, which can be attributed to the decrease in microbial activity due to the increased addition of biochar [44].
Figure 6 describes the fitted results obtained using the modified Gompertz equation. The experimental value matches the model value at 32 days. The dots indicate the experimentally obtained values. The model shows that the maximum gas production volume was achieved near day 17. However, the dots show that gas was continuously generated for more than 60 days, indirectly indicating that methane is produced from the organic material of the biochar.
4. Conclusions
Comparing and examining changes in digestion efficiency by adding food-waste-based biochar to the digestion tank indicated that the efficiency increased in the biochar-added conditions compared with the control condition as follows:
- Food-waste biochar added at a rate of 1% of the volume of the digestion tank increased the production of digestion gas by approximately 10% and methane by 4%;
- Increasing the biochar increased the number of microorganisms in the biochar. The 3% biochar condition had a higher VSS after the reaction compared to the initial stage of the reaction;
- The 3% biochar achieved the maximum methane production rate of 25.0 mL CH4·g−1 VS per day.
The results confirmed that food-waste-based biochar injected into digestion tanks enhanced digestion efficiency by serving as a medium contributing trace elements and increased the number of microorganisms. Therefore, using food-waste-based biochar to improve AD tank methane-production efficiency could be a practical and effective method for recycling food waste.
Author Contributions
Conceptualization, D.-C.S. and K.-H.A.; methodology, D.-C.S.; software, D.-C.S.; validation, D.-C.S., K.-H.A. and J.J.; formal analysis, Y.-E.L.; investigation, J.J. and Y.J.; resources, D.-C.S.; data curation, D.-C.S.; writing—original draft preparation, D.-C.S.; writing—review and editing, D.-C.S.; visualization, D.-C.S.; supervision, K.-H.A.; project administration, I.-T.K.; funding acquisition, I.-T.K. All authors have read and agreed to the published version of the manuscript.
Funding
Research for this paper was carried out under the KICT Research Program (project no. 20220079-001: Development of renewable energy source on power plant scale from food waste for a residential complex) funded by the Ministry of Science and ICT.
Institutional Review Board Statement
Not applicable.
Informed Consent Statement
Not applicable.
Data Availability Statement
Not applicable.
Conflicts of Interest
The authors declare no conflict of interest.
References
- Luz, F.C.; Cordiner, S.; Manni, A.; Mulone, V.; Rocco, V. Biochar characteristics and early applications in anaerobic digestion: A review. J. Environ. Chem. Eng. 2018, 6, 2892–2909. [Google Scholar] [CrossRef]
- Abbas, Y.; Yun, S.; Wang, Z.; Zhang, Y.; Zhang, X.; Wang, K. Recent advances in bio-based carbon materials for anaerobic digestion. Renew. Sustain. Energy Rev. 2021, 135, 110378. [Google Scholar] [CrossRef]
- Ugwu, S.; Harding, K.; Enweremadu, C. Comparative life cycle assessment of enhanced anaerobic digestion of agro-industrial waste for biogas production. J. Clean. Prod. 2022, 345, 131178. [Google Scholar] [CrossRef]
- Ming, G.; Shuang, Z.; Xinxin, M.; Weijie, G.; Na, S.; Qunhui, W.; Chuanfu, W. Effect of yeast addition on the biogas production performance of a food waste anaerobic digestion system. R. Soc. Open Sci. 2021, 7, 200443. [Google Scholar] [CrossRef]
- Zhang, C.; Su, H.; Baeyens, J.; Tan, T. Reviewing the anaerobic digestion of food waste for biogas production. Renew. Sustain. Energy Rev. 2014, 38, 383–392. [Google Scholar] [CrossRef]
- Rabii, A.; Aldin, S.; Dahman, Y.; Elbeshbishy, E. A Review on anaerobic co-digestion with a focus on the microbial populations and the effect of multi-stage digester configuration. Energies 2019, 12, 1106. [Google Scholar] [CrossRef] [Green Version]
- Fijoo, G.; Soto, M.; Méndez, M.; Lema, J.M. Sodium inhibition in the anaerobic digestion process: Antagonism and adaptation phenomena. Enzym. Microb. Technol. 1995, 17, 180–188. [Google Scholar] [CrossRef]
- Liu, Y.; Wang, W.; Wachem, A.; Zou, D. Effects of adding osmoprotectant on anaerobic digestion of kitchen waste with high level of salinity. J. Biosci. Bioeng. 2019, 128, 723–732. [Google Scholar] [CrossRef]
- Bo, Z.; Pin-jing, H. Performance assessment of two-stage anaerobic digestion of kitchen wastes. Environ. Technol. 2014, 34, 1277–1285. [Google Scholar] [CrossRef] [PubMed]
- Świechowski, K.; Matyjewicz, B.; Telega, P.; Białowiec, A. The influence of low-temperature food waste biochars on anaerobic digestion of food waste. Materials 2022, 15, 945. [Google Scholar] [CrossRef]
- Yun, S.; Fang, W.; Du, T.; Hu, X.; Huang, X.; Li, X. Use of bio-based carbon materials for improving biogas yield and digestate stability. Energy 2018, 164, 898–909. [Google Scholar] [CrossRef]
- Zhang, L.; Zhang, J.; Loh, K.-C. Activated carbon enhanced anaerobic digestion of food waste–Laboratory-scale and Pilot-scale operation. Waste Manag. 2018, 75, 270–279. [Google Scholar] [CrossRef]
- Lee, J.; Lee, S.-H.; Park, H. Enrichment of specific electro-active microorganisms and enhancement of methane production by adding granular activated carbon in anaerobic reactors. Bioresour. Technol. 2016, 205, 205–212. [Google Scholar] [CrossRef] [PubMed]
- Cai, J.; He, P.; Wang, Y.; Shao, L.; Lü, F. Effects and optimization of the use of biochar in anaerobic digestion of food wastes. Waste Manag. Res. 2016, 34, 409–416. [Google Scholar] [CrossRef] [PubMed]
- González, J.; Sánchez, M.E.; Gómez, X. Enhancing anaerobic digestion: The effect of carbon conductive materials. J. Carbon Res. 2018, 4, 59. [Google Scholar] [CrossRef] [Green Version]
- Indren, M.; Birzer, C.H.; Kidd, S.P.; Hall, T.; Medwell, P.R. Effects of biochar parent material and microbial pre-loading in biochar-amended high-solids anaerobic digestion. Bioresour. Technol. 2020, 298, 122457. [Google Scholar] [CrossRef]
- Yue, X.; Arena, U.; Chen, D.; Lei, K.; Dai, Z. Anaerobic digestion disposal of sewage sludge pyrolysis liquid in cow dung matrix and the enhancing effect of sewage sludge char. J. Clean. Prod. 2019, 235, 801–811. [Google Scholar] [CrossRef]
- Mumme, J.; Srocke, F.; Heeg, K.; Werner, M. Use of biochars in anaerobic digestion. Bioresour. Technol. 2014, 164, 189–197. [Google Scholar] [CrossRef]
- Cimon, C.; Kadota, P.; Eskicioglu, C. Effect of biochar and wood ash amendment on biochemical methane production of wastewater sludge from a temperature phase anaerobic digestion process. Bioresour. Technol. 2020, 297, 122440. [Google Scholar] [CrossRef]
- Qi, Q.; Sun, C.; Zhang, J.; He, Y.; Tong, Y.W. Internal enhancement mechanism of biochar with graphene structure in anaerobic digestion: The bioavailability of trace elements and potential direct interspecies electron transfer. Chem. Eng. J. 2021, 406, 126833. [Google Scholar] [CrossRef]
- Jeong, Y.; Lee, Y.; Kim, I. Characterization of sewage sludge and food waste-based biochar for co-firing in a coal-fired power plant: A case study in Korea. Sustainability 2020, 12, 9411. [Google Scholar] [CrossRef]
- Yrjälä, K.; Lopez-Echartea, E. Chapter Ten: Structure and function of biochar in remediation and as carrier of microbes. Advances in Chemical Pollution. Adv. Chem. Pollut. Environ. Manag. Prot. 2021, 7, 269–294. [Google Scholar] [CrossRef]
- Ahn, K.; Shin, D.; Jung, J.; Jeong, Y.; Lee, Y.; Kim, I. Physicochemical properties of torrefied and pyrolyzed food waste biochars as fuel: A pilot-scale study. Energies 2022, 15, 333. [Google Scholar] [CrossRef]
- Gao, Y.; Fang, Z.; Liang, P.; Zhang, X.; Qiu, Y.; Kimura, K.; Haung, X. Anaerobic digestion performance of concentrated municipal sewage by forward osmosis membrane: Focus on the impact of salt and ammonia. Bioresour. Technol. 2019, 276, 204–210. [Google Scholar] [CrossRef] [PubMed]
- Roberts, K.P.; Heaven, S.; Banks, C.J. Quantification of methane losses from the acclimatisation of anaerobic digestion to marine salt concentrations. Renew. Energy 2016, 86, 497–506. [Google Scholar] [CrossRef] [Green Version]
- Owen, W.F.; Stuckey, D.C.; Healy, J.B.; Young, L.Y.; McCarty, P.L. Bioassay for monitoring biochemical methane potential and anaerobic toxicity. Water Res. 1979, 13, 485–492. [Google Scholar] [CrossRef]
- Shelton, D.R.; Tiedje, J.M. General method for determining anaerobic biodegradation potential. Appl. Environ. Microbiol. 1984, 47, 850–857. [Google Scholar] [CrossRef] [PubMed] [Green Version]
- Lay, J.-J.; Li, Y.-Y.; Noike, T. Influences of pH and moisture content on the methane production in high-solids sludge digestion. Water Res. 1997, 31, 1518–1524. [Google Scholar] [CrossRef]
- Lay, J.J.; Li, Y.Y.; Noike, T. Developments of bacterial population and methanogenic activity in a laboratory-scale landfill bioreactor. Water Res. 1998, 32, 3673–3679. [Google Scholar] [CrossRef]
- Murray, P.A.; Zinder, S.H. Nutritional requirements of Methanosarcina sp. strain TM-1. Appl. Environ. Microbiol. 1985, 50, 49–55. [Google Scholar] [CrossRef] [Green Version]
- Zandvoort, M.H.; van Hullebusch, E.D.; Gieteling, J.; Lens, P.N.L. Granular sludge in full-scale anaerobic bioreactors: Trace element content and deficiencies. Enzym. Microb. Technol. 2006, 39, 337–346. [Google Scholar] [CrossRef]
- Zimmerman, A.R. Abiotic and microbial oxidation of laboratory-produced black carbon (biochar). Environ. Sci. Technol. 2010, 44, 1295–1301. [Google Scholar] [CrossRef] [PubMed]
- Molaey, R.; Bayrakdar, A.; Sürmeli, R.O.; Çalli, B. Influence of trace element supplementation on anaerobic digestion of chicken manure: Linking process stability to methanogenic population dynamics. J. Clean. Prod. 2018, 181, 794–800. [Google Scholar] [CrossRef]
- Albracht, S.P.J. Nickel hydrogenases: In search of the active site. Biochim. Biophys. Acta Bioenerg. 1994, 1188, 167–204. [Google Scholar] [CrossRef] [Green Version]
- Fauque, G.; Peck, H.D., Jr.; Moura, J.J.G.; Huynh, B.H.; Berlier, Y.; DerVartanian, D.V.; Teixeira, M.; Przybyla, A.E.; Lespinat, P.A.; Moura, I.; et al. The three classes of hydrogenases from sulfate-reducing bacteria of the genus Desulfovibrio. FEMS Microbiol. 1988, 4, 299–344. [Google Scholar] [CrossRef]
- Sawers, G. The hydrogenases and formate dehydrogenases of Escherichia coli. Antonie Van Leeuwenhoek 1994, 66, 57–88. [Google Scholar] [CrossRef]
- Takashima, M.; Speece, R.E.; Parkin, G.F. Mineral requirements for methane fermentation. Crit. Rev. Environ. Control 1990, 19, 465–479. [Google Scholar] [CrossRef]
- Lipscomb, J.B. Biochemistry of the soluble methane monooxygenase. Annu. Rev. Microbiol. 1994, 48, 371–399. [Google Scholar] [CrossRef]
- Zhang, T.; Zhang, P.; Hu, Z.; Qi, Q.; He, Y.; Zhang, J. New insight on Fe-bioavailability: Bio-uptake, utilization, and induce in optimizing methane production in anaerobic digestion. Chem. Eng. J. 2022, 441, 136099. [Google Scholar] [CrossRef]
- Schindelin, H.; Kisker, C.; Schlessman, J.L.; Howard, J.B.; Rees, D.C. Structure of ADP·AIF4-stabilized nitrogenase complex and its implications for signal transduction. Nature 1997, 387, 370–376. [Google Scholar] [CrossRef]
- Sing, K.S.W. Reporting physisorption data for gas/solid systems with special reference to the determination of surface area and porosity (Recommendations 1984). Pure Appl. Chem. 1985, 57, 603–619. [Google Scholar] [CrossRef]
- Rouquerol, J.; Avnir, D.; Fairbridge, C.W.; Everett, D.H.; Haynes, J.H.; Pernicone, N.; Ramsay, J.D.F.; Sing, K.S.W.; Unger, K.K. Recommendations for the characterization of porous solids. Pure Appl. Chem. 1994, 6, 1739–1758. [Google Scholar] [CrossRef]
- Lehmann, J.; Joseph, S. Biochar for Environmental Management: Science, Technology and Implementation, 2nd ed.; Routledge: London, UK, 2015. [Google Scholar] [CrossRef]
- Qambrani, N.A.; Rahman, M.M.; Won, S.; Shim, S.; Ra, C. Biochar properties and eco-friendly applications for climate change mitigation, waste management, and wastewater treatment: A review. Renew. Sustain. Energy Rev. 2017, 79, 255–273. [Google Scholar] [CrossRef]
- Choong, Y.Y.; Norli, I.; Abdullah, A.Z.; Yhaya, M.F. Impacts of trace element supplementation on the performance of anaerobic digestion process: A critical review. Bioresour. Technol. 2016, 209, 369–379. [Google Scholar] [CrossRef] [PubMed]
- Zhang, L.; Jahng, D. Long-term anaerobic digestion of food waste stabilized by trace elements. J. Waste Manag. 2012, 32, 1151–1509. [Google Scholar] [CrossRef]
- Chiappero, M.; Norouzi, O.; Hu, M.; Demichelis, F.; Berruti, F.; Di Maria, F.; Masek, O.; Fiore, S. Review of biochar role as additive in anaerobic digestion processes. Renew. Sustain. Energy Rev. 2020, 131, 110037. [Google Scholar] [CrossRef]
- Montalvo, S.; Huiliñir, C.; Borja, R.; Sánchez, E.; Herrmann, C. Application of zeolites for biological treatment processes of solid wastes and wastewaters: A review. Bioresour. Technol. 2020, 301, 122808. [Google Scholar] [CrossRef]
- Sun, M.T.; Yang, Z.M.; Lu, J.; Fan, X.L.; Guo, R.B.; Fu, S.F. Improvement of bacterial methane elimination using porous ceramsite as biocarrier. J. Chem. Technol. Biotechnol. 2018, 93, 2406–2414. [Google Scholar] [CrossRef]
- Yu, Y.; Lu, X.; Wu, Y. Performance of an anaerobic baffled filter reactor in the treatment of algae-laden water and the contribution of granular sludge. Water 2014, 6, 122–138. [Google Scholar] [CrossRef] [Green Version]
Figure 1.
Adsorption-desorption isotherm curves of nitrogen.

Figure 2.
Methane content by condition (biochar content); (a) control 0%, (b) 0.1%, (c) 0.5%, (d) 1.0%, (e) 3.0%, (f) 5.0%.
Figure 2.
Methane content by condition (biochar content); (a) control 0%, (b) 0.1%, (c) 0.5%, (d) 1.0%, (e) 3.0%, (f) 5.0%.

Figure 3.
Comparison of total gas generation and methane content with biochar content.

Figure 4.
Total suspended solids (TSS) and volatile suspended solids (VSS) before and after the biochemical methane potential test.
Figure 4.
Total suspended solids (TSS) and volatile suspended solids (VSS) before and after the biochemical methane potential test.

Figure 5.
Scanning electron microscopy analysis before and after the biochemical methane potential test (a) before, ×500; (b) before, ×2000; (c) after, ×2000; and (d) after, ×5000.
Figure 5.
Scanning electron microscopy analysis before and after the biochemical methane potential test (a) before, ×500; (b) before, ×2000; (c) after, ×2000; and (d) after, ×5000.

Figure 6.
Comparison of the derived modified Gompertz equations using the results obtained in the current study.
Figure 6.
Comparison of the derived modified Gompertz equations using the results obtained in the current study.


Table 1.
Sludge properties.
| COD (mg/L) | TSS (mg/L) | VSS (mg/L) | NH4+-N (mg/L) | VFA (mg/L) | Alkalinity (mg/L as CaCO3) | |
|---|---|---|---|---|---|---|
| Excess sludge | 15,184 | 13,380 | 9170 | 8.1 | 22.5 | 110 |
| Digested sludge | - | 17,630 | 8870 | - | 198.5 | 4140 |
COD: chemical oxygen demand; TSS: total suspended solids; VSS: volatile suspended solids; VFA: volatile fatty acids.
Table 2.
Food-waste-biochar composition.
| Element | Ca | Cl | K | Fe | P | S | Sr |
| Fraction (%) | 59.16 | 17.63 | 15.39 | 4.48 | 1.73 | 0.83 | 0.25 |
| Element | Mn | Ti | Br | Cu | Cr | Rb | Zn |
| Fraction (%) | 0.15 | 0.13 | 0.08 | 0.07 | 0.06 | 0.02 | 0.02 |
Table 3.
Energy dispersive spectroscopy results before and after the biochemical methane potential test.
Table 3.
Energy dispersive spectroscopy results before and after the biochemical methane potential test.
| Element | C | O | P | Na | Mg | Al | S | Cl | K | Ca |
|---|---|---|---|---|---|---|---|---|---|---|
| Before | 84.98 | 10.85 | - | 1.04 | 0.14 | 0.08 | 0.11 | 1.33 | 1.10 | 0.36 |
| After | 66.92 | 31.51 | 0.48 | - | - | - | 0.37 | - | - | 0.71 |
Publisher’s Note: MDPI stays neutral with regard to jurisdictional claims in published maps and institutional affiliations. |
© 2022 by the authors. Licensee MDPI, Basel, Switzerland. This article is an open access article distributed under the terms and conditions of the Creative Commons Attribution (CC BY) license (https://creativecommons.org/licenses/by/4.0/).
Share and Cite
MDPI and ACS Style
Shin, D.-C.; Kim, I.-T.; Jung, J.; Jeong, Y.; Lee, Y.-E.; Ahn, K.-H. Increasing Anaerobic Digestion Efficiency Using Food-Waste-Based Biochar. Fermentation 2022, 8, 282. https://0-doi-org.brum.beds.ac.uk/10.3390/fermentation8060282
AMA Style
Shin D-C, Kim I-T, Jung J, Jeong Y, Lee Y-E, Ahn K-H. Increasing Anaerobic Digestion Efficiency Using Food-Waste-Based Biochar. Fermentation. 2022; 8(6):282. https://0-doi-org.brum.beds.ac.uk/10.3390/fermentation8060282
Chicago/Turabian StyleShin, Dong-Chul, I-Tae Kim, Jinhong Jung, Yoonah Jeong, Ye-Eun Lee, and Kwang-Ho Ahn. 2022. "Increasing Anaerobic Digestion Efficiency Using Food-Waste-Based Biochar" Fermentation 8, no. 6: 282. https://0-doi-org.brum.beds.ac.uk/10.3390/fermentation8060282
Note that from the first issue of 2016, this journal uses article numbers instead of page numbers. See further details here.