Article

Effects of Adding Ethanol Extract of Propolis on the Fermentation Quality, Aerobic Stability, Fatty Acid Profile, and In Vitro Digestibility of Alfalfa Silages

by
Sibel Soycan Önenç
1,*,
Banu Yücel
2 and
Aslı Turan Uçman
1
1
Department of Animal Science, Faculty of Agriculture, Tekirdağ Namık Kemal University, Tekirdağ 59030, Turkey
2
Department of Animal Science, Faculty of Agriculture, Ege University, İzmir 35100, Turkey
*
Author to whom correspondence should be addressed.
Submission received: 22 July 2022 / Revised: 18 August 2022 / Accepted: 19 August 2022 / Published: 21 August 2022

Abstract

:
This study was planned to determine the effects of ethanol extract of propolis on the fermentation quality, fatty acid profile, aerobic stability, and in vitro digestibility of alfalfa silages. The ethanol extract of propolis was added to alfalfa at levels of 1000 mg/kg (PROP1), 2000 mg/kg (PROP2), and 3000 mg/kg (PROP3); propolis was not added to the control (CON) group. After the propolis was added, the pH value of the alfalfa silage declined, and the crude protein content was effectively preserved (p < 0.05). Adding propolis to alfalfa silages caused crude fiber, neutral detergent fiber, and acid detergent fiber (p < 0.05) to decrease. The ethanol extract of propolis significantly improved the lactic acid content and reduced the NH3-N content (p < 0.05). Propolis significantly improved the unsaturated fatty acid content (p < 0.05) and reduced the saturated fatty acid content (p < 0.05). In addition, propolis significantly improved the relative feed value, the digestibility of the organic matter, and the in vitro metabolic energy content (p < 0.05). These results show that the ethanol extract of propolis improves the silage quality of last cutting alfalfa silages, and has potential as an antimicrobial silage additive.

1. Introduction

Alfalfa (Medicago sativa), which is in the front row among forage plants, is given to livestock as hay. Recently, especially in regions with copious amounts of precipitation, where there is not enough opportunity to dry late-harvested alfalfa, it is usually processed as silage [1]. Alfalfa silage is highly nutritive for ruminant animals due to its relatively low fiber content, high protein content, and high digestibility. Additionally, alfalfa silage is suitable for ruminal fermentation [2]. As green forage for silage, alfalfa is classified as a forage plant that is difficult to silage. Therefore, it becomes compulsory to use additives to silage forage rich in protein but poor in carbohydrate [3]. Since antibiotics effectively kill microorganisms and stop their growth, their use as additives in silage production has been investigated [4]. However, the prohibition of antibiotics as additives and the increasing interest in natural products have brought new alternatives to food, animal nutrition, and medicine in recent years [1].
Turkey is in the top three countries in the world in the production of bees and bee products; it ranks third in the world in the total number of hives and second in honey production. There has been an increase in the total number of hives in recent years [5]. In addition, an increase is expected for bee products. Propolis is a herbal resin collected by bees from various parts of herbs to protect the hive against insects and microorganisms, as well as maintaining ideal heat and moisture conditions [6]. Propolis has been the subject of research worldwide as an alternative to antibiotics due to its biological activity, such as antimicrobial, anti-inflammatory, antioxidant, and immunostimulatory activities [7]. Many researchers have investigated the use of propolis extract for feeding ruminants [8,9,10,11] and for preventing calf diarrhea [12]. International pressure to reduce or eliminate the use of growth-promoting antibiotics in livestock has intensified in recent years. In fact, antibiotic use has been banned for more than 10 years in some countries. Therefore, it is imperative to seek alternatives such as propolis [6].The preference of the public has gradually shifted to alternative natural feed additives, such as propolis.As it is a natural product, propolis can be used as a feed additive for animal production. Furthermore, it can meet consumers’ expectations regarding the reliability and toxicity of animal products. Propolis is an alternative natural additive to antibiotics in ruminant rations [13]. Lactating lambs are constantly faced with natural challenges that affect their health and productivity [6]. Cecere et al. showed that propolis in milk increased the growth and antimicrobial, antioxidant, and immune responses of lactating lambs, and the greatest effects were observed for the dosage of 150 μL propolis/kg body weight/day [6]. Thus, propolis is a promising additive to improve the growth and health of sheep production [6].
The research on propolis as an antimicrobial silage additive is limited [14]. Arslan Duru et al. reported that the Flieg’s scores of the silages, especially with0.5% and 1.0% of propolis, were significantly higher than other groups. Moreover, it was determined that the lactic acid and acetic acid content of the silages statistically significantly reduced with 1.0% of propolis additives [14]. In addition, sulfite-reducing anaerobes, mold, and enterobacteria were found to be below the detection limit, and yeast was observed in the group containing 0.5% propolis [14]. The evaluation of propolis as a silage additive will contribute to the country’s economy. Economic income will not only be derived from the exportation of bee products, but also from the exportation of propolis-containing silage additives. In addition, people will be provided with jobs in the production of silage additives containing propolis.
Thus, it is hypothesized that ethanol extract of propolis could be used as a potential silage additive based on its antimicrobial properties. Accordingly, this study investigated the effects of propolis ethanol extract on the fermentation quality, aerobic stability, fatty acid composition, and in vitro digestibility of alfalfa silages.

2. Materials and Methods

2.1. Propolis and Silage Preparation

Pinus brutia propolis, obtained from the Aegean Region in autumn, was used in this study. A 3-mm porous propolis trap, a standard size, was placed on the brood chamber in the hive; the trap was removed from the hive after it was full of propolis and was kept in a deep freezer at −18 °C until the extraction process [15]. The propolis, once taken out of the deep freezer for extraction, was separated from the trap and kept in warm (20 °C) distilled water (fully submerged) for 3 h to clear it of potential dust and visible impurities. Then, crude propolis was taken out of the water, dried in an oven at 30 °C for up to 3 h, and the extraction was prepared by powdering it in a grinder (Delonghi® Kg49, Hampshire, UK). For extraction, 500 g powdered propolis, dissolved in 70% ethyl alcohol solution (9500 mL), was shaken for 15 days in a dark glass bottle in a laboratory environment with no sunlight, then filtered through rough filter paper. The ethyl alcohol was removed partially by keeping the propolis at 50 °C for 1h in the oven; the propolis was purified and made ready for use. Gas chromatography–mass spectrometry (GC–MS, Hewlett Packard 6890) was used in the chemical analysis of the ethanol extract of propolis. The capillary column (25 mm thickness, 0.25 mm diameter, and 30 m length) and helium carrier gas (31 mL/min linear velocity, 20:1 split ratio, and 230 °C temperature) was used on the GC-MS system [16]. The composition of propolis ethanol extract is shown in Table 1.
The level of propolis was determined according to previous studies [14]. The study was conducted with four replications in four groups, which comprised the control (CONT), to which no additive was added, and the 1000 mg / kg (PROP1), 2000 mg / kg (PROP2), and 3000 mg / kg (PROP3) groups, in which propolis was added to wilted alfalfa. Alfalfa was harvested at the beginning of blooming (10−20 %) on 15 November 2019 from a field in Ertugrul village (41.53° N and 27.5° S, Kırklareli, Turkey), wilted for 5 h, and cut to sizes of 1.5−2.0 cm by a silage machine (JD 7450). Before ensiling, wilted alfalfa (WA) contained 28.10% dry matter (DM), 22.25% DM of crude protein (CP), 80 mg/kg DM of WSC, 644 mEq NaOH / kg DM of buffer capacity (Bc), 2.30 log CFU /g lactic acid bacteria (LAB), 6.03 log CFU / g yeast, and no mold, with a pH of 7.8. Propolis was mixed by being sprayed onto 8 kg of fresh material.
The experiment was conducted on laboratory-scale bale silage: Approximately 2 kg of alfalfa was placed into plastic bags, and the air inside each bag was vacuumed out. The bags were then wrapped in stretch film 14−16 times, followed by a tape layer. Due to the effect of the number of layers on the fermentation properties under long-term (5 months) storage conditions [17], attention was paid to bags with the highest number of layers. The bale silages were stored in the covered storage area (8–12 °C) in black plastic bags for 140 days.

2.2. Physical and Chemical Analysis

On the 140th day, when the silages were opened, they were scored by three different observers in terms of color, odor, and structure according to Deutsche Landwirtschafts Gesellschaft (DLG) [4].The physical evaluation was carried out through the three observers’ average scores. The evaluation parameters according to DLG were as follows: 16–20, excellent; 10–15, moderate; 5–9, medium; 0–4, poorly [4]. pH was measured using a digital pH meter (WTWinoLabph 730), the Bc was determined according to Playne and McDonald [18], and LA was detected through the spectrophotometric method [19]. In this method of calorimetric determination, lactic acid is converted into acetaldehyde by treatment with concentrated sulfuric acid, and the acetaldehyde is determined by its color reaction with p-hydroxydiphenyl in the presence of cupric ions. The resulting color is determined using a spectrophotometer (Shimadzu UV—1800) device at 565 nm [19]. Flieg’sscore was calculated using the following formula [4]:
Flieg’s score = 220 + (2 × % DM − 15) − 40 × pH.
According to this index, <20, very bad; 21–40, bad; 41–60, moderate; 61–80, good; 81–100, excellent [4,20]. Ammonium nitrogen (NH3-N) and WSC content analyses were performed according to the methods detailed in [21]. Aerobic stability testing was carried out under laboratory conditions according to Ashbell et al. [22]. The bottles were incubated in triplicate at 20 °C for 3, 5, or 7 days. The system was constructed in two parts from recycled water bottles (polyethylene): the upper part (1 L) was filled with ca. 250 g (wet weight) of loosely packed silage, and the lower part with 100 mL of 20 % KOH. Gas was exchanged through 1-cm holes in the upper part. Carbon dioxide produced during aerobic exposure was absorbed by the base and determined by titration with 1 N HCl [22]. In addition, changes in pH and DM also served as indicators of aerobic spoilage. The laboratory and silage temperatures were recorded every 24 h using a glass thermometer. The DM was determined by drying the samples at 105 °C for 16 h. Organic matter (OM), CP, and crude ash (CA) contents of the feed samples were determined by AOAC [23]. Ether extract (EE) content was obtained by Soxhlet extraction using anhydrous diethyl ether [23]. NDF, which forms the cell wall components of silages, the ADF, and acid detergent insoluble lignin (ADL) content was determined via the methods reported by Van Soest et al. [24]. Hemicellulose, cellulose, and nitrogen-free extract (NFE) contents were determined by calculation [25].
The fatty acid composition was analyzed by gas chromatography (Restek 2560, 100 m 0.25 mm × 0.2 µm) after methylation based on the method of Bligh and Dryer [26]. The temperature program was: starting temperature of 60 °C for 2 min, which was then increased by 3 °C/min until the temperature reached 220 °C, and then left at 220 °C for 10 min; the injector temperature was set at 240 °C, and the detector temperature was 240 °C.

2.3. Microbial Populations

The silage samples (10 g) were homogenized with sterile NaCl (0.85%) solution (90 mL) in a shaker at room temperature, and the supernatants were then serially diluted from 10−1 to 10−6. Lactic acid bacteria, yeast, and mold analyses were conducted according to Seale et al. [27]. MRS agar (de Man Rogosa and Sharpe agar, Merck1.10660, Darmstadt, Germany) was used to detect LAB. Malt extract agar (Merck1.05398) was used for determining yeast and mold (acidified with 10% LA to pH 4.0). Enterobacteria were enumerated on pour plates of violet red bile dextrose agar (Merck1.10275) [27].The LAB were incubated under anaerobic conditions at 30 °C for 48–72 h, while the yeasts, molds, and enterobacteria were incubated under aerobic conditions at 30 °C for 48–120 h.

2.4. In Vitro Digestibility

The enzymatic solubility of the organic matter was determined via the cellulase method [28,29]. Conforming to the technique of [29], pretreatment with a pepsin–hydrochloric acid solution was followed by treatment with cellulase (Onozuka R 10 from Trichodermaviride, Merck). The solubility of the organic matter in cellulase (ELOS), the cellulase digestibility of the organic matter (DOM), and the insoluble organic matter in cellulase (EULOS) were derived as follows [29]:
ELOS (%) = DM − CA − G
G (%) = Loss upon ashing
DOM (%) = (ELOS × 102/100 − CA %)
EULOS (g/kg) = 1000 − CA (g/kg DM) − (ELOS% × 10)

2.5. Relative Feed Value

The equities stated below, which were developed by Van Dyke and Anderson [30], were used for relative feed value detection of silages.
Digestible Dry Matter (DDM), % = 88.9 − (0.779 × %ADF).
Dry Matter Intake (DMI), % = 120/%NDF
Relative Feed Value (RFV) = DDM% × DMI% × 0.775

2.6. Prediction of In Vitro Metabolic Energy Value

In vitro metabolic energy (ME) contents were calculated according to ELOS and DDM using Equations (9) [31] and (10) [32], provided below.
MEELOS, MJ kg/DM = 0.54 + 0.001987 × CP + 0.01537 × ELOS + 0.000706×EE × EE − 0.00001262 × ELOS × CA- 0.00003517 × ELOS × CP
With CP, EE, CA, ELOS in g/kg DM.
MEDDM, MJ kg/DM = (0.17 × DDM %) − 2.0
Once obtained, ME contents were translated into kilocalories.

2.7. Statistical Analyses

The microbial populations were estimated as CFU/g and logarithmically converted before statistical evaluation. The statistical analyses were performed using SPSS software v.18 suite [33]. The fermentation characteristics and microbial quantity of silage from ensiling to aerobic conditions were analyzed via one-way ANOVA. Duncan’s test was used to compare the differences between group averages. The smell, structure, color, and DLG points of silages were analyzed via nonparametric Kruskal–Wallis tests [34]. Differences were considered significant when p < 0.05.

3. Results

The addition of propolis affected the physical characteristics of alfalfa silages (Table 2). DLG points of the silages in PROP2 and PROP3 groups were 20, and were evaluated as excellent. CON scored 13 due to its odor and color; PROP3 scored 14.
The results of the chemical analysis of alfalfa silages are shown in Table 3. Propolis addition was effective at inhibiting protein degradation (p < 0.05). Ether extract quantities increased in propolis groups compared to CON (p < 0.05). Adding propolis to alfalfa silages caused CF, NDF, and ADF (p < 0.05) to decrease.
The addition of propolis caused an increase in DM content of alfalfa silages (Table 4) and decreased the pH value. The pH values of silages decreased compared to CON, and this decrease was found to be significant in the PROP2 group (p < 0.05). Propolis addition decreased WSC levels compared to CON (p < 0.05), and increased LA levels(p < 0.05). According to Flieg’s score, the addition of propolis improved the quality compared to CON and provided good-quality silages (p < 0.05).
Upon examining the composition of fatty acids in Table 5, it can be seen that the palmitic acid content in the CON group was higher than the propolis groups (p < 0.05), and the decrease is more pronounced with the increase in the propolis level. Oleic, linoleic, and linolenic acid contents were determined as being high in propolis groups (p < 0.05). Additionally, while SFA content decreased in the propolis-treated silages (p < 0.05), USFA content increased (p < 0.05).
Propolis addition to alfalfa caused an increase in LAB content (Table 6); the highest LAB content was determined as 5.9 log10 CFU/g in PROP2, and no yeast, mold, or enterobacteria development occurred.
In our study (Table 7), it was detected that the addition of propolis slowed aerobic deterioration upon evaluating DM, pH, and CO2 production determined at the 3rd, 5th, and 7th days of the aerobic period (
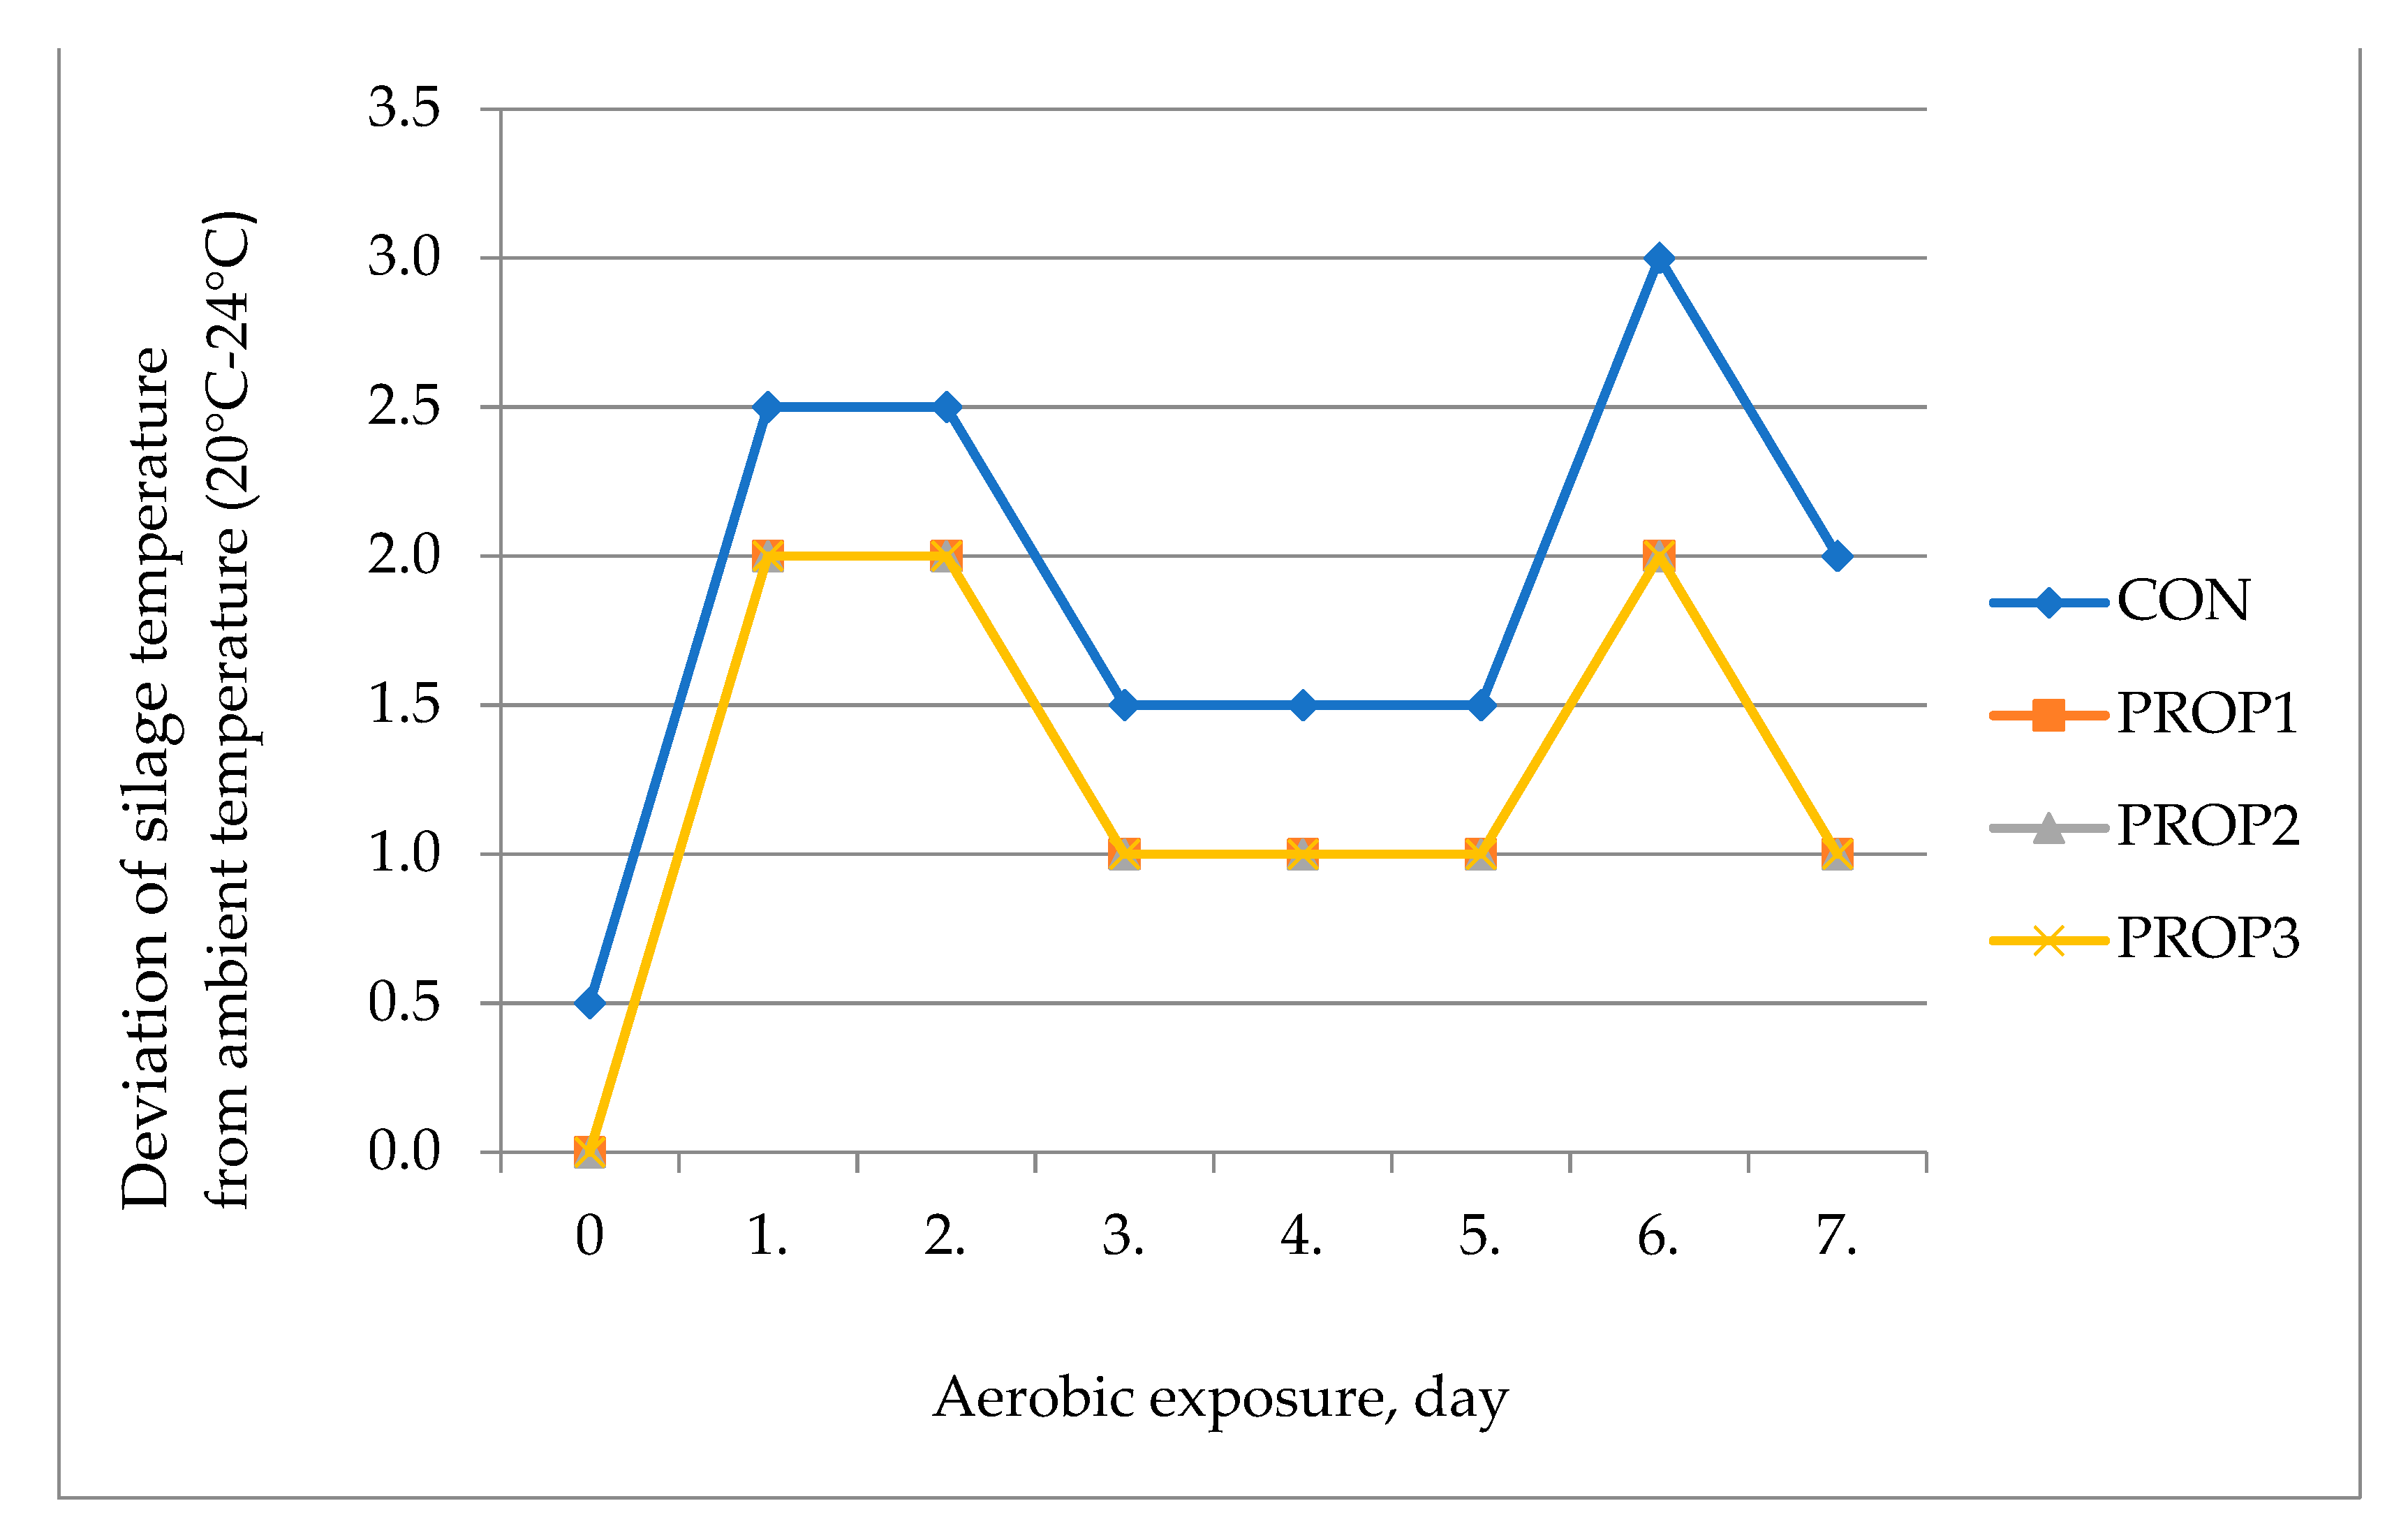
p < 0.05). After 7 days of exposure, slighter increases in pH values were observed in the propolis-treated silages, as well asCO2 values, except for the PROP1 and CON groups. In this study, the temperature of the silage was 2.5 °C higher than the ambient temperature on the 1st, 2nd, and 6th days of the aerobic period in the CON group, while it was 2 °C higher in the propolis groups (Figure 1).
The DDM, DMI, RFV, and MEDDM contents of alfalfa silages are shown in Table 8. The highest DDM, DMI, RFV, and MEDDM contents were determined in the PROP2 group compared to CON. The addition of propolis improved the RFV of alfalfa silages. The solubility of organic matter in the enzyme (Table 9) was determined highest in the PROP2 group, at 67.64%, and the lowest EULOS (220.67 g/kg DM) was determined in the same group. The digestibility of the organic matter and metabolic energy content (MEELOS) were determined highest in the PROP2 group, at 75.40%, and 1655.35 kcal/kg DM respectively (p < 0.05). The addition of propolis affected the ELOS, EULOS, DOM, and MEELOS contents of alfalfa silages positively. The addition of propolis to alfalfa improved DOM depending on the dose increase; however, this improvement decreased in the PROP3 group.
According to the results of the Pearson correlation analysis (Table 10), a strong correlation was found between dry matter and pH (r = −0.676, p < 0.05), LA (r = 0.926 **, p < 0.001), and DOM (r = 0.976 **, p < 0.001) on the day the silages were opened. A strong correlation was determined between WSC (r = −0.857 **, p < 0.001) and LAB (r = 0.939 **, p < 0.001) and LA. This is expected because LAB uses WSC as a source and produces LA. A strong correlations were also found between CP and NH3-N (r = −0.917 **, p < 0.001), and DOM (r = 0.851 **, p < 0.001). RFV is calculated from NDF and ADF contents. A strong correlations were determined between RFV and NDF (r = −0.950 **, p < 0.001) and ADF (r = −0.936 **, p < 0.001) in this study. Similarly, a strong correlation was determined between MUFA and LA (r = 0.963 **, p < 0.001) and ME (r = 0.946 **, p < 0.001).

4. Discussion

Green silages with no impairment in stem–leaf integrity and a pleasant and slightly acidic odor were obtained from PROP2 and PROP3 groups. Especially, feeding propolis odor was distinct in PROP3, suggesting that it may affect its consumption by animals. Flieg’s score, based on the DM content and pH of the silages, used often in studies for judging the quality of silages, although this evaluation system has some limitations [35]. In the present study, CON silage had a Flieg’s score of 53.23, characterized by typical poor fermentation quality of legumes; silages with 2000 mg/kg WA of propolis had the greatest score (70.84), and thus represented the best silages among all treatments.
Proteolysis is an undesired phenomenon occurring in all silages, primarily in the silages consisting of legume forage rich in protein during silage fermentation [36]. In the present study, propolis inhibited CP breakdown; this was especially the case in the PROP2 group, in which the CP content was 18.80%. The minimum ammonium nitrogen level in the PROP2 group (13.10 g/kg TN) supports these results. However, Arslan Duru et al. reported that propolis did not affect the DM, CA, and CP contents of the alfalfa silage [14]. The breakdown of plant protein during ensiling is a complex biochemical process involving a range of plant and microbial enzymes [35].Yuan et al. reported that the amount of protein in silages treated with antimicrobial effective silage additives was high due to the suppression of the activity of detrimental microorganisms at a later stage of ensiling [37]. In this study, the increase in the amount of protein in the PROP2 group can be explained by the antimicrobial effect of propolis better suppressing the microorganisms (clostridia) that cause proteolysis, depending on the length of the ensiling time. In legume silages, clostridia typically cause strong proteolysis and increase the levels of soluble nitrogen and NH3-N [38].
It was detected that EE content was higher in propolis-added groups compared to CON; this increase may be due to the fatty acids in propolis. The addition of propolis to alfalfa during ensilage caused a decrease in CF, NDF, and ADF content. However, Arslan Duru et al. reported that propolis did not affect NDF and ADF contents of alfalfa silages, which may be due to differences in the composition of propolis [14].
The decrease in silage pH is generally slower for legume silages because their buffering capacity is higher than for grasses. In the legume silages, the decrease in silage pH is faster for roughages with low DM (<30%) compared to those with high DM (>40%) because the former has more metabolic water [39].In this study, although the DM content of the wilted alfalfa was low (<30%), the expected decrease in pH did not occur due to the high buffer capacity and CP content. In addition, a pH of 4.0 and above is common in legume silages [40]. Koç et al. reported that the pH of alfalfa silages treated with different kefir sources varied between 5.45 and 5.90 [41]. On the other hand, Liu et al. reported that the pH of alfalfa silages with different additives varied between 4.23 and 5.30 [42]. Ke et al. also found the pH in alfalfa silages to be between 4.61 and 5.06 [36]. In the present study, pH was consistent with the results of Liu et al. [42] and Ke et al. [36].
The lactic acid in silage is the dominant product of fermentation, and is an important factor for assessing silage quality [43]. It is difficult to achieve a lactic-acid-dominant fermentation for alfalfa due to its higher buffering capacity and lower WSC concentration than grasses [44]. The DM content of wilted alfalfa (28.10%) before ensiling was lower than in previous studies [2], and exhibited a high buffer capacity. However, the WSC of pre-ensiled material (80 g/kg DM) was adequate, considering the recommendation of 50 g/kg DM as the minimum required to ensure good fermentation during ensiling [37].
The major limitation of this study is the inadequate epiphytic LAB populations of 2.30 log10 CFU/g fresh weight (FW) of wilted alfalfa, which was not sufficient to initiate lactic acid fermentation. Additionally, a minimum epiphytic LAB population of 5 log10 CFU/g FW is recommended to ensure good fermentation during ensiling [45]. The addition of propolis can stimulate the reproduction and growth of LAB, and lead to increased LA content. Especially in the PROP2 group, it is remarkable that the highest content was determined as LA (33.07%), and the lowest was determined as WSC (36.97 g/kg DM). Acetic acid, the main metabolite of Acetobacter fermentation in silage, is an important index for evaluating silage quality. Unfortunately, it was not analyzed in this study, and only LA for fermentation quality and the role of WSC in alfalfa silage in terms of microorganisms was discussed. In addition, excessively high concentrations of acetic acid (>4–6 %) are most often detected in extremely wet (>70% moisture) silages characterized by unwanted fermentations dominated by enterobacteria, clostridia, or heterolactic acid bacteria [38]. In silage, NH3-N indicates proteolysis during ensiling, and results from plant enzymes and microbial activities. The propolis used in this study decreased NH3-N concentrations of alfalfa silages, similar to propionic acid, tea polyphenols [42], and tannin [36].
Over the process of ensiling, DM and nutrient losses seem likely to be unavoidable and irreversible. Three factors may be involved in DM consumption and energy dissipation, namely plant respiration, aerobic microorganism growth, and clostridia growth [35]. In the present study, the addition of propolis inhibited the growth of undesirable bacteria, including Enterobacter, molds, and yeast, and resulted in lower DM losses. This result can be attributed to the antimicrobial properties of propolis.
Liu et al. stated that propionic acid significantly decreased the C16:0 fatty acid ratio and saturated fatty acid (SFA) of silages [42]. In this study, propolis had aneffect similar to propionic acid [42], and caused a decrease in palmitic acid ratio and SFA. This effect became more evident by the increase in the level of propolis. Propolis addition caused an increase in oleic, linoleic, and linolenic fatty acid rates. The underlying cause for such an increase is the fatty acid composition in the propolis structure, and the increase in unsaturated fatty acid (USFA) and polyunsaturated fatty acid (PUFA) ratio in the propolis groups of the present study supports this opinion. Additionally, Şahinler and Kaftanoğlu reported that the fatty acid composition of propolis ethanol extract varies according to the regions, and that there are 14 different fatty acids in propolis ethanol extract from Hatay, Mersin, and Adana [16].Furthermore, the loss of USFA and total fatty acids increases during wilting and ensilage [46]. It is known that alfalfa leaves are rich in lipoxygenase [42]. We speculated that propolis had the potential to inhibit the effect of lipoxygenase. Upon evaluating the findings, considering that ensilage was performed after wilting [46], we can relate the increase in USFA with the fact that it showed antioxidant activity by inhibiting the oxidation of unsaturated fatty acids of propolis.
The fat of meat and milk of ruminants is not considered to be healthy for people due to the high SFA and low PUFA content. However, these fats are one of the major dietary sources of conjugated linoleic acid (CLA), which is presumed to be a healthy fatty acid [47]. The FA profile (including CLA content) is affected by feed type (grass, green forage, silage), plant species, supplementation with oils or oilseeds, and the use of vitamin–mineral supplements [48]. Green forage is a good source of CLA precursors (linoleic and α-linolenic acids), although it varies according to maturity and forage species. Hay making processes lead to a loss of FA precursors of CLA, reducing total FA by over 50%, with a higher loss of linolenic acid. Most losses occur in wilting prior to ensiling [47].When cows were fed with alfalfa hay, their milk composition was determined as 2.70 linoleic, 0.91 α-linolenic, and 1.80 CLA (g/100 g of fat). When cows were fed with alfalfa silage, their milk composition was determined as 4.51 linoleic, 1.11 α-linolenic, and 1.30 CLA (g / 100 g of fat) [48]. The levels of precursors in the diets of animals are related to the quantities of CLA in milk and meat. Therefore, the fatty acid profiles of alfalfa silages are important in terms of milk and meat fatty acid composition.
In this study, LAB numbers in the alfalfa silages increased compared to CON, depending on the addition of propolis. The increased LAB used WSC as a nutrient source and caused an increase in LA while WSC decreased. However, the high number of LAB in the PROP2 group increased the conversion of WSC to LA, and the highest LA was found in the PROP2 group. In the present study, adding 2000 g/kg propolis to alfalfa silages stimulated the growth of LAB and improved silage fermentation, consistent with previous studies [4,14,49].
It is reported that propolis has a significant antimicrobial potential against bacteria and yeasts; however, its effect depends on the species [50]. The propolis used in the present study included caffeic acid (7.98), cinnamic acid esters (4.23% methyl cinnamate, 9.37% benzyl cinnamate), and terpenoid. It is known that these compounds show antimicrobial effects against pathogens [51,52]. In this study, while the number of LAB increased in the groups to which propolis was added, the growth of yeast was not determined, which can be explained by the fact that the survival of yeasts during storage is mainly dependent on the extent of anaerobiosis, the pH, and the concentrations of organic acids. High LA content in the propolis-added groups inhibited yeast growth.
Although legume silages have been reported to be relatively aerobically stable [53], environmental conditions may increase the growth of spoilage-causing microorganisms and accelerate aerobic degradation during feeding. When the fermentation of the silages is complete and opened for feeding, the silage is exposed to air. During this time, heat production is usually initiated by yeast or molds, and changes occur in the chemical structure and microbial communities of the silages. Silage deterioration causes an increase in temperature and pH, DM loss, reduced nutrient availability, increased surface aerobic microbial numbers, and animal feed rejection [54]. The aerobic stability of silage is defined as the elapsed time before the silage exhibits heat production when the silage temperature is 2 °C higher than the ambient temperature [55]. In addition, silages that produce CO2 < 10 g/kg DM and show <0.5 unit change in pH over 5 days are considered stable [56]. Therefore, this study analyzed aerobic stability by monitoring temperature change, final pH, and CO2 after exposure to air for 7 days. In this study, the silage temperature was 2.5 °C higher than the ambient temperature on the 1st, 2nd, and 6th days of the aerobic exposure in the CON group, while it was 2 °C higher in the propolis groups. Consistent with Weinberg et al. [56], in this study, it was found that on the 5th day of the aerobic period, CO2 production in PROP2 and PROP3 groups was below 10 g/kg DM, and pH increased by 0.1−0.23 units in these groups.
The aerobic deterioration of silages increases depending on the number of days of exposure to aerobic conditions [57]. Various chemical additives with antifungal properties have been evaluated to address the problem of aerobic instability in silages [39,58]. The addition of propolis prevented aerobic deterioration on the 5th day. However, its effect decreased depending on the extension of time. The fact that the PROP2 group was more resistant to aerobic degradation than the other groups is associated with the significant antimicrobial potential of propolis against bacteria and yeasts, as reported in previous studies [49,50,59].
Relative feed value has been used for years to compare the quality of legume and legume/grass hays and silages. Having one index to price hay and predict animal performance has been very useful for livestock producers and hay farmers. The RFV index is calculated from predicted values for both DMI and DDM based on laboratory analyses for NDF and ADF, respectively [60,61]. DDM is also used to calculate the energy content of a forage. Because it is easy, it is frequently used in the evaluation of forage and silage in farm conditions. In propolis groups, DDM, DMI, RFV, and MEDDM contents improved depending on the decrease in NDF and ADF. The best use of RFV is for selecting forages to be used in rations that require high nutrient densities, such as high-producing dairy cows. It is recommended that the RFV of the roughage to be given to dairy cows should be between 170 and 180 [62]. In this study, the RFVs of the PROP1 and PROP3 groups are among the recommended limits. Alfalfa silages are the major component of forage programs. Usually, an alfalfa silage program with 180 or higher RFV (PROP2) will result in too rapid of a rate of passage of forage. The rate of rumen passage should be slowed by providing roughage with a low RFV together with PROP2 with a high RFV
In in vivo studies conducted on the ruminants related to propolis, it was determined that red propolis extract caused a less-negative effect on ruminants than essential oils or ionophores, and that it increased DMI and total digestibility [11]. Zawadzki et al. stated that the DM efficiency of Nellore bulls, fed on a ratio of 52% forage, 48% mixed feed, and propolis extract, was superior [10].Feed evaluation methods involve the determination of chemical composition and digestibility, followed by calculation of energy values [63]. In this study, strong and significant correlations were found between the nutrient content (DM, CP, NDF, ADF) of Alfalfa silages and DOM and ME. The prediction of DOM and ME content in the dry matter of alfalfa silages are essential measurements in the formulation of ruminant rations [64]. In this study, ELOS, EULOS, DOM, and ME content were positively affected, similar to the results of previous in vivo studies [10,13] in which propolis was used as a feed additive. The effect of propolis on the in vitro digestibility and ME of silages might be caused by the antibacterial effect related to the presence of flavonoids among the bioactive ingredients in the structure of propolis [10]. In addition, Zawadzki et al. suggested that the high bioactivity of propolis associated with the synergism between the compounds in its composition is responsible for the beneficial effects of propolis [10]. Propolis is also effective against Gram-positive bacteria, such as monensin, and its effect on rumen fermentation is known [10].Past studies have shown that natural additives, such as propolis, with biological and medicinal properties can minimize the negative effects caused by metabolic and oxidative disorders, as well as by microorganisms [6].The consumption of propolis-added silage after weaning shows promise for improving the health and performance of animals.

5. Conclusions

This research concludes that adding propolis might improve the physical, chemical, and microbiologic characteristics of the last cuttings of alfalfa silages in autumn. Significantly, adding 2000 g/kg propolis improved the fermentation quality and aerobic stability of silages, and affected in vitro digestibility and metabolic energy. This will also positively affect the animal feed conversion ratio after silage consumption, because the new generation silage additives are expected to regulate rumen fermentation and the digestive system, and improve the feed conversion ratio following the ruminants’ silage consumption. The ethanol extract of propolis has been shown to have potential as an antimicrobial silage additive. In addition, the fact that Turkey ranks second in the world in the production of bee products may support further research on this subject.

Author Contributions

S.S.Ö. and B.Y. designed this experiment and reviewed the manuscript. B.Y. prepared propolis. S.S.Ö. and A.T.U. conducted the experiment and analyzed the data. A.T.U. provided references. S.S.Ö. writing-original draft preparation. B.Y. writing-review and editing. S.S.Ö. was responsible for the final content. All authors have read and agreed to the published version of the manuscript.

Funding

This research received no external funding.

Institutional Review Board Statement

Not applicable.

Informed Consent Statement

Not applicable.

Data Availability Statement

Not applicable.

Conflicts of Interest

The authors declare no conflict of interest.

References

  1. Turan, A.; Soycan Önenç, S. Effect of cumin essential oil usage on fermentation quality, aerobic stability and in vitro digestibility of alfalfa silage. Asian Australas.J. Animal Sci. 2018, 31, 1252–1258. [Google Scholar] [CrossRef] [PubMed]
  2. Xie, Y.; Wang, L.; Li, W.; Xu, S.; Bao, J.; Deng, J.; Wu, Z.; Yu, Z. Fermentation quality, in vitro digestibility, and aerobic stability of total mixed ration silage in response to varying proportion alfalfa silage. Animals 2022, 12, 1039. [Google Scholar] [CrossRef] [PubMed]
  3. Lynch, J.P.; Jin, L.; Lara, E.C.; Baah, J.; Beauchemin, K.A. The effect of exogenous fibrolytic enzymes and a ferulic acid esterase producing inoculant on the fibre degradability, chemical composition and conservation characteristics of alfalfa silage. Anim. Feed. Sci. Technol. 2014, 193, 21–31. [Google Scholar] [CrossRef]
  4. Kilic, A. Silo Feed (Instruction, Education and Application Proposals); Bilgehan Press: Izmir, Turkey, 1986; p. 327. [Google Scholar]
  5. Burucu, V. Product Report: Beekeeping; No: 330; Institute of Agricultural Economics and Policy Development: Ankara, Turkey, 2021; ISBN 978-605-7599-63-6. [Google Scholar]
  6. Cecere, B.G.O.; Silva, A.S.; Molosse, V.L.; Alba, D.F.; Leal, K.W.; Rosa, G.; Pereira, W.A.B.; Silva, A.D.; Schetinger, M.R.C.; Kempka, A.P.; et al. Addition of propolis to milk improves lactating lamb’s growth: Effect on antimicrobial, antioxidant and immune responses in animals. Small Rumin. Res. 2021, 194, 106265. [Google Scholar] [CrossRef]
  7. Eyng, C.; Murakami, A.E.; Santos, T.C.; Silveira, T.G.V.; Pedrosol, R.B.; Lourenço, D.A.L. Immune responses in broiler chicks fed propolis extraction residue-supplemented diets. Asian Australas. J. Anim. Sci. 2015, 28, 135–142. [Google Scholar] [CrossRef] [PubMed] [Green Version]
  8. Prado, O.P.P.; Zeoula, L.M.; Moura, L.P.P.; Franco, S.L.; Paiva, S.B.; Arcuri, P.B. Isolation and expeditious morphological, biochemical and kinetic characterization of propolis-tolerant ruminal bacteria. Rev. Bras. Zootec. 2010, 39, 2048–2054. [Google Scholar] [CrossRef] [Green Version]
  9. Ítavo, C.C.B.F.; Morais, M.G.; Costa, C.; Ítavo, L.C.V.; Franco, G.L.; da Silva, J.A.; Reis, F.A. Addition of propolis or monensin in the diet: Behavior and productivity of lambs in feedlot. Anim. Feed Sci. Technol. 2011, 165, 161–166. [Google Scholar] [CrossRef]
  10. Zawadzki, F.; Prado, I.N.; Marques, J.A.; Zeoula, L.M.; Rotta, P.P.; Sestari, B.B. Sodium monensin or propolis extract in the diets of feedlot-finished bulls: Effects on animal performance and carcass characteristics. J. Anim. Feed Sci. 2011, 20, 16–25. [Google Scholar] [CrossRef]
  11. Valero, M.V.; Farias, M.S.; Zawadzki, F.; Prado, R.M.; Fugita, C.A.; Rivaroli, D.C.; Ornaghi, M.G.; Prado, I.N. Feeding propolis or essential oils (cashew and castor) to bulls: Performance, digestibility, and blood cell counts. Revis. Colom. Cien. Pecuar. 2016, 29, 33–42. [Google Scholar] [CrossRef] [Green Version]
  12. Yücel, B.; Önenç, A.; Altan, Ö.; Kaya, A. Effects of propolis administration on growth performance and neonatal diarrhea of calves. SOJ Vet. Sci. 2015, 1, 102–106. [Google Scholar] [CrossRef] [Green Version]
  13. Soltan, Y.A.; Patra, A.K. Bee propolis as a natural feed additive: Bioactive compounds and effects on ruminal fermentation pattern as well as productivity of ruminants. Indian J. Anim. Health 2020, 59, 50–61. [Google Scholar] [CrossRef]
  14. Arslan Duru, A.; Barıt, M.; Türk, U.; Şahinler, N. The investigation of possibility of propolis as additives in alfalfa silages. Int. J. Agric. Life Sci. 2019, 3, 207–212. [Google Scholar]
  15. Nowottnick, K. Propolis; Leopold Stocker Verlag: Graz, Austria, 1993. [Google Scholar]
  16. Şahinler, N.; Kaftanoğlu, O. Natural product propolis: Chemical composition. Nat. Prod. Res. 2005, 19, 183–188. [Google Scholar] [CrossRef]
  17. Hancock, D.W.; Collins, M. Forage preservation method influences alfalfa nutritive value and feeding characteristics. Crop Sci. 2006, 46, 688–694. [Google Scholar] [CrossRef]
  18. Playne, M.J.; Mc Donald, P. The buffering constituent of herbage and of silage. J. Sci. Food Agric. 1966, 17, 264–268. [Google Scholar] [CrossRef]
  19. Barker, S.B.; Summerson, W.H. The colorimetric determination of lactic acid in biological material. J. Biol. Chem. 1941, 138, 535–554. [Google Scholar] [CrossRef]
  20. Moselhy, M.A.; Borba, J.P.; Borba, A.E.S. Improving the nutritive value, in vitro digestibility and aerobic stability of Hedychium gardnerianum silage through application of additives at ensiling time. Anim. Feed Sci. Technol. 2015, 206, 8–18. [Google Scholar] [CrossRef]
  21. Ministry of Agriculture, Fisheries and Food. The Analysis of Agricultural Material; Reference book; HMSO: London, UK, 1986; pp. 427–428.
  22. Ashbell, G.; Weinberg, Z.G.; Azrieli, A.; Hen, Y.; Horev, B. A simple system to study the aerobic determination of silages. Can. Agric. Eng. 1991, 34, 171–175. [Google Scholar]
  23. AOAC. Official Methods of Analysis, 15th ed.; Association of Official Analytical Chemists: Arlington, WA, USA, 1990. [Google Scholar]
  24. Van Soest, P.J.; Robertson, J.B.; Lewis, B.A. Methods for dietary fiber, neutral detergent fiber, and nonstarch polysaccharides in relation to animal nutrition. J. Dairy Sci. 1991, 74, 3583–3597. [Google Scholar] [CrossRef]
  25. Close, W.; Menke, K.H. Selected Topics in Animal Nutrition University, 2nd ed.; A Manuel Prepared for the 3rd Hohenheim Course on Animal Nutrition in the Tropics and Semi-Tropics; University of Hohenhiem: Stuttgart, Germany, 1986. [Google Scholar]
  26. Bligh, E.G.; Dyer, W.J. A Rapid method of total lipid extraction and purification. Can.J. Biochem. Physiol. 1959, 37, 911–917. [Google Scholar] [CrossRef]
  27. Seale, D.R.; Pahlow, G.; Spoelstra, S.F.; Lindgren, S.; Dellaglio, F.; Lowe, J.F. Methods for the microbiological analysis of silage. In Proceedings of the Eurobac Conference, Uppsala, Sweden, 12–16 August 1986; pp. 147–164. [Google Scholar]
  28. De Boever, J.L.; Cottyn, B.G.; Buysse, F.X.; Wainmann, F.W.; Vanacker, J.M. The use of an enzymatic technique to predict digestibility, metabolizable and net energy of compound feedstuffs. Anim. Feed Sci. Technol. 1986, 14, 203–214. [Google Scholar] [CrossRef]
  29. Naumann, C.; Bassler, R.; Seibold, R.; Barth, C. (Eds.) VDLUFA Methodenbuch Band III. Die Chemische Untersuchung von Futtermitteln; Verband deutscherlandwirtschaftlicher untersuchungs- und forschungs anstalten (Hrsg.); VDLUFA-Verlag: Darmstadt, Germany, 1997. [Google Scholar]
  30. Van Dyke, N.J.; Anderson, P.M. Interpreting a Forage Analysis; Circular ANR-890; Alabama Cooperative Extension: Auburn, AL, USA, 2000. [Google Scholar]
  31. Jeroch, H.; Drochner, W.; Simon, O. Nutrition on Farm Livestock; Verlag Eugen Ulmer: Stuttgart, Germany, 1999; p. 161. [Google Scholar]
  32. Belyea, R.L.; Steevens, B.; Garner, G.; Whittier, J.C.; Sewell, H. Using NDF and ADF to Balance Diet; University of Missouri Extension G361: Missouri, CL, USA, 1993. [Google Scholar]
  33. SPSS. PASW Statistics for Windows; Version 18.0; SPSS Inc.: Chicago, IL, USA, 2009. [Google Scholar]
  34. Efe, E.; Bek, Y.; Şahin, M. Statistical Methods with Solutions in SPSS; Pub. no 73; Kahramanmaraş Sütçü İmam University: Kahramanmaraş, Turkey, 2000; p. 209. [Google Scholar]
  35. Dong, Z.; Yuan, X.; Wen, A.; Desta, T.S.; Shao, T. Effects of calcium propionate on the fermentation quality and aerobic stability of alfalfa silage. Asian Australas. J. Anim. Sci. 2017, 30, 1278–1284. [Google Scholar] [CrossRef] [PubMed]
  36. Ke, W.C.; Yang, F.Y.; Undersander, D.J.; Guo, X.S. Fermentation characteristics, aerobic stability, proteolysis and lipid composition of alfalfa silage ensiled with apple or grape pomace. Anim. Feed Sci. Technol. 2015, 202, 12–19. [Google Scholar] [CrossRef]
  37. Yuan, X.; Wen, A.; Desta, S.T.; Dong, Z.; Shao, T. Effects of 4 short-chain fatty acids or salts on dynamics of nitrogen transformations and intrinsic protease activity of alfalfa silage. J. Sci. Food Agric. 2017, 97, 2759–2766. [Google Scholar] [CrossRef] [PubMed]
  38. Kung, L.; Shaver, R.D.; Grant, R.J.; Schmidt, R.J. Silage review: Interpretation of chemical, microbial, and organoleptic components of silages. J. Dairy Sci. 2018, 101, 4020–4033. [Google Scholar] [CrossRef]
  39. Kung, L., Jr.; Sheperd, A.C.; Smagala, A.M.; Endres, K.M.; Bessett, C.A.; Ranjit, N.K.; Glanc, J.L. The effect of preservatives based on propionic acid on the fermentation and aerobic stability of corn silage and a total mixed ration. J. Dairy Sci. 1998, 81, 1322–1330. [Google Scholar] [CrossRef]
  40. Koç, F.; Coşkuntuna, L.; Özdüven, M.L.; Coşkuntuna, A. The effect of organic acid usage at various temperatures on fermentation and aerobic stability of vetch-grain silages. J. Tekirdag Agric. Facul. 2010, 2, 159–165. [Google Scholar]
  41. Koç, F.; Özkan Ünal, E.; Okuyucu, B.; Esen, S.; Isık, R. Effect of different kefir source on fermentation, aerobic stability, and microbial community of alfalfa silage. Animals 2021, 11, 2096. [Google Scholar] [CrossRef]
  42. Liu, Q.H.; Dong, Z.H.; Shao, T. Effect of additives on fatty acid profile of high moisture alfalfa silage during ensiling and after exposure to air. Anim. Feed Sci. Technol. 2018, 236, 29–38. [Google Scholar] [CrossRef]
  43. Zi, X.; Liu, Y.; Chen, T.; Li, M.; Zhou, H.; Tang, J. Effects of sucrose, glucose and molasses on fermentation quality and bacterial community of stylo silage. Fermentation 2022, 8, 191. [Google Scholar] [CrossRef]
  44. Phelan, P.; Moloney, A.P.; McGeough, E.J.; Humphreys, J.; Bertilsson, J.; O’Riordan, E.G.; O’Kiely, P. Forage legumes for grazing and conserving in ruminant production systems. Crit. Rev. Plant Sci. 2014, 34, 281–326. [Google Scholar] [CrossRef]
  45. Yuan, X.; Wen, A.; Dong, Z.; Desta, S.T.; Shao, T. Effects of formic acid and potassium diformate on the fermentation quality, chemical composition and aerobic stability of alfalfa silage. Grass Forage Sci. 2017, 72, 833–839. [Google Scholar] [CrossRef]
  46. Kalac, P.; Samková, E. The effects of feeding various forages on fatty acid composition of bovine milk fat: A review. Czech J. Anim. Sci. 2010, 55, 521–537. [Google Scholar] [CrossRef] [Green Version]
  47. Soycan Önenç, S.; Ozdoğan, M. Relationship between meat quality and animal nutrition. J. Anim. Prod. 2022, 63, 67–74. [Google Scholar]
  48. Acosta Balcazar, I.C.; Granados Rivera, L.D.; Salinas Chavira, J.; Estrada Drouaillet, B.; Albarrán, M.R.; Bautista Martínez, Y. Relationship between the composition of lipids in forages and the concentration of conjugated linoleic acid in cow’s milk: A review. Animals 2022, 12, 1621. [Google Scholar] [CrossRef]
  49. Petruzzi, L.; Corbo, M.R.; Campaniello, D.; Speranza, B.; Sinigaglia, M.; Bevilacqua, A. Antifungal and antibacterial effect of propolis: A comparative hit for food-borne pseudomonas. Enterobact. Fungi. Foods. 2020, 9, 559. [Google Scholar]
  50. Stepanović, S.; Antić, N.; Dakić, I.; Švabić-Vlahović, M. In vitro antimicrobial activity of propolis and synergism between propolis and antimicrobial drugs. Microbiol. Res. 2003, 158, 353–357. [Google Scholar] [CrossRef]
  51. Guzman, J.D. Review. Natural cinnamic acids, synthetic derivatives and hybrids with antimicrobial activity. Molecules 2014, 19, 19292–19349. [Google Scholar] [CrossRef]
  52. Mahizan, M.N.; Yang, S.; Moo, C.; Song, A.A.; Chong, C.; Chong, C.; Abushelaibi, A.; Lim, S.E.; Lai, K. Terpene derivatives as a potential agent against antimicrobial resistance (AMR) pathogens. Molecules 2019, 24, 2631. [Google Scholar] [CrossRef] [Green Version]
  53. Ogunade, I.M.; Kim, D.H.; Jiang, Y.; Weinberg, Z.G.; Jeong, K.C.; Adesogan, A.T. Control of Escherichia coli O157:H7 in contaminated alfalfa silage: Effects of silage additives. J. Dairy Sci. 2016, 99, 4427–4436. [Google Scholar] [CrossRef]
  54. Wilkinson, J.M.; Davies, D.R. The aerobic stability of silage: Key findings and recent developments. Grass Forage Sci. 2013, 68, 1–19. [Google Scholar] [CrossRef]
  55. Ranjit, N.K.; Kung, L., Jr. The effect of Lactobacillus buchneri, Lactobacillus plantarum, or a chemical preservative on the fermentation and aerobic stability of corn silage. J. Dairy Sci. 2000, 83, 526–535. [Google Scholar] [CrossRef]
  56. Weinberg, Z.G.; Chen, Y.; Solomon, R. The quality of commercial wheat silages in Israel. J. Dairy Sci. 2008, 92, 638–644. [Google Scholar] [CrossRef] [Green Version]
  57. González, G.; Rodriguez, A.A. Effect of storage method on fermentation characteristics, aerobic stability, and forage intake of tropical grasses ensiled in round bales. J. Dairy Sci. 2003, 86, 926–933. [Google Scholar] [CrossRef] [Green Version]
  58. Kung, L., Jr.; Robinson, J.R.; Ranjit, N.K.; Chen, J.H.; Golt, C.M.; Pesek, J.D. Microbial populations, fermentation end-products, and aerobic stability of corn silage treated with ammonia or a propionic acid-based preservative. J. Dairy Sci. 2000, 83, 1479–1486. [Google Scholar] [CrossRef]
  59. De Castro, P.A.; Savoldi, M.; Bonatto, D.; Barros, M.H.; Goldman, M.H.; Berretta, A.A.; Goldman, G.H. Molecular characterization of propolis-induced cell death in Saccharomyces cerevisiae. Eukaryot. Cell. 2011, 10, 398–411. [Google Scholar] [CrossRef] [Green Version]
  60. Jeranyama, P.; Alvaro, D.; Garcia, A.D. Understanding Relative Feed Value (RFV) and Relative Forage Quality (RFQ); ExEx8149; College of Agriculture &Biological Sciences/South Dakota State University: Brookings, SD, USA, 2004. [Google Scholar]
  61. Moore, J.E.; Undersander, D.J. Relative forage quality: An alternative to relative feed value and quality index. In Proceedings of the 13th Annual Florida Ruminant Nutrition Symposium, Gainesville, FL, USA, 10–11 January 2002; pp. 16–32. [Google Scholar]
  62. Boman, R.L. New forage analysis: Increased feed efficiency potential. USU Dairy Newsl. 2003, 26, 3. [Google Scholar]
  63. Cömert Acar, M.; Özelçam, H.; Şayan, Y.; Önenç, S. The accuracy of pepsin-cellulase technique for estimating the in vivo metabolizable energy values of maize silage and dry forages. J. Anim. Prod. 2018, 59, 49–53. [Google Scholar]
  64. Barchiesi-Ferrari, C.; Alomar, D.; Miranda, H.C. Pepsin-cellulase digestibility of pasture silages: Effects of pasture type, maturity stage, and variations in the enzymatic method. J. Agric. Res. 2011, 71, 249–257. [Google Scholar] [CrossRef] [Green Version]
Figure 1. Deviation of silage temperature from ambient temperature (20 °C−24 °C) during 7 days of aerobic exposure. CON, Control; PROP1, 1000 mg/kg propolis; PROP2, 2000 mg/kg propolis; PROP3, 3000 mg/kg propolis.
Fermentation 08 00412 g001
Table 1. Chemical composition of the ethanol extract of propolis.
Item %Item%
Aromatic acids Hydrocarbons
Benzyl cinnamate9.37Nonacosane1.02
Methyl cinnamate4.23Triacontane0.63
Caffeic acid7.98Heneicosane0.95
Terpenes Triacosane2.46
Alpha-Pinene1.05Hexacosane0.29
Indolin, 2- methylene1.76Fatty acids
Alpha-Copaene8.42Hexadecanoic acid1.55
Beta-Maaliene1.819-Octadecanoic acid3.11
Beta-Eudesmol11.14Docosanoic acid1.68
Alpha-Eudesmol8.58Tetracosanoic acid1.66
Beta-Pinene0.52Octacosanoic acid2.02
Alpha-Bisabolol12.26 Octadecanoic acid4.12
9,12- Octadecanoic acid5.79
Table 2. The effects of different propolis levels on silage qualities (n = 4).
ItemCONPROP1PROP2PROP3SEMp-Value
Smell8.014.014.08.00.780.002
Structure4.04.04.04.00.001.000
Color1.02.02.01.00.110.002
DLG point132020130.840.002
QualityModerateExcellentExcellentModerate--
CON, Control; PROP1, 1000 mg/kg propolis; PROP2, 2000 mg/kg propolis; PROP3, 3000 mg/kg propolis; SEM, standard error of means.
Table 3. Chemical compositions of the alfalfa silages (% in DM).
ItemCONPROP1PROP2PROP3SEMp-Value
OM89.52 b89.76 a89.71 a89.73 a0.030.019
CP17.99 c18.44 b18.80 a18.50 b0.09˂0.001
EE3.05 c3.54 b3.70 a3.44 b0.07˂0.001
CF22.80 a22.44 b21.99 c22.50 b0.09˂0.001
NFE45.68 a45.35 ab45.22 b45.28 ab0.070.100
CA10.48 a10.24 b10.29 b10.27 b0.030.019
NDF39.67 a38.69 b36.76 d37.90 c0.32˂0.001
ADF22.12 a19.78 b16.64 c21.76 a0.66˂0.001
CON, Control; PROP1,1000 mg/kg propolis; PROP2, 2000 mg/kg propolis; PROP3, 3000 mg/kg propolis; OM, organic matter; CP, crude protein; EE, ether extract; CF, crude fiber; NFE, nitrogen-free extract; CA, crude ash; NDF, neutral detergent fiber; ADF, acid detergent fiber; ADL, acid detergent lignin; SEM, standard error of means. a–d Means with different letters in the same line are statistically significant (p < 0.05).
Table 4. Fermentation quality of alfalfa silages.
ItemCONPROP1PROP2PROP3SEMp-Value
DM,%23.45 d26.49 b27.59 a23.95 c0.52˂0.001
pH4.97 a4.77 b4.73 b4.80 ab0.030.016
WSC, g/kg DM68.67 a57.67 c36.97 d62.28 b3.58˂0.001
LA, g/kg DM14.39 d29.72 b33.07 a23.62 c2.14˂0.001
NH3-N, g/kg TN16.71 a15.58 b13.10 d14.91 c0.39˂0.001
DM Loss,%1.55 a1.27 a0.70 b1.40 a0.110.008
Flieg’s score53.23 c67.31 a70.84 a60.89 b2.14˂0.001
WSC, Water-soluble carbohydrates; LA, lactic acid; NH3-N,ammonia nitrogen; TN, total nitrogen; DM loss, dry matter loss; CON, control; PROP1,1000 mg/kg propolis; PROP2,2000 mg/kg propolis; PROP3,3000 mg/kg propolis; SEM, standard error of the mean. a–d Means with different letters in the same line are statistically significant (p < 0.05).
Table 5. Total fatty acid composition (% of total fatty acid) of fresh alfalfa and alfalfa silages.
Item WACONPROP1PROP2PROP3SEMp-Value
Miristic acid5.832.59 b3.43 a2.08 c1.53 d0.21˂0.001
Palmitic acid26.0536.74 a25.54 b16.48 c7.16 d3.30˂0.001
Palmitoleic acid1.891.74 a1.32 b1.66 a1.85 a0.060.001
Stearic acid6.786.50 a6.17 b6.41 a6.03 b0.060.004
Oleic acid1.872.76 d4.72 c5.03 b6.15 a0.37˂0.001
Linoleic acid17.0614.18 d16.73 c17.03 b18.45 a0.46˂0.001
Linolenic acid35.5528.98 c30.99 b31.28 b35.32 a0.69˂0.001
10-octadecenoic acidND2.67 c3.56 a2.85 b0.8 d0.31˂0.001
10,13-octadecadienoic acidNDND4.35c5.15b5.99a0.70˂0.001
SFA38.6445.83 a35.14 b24.97 c14.72 d3.49˂0.001
USFA56.3750.33 d61.67 c63.00 b68.57 a1.99˂0.001
MUFA3.767.17 c9.60 a9.54 a8.80 b0.29˂0.001
PUFA52.6143.16 d52.07 c53.46 b59.77 a1.79˂0.001
WA, Wilted alfalfa; CON, control; PROP1,1000 mg/kg propolis; PROP2, 2000 mg/kg propolis; PROP3, 3000 mg/kg propolis; SFA, saturated fatty acid; USFA, unsaturated fatty acid; MUFA, monounsaturated fatty acid; PUFA, polyunsaturated fatty acid; ND, not detected; SEM, standard error of the mean. a–d Means with different letters in the same line are statistically significant (p < 0.05).
Table 6. Microbiological analysis results of alfalfa silages, log10 CFU/g.
ItemCONPROP1PROP2PROP3SEMp-Value
LAB3.95 c5.78 a5.90 a4.36 b0.26˂0.001
Yeast2.05 aNDNDND0.27˂0.001
MoldNDNDNDND--
EnterobacteriaNDNDNDND--
CON, Control; PROP1,1000 mg/kg propolis; PROP2, 2000 mg/kg propolis; PROP3,3000 mg/kg propolis; ND, not detected; CFU, colony-forming units; SEM, standard error of the mean. a–c Means with different letters in the same line are statistically significant (p < 0.05).
Table 7. Aerobic stability test results of alfalfa silages.
ItemCONPROP1PROP2PROP3SEMp-Value
3rd day
DM24.61 d27.19 b28.53 a25.12 c0.48˂0.001
pH5.07 a4.87 b4.87 b4.87 b0.030.006
CO2 g/kg DM6.47 a3.87 c2.87 d4.05 b0.40˂0.001
5th day
DM23.43 c24.81 b26.24 a24.76 b0.31˂0.001
pH5.17 a4.93 bc4.83 c5.03 b0.040.001
CO2 g/kg DM13.53 a10.52 b7.24 d8.84 c0.70˂0.001
7th day
DM22.99 b23.29 b25.15 a23.93 b0.280.003
pH5.4 a4.97 b4.93 b5.07 b0.060.003
CO2 g/kg DM34.69 a28.62 b10.24 d10.65 c3.26˂0.001
CON, Control; PROP1, 1000 mg/kg propolis; PROP2, 2000 mg/kg propolis; PROP3,3000 mg/kg propolis; SEM, standard error of the mean. a–d Means with different letters in the same line are statistically significant (p < 0.05).
Table 8. DDM, DMI, RFV, and ME contents of alfalfa silages.
ItemCONPROP1PROP2PROP3SEMp-Value
DDM,%71.67 c73.50 b75.94 a71.95 c0.51˂0.001
DMI,%3.02 d3.10 c3.26 a3.17 b0.03˂0.001
RFV168.01 c176.68 b192.13 a176.54 b2.63˂0.001
MEDDM, kcal/kg DM2433.82 c2508.17 b2607.53 a2445.34 c20.85˂0.001
CON, Control; PROP1,1000 mg/kg propolis; PROP2, 2000 mg/kg propolis; PROP3, 3000 mg/kg propolis; DDM, digestible dry matter; DMI, dry matter intake; RFV, relative feed value—reference hay of 100 RFV contains 41% ADF and 53% NDF; SEM, standard error of the mean. a–d Means with different letters in the same line are statistically significant (p < 0.05).
Table 9. In vitro digestibility and ME contents of alfalfa silages (in DM).
Item CONPROP1PROP2PROP3SEMp-Value
ELOS, %64.20 d66.69 b67.64 a65.36 c0.40˂0.001
EULOS, g/kg253.18 a230.74 c220.67 d243.71 b3.76˂0.001
DOM, % 71.72 d74.29 b75.40 a72.84 c0.42˂0.001
MEELOS, kcal/kg1556.53 c1637.95 a1655.35 a1599.05 b11.75˂0.001
CON, Control; PROP1,1000 mg/kg propolis; PROP2, 2000 mg/kg propolis; PROP3, 3000 mg/kg propolis; DOM, digestible organic matter; SEM, standard error of the mean. a–d Means with different letters in the same line are statistically significant (p < 0.05).
Table 10. Pearson correlations between main quality criteria in silages.
VariablepH3rdday pH5th day pH7th day pHLANH3-NDOMMERFV
Dry matter−0.676 *−0.546−0.878 **−0.746 **0.926 **−0.742 **0.976 **0.926 **0.845 **
WSC0.644 *0.5200.854 **0.666 *−0.857 **0.925 **−0.922 **−0.845 **−0.983 **
LAB−0.405−0.731 **−0.877 **−0.767 **0.939 **−0.642 *0.948 **0.935 **0.768 **
CP−0.696 *−0.598 *−0.871 **−0.809 **0.896 **−0.917 **0.851 **0.819 **0908 **
NDF0.641 *0.4910.834 **0.699 *−0.806 **0.980 **−0.795 **−0.781 **−0.950 **
ADF0.3900.4130.932 **0.652 *−0.858 **0.834 **−0.931 **−0.854 **−0.936 **
MUFA−0.811 **−0.848 **−0.849 **−0.861 **0.963 **−0.701 *0.887 **0.946 **0.747 **
PUFA−0.625 *−0.758 **−0.465−0.647 *0.564−0.595 *0.4020.4850.469
WSC, Water-soluble carbohydrates; LAB, lactic acid bacteria; CP, crude protein; NDF, neutral detergent fiber; ADF, acid detergent fiber; MUFA, monounsaturated fatty acid; PUFA, polyunsaturated fatty acid; pH at3, 5, 7 days after aerobic exposure; LA, lactic acid; NH3-N,ammonia nitrogen; DOM, digestible organic matter; ME, metabolic energy; RFV, relative feed value; p < 0.05 *, p < 0.01 **.
Publisher’s Note: MDPI stays neutral with regard to jurisdictional claims in published maps and institutional affiliations.

