Article

A Comparison of the Role of the Chelating Agent on the Structure of Lithium Conducting Solid Electrolyte Li1.4Al0.4Ti1.6(PO4)3: Pechini vs. Modified Pechini-Type Methods

by
Mohammad Reza Ghaani
1,2,*,
Amir Masoud Mohtasebi
2,
Razie Tajeri
2 and
Pirooz Marashi
2
1
School of Chemical and Bioprocess Engineering, University College Dublin, D04 V1W8 Dublin, Ireland
2
Department of Mining and Metallurgical Engineering, Amirkabir University of Technology, P.O. Box 15875-4413, Tehran, Iran
*
Author to whom correspondence should be addressed.
Submission received: 9 August 2020 / Revised: 22 September 2020 / Accepted: 23 September 2020 / Published: 26 September 2020

Abstract

:
In recent years, solid lithium-ion conductors have been widely studied because of their applications as electrodes and solid electrolytes in rechargeable lithium-ion batteries. Citric acid (CA) and ethylenediaminetetraacetic acid (EDTA) were employed to synthesize the nanostructured NASICON-type Li1.4Al0.4Ti1.6(PO4)3 ceramic. The chelating agent, together with an ethylene glycol (EG) and the esterification agent were employed to form a network decorated with uniform dispersed metal ions under specific conditions: molar ratio [complexing agent/metal ions] = 1 and the molar ratio [EG/EDTA] = 6, whereas the solution pH was kept below 1. A well crystalline NASICON structure was formed following the heat treatment of the produced gel at 630 °C. Simultaneous thermal analysis (STA) revealed lower required temperature for pyrolysis and crystallization using EDTA. Powder X-ray diffraction (PXRD) showed the formation of larger crystallite size when citric acid was employed. The data from scanning electron microscopy (SEM) and electrochemical impedance spectroscopy (EIS) have confirmed the higher apparent porosity and a larger proportion of grain boundaries in the case of EDTA-assisted synthesis.

1. Introduction

In recent years, solid lithium-ion conductors have been widely studied because of their applications as electrode materials in electrochemical and gas sensors (NO2, CO, and CO2) and electrodes and solid electrolytes in rechargeable lithium-ion batteries [1,2,3,4,5]. Na-Super-Ionic-Conductor (NASICON)-type structure ceramic family are known for their high conductivity [6,7] suitable for various applications [7,8,9,10,11,12]. These structures have a negatively charged 3D framework with M2P3O12 formula (consisting MO6 octahedra and PO4 tetrahedra) which contains two types of interstitial positions (M1 and M2), which are fully/partially filled by monovalent cations [13,14].
Ionic conductive materials such as Li1+xAlxTi2−x(PO4)3 (hereafter LATP) structure (x = 0.3–0.7) can be synthesized via various routes, such as spark plasma synthesis [12,15], solid-state reactions [16], and wet chemical reactions [17,18]. Conventional glass-ceramic synthesis methods require operating at elevated temperatures. Therefore, they are not suited to LATP synthesis in light of the high vapor pressure of lithium, which will cause lithium loss (evaporation) at elevated temperatures above 1000 °C, whereupon lithium will be sublimed and leave behind a lithium deficit structure [19,20,21,22]. Therefore, many attempts have been devoted to synthesizing LATP structures through lower temperature methods [17,21,22,23]. In particular, wet chemical methods such as sol–gel have the advantages of high chemical homogeneity, cost-effectiveness, easy handling, and feasibility for mass production [24,25].
In the Pechini method, as a member of the sol-gel family, metal cations are dissolved in an aqueous medium and stabilized uniformly, through the chelation process, by hydroxycarboxylic acids such as citric acid [26]. Adding hydroxy alcohol to the solution with chelated metal ions will result in the formation of a homogeneous polymer matrix [13]. By removing the polymeric phase through a pyrolysis reaction, a homogenous metal oxide compound was achieved. In some cases, to accomplish stabler metal complexes in solution and thus a more homogenous distribution of metallic ions in the polymeric instances, citric acid can be substituted with stronger complex agents, such as ethylene diamine tetraacetic acid (EDTA) [27,28,29], polyvinylpyrrolidone (PVP) [30,31], diethanolamine (DEA) [32,33], and sodium dodecyl sulfate (SDS) [34,35]. In general, complexing agents can be selected based on the precursors’ solubility, and the stability and conformation of the metal complex. On the other hand, the selection of the complexing agent, due to different bonding and coordination states and variant polymerization networks, affects the metal dispersion and thermal properties of the formed gel, in turn affecting different properties of the final compound, such as density, particle size, catalytical activity, and ionic conductivity [27]. Lu and his colleagues observed different calcination temperatures corresponding to the selected complexing agent. The gel obtained by malic or tartaric acid can be calcinated at temperatures over 600 °C, while temperatures higher than 800 °C were required to attain a pure phase of Ba2CaMoO6: Eu3+ using EDTA and citric acid [36].
The fact that citrate complexes of lanthanide elements are not soluble in water unlike the transition metal citrates, limits their application. One molecule of citrate is not sufficient to satisfy the high coordination number of a lanthanide element. Therefore, the citrate ligand will make an insoluble chain of the polymer by bridging with other citrates to be able to achieve the high coordination number of the metallic ion [37].
In this case, a mixture of citric acid with flexible coordination coverage and EDTA as a strong chelating ligand can prepare a soluble complex of lanthanide ions, as a useful precursor in sol–gel synthesis [38,39,40,41]. A sol–gel system based on a combination of EDTA and citric acid complexing agent, which can be considered as a powerful reagent to make a uniform distributed metal ions in the sol in the synthesis of various complex oxides [42,43,44,45,46]. Moreover, methods based on EDTA as the sole acting chelating agent, known as modified Pechini, have also been used in different studies trying to synthesize different complex compounds, such as mesoporous carbon foam [47], Bi2Sr2CaCu2O8+δ (Bi2212) superconducting thin film [48], and novel red phosphor materials NaLa(WO4)(MoO4):Eu3+ and Ba2CaMoO6:Eu3+ [36].
In this study, metallic ions (aluminum and lithium) were provided by water-soluble salts such as carbonate or nitrate to minimize any additional undesired elements in the solution. In the case of titanium source, Ti4+ has a very high charge density due to its high valence of four and a small ionic radius. As a result, titanium ions and water react rapidly to form titanium-oxo species, which are followed by the precipitation of hydrated TiO2. Highly acidic conditions for solutions containing Ti4+ are recommended to avoid precipitation. In some cases, titanium sulfate or a titanium tetrahalide such as TiCl4 has been used as the soluble precursor. Titanium alkoxides are also used for some applications [21,49,50,51]. Titanium peroxide ions are known as a stable and water-soluble complex under acidic conditions. The sol can be obtained by the direct reaction of hydrogen peroxide with metallic Ti under controlled conditions [52,53,54,55,56].
Reviewing the above literature shows a lot of studies have investigated the role of the synthesis method and starting precursors in the various properties of nanostructured materials. However, there are still some points that need more examination on the preparation of the active materials specifically designed to use in lithium-ion batteries, such as the role of the chelating agent in making the final structure of the NASICON materials.
This study aimed to investigate thermal properties, microstructure, and ionic conductivity of each the compounds synthesized through Pechini and modified Pechini synthesis routes via substituting citric acid with EDTA as a bigger chelating agent through the synthesis of Li1.4Al0.4Ti1.6(PO4)3. Moreover, to minimize any additional compound in the final product, the metallic powder of Ti was employed to synthesize titanium peroxide as the water-soluble source of titanium ion. The paper is structured in the following way: in Section 2 the used reagents and synthesis routes in addition to the characterization conditions are presented. In Section 3 the results of thermal analysis of the formed gels are followed by ex-situ XRD analysis of the prepared compounds at different temperatures. The ionic conductivity and microstructure of each of the samples are discussed in the latter part of this section; and in the final section of this paper, the objectives of this study are reviewed, and the challenges remaining for future studies are discussed.

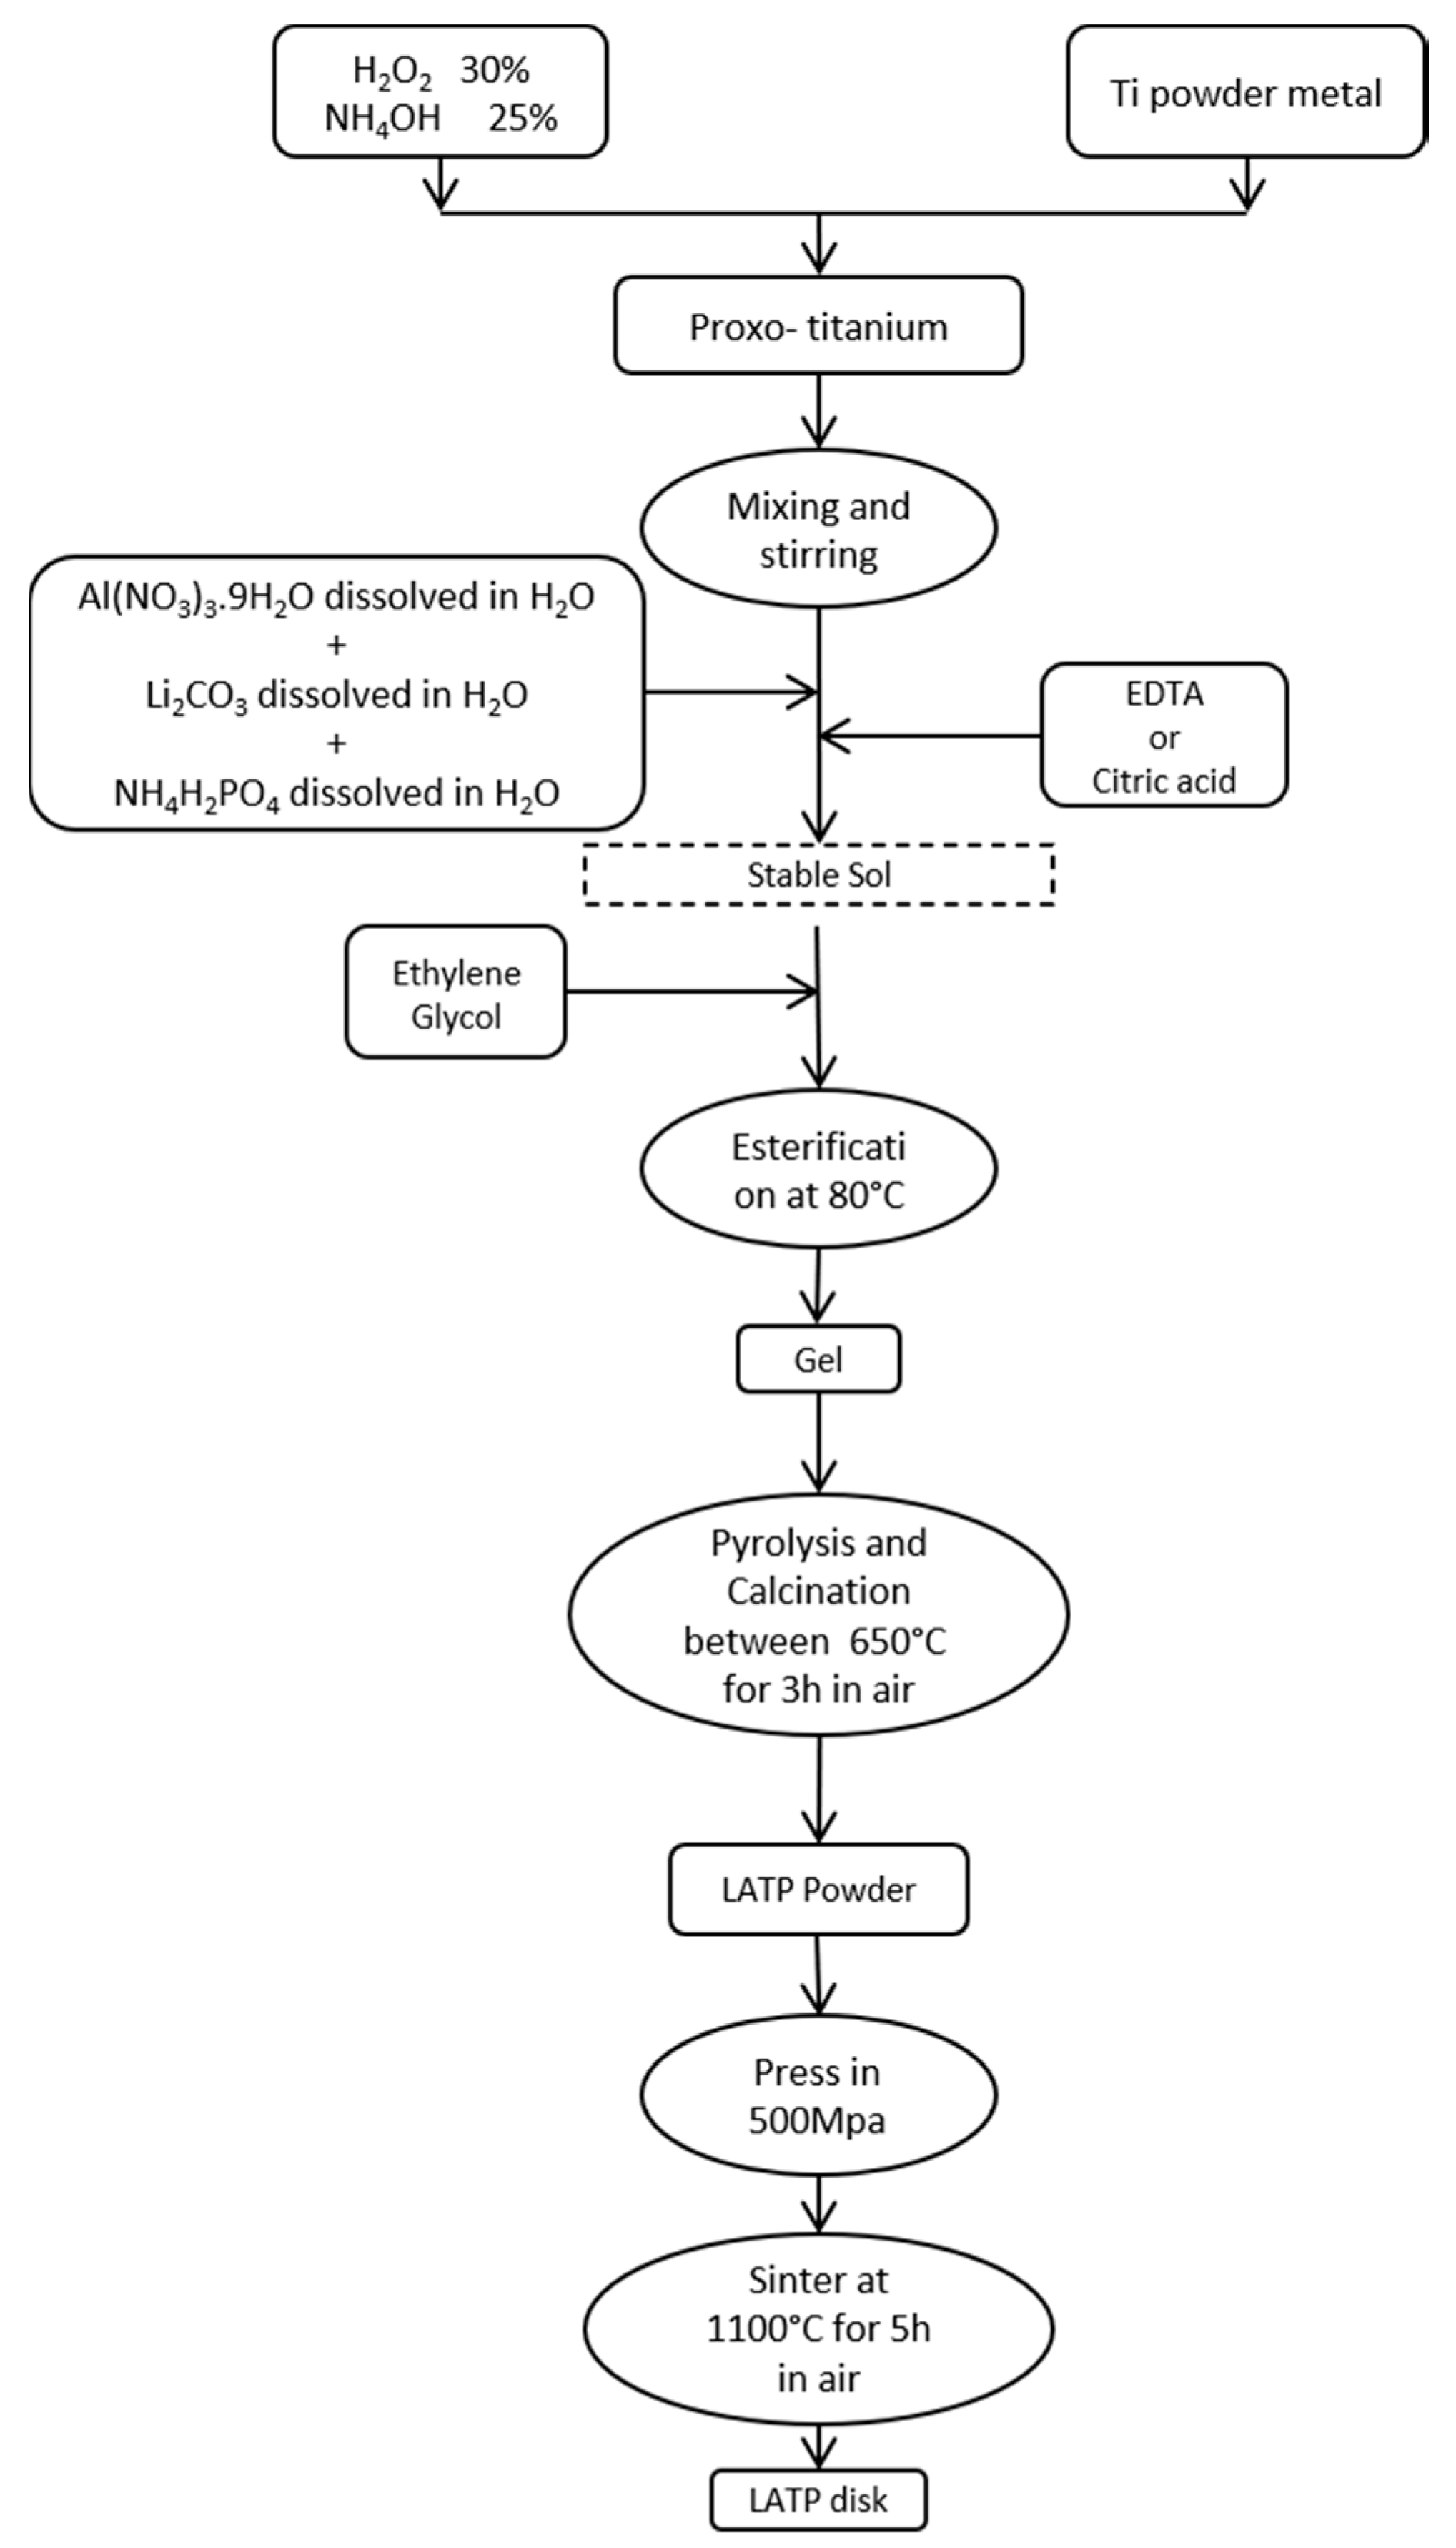
2. Synthesis of Materials and Preparation

2.1. Reagents and Solutions

Li1.4Al0.4Ti1.6(PO4)3 was synthesized using the following precursors in analytical grade: lithium carbonate (Li2CO3), ethylene glycol (EG = C6H8O7·H2O), and citric acid (CA = C2H6O2) were purchased from Sigma-Aldrich; and titanium metallic powder (Ti, >98%), aluminum nitrate nonahydrate (Al(NO3)3·9H2O), ammonium hydroxide (25%), hydrogen peroxide (H2O2, 30%), ammonium phosphate monobasic (NH4H2PO4), and Ethylenediaminetetraacetic acid (EDTA = C10H16N2O8) were obtained from Merck.
At first, peroxotitanium solution was prepared by dissolving Ti metal powder in hydrogen peroxide 30% and ammonia 25% [57,58]. In a separate beaker, a solution of lithium carbonate and ammonium dihydrogen phosphate was prepared. Under vigorous stirring, a complexing agent was added to each beaker separately. The contents of both beakers were mixed and ammonium phosphate monobasic was added while the solution’s temperature kept constant at 80 °C. The gel was formed after 3 h of stirring the mixture of the above-mentioned solutions and ethylene glycol while the pH of the solution was kept below 1. The molar ratios of the complexing agent to ethylene glycol and complexing agent to total moles of metallic ions (M) were 6.0 and 1.0, respectively. The formed gel was heat-treated at two steps in 650 °C and 1100 °C. The synthesis steps are summarized in Figure 1.

2.2. Characterization Methods

X-ray diffraction patterns of samples annealed at 1100 °C were obtained at room temperature using a Bragg–Brentano geometry Bruker D8 with Cu radiation source (λ = 1.5419 Å). The 2θ range in XRD analysis was 10–60° with a step size of 0.02. Simultaneous thermal analysis (STA), including thermogravimetric (TGA) and differential scanning calorimetry (DSC) analyses, was performed on the dried gel obtained from each synthesis method using a NETZSCH STA 409 PC/PG. The temperature range was 35–1100 °C with a heating rate of 10 °C min−1 using an Al2O3 crucible under an air environment.
To measure the ion conductivity, cylindrical disks of thickness 13 mm and 2 mm were prepared. The complex impedance measurements were performed using an Autolab impedance analyzer. A handmade setup was used to measure the impedance in solid-state mode. Au coating was applied on both sides of the prepared disk to have electrodes with good contact. Two copper plates deliver the electricity from the instrument connections to the coated electrodes while even amounts of pressure were applied to tighten the cell. Fifty logarithmically spaced points were recorded for each sample in the frequency range of 1–106 Hz at room temperature. To assess the scientific and statistical significance of the measurement and to avoid any error during the disk preparation, the analysis was repeated three times on three prepared disks for each synthesis route and the final result is reported as an average of all measurements.
The microstructures of the synthesized structures were studied using a Philips XL36 scanning electron microscope. Samples were gold-sputtered, and the images collected using the Secondary Electron (SE) detector under 15 kV accelerating voltage and 9.5 mm working distance.

3. Results and Discussion

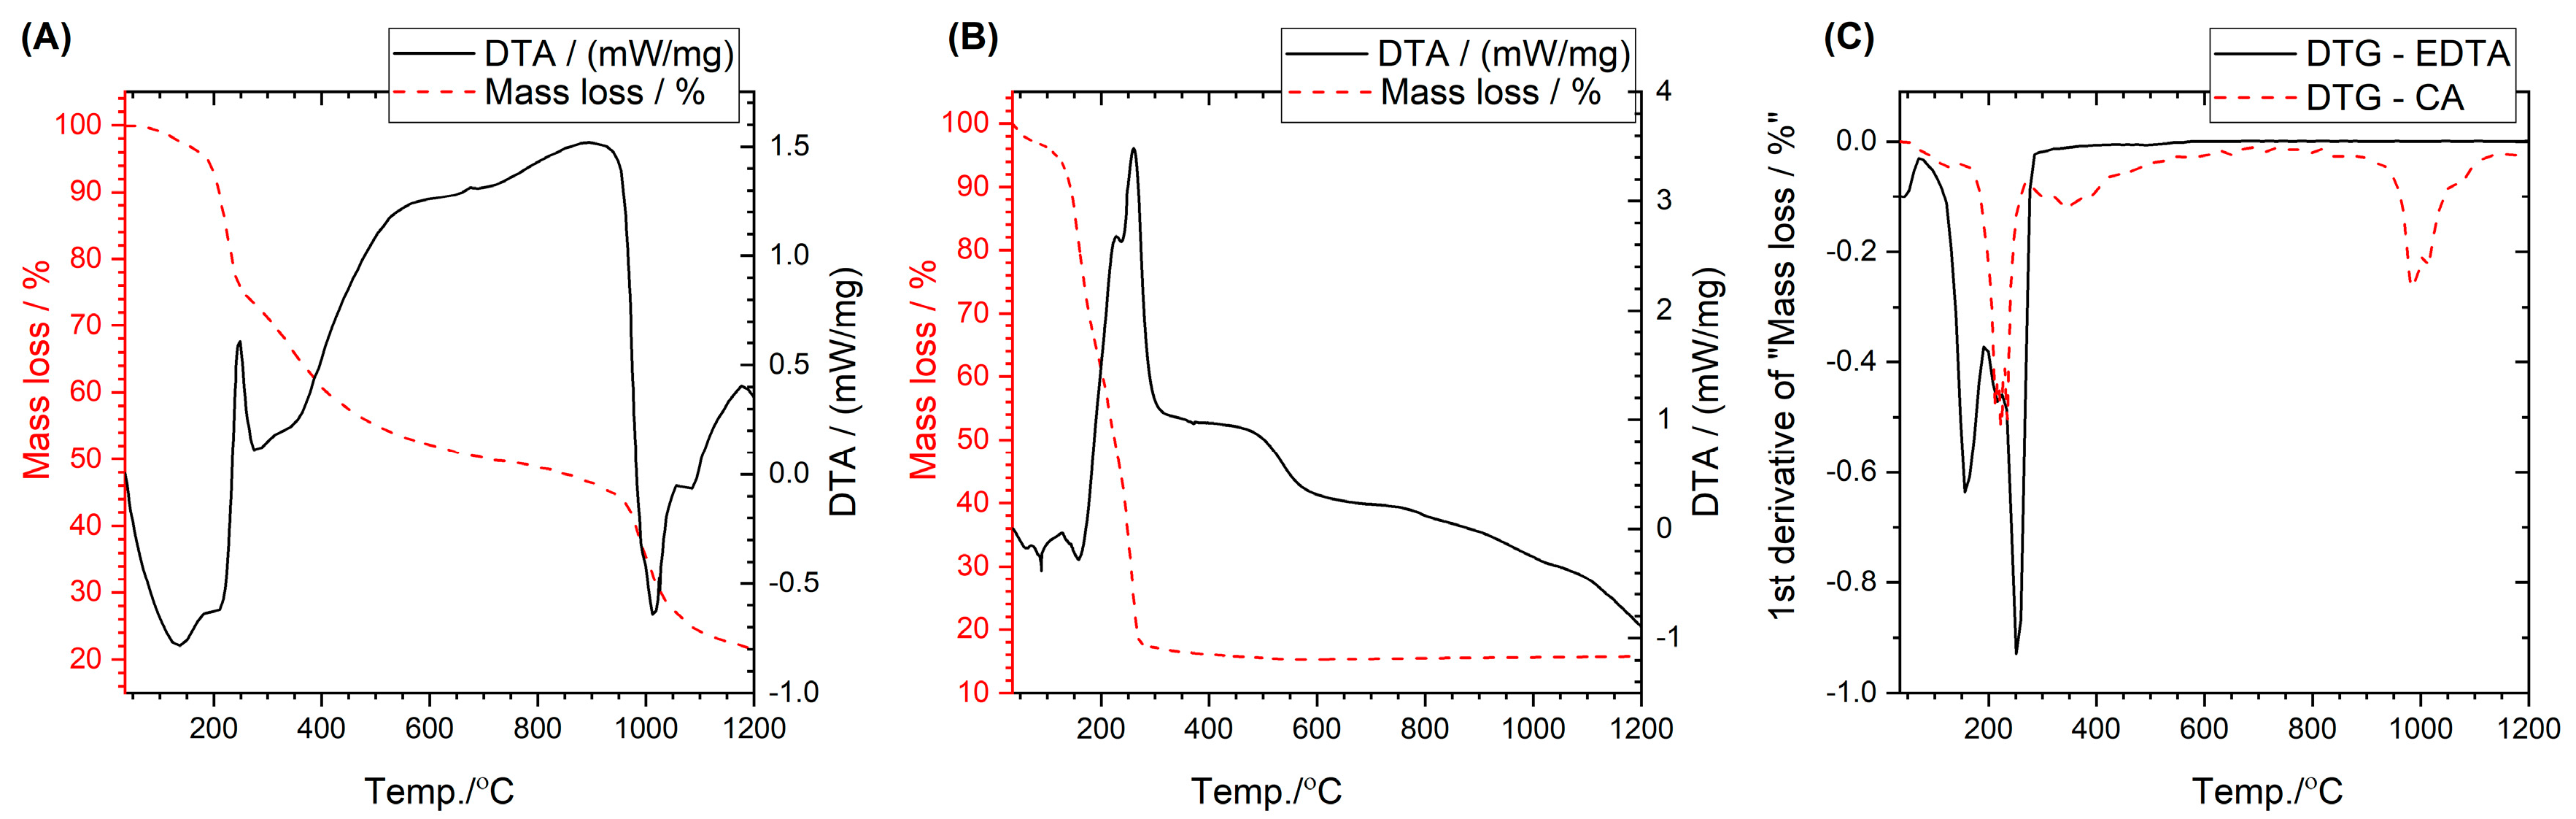
3.1. Thermal Behavior

Figure 2A,B shows the TGA-DSC curves of the dry gel prepared by citric acid and EDTA-assisted sol-gel methods. To better resolve all thermal events for the obtained gel, the derivative of the TG curve was calculated (Figure 2C). The first thermal event that happened between room temperature and ≈190 °C was attributed to the dehydration of the gel (weight loss of 35%). This process corresponds to an endothermic peak in the DSC curve.
The second weight loss from 190 to 305 °C is accompanied by an exothermic peak event in the DSC curve, due to the first burnout of organic compounds and evaporation of trapped ammonia. The main removal of organic compounds, the breakup of EDTA into carbonates and nitrates, the volatilization of NH4NO3, and the elimination of CO32− and NO3 happened at 262 °C, which shows up with an intense exothermic peak [59]. The second exothermic peak with the maximum at 523 °C is possibly related to the crystallization of an LATP phase.
The weight loss observed from 305 to about 600 °C is related to the removal of residual organic compounds. The DTA and TG curves of the citric acid-assisted gel are also presented in Figure 2A for comparison. In comparison with CA-based gels, lower thermal dissociation and crystallization were observed for the case of EDTA. The bond strength between metal and oxygen may be the controlling factor for such a shift in the pyrolysis temperature [60,61]. It is known that the bond strength is inversely proportional to the chemical bond distance [62]. Since the EDTA-assisted complex had a longer metal–oxygen bonding distance compared to the citrate complex, a lower pyrolysis temperature as a result of a relatively weaker bond strength was observed. The other possible reason for the lower decomposition temperature could be the lone pair electrons from the amine group in EDTA which accelerate crystallization of the crystal structure [27].

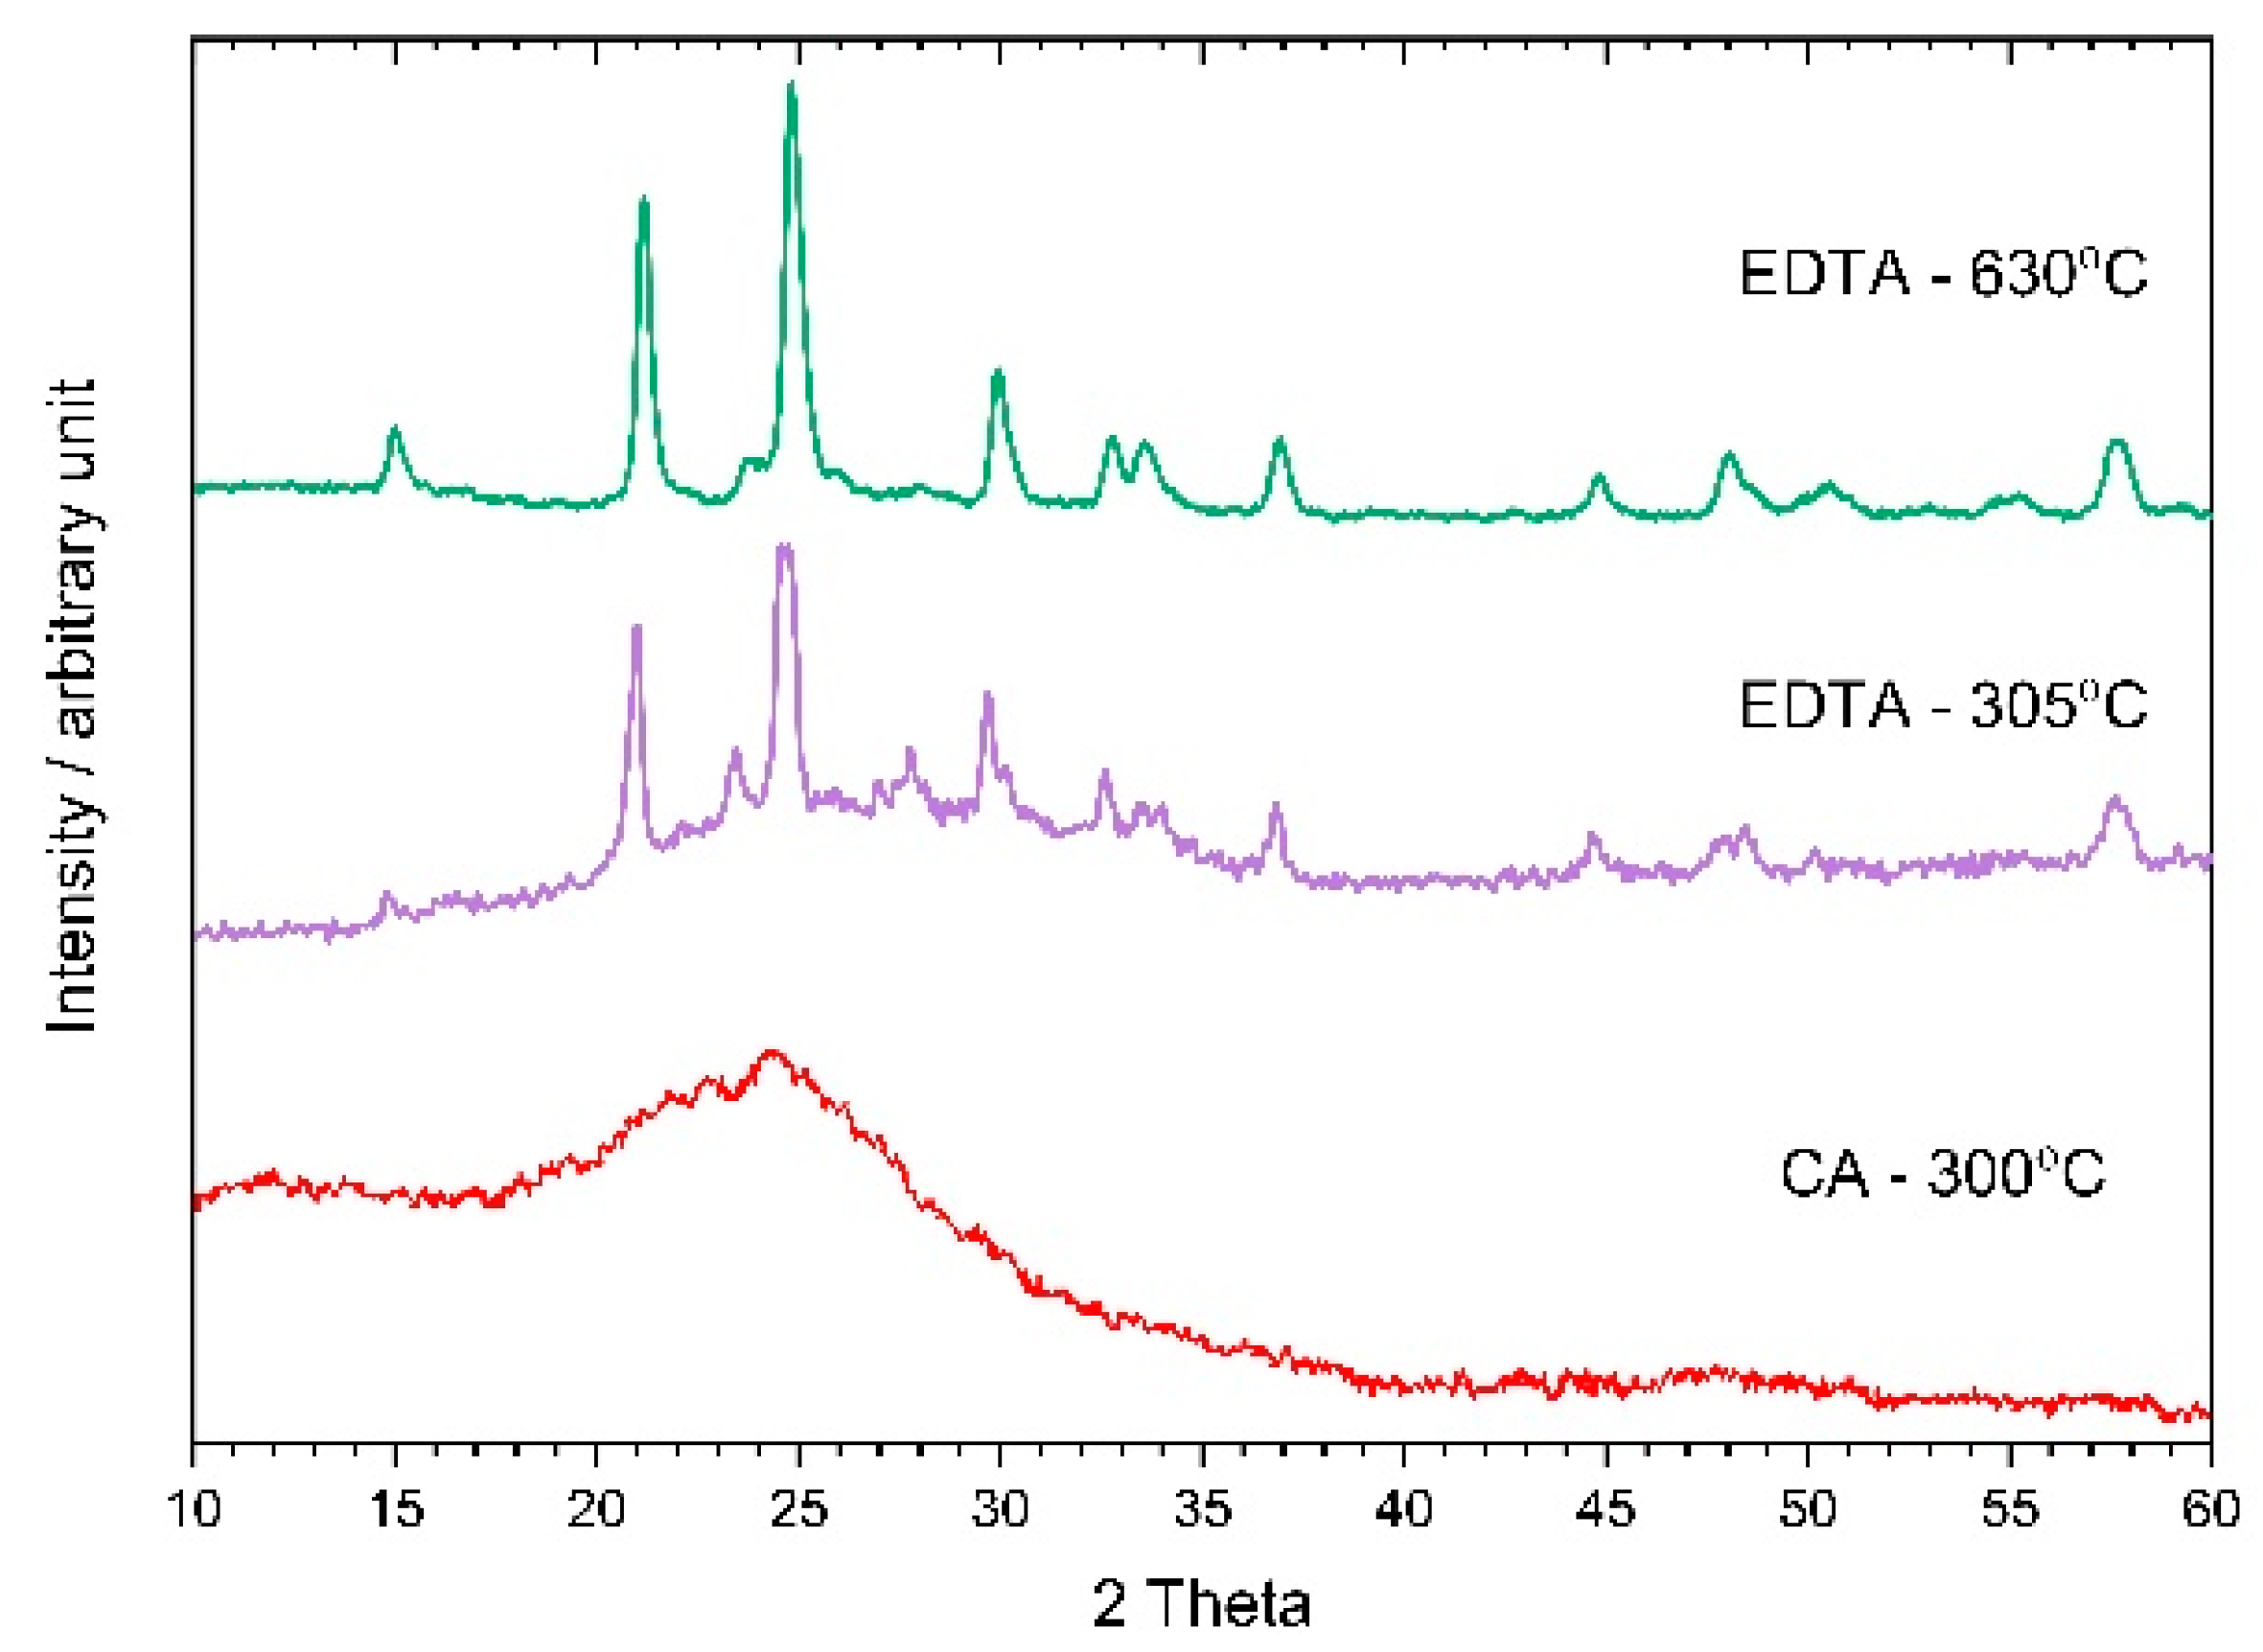
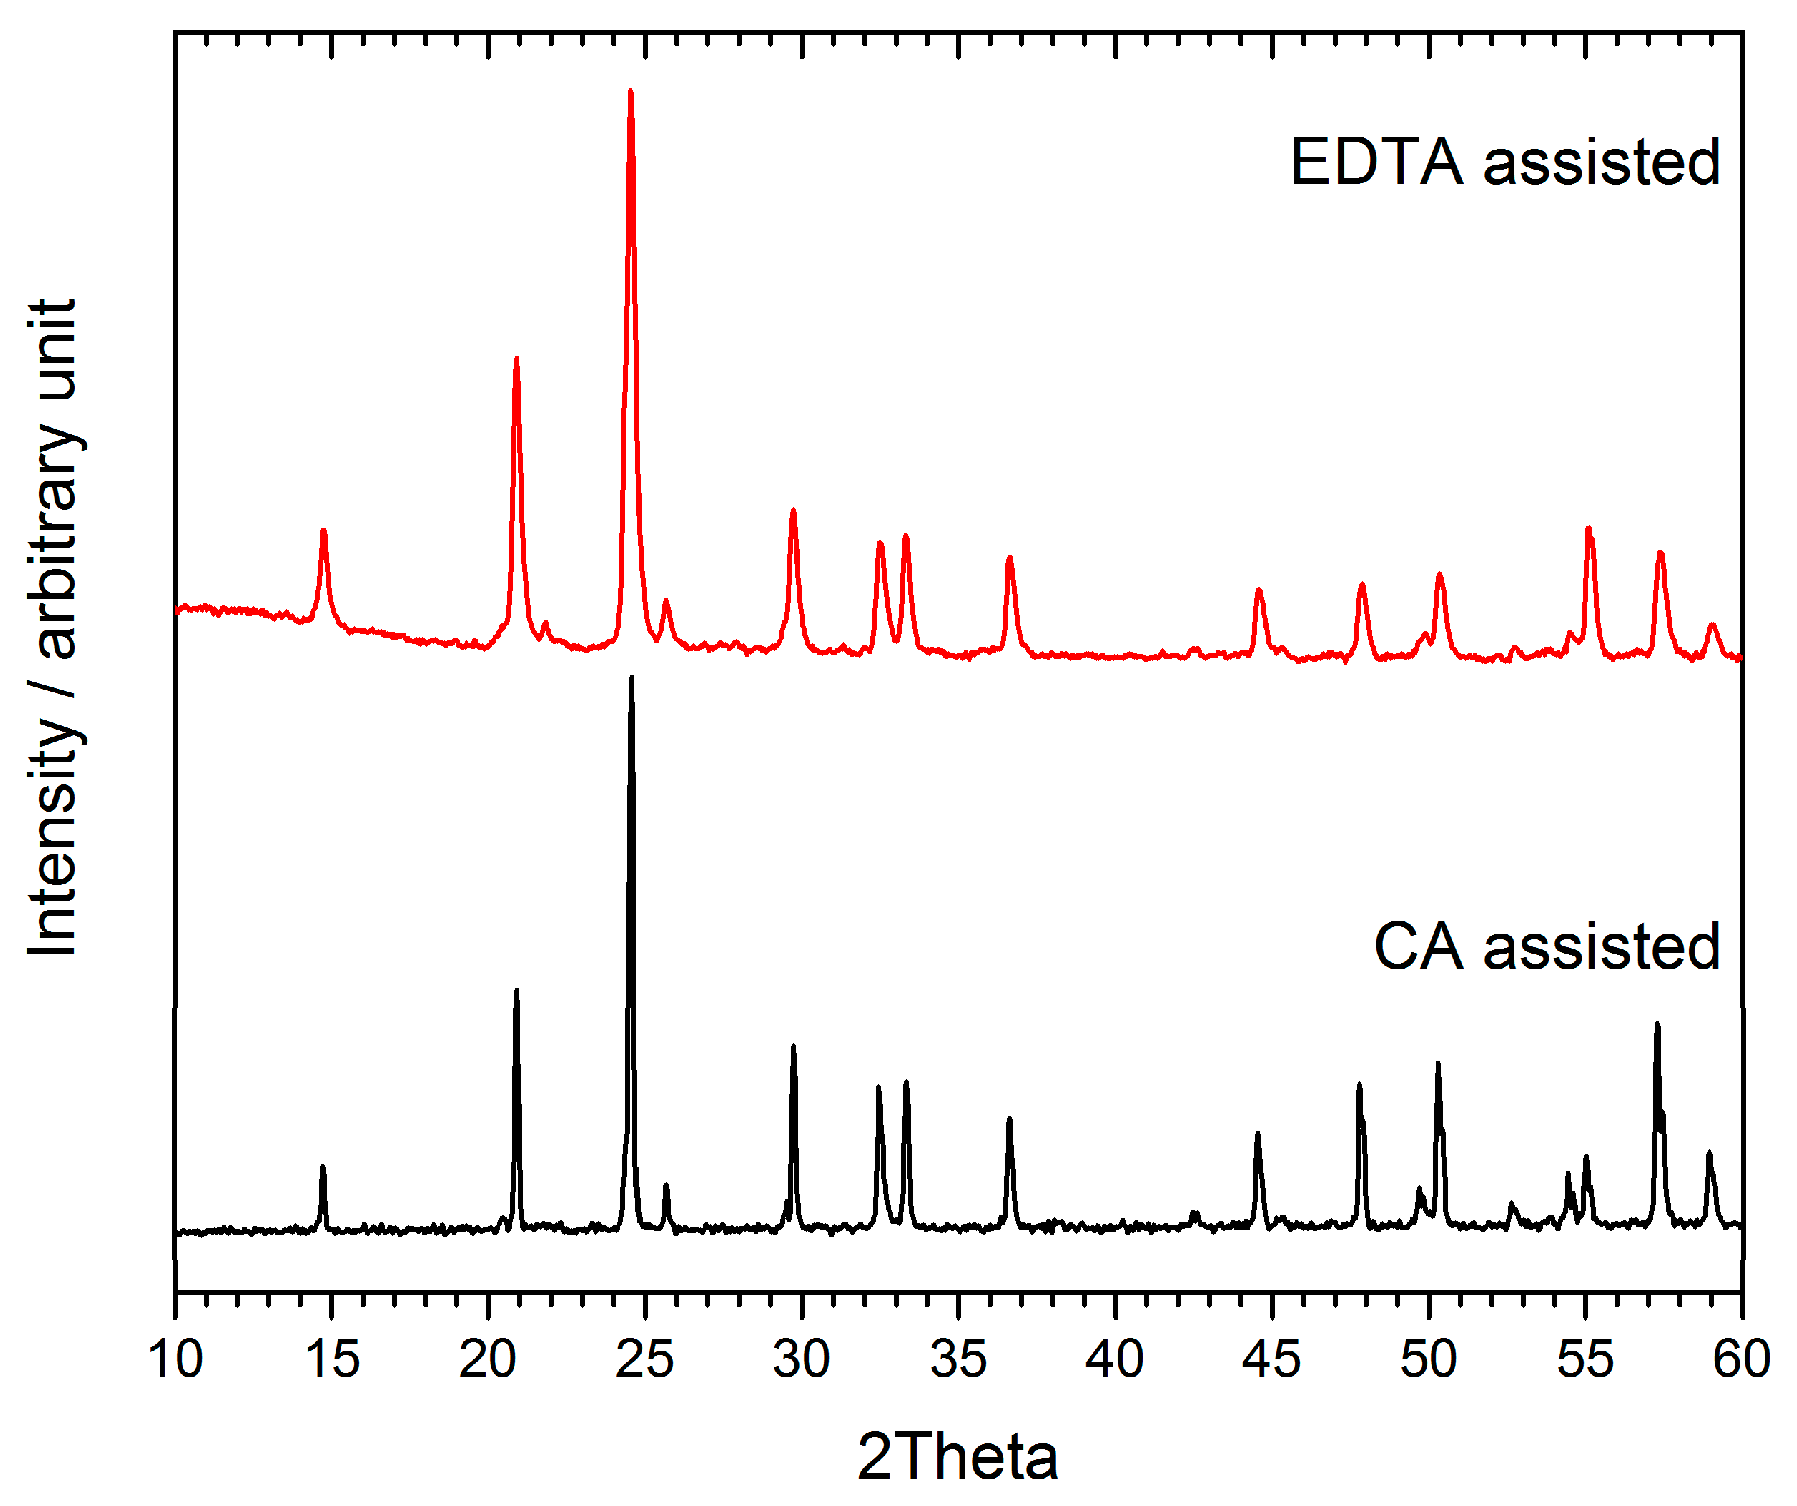
3.2. Heat Treatment and Phase Analysis

The gels obtained from both synthesis routes contained main components of the NASICON phase and water and organic impurities. Thus, based on the results of thermal analysis, different heat treatment procedures were applied to remove the impurities and crystalize the LATP phase.
Single-pass heating with a 2 °C/min rate was applied to the gel formed via the EDTA-assisted route at three different temperatures (305, 630, and 1100 °C) for 3 h. Figure 3 shows the XRD patterns of heat-treated samples. A mixture of amorphous and crystalline phases can be seen for the gel treated at 305 °C, in agreement with the crystallization event shown in the DSC graph of the modified Pechini gel (Figure 2B). The low crystallinity level of the CA-assisted sample after treating at 300 °C confirms the different crystallization temperatures required for EDTA- and CA-assisted samples. The XRD graphs of the gel heated at 630 °C show a completely crystalline NASICON phase. Sharper diffraction peaks were observed for the sample heated at 1100 °C (Figure 4), due to the higher degree of crystallinity and the larger grains.
The patterns were indexed to the rhombohedral unit cell ( R 3 ¯ C space group), using Le-bail refinement with GSAS/EXPGUI software [63]. Table 1 shows the lattice parameters of the products obtained in each synthesis route.
It is known that dull width at half maximum (FWHM) values of X-ray diffraction peaks have an inverse relation to the grain size. Based on recorded patterns for both samples treated at 1100 °C (Figure 4) the measured FWHM values for the most intense peaks of the product of Pechini and modified Pechini route were 0.14 and 0.30 (degrees), respectively. The crystallite sizes (D) of prepared samples were determined using the Scherrer equation [20].
D = K λ B m 2 B s 2 cos θ
where Bm is the FWHM of the most intense peak; Bs is the FWHM of the standard sample which for our cases is equal to 0.06. Based on the chemical composition of the sample, the K as the shape factor value was selected to be equal to 0.91. The main peaks for the products of CA- and EDTA-assisted sol-gel methods appeared at 2θ = 24.57 and 24.53 (degrees), respectively.
The D value for the sample prepared through a modified Pechini method was found to be 34 nm, whereas using the Pechini method resulted in a NASICON structure with 102 nm crystallite size. The same behavior was also reported in a work by Moon et al. [27], in which EDTA-assisted synthesized LaNiO3 showed a smaller particle size and more textural pores. This difference is mainly caused by the lower nucleation temperature in the case of EDTA system, as confirmed by the thermal analysis data presented in Figure 2. While lower temperature is required for nucleation, a higher number of nuclei can form during the heating process, in turn creating a higher number of smaller grains which face each other at grain boundaries and stop growing.

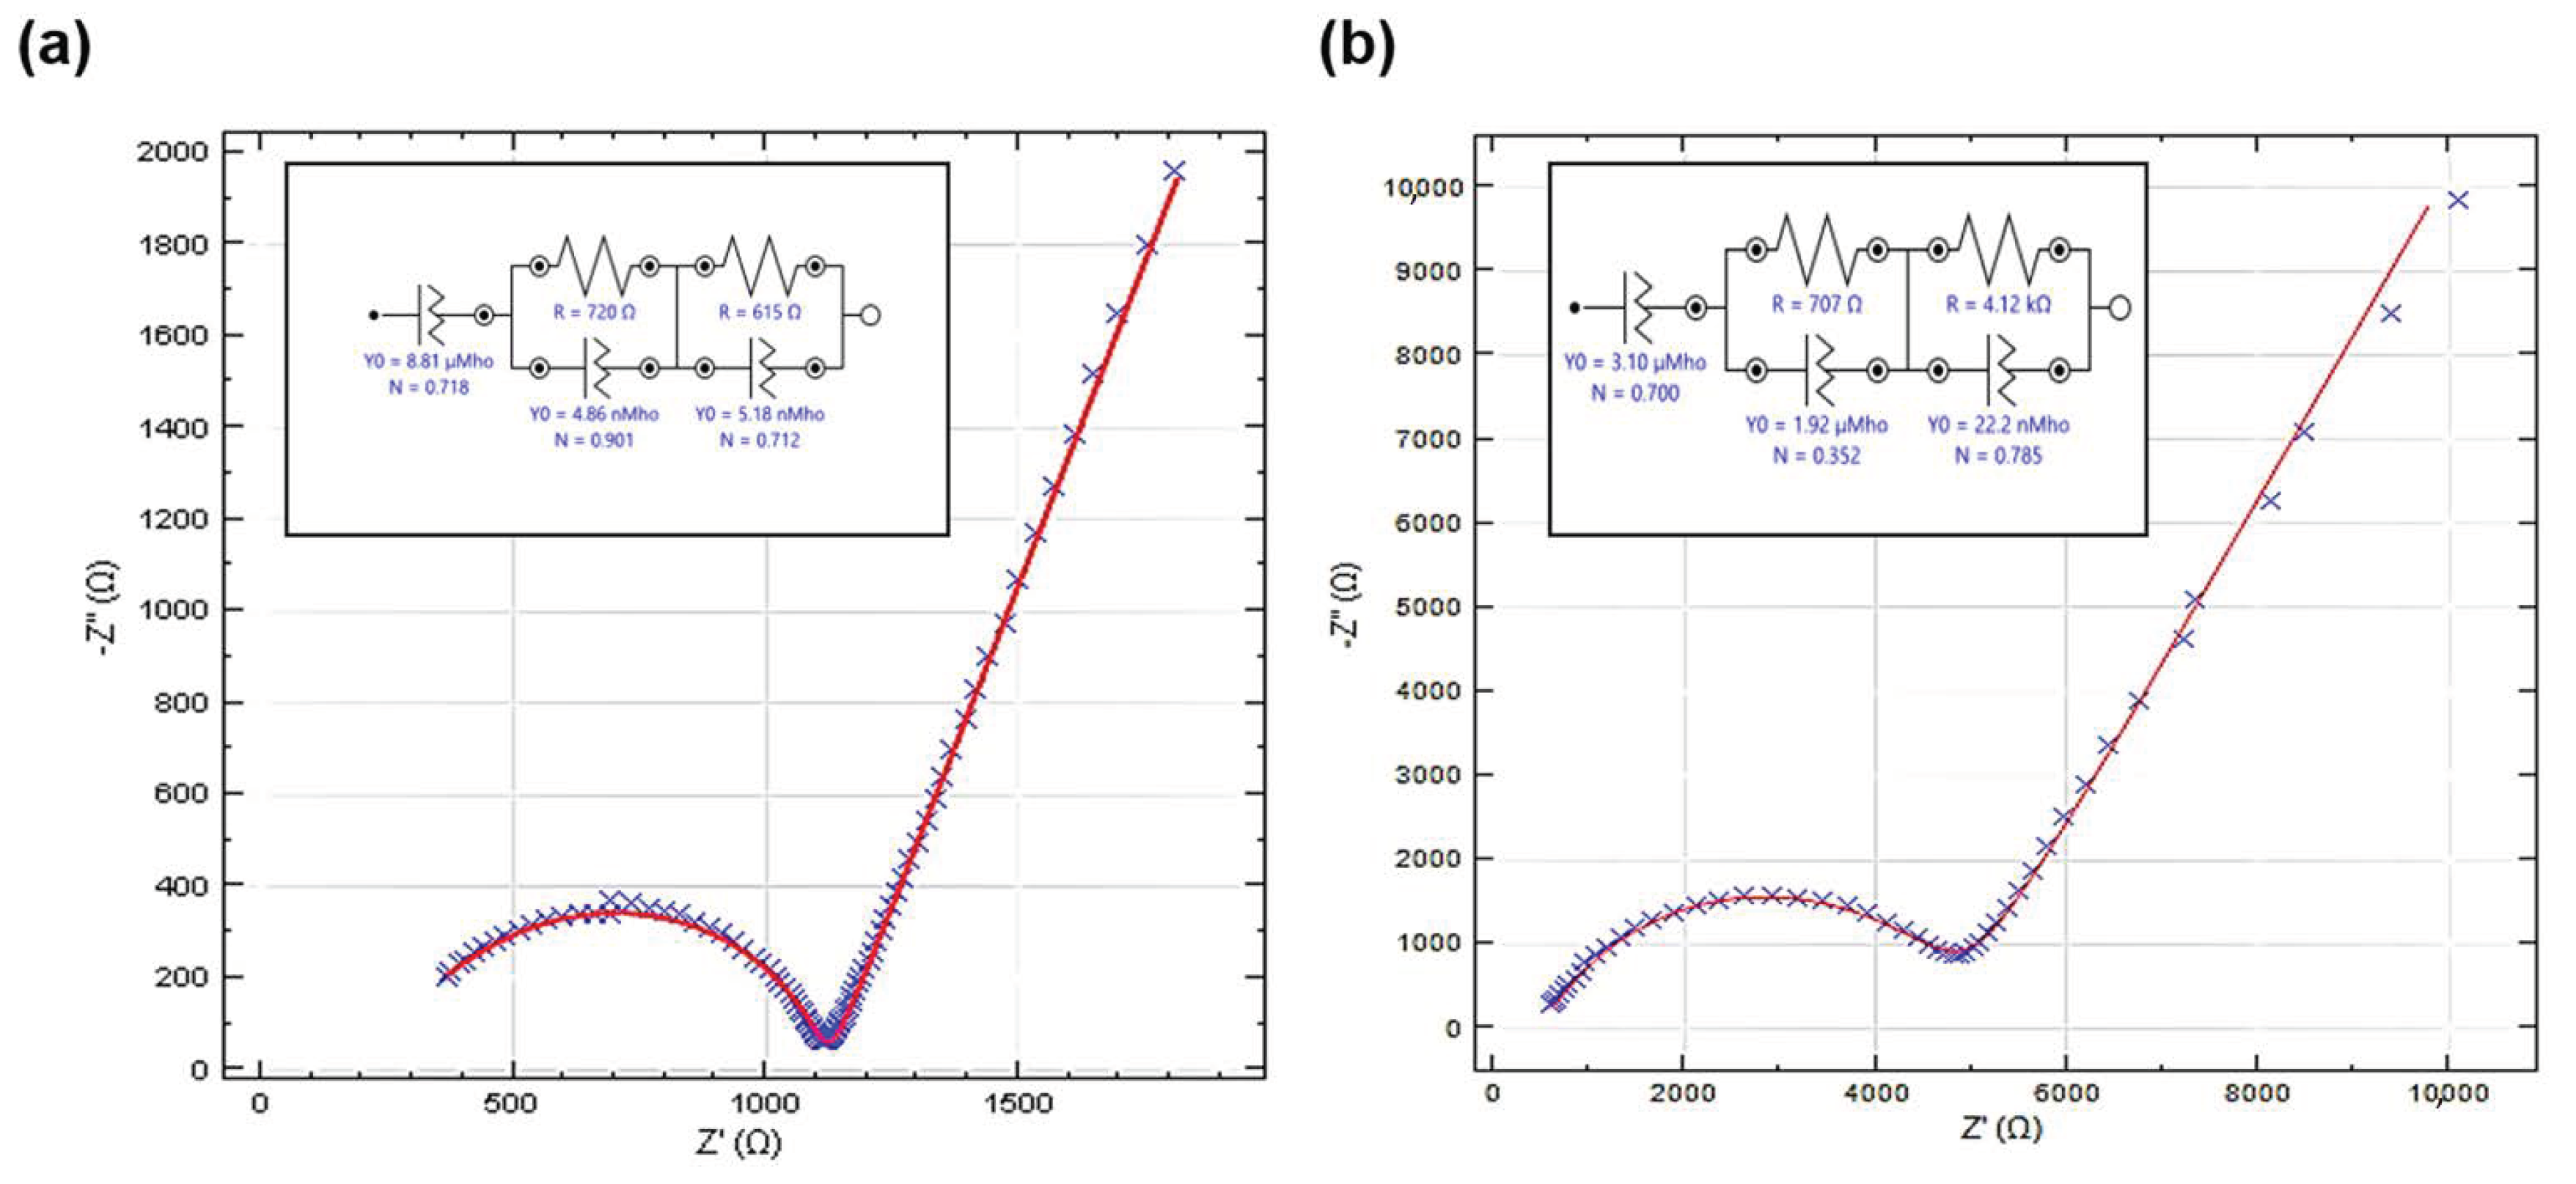
3.3. Electrochemical Impedance Spectroscopy Studies

EIS measurements were performed on both EDTA- and CA-assisted compounds. To have the best contact between the disk and the main copper electrodes, both sides of the sintered disks were coated with a thin layer of gold using the sputtering technique. The resulting Nyquist diagram is presented in Figure 5. The values of different components influencing the overall ionic conduction behavior of the prepared compounds were extracted using the proposed equivalent circuit presented as an inset plot in Figure 5. This circuit is made of three contestant phase elements (CPE) which represent the grain boundary, bulk, and electrodes resistivities [64,65].
To compute the conductivity value of each sample as shown in the following equation, the values were normalized according to the size and thickness of the samples.
σ i = 4 t π D 2 Z i
where σi and Zi are respectively the conductivity and the resistance of the i-th component. Thickness and diameter of the analyzed disk are defined as t and D. Based on the fact that the resistance of grains and grain boundaries behaves like a serial circuit (Rtotal = Rb + Rgb), the total conductivity (σtotal), the conductivity of the grains (σb), and the conductivity of the grain boundaries (σgb) were calculated and listed in Table 2.
Although the bulk conductivity (σb) for both samples is similar, the lower grain boundary conduction for the case of the EDTA-assisted sample makes the total conductivity of the sample prepared by citric acid four times higher than that of the EDTA system. The similar bulk conductivities imply similar NASICON structures, while the lower grain boundary conduction is due to smaller grain size which creates a higher proportion of grain boundaries to the bulk area. These two observations are consistent with the recorded XRD patterns (Figure 4), where the phase composition is the same, but the crystallite size is smaller in the case of the EDTA-assisted sample. It is worth mentioning that the higher standard deviation observed in the case of grain boundary measurement is affected by different errors during disk preparation such as the pressing step, Au sputtering, and even final connection of the wires to the coated electrode.

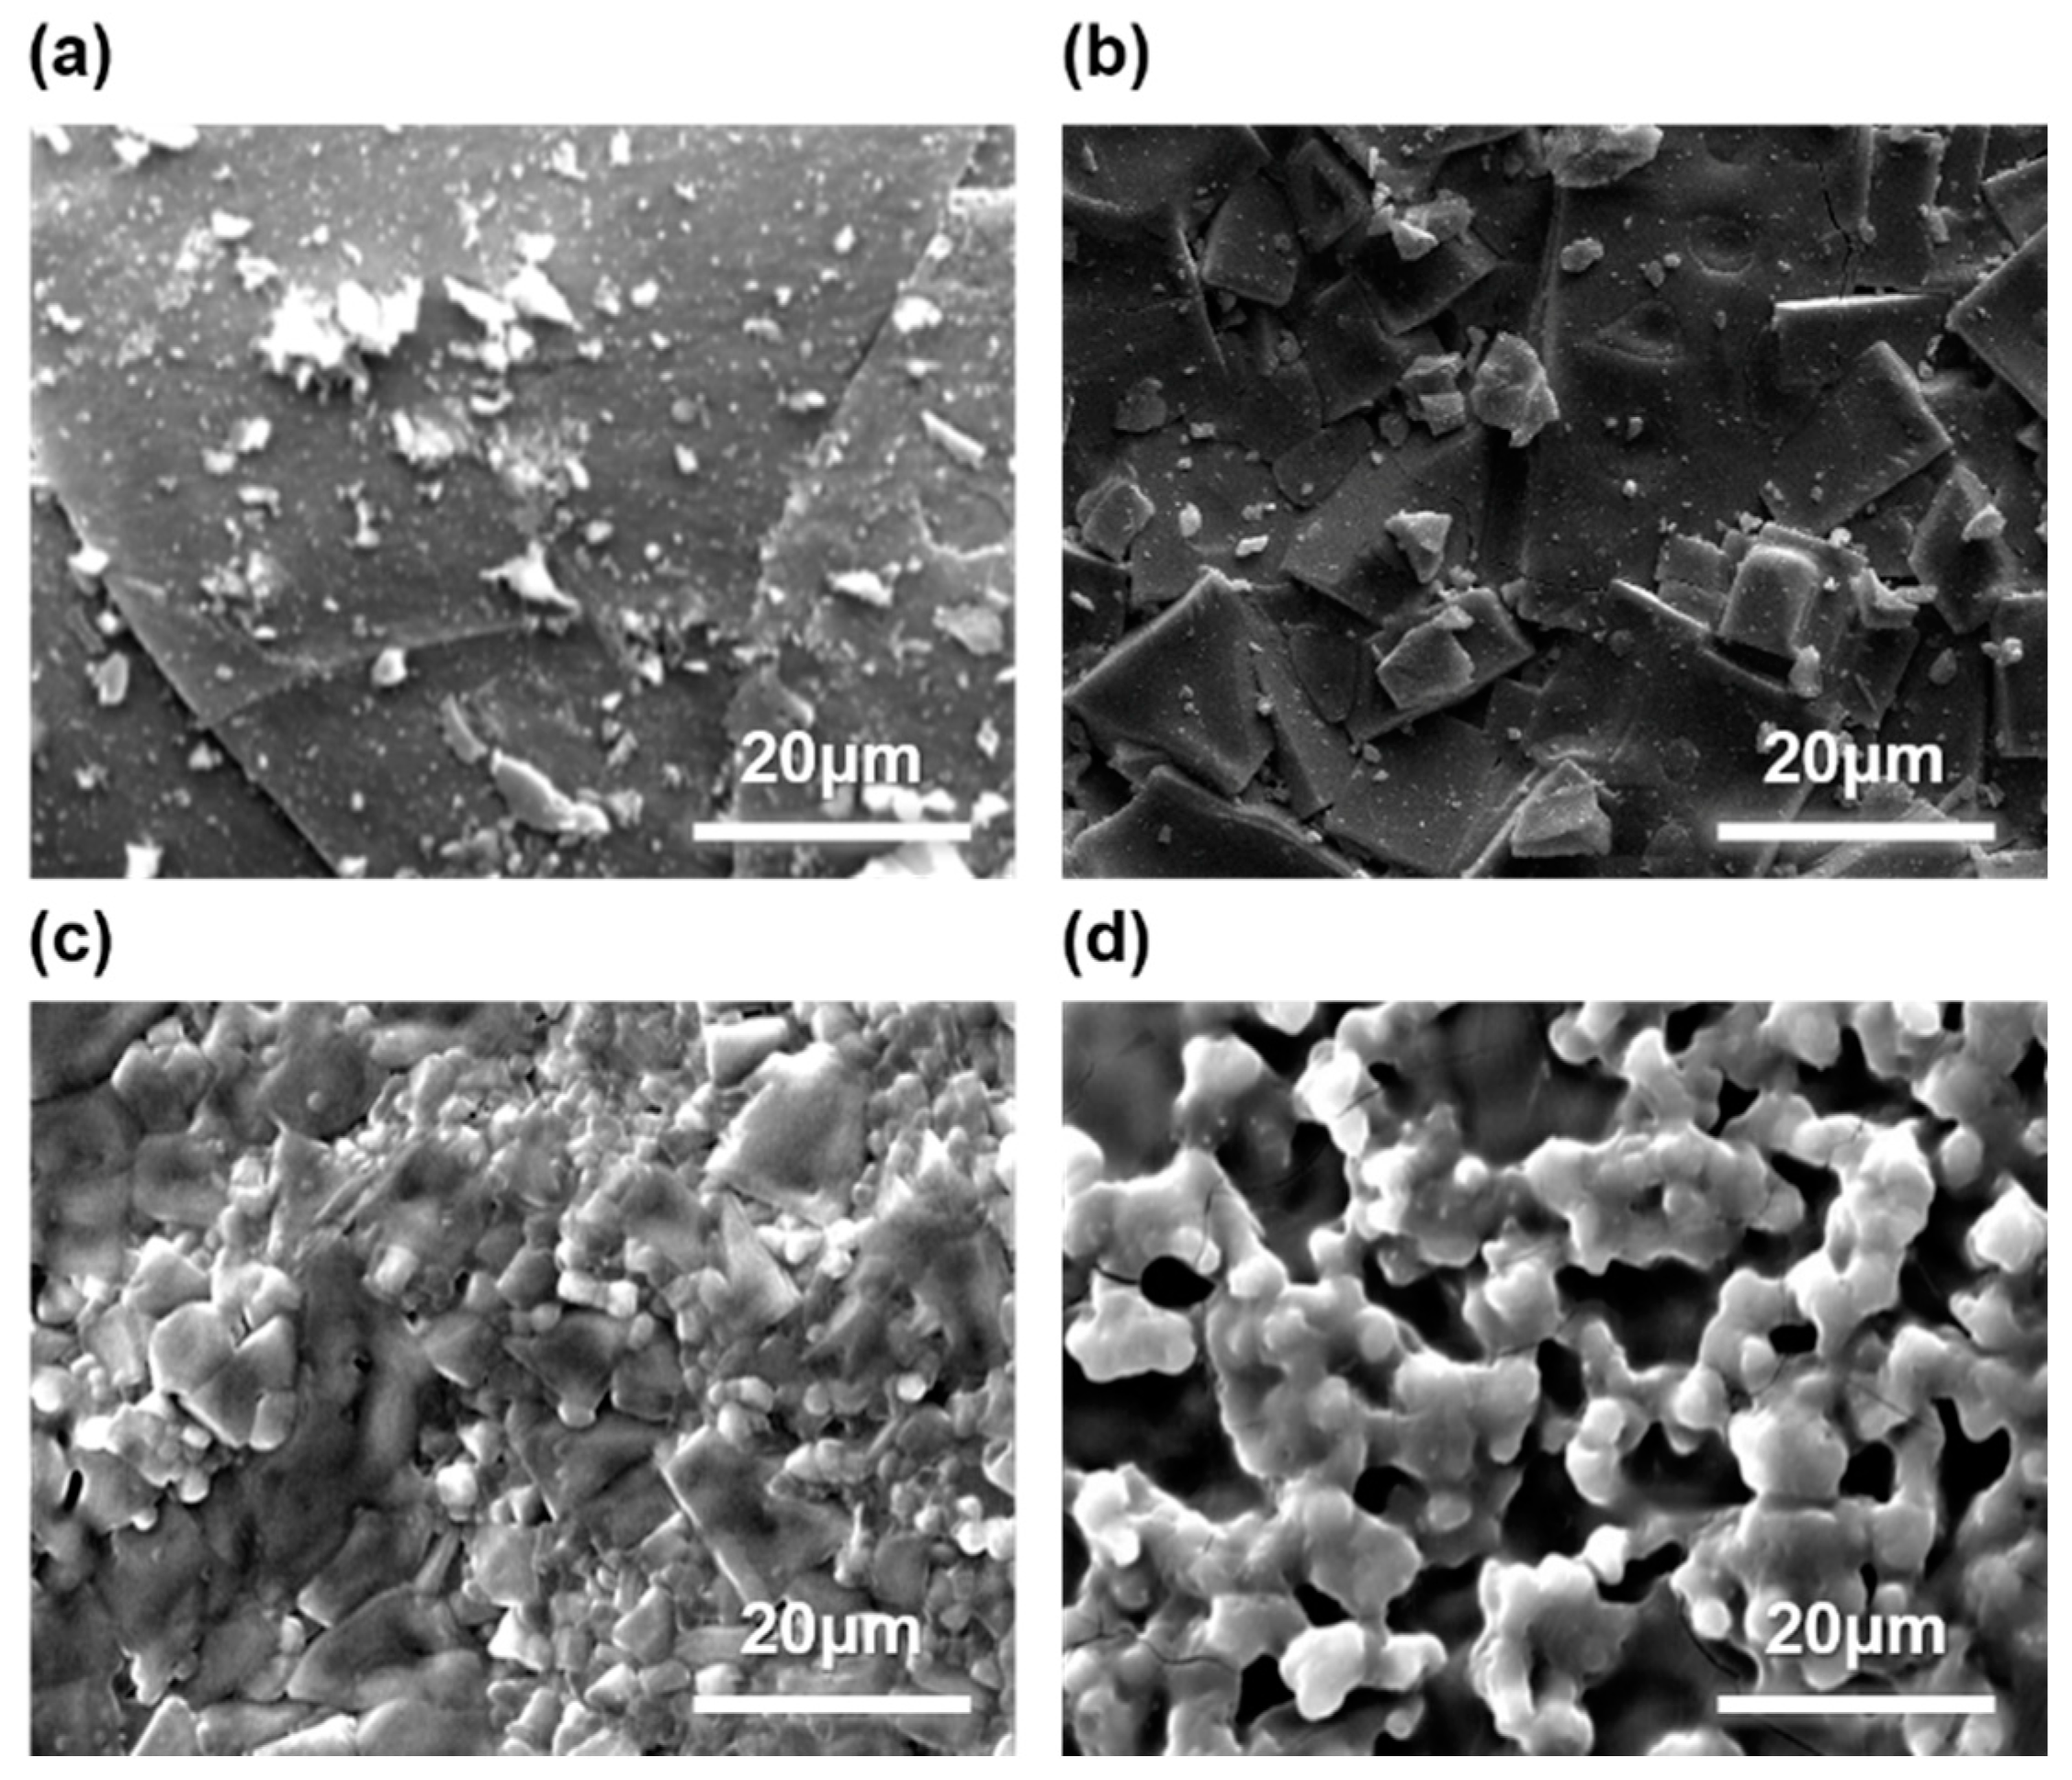
3.4. Microstructure Analysis

Figure 6 shows the prepared samples after sintering at 1100 °C for 3 h both in powder and disk forms. As discussed in the previous section, the nature of the chelating agent does affect the microstructure of the final sample. Uniform planar grains can be observed in the micrographs from the powder form (Figure 6a,b), while in the disk form (Figure 6c,d) the morphology changed due to pressing and disk preparation. The observed planar surfaces are larger in the case of CA in comparison with EDTA system. It is important to clarify that the small particles observed in the images could be the result of various smaller particles agglomerated with different orientations, while the observed planar surfaces are the result of a big grain or a multiple grains crystallized in the same direction instead. Further studies concerning the possibility of recrystallization, aggregation, and agglomeration during the heat treatment process can be done. A more detailed investigation into the SEM images, with additional sample preparation steps, besides employing particle size analysis techniques such as DLS on the samples treated at different temperatures, will be essential for said study.
The overall appearance of the SEM images of the sintered disk surface can also suggest a higher apparent porosity in the case of the EDTA-assisted process (Figure 6d) in comparison with the CA-assisted disk (Figure 6c). This difference in microstructure is in line with the higher grain boundary resistance data based on the EIS results.

4. Conclusions

To study the effects of the chelating reagent on the synthesis of NASICON structure compounds, Li1.4Al0.4Ti1.6(PO4)3 was successfully synthesized using both Pechini and modified Pechini methods. The LATP phase was obtained at molar ratios [complexing agent/metal-ions] = 1 and [EG/complexing agent] = 6 and calcination temperature of 630 °C. Titanium ions were added into the solution in the form of titanium peroxide produced from titanium metal powders. Various properties of the formed structures were compared for the products of both methods. The observed differences can be summarized as:
  • Lower pyrolysis and crystallization temperature in case of the EDTA-assisted structure.
  • Larger crystallite size in the case of the CA-assisted structure.
  • Same bulk conductivity complemented by lower overall conductivity in the EDTA-assisted structure due to a larger portion of grain boundaries with low conductivity.
  • Higher apparent porosity and smaller formed grains upon using EDTA or CA were confirmed by SEM images. However, a porosity analysis is recommended to study the compatibility of the prepared compounds in future studies.
Concerning the wide application of the Pechini method as an inexpensive technique in the preparation of different complex inorganic compounds, using EDTA as the complexing agent can be useful for some applications such as catalysts, where smaller grains and more accessible surface area is required. In the case of NASICON materials, where ionic conductivity is required (e.g., for gas sensors, ion-selective electrochemical sensors, or solid electrolytes for lithium-ion batteries) citric acid as the complexing agent would be the best candidate.
Feature research can extend this study by employing other chelating agents, under optimized synthesis conditions for each agent, such as working pH or various molar ratios of the starting materials. In addition to the analysis reported in this study, porosity analysis will add a new insights, since the ionic conductivity of the final compacted disk is also affected by the empty spaces left between each particle.

Author Contributions

Conceptualization, M.R.G.; methodology, A.M.M. and R.T.; data analysis, M.R.G., A.M.M., and R.T.; writing—original draft preparation, M.R.G. and A.M.M.; writing—review and editing, M.R.G.; supervision: P.M.; project administration, M.R.G. and P.M.; All authors have read and agreed to the published version of the manuscript.

Funding

This research received no external funding.

Conflicts of Interest

The authors declare no conflict of interest.

References

  1. Lorenc, P.; Strzelczyk, A.; Chachulski, B.; Jasinski, G. Properties of Nasicon-based CO2 sensors with Bi8Nb2O17 reference electrode. Solid State Ion. 2015, 271, 48–55. [Google Scholar] [CrossRef]
  2. Xu, X.; Wen, Z.; Wu, J.; Yang, X. Preparation and electrical properties of NASICON-type structured Li1.4Al0.4Ti1.6(PO4)3 glass-ceramics by the citric acid-assisted sol–Gel method. Solid State Ion. 2007, 178, 29–34. [Google Scholar] [CrossRef]
  3. Jasinski, G.; Jasinski, P.; Chachulski, B.; Nowakowski, A. Electrocatalytic gas sensors based on Nasicon and Lisicon. Mater. Sci. 2006, 24, 262–268. [Google Scholar]
  4. Kale, G.M.; Wang, L.; Hayes, J.E.; Congjin, J.; Hong, Y.R. Solid-state sensors for in-line monitoring of NO2 in automobile exhaust emission. J. Mater. Sci. 2003, 38, 4293–4300. [Google Scholar] [CrossRef]
  5. Safanama, D.; Damiano, D.; Rao, R.P.; Adams, S. Lithium conducting solid electrolyte Li1+xAlxGe2−x(PO4)3 membrane for aqueous lithium air battery. Solid State Ion. 2014, 262, 211–215. [Google Scholar] [CrossRef]
  6. Narváez-Semanate, J.L.; Rodrigues, A.C.M. Microstructure and ionic conductivity of Li1+xAlxTi2−x(PO4)3 NASICON glass-ceramics. Solid State Ion. 2010, 181, 1197–1204. [Google Scholar] [CrossRef]
  7. Jian, Z.; Hu, Y.-S.; Ji, X.; Chen, W. NASICON-Structured Materials for Energy Storage. Adv. Mater. 2017, 29, 1601925. [Google Scholar] [CrossRef]
  8. Wang, J.; Wang, Y.; Seo, D.; Shi, T.; Chen, S.; Tian, Y.; Kim, H.; Ceder, G. A High-Energy NASICON-Type Cathode Material for Na-Ion Batteries. Adv. Energy Mater. 2020, 10, 1903968. [Google Scholar] [CrossRef]
  9. Ma, C.; Hao, X.; Yang, X.; Liang, X.; Liu, F.; Liu, T.; Yang, C.; Zhu, H.; Lu, G. Sub-ppb SO2 gas sensor based on NASICON and LaxSm1-xFeO3 sensing electrode. Sens. Actuators B Chem. 2018, 256, 648–655. [Google Scholar] [CrossRef]
  10. Zhang, Y.; Ma, C.; Yang, X.; Song, Y.; Liang, X.; Zhao, X.; Wang, Y.; Gao, Y.; Liu, F.; Liu, F.; et al. NASICON-based gas sensor utilizing MMnO3 (M: Gd, Sm, La) sensing electrode for triethylamine detection. Sens. Actuators B Chem. 2019, 295, 56–64. [Google Scholar] [CrossRef]
  11. Wi, T.-U.; Lee, C.; Rahman, F.; Go, W.; Kim, M.-H.; Kim, H.-S.; Hwang, D.; Kwak, S.K.; Kim, Y.; Lee, H.W. The Chemical Stability of Nasicon as a Solid Electrolyte for Seawater Batteries. ECS Meet. Abstr. 2019. [Google Scholar] [CrossRef]
  12. Yang, G.; Safanama, D.; Phuah, K.C.; Adams, S. Enhanced Li1+xAlxGe2−x(PO4)3 Anode-Protecting Membranes for Hybrid Lithium–Air Batteries by Spark Plasma Sintering. ACS Omega 2020, 5, 18205–18212. [Google Scholar] [CrossRef] [PubMed]
  13. Mariappan, C.R.; Galven, C.; Crosnier-Lopez, M.-P.; Le Berre, F.; Bohnke, O. Synthesis of nanostructured LiTi2(PO4)3 powder by a Pechini-type polymerizable complex method. J. Solid State Chem. 2006, 179, 450–456. [Google Scholar] [CrossRef]
  14. Catti, M. Lithium location in NASICON-type Li+ conductors by neutron diffraction. I. Triclinic α′-LiZr2(PO4)3. Solid State Ion. 1999, 123, 173–180. [Google Scholar] [CrossRef]
  15. Lin, Y.F.; Chang, C.Y. Magnetic mesoporous iron oxide/carbon aerogel photocatalysts with adsorption ability for organic dye removal. RSC Adv. 2014, 4, 28628–28631. [Google Scholar] [CrossRef]
  16. Vijayan, L.; Govindaraj, G. Structural and electrical properties of high-energy ball-milled NASICON type Li1.3Ti1.7Al0.3(PO4)2.9(VO4)0.1 ceramics. J. Phys. Chem. Solids 2011, 72, 613–619. [Google Scholar] [CrossRef]
  17. Schroeder, M.; Glatthaar, S.; Binder, J.R. Influence of spray granulation on the properties of wet chemically synthesized Li1.3Ti1.7Al0.3(PO4)3 (LATP) powders. Solid State Ion. 2011, 201, 49–53. [Google Scholar] [CrossRef]
  18. Catti, M.; Ghaani, M.R. On the lithiation reaction of niobium oxide: Structural and electronic properties of Li1.714Nb2O5. Phys. Chem. Chem. Phys. 2014, 16. [Google Scholar] [CrossRef] [Green Version]
  19. Liu, Y.; Sun, Q.; Wang, D.; Adair, K.; Liang, J.; Sun, X. Development of the cold sintering process and its application in solid-state lithium batteries. J. Power Sources 2018, 393, 193–203. [Google Scholar] [CrossRef]
  20. Waetzig, K.; Rost, A.; Langklotz, U.; Matthey, B.; Schilm, J. An explanation of the microcrack formation in Li1.3Al0.3Ti1.7(PO4)3 ceramics. J. Eur. Ceram. Soc. 2016, 36, 1995–2001. [Google Scholar] [CrossRef]
  21. Cretin, M.; Fabry, P.; Abello, L. Study of Li1+xAlxTi2-x(PO4)3 for Li+ potentiometric sensors. J. Eur. Ceram. Soc. 1995, 15, 1149–1156. [Google Scholar] [CrossRef]
  22. Wang, G.X.; Bradhurst, D.H.; Dou, S.X.; Liu, H.K. LiTi2(PO4)3 with NASICON-type structure as lithium-storage materials. J. Power Sources 2003, 124, 231–236. [Google Scholar] [CrossRef]
  23. Zhao, E.; Ma, F.; Jin, Y.; Kanamura, K. Pechini synthesis of high ionic conductivity Li1.3Al0.3Ti1.7(PO4)3 solid electrolytes: The effect of dispersant. J. Alloys Compd. 2016, 680, 646–653. [Google Scholar] [CrossRef]
  24. Sakka, S. Handbook of Sol-Gel Science and Technology: Processing, Characterization and Applications. Applications of Sol-Gel Technology; Kluwer Academic Publishers: Boston, MA, USA, 2005; ISBN 9781402079689. [Google Scholar]
  25. Ejehi, F.; Marashi, S.P.H.; Ghaani, M.R.; Haghshenas, D.F. The synthesis of NaSICON-type ZrNb(PO4)3 structure by the use of Pechini method. Ceram. Int. 2012, 38. [Google Scholar] [CrossRef]
  26. Rahimi-Nasrabadi, M.; Ahmadi, F.; Eghbali-Arani, M. Simple morphology-controlled fabrication of CdTiO3 nanoparticles with the aid of different capping agents. J. Mater. Sci. Mater. Electron. 2016, 27, 13294–13299. [Google Scholar] [CrossRef]
  27. Yang, E.; Moon, D.J. Synthesis of LaNiO3 perovskite using an EDTA-cellulose method and comparison with the conventional Pechini method: Application to steam CO2 reforming of methane. RSC Adv. 2016, 6, 112885–112898. [Google Scholar] [CrossRef]
  28. Chrunik, M.; Majchrowski, A.; Zasada, D.; Chlanda, A.; Szala, M.; Salerno, M. Modified Pechini synthesis of Bi2ZnB2O7 nanoparticles. J. Alloys Compd. 2017, 725, 587–597. [Google Scholar] [CrossRef]
  29. Ranjeh, M.; Masjedi-Arani, M.; Salavati-Niasari, M.; Moayedi, H. EDTA-modified sol-gel synthesis of monoclinic Li2MnO3 nanoparticles as an effective photocatalyst for degradation of organic dyes. J. Mol. Liq. 2020, 300, 112292. [Google Scholar] [CrossRef]
  30. Lin, H.B.; Zhang, Y.M.; Hu, J.N.; Wang, Y.T.; Xing, L.D.; Xu, M.Q.; Li, X.P.; Li, W.S. LiNi0.5Mn1.5O4 nanoparticles: Synthesis with synergistic effect of polyvinylpyrrolidone and ethylene glycol and performance as cathode of lithium ion battery. J. Power Sources 2014, 257, 37–44. [Google Scholar] [CrossRef]
  31. Jin, S.; Choi, W.S.; Baek, S.-W.; Shin, T.H.; Park, J.-Y.; Kim, J.H. Electrochemical properties of electrospinning-fabricated layered perovskite used in cathode materials for a low temperature-operating solid oxide fuel cell. Thin Solid Film. 2018, 660, 663–671. [Google Scholar] [CrossRef]
  32. Addonizio, M.L.; Aronne, A.; Imparato, C. Amorphous hybrid TiO2 thin films: The role of organic ligands and UV irradiation. Appl. Surf. Sci. 2020, 502, 144095. [Google Scholar] [CrossRef]
  33. Cai, W.; Yang, Y.; Zhu, Y.; Li, D.; Xu, C. Preparation of high laser-induced damage threshold sol-gel Nb2O5 films with different additives. Optik 2020, 206, 164306. [Google Scholar] [CrossRef]
  34. Ozturk, B.; Soylu, G.S.P. Preparation of surfactant-modified ZnTiO3–TiO2 nanostructures and their photocatalytic properties under sunlight irradiation. J. Sol-Gel Sci. Technol. 2017, 81, 226–235. [Google Scholar] [CrossRef]
  35. Mazlan, N.A.; Osman, N.; Md Jani, A.M.; Yaakob, M.H. Role of ionic and nonionic surfactant on the phase formation and morphology of Ba(Ce,Zr)O3 solid solution. J. Sol-Gel Sci. Technol. 2016, 78, 50–59. [Google Scholar] [CrossRef]
  36. Sletnes, M.; Skjærvø, S.L.; Lindgren, M.; Grande, T.; Einarsrud, M.-A. Luminescent Eu3+-doped NaLa(WO4)(MoO4) and Ba2CaMoO6 prepared by the modified Pechini method. J. Sol-Gel Sci. Technol. 2016, 77, 136–144. [Google Scholar] [CrossRef] [Green Version]
  37. Chen, M.-L.; Xu, Z.; Zhou, Z.-H. Conversions of monomeric, dimeric and tetrameric lanthanum and samarium citrates with ethylenediaminetetraacetates in aqueous solutions. Polyhedron 2018, 153, 213–217. [Google Scholar] [CrossRef]
  38. Amar, I.A.; Petit, C.T.G.; Lan, R.; Mann, G.; Tao, S. Electrochemical synthesis of ammonia from wet nitrogen using La 0.6 Sr 0.4 FeO 3−δ –Ce 0.8 Gd 0.18 Ca 0.02 O 2−δ composite cathode. RSC Adv. 2014, 4, 18749–18754. [Google Scholar] [CrossRef]
  39. Amar, I.A.; Lan, R.; Tao, S. Electrochemical Synthesis of Ammonia Directly from Wet N 2 Using La 0.6 Sr 0.4 Fe 0.8 Cu 0.2 O 3- δ -Ce 0.8 Gd 0.18 Ca 0.02 O 2- δ Composite Catalyst. J. Electrochem. Soc. 2014, 161, H350–H354. [Google Scholar] [CrossRef]
  40. Amar, I.A.; Petit, C.T.G.; Mann, G.; Lan, R.; Skabara, P.J.; Tao, S. Electrochemical synthesis of ammonia from N2 and H2O based on (Li,Na,K)2CO3–Ce0.8Gd0.18Ca0.02O2−δ composite electrolyte and CoFe2O4 cathode. Int. J. Hydrogen Energy 2014, 39, 4322–4330. [Google Scholar] [CrossRef] [Green Version]
  41. Amar, I.A.; Lan, R.; Tao, S. Synthesis of ammonia directly from wet nitrogen using a redox stable La 0.75 Sr 0.25 Cr 0.5 Fe 0.5 O 3−δ –Ce 0.8 Gd 0.18 Ca 0.02 O 2−δ composite cathode. RSC Adv. 2015, 5, 38977–38983. [Google Scholar] [CrossRef] [Green Version]
  42. Zhang, C.; Zheng, Y.; Lin, Y.; Ran, R.; Shao, Z.; Farrusseng, D. A comparative study of La0.8Sr0.2MnO3 and La0.8Sr0.2Sc0.1Mn0.9O3 as cathode materials of single-chamber SOFCs operating on a methane–air mixture. J. Power Sources 2009, 191, 225–232. [Google Scholar] [CrossRef]
  43. Tseng, C.-J.; Chang, J.-K.; Lee, K.-R.; Hung, I.-M.; Lin, J.-C.; Jang, S.-C.; Lee, S.-W. Potassium doping optimization in proton-conducting Ba1-xKxCe0.6Zr0.2Y0.2O3-δ oxides for fuel cell applications. J. Alloys Compd. 2017, 696, 251–256. [Google Scholar] [CrossRef]
  44. Fares, A.; Barama, A.; Barama, S.; FodilCherif, N.; Chelaghmia, M.L. Synthesis and Characterization of Ba 0.5 Sr 0.5 Ni x Co 0.8-x Fe 0.2 O 3-δ (x = 0 and 0.2) Perovskites as Electro-catalysts for Methanol Oxidation in Alkaline Media. Electroanalysis 2017, 29, 2323–2331. [Google Scholar] [CrossRef]
  45. Bonturim, E.; Mazzocchi, V.L.; Parente, C.B.R.; Mestnik-Filho, J.; de Lima, N.B.; Seo, E.S.M. Oxygen stoichiometry of Ba0.50Sr0.50Co0.80Fe0.20O3−δ obtained by EDTA–citrate method and measured by X-ray and neutron diffraction. J. Radioanal. Nucl. Chem. 2015, 306, 769–773. [Google Scholar] [CrossRef]
  46. Tseng, C.-J.; Chang, J.-K.; Hung, I.-M.; Lee, K.-R.; Lee, S.-W. BaZr0.2Ce0.8−xYxO3−δ solid oxide fuel cell electrolyte synthesized by sol–gel combined with composition-exchange method. Int. J. Hydrogen Energy 2014, 39, 14434–14440. [Google Scholar] [CrossRef]
  47. Jahanbakhshi, M. Mesoporous carbon foam, synthesized via modified Pechini method, in a new dispersant of Salep as a novel substrate for electroanalytical determination of epinephrine in the presence of uric acid. Mater. Sci. Eng. C 2017, 70, 544–551. [Google Scholar] [CrossRef]
  48. Lu, X.; Wang, T.; Qi, Y. Crystalline characteristics and superconducting properties of Bi2212 thin films by Pechini sol–gel method: Effect of heating rate on the film growth. J. Sol-Gel Sci. Technol. 2016, 77, 100–108. [Google Scholar] [CrossRef]
  49. Chaput, F.; Boilot, J.-P.; Beauger, A. Alkoxide-Hydroxide Route to Syntheltize BaTiO3-Based Powders. J. Am. Ceram. Soc. 1990, 73, 942–948. [Google Scholar] [CrossRef]
  50. Fang, T.-T.; Wu, M.-S.; Tsai, J.-D. 13C NMR Study of the Solution Chemistry of Barium Titanium Citrate Gels Prepared Using the Pechini Process. J. Am. Ceram. Soc. 2004, 85, 2984–2988. [Google Scholar] [CrossRef]
  51. Mashreghi, A.; Ghasemi, M. Investigating the effect of molar ratio between TiO2 nanoparticles and titanium alkoxide in Pechini based TiO2 paste on photovoltaic performance of dye-sensitized solar cells. Renew. Energy 2015, 75, 481–488. [Google Scholar] [CrossRef]
  52. Kakihana, M.; Tada, M.; Shiro, M.; Petrykin, V.; Osada, M.; Nakamura, Y. Structure and Stability of Water Soluble (NH4) 8 [Ti4 (C6H4O7) 4 (O2) 4]·8H2O. Inorg. Chem. 2001, 40, 891–894. [Google Scholar] [CrossRef]
  53. Akbarzadeh, R.; Jen, T.-C.; Asadi, A.; Ozaveshe Oviroh, P. Titanate based photocatalysts for climate-efficient water treatment. Energy Procedia 2019, 158, 4536–4541. [Google Scholar] [CrossRef]
  54. Pant, B.; Park, M.; Park, S.J. Recent Advances in TiO2 Films Prepared by Sol-gel Methods for Photocatalytic Degradation of Organic Pollutants and Antibacterial Activities. Coatings 2019, 9, 613. [Google Scholar] [CrossRef] [Green Version]
  55. Ghaani, M.R.; Marashi, P. L16 Orthogonal Design Synthesis of NASICON-type Li1.4Al0.4Ti1.6(PO4)3 Solid Electrolyte by Pechini Method for Process Optimization. Iran. J. Mater. Sci. Eng. 2018, 15, 60–71. [Google Scholar]
  56. Takle, S.P.; Apine, O.A.; Ambekar, J.D.; Landge, S.L.; Bhujbal, N.N.; Kale, B.B.; Sonawane, R.S. Solar-light-active mesoporous Cr–TiO 2 for photodegradation of spent wash: An in-depth study using QTOF LC-MS. RSC Adv. 2019, 9, 4226–4238. [Google Scholar] [CrossRef] [Green Version]
  57. Schwarzenbach, G.; Muehlebach, J.; Mueller, K. Peroxo complexes of titanium. Inorg. Chem. 1970, 9, 2381–2390. [Google Scholar] [CrossRef]
  58. Rohe, M.; Merz, K. Active peroxo titanium complexes: Syntheses, characterization and their potential in the photooxidation of 2-propanol. Chem. Commun. 2008, 862–864. [Google Scholar] [CrossRef]
  59. Zhou, D.; Huang, G.; Chen, X.; Xu, J.; Gong, S. Synthesis of LaAlO3 via ethylenediaminetetraacetic acid precursor. Mater. Chem. Phys. 2004, 84, 33–36. [Google Scholar] [CrossRef]
  60. Sumathi, R.; Johnson, K.; Viswanathan, B.; Varadarajan, T.K. Selective oxidation and dehydrogenation of benzyl alcohol on ABB′O3 (A = Ba, B = Pb, Ce, Ti and B′ = Bi, Cu, Sb)-type perovskite oxides-temperature programmed reduction studies. Appl. Catal. A Gen. 1998, 172, 15–22. [Google Scholar] [CrossRef]
  61. Luo, L.; Ouyang, Y.; Lu, X.; Lu, X.; Chen, Q. The Effects of Rare Earths on Activity and Surface Properties of Ru/Γ-Al2o3 Catalyst for Water Gas Shift Reaction. Bull. Chem. Soc. Ethiop. 2007, 21. [Google Scholar] [CrossRef]
  62. McMurry, J. Organic Chemistry. Cengage Learning: Hampshire, UK, 2015; ISBN 9781305084445. [Google Scholar]
  63. Toby, B.H. EXPGUI, a graphical user interface for GSAS. J. Appl. Crystallogr. 2001, 34, 210–213. [Google Scholar] [CrossRef] [Green Version]
  64. Noguchi, Y.; Kobayashi, E.; Plashnitsa, L.S.; Okada, S.; Yamaki, J. Fabrication and performances of all solid-state symmetric sodium battery based on NASICON-related compounds. Electrochim. Acta 2013, 101, 59–65. [Google Scholar] [CrossRef]
  65. Ahmad, A.; Wheat, T.; Kuriakose, A.; Canaday, J.; Mcdonald, A. Dependence of the properties of Nasicons on their composition and processing. Solid State Ion. 1987, 24, 89–97. [Google Scholar] [CrossRef]
Figure 1. The flowchart of the synthesis process of LATP disk.
Batteries 06 00048 g001
Figure 2. STA-measured graphs for dried LATP gels prepared using citric acid (A) and EDTA (B) complexing agent (C). The first derivative of the TG curve was calculated for two dried gel prepared by different synthesis routes. Lower reaction temperatures and eliminated mass loss at high temperatures can be seen in the case of EDTA-assisted gel.
Batteries 06 00048 g002
Figure 3. The phase evolution during the thermal process of the EDTA-assisted gel at three different temperatures. Higher temperature treatment can cause a higher level of crystallization without any influence on the phase composition of the sample. A diffraction pattern of the CA-assisted gel at 300 °C was also added for comparison.
Batteries 06 00048 g003
Figure 4. Recorded XRD patterns obtained from the sol–gel prepared samples with two different complexing agents treated at 1100 °C. The diffraction peaks of the EDTA-assisted sample are considerably broader with respect to the CA-assisted product peaks.
Batteries 06 00048 g004
Figure 5. A typical recorded Nyquist plot for CA-assisted (a) and EDTA-assisted (b) compounds along with the simulated curve using the presented equivalent circuit.
Batteries 06 00048 g005
Figure 6. SEM micrograph of citric acid-assisted powder (a), EDTA-assisted powder (b), citric acid-assisted disk surface (c), and EDTA-assisted disk surface (d) treated at 1100 °C for 3 h.
Batteries 06 00048 g006
Table 1. The calculated lattice parameters from the Le-bail fitted XRD patterns obtained from the sol–gel prepared samples with two different complexing agents.
Complexing AgentA (Å)C (Å)Volume (Å3)Crystallite Size (nm)
EDTA8.5017 (7)20.877 (4)1306.8 (2)34
CA8.4991 (5)20.778 (3)1299.8 (2)102
Table 2. Extracted conductivity values from EIS measurements for EDTA- and CA-assisted synthesized disks. The standard deviations of three independent measurements are presented in parentheses.
Complexing Agentσtotal (S·cm−1)σb (S·cm−1)σgb (S·cm−1)
CA(2.1 ± 0.2) × 10−5(5.13 ± 0.05) × 10−5(3.7 ± 0.2) × 10−5
EDTA(0.6 ± 0.3) × 10−5(3.72 ± 0.06) × 10−5(0.6 ± 0.3) × 10−5

