Key Figure Based Incoming Inspection of Lithium-Ion Battery Cells
by
 , and
, and
Kerstin Ryll
1,2,*, 
Louisa Hoffmann
1,2,
Oliver Landrath
1,2,
Frank Lienesch
2,3 and
Michael Kurrat
1,2 1
elenia Institute for High Voltage Technology and Power Systems, Technische Universität Braunschweig, Schleinitzstraße 23, 38106 Braunschweig, Germany
2
Battery LabFactory Braunschweig, Technische Universität Braunschweig, Langer Kamp 19, 38106 Braunschweig, Germany
3
Physikalisch-Technische Bundesanstalt, National Metrology Institute of Germany, Bundesallee 100, 38116 Braunschweig, Germany
*
Author to whom correspondence should be addressed.
Batteries 2021, 7(1), 9; https://0-doi-org.brum.beds.ac.uk/10.3390/batteries7010009
Submission received: 5 November 2020
/
Revised: 15 January 2021
/
Accepted: 20 January 2021
/
Published: 26 January 2021
(This article belongs to the Special Issue Lithium-Ion Batteries: Latest Advances and Prospects II)
Abstract
:The cell characterization in the incoming inspection is an important but time and cost intensive process step. In order to obtain reliable parameters to evaluate and classify the cells, it is essential to design the test procedures in such a way that the parameters derived from the data allow the required statements about the cells. Before the focus is placed on the evaluation of cell properties, it is therefore necessary to design the test procedures appropriately. In the scope of the investigations two differently designed incoming inspection routines were carried out on 230 commercial lithium-ion battery cells (LIBs) with the aim of deriving recommendations for optimal test procedures. The derived parameters of the test strategies were compared and statistically evaluated. Subsequently, key figures for the classification were identified. As a conclusion, the capacity was confirmed as an already known important parameter and the average cell voltage was identified as a possibility to replace the usually used internal resistance. With regard to capacity, the integration of CV steps in the discharging processes enables the determination independently from the C-rate. For the average voltage cycles with high C-rates are particularly meaningful because of the significant higher scattering due to the overvoltage parts.
1. Introduction
Next to usages of lithium-ion batteries (LIBs) in smartphones, tablets and laptops, the increasing electrification of powertrains in passenger cars and commercial vehicles induces a growing demand of this battery cell technology [1]. In terms of other battery cell technologies in the market [2,3], LIBs stand out due to high specific energy density and good cycle stability, in addition to acceptable costs for mass production [1,4,5,6,7,8]. Especially, efficient mass production of large-format and high-quality LIBs forms the basis for successful electrical mobility [9]. Classification of these cells is necessary during the entire battery use phase, from production to second use. For example, qualitatively different cells influence the performance and aging behavior of an entire module [10]. In a parallel connection, balancing currents occur from good to bad cells, which accelerate the aging of the cells. At the same time, the overall performance of cells connected in series is only as good as the cell with inferior quality. In order to be able to characterize and classify the cells, it is necessary to create input controls reducing key figures, which allow a performance assessment. For that purpose, it is important to work out which part should be included in the input control and how the test procedures can be designed to maximize the significance of the obtained data. The capacity test [11,12,13,14], impedance spectroscopy, open-circuit voltage (OCV) measurement [11,13,14,15] and ohmic resistance measurement [11,14] are the usual methods for characterizing LIBs in this context. Furthermore, Jossen and Korthauer [11] state that the efficiency factor with regard to the capacity or energy and resistance measurements with constant frequency are the ways to estimate batteries. In addition, non-invasive measurements such as high current and temperature stress tests and invasive methods like chemical characterization after a cell opening are applied. These include scanning electron microscopic measurements and spectroscopic methods such as inductively coupled plasma mass and X-ray photoelectron spectrometry [12]. Beside X-ray photoelectron spectrometry, conclusions can also be drawn from X-ray tomography [13]. Beyond that, there are many research approaches to evaluate the performance of LIBs using differential capacity or voltage analysis [13,14,16,17]. Deeper considerations of the cell-internal processes can be gained from the equivalent circuit diagram fitting and dispersion of relaxation times [14]. Furthermore, there are investigations concerning the current pulse response of LIBs. To evaluate thermal performance, cell temperature is surveyed versus impedance, dynamic thermal performances and reaction entropy [15].
For incoming goods testing, the various characterization methods can be limited to non-invasive methods. Nevertheless, it is rarely published how to design test procedures for the incoming inspection concretely and which key figures can be used for a classification. Liao et al. present a classification of second use batteries on the basis of the outside appearance, the capacity, the voltage drop during high discharge rate, the charge transfer resistance and the diffusion coefficient. The ohmic resistance does not correlate with the capacity. However, it is illustrated a moderate negative correlation between charge transfer resistance and capacity and a significant positive correlation between diffusion coefficient and capacity [18].
Westerhoff describes two test routines for the incoming inspection. The short test version consisting of an OCV- and an electrochemical impedance spectroscopy measurement do not suffice to estimate the quality of the batteries because reversible aging effects lead to strong dispersions of the impedance spectra. A longer quality test, which consists essentially of a capacity test, pseudo OCV measurement, C-rates test, ohmic resistance measurement, impedance spectroscopy and cyclization (regeneration phase) reduces the dispersions caused by reversible aging effects. It is pointed out that key figures of cycles with high C-rate are attributed to quality differences between the LIBs [14]. Wolter et al. present cell quality monitoring based on the results of formation data and end of line testing [19]. The capacity and the efficiency of the first cycles during formation and the internal resistances from a high C-Rate discharge step are identified as important parameters.
To summarize, in the current research landscape, no quick incoming inspection is available and the information about the design of test procedures is scarce. For this reason, in the scope of this work two different test routines in the incoming inspection are carried out on almost 230 commercial cells. First, the electrochemical performance of the cells in the test strategies is statistically evaluated. Subsequently, key performance indicators are identified and cell classification is carried out. On this basis, the tests are compared with each other and recommendations for the design of test routines are derived.
2. Materials and Methods
The details of the cells and the test environment and the test schemes of the incoming inspection and the methodology for evaluating the results were the subject of this chapter.
2.1. Cells and the Professional Test Environment
For all presented investigations 229 5 Ah pouch cells of the company Kokam Co. Ltd. (Siheung, Korea) from the product series the superior lithium polymer battery (SLPB) were used (Model number SLPB50106100) [20]. The cells consist of the cathode side of nickel-manganese-cobalt (NMC) and on the anode side of graphite and are declared as high energy cells by the manufacturer. The dimensions of the cells are indicated with 102 mm (length, except for tab length) × 107 mm (width) with a maximum thickness of 5.9 mm in the fully charged condition. The delivery of the cells was made by air freight on a State of Charge (SoC) level of about 30%.
The cells belong all to one batch. The use of a single batch offers the advantage that differences between the cells can only be shown by sensitive parameters. Assuming that the cells in the batch have already been grouped together by the cell manufacturer in such a way that the cells are close together in their nominal parameters, differences between the cells only become apparent when sensitive parameters are considered.
The measurements for all cells were recorded on the same battery tester (XCTS 25A, Basytec Inc., Asselfingen, Germany) in combination with a temperature test chamber (KB 420, WKM Inc., Lachendorf, Germany) to ensure constant ambient conditions. The performed tests required high safety environments. Therefore, the climate chambers had a fire extinguishing system (Wagner Inc., Langenhagen, Germany). In case of an accident, the climate chamber would have been flooded with nitrogen gas. Furthermore, an activated carbon filter (Stöbich Technology Inc., Goslar, Germany) in the pipe fairlead filtered the outgoing air.
The battery tester recorded continuous measurement data in terms of voltage, current, time and temperature. The temperature was measured by a temperature sensor in the middle of the cell surface. Thus, the temperature was mainly used for the safety detection of critical cell states and represented a monitoring criterion to ensure safety. The measurement data for current, voltage and time were used to determine the parameters listed in Section 2.3. All measurements were carried out by a temperature of 20 °C and a full cycle was in the voltage range 2.7–4.2 V. Charging and discharging processes each include a constant current (CC) and constant voltage (CV) phase unless otherwise described. The termination criterion for CV phases of full cycles was 0.05C and for cycles which served to set a defined SoC of 1 h.
2.2. Test Scheme of the Incoming Inspection
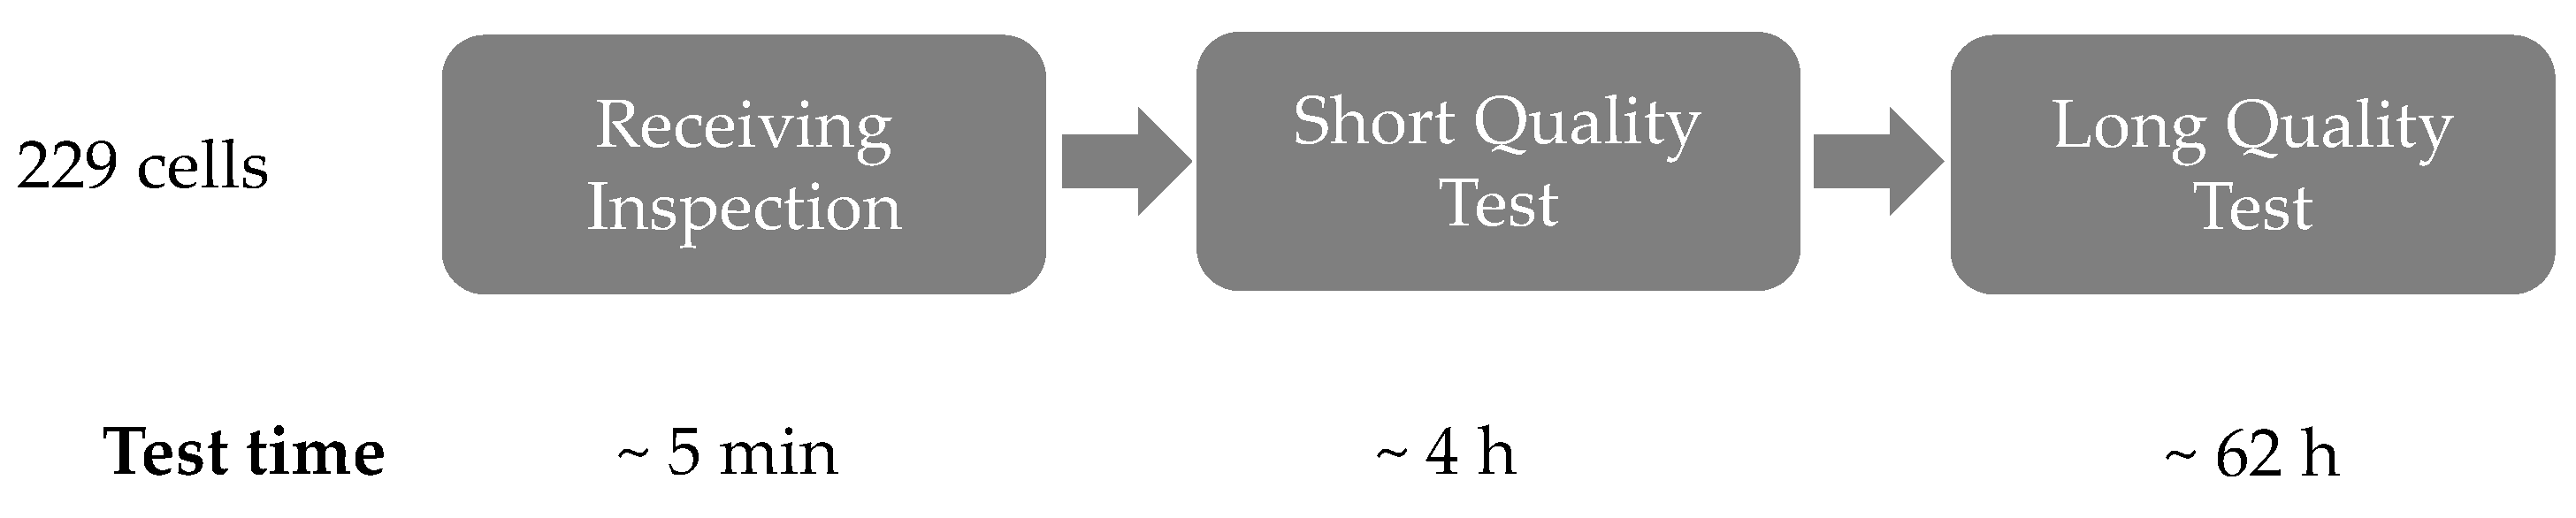
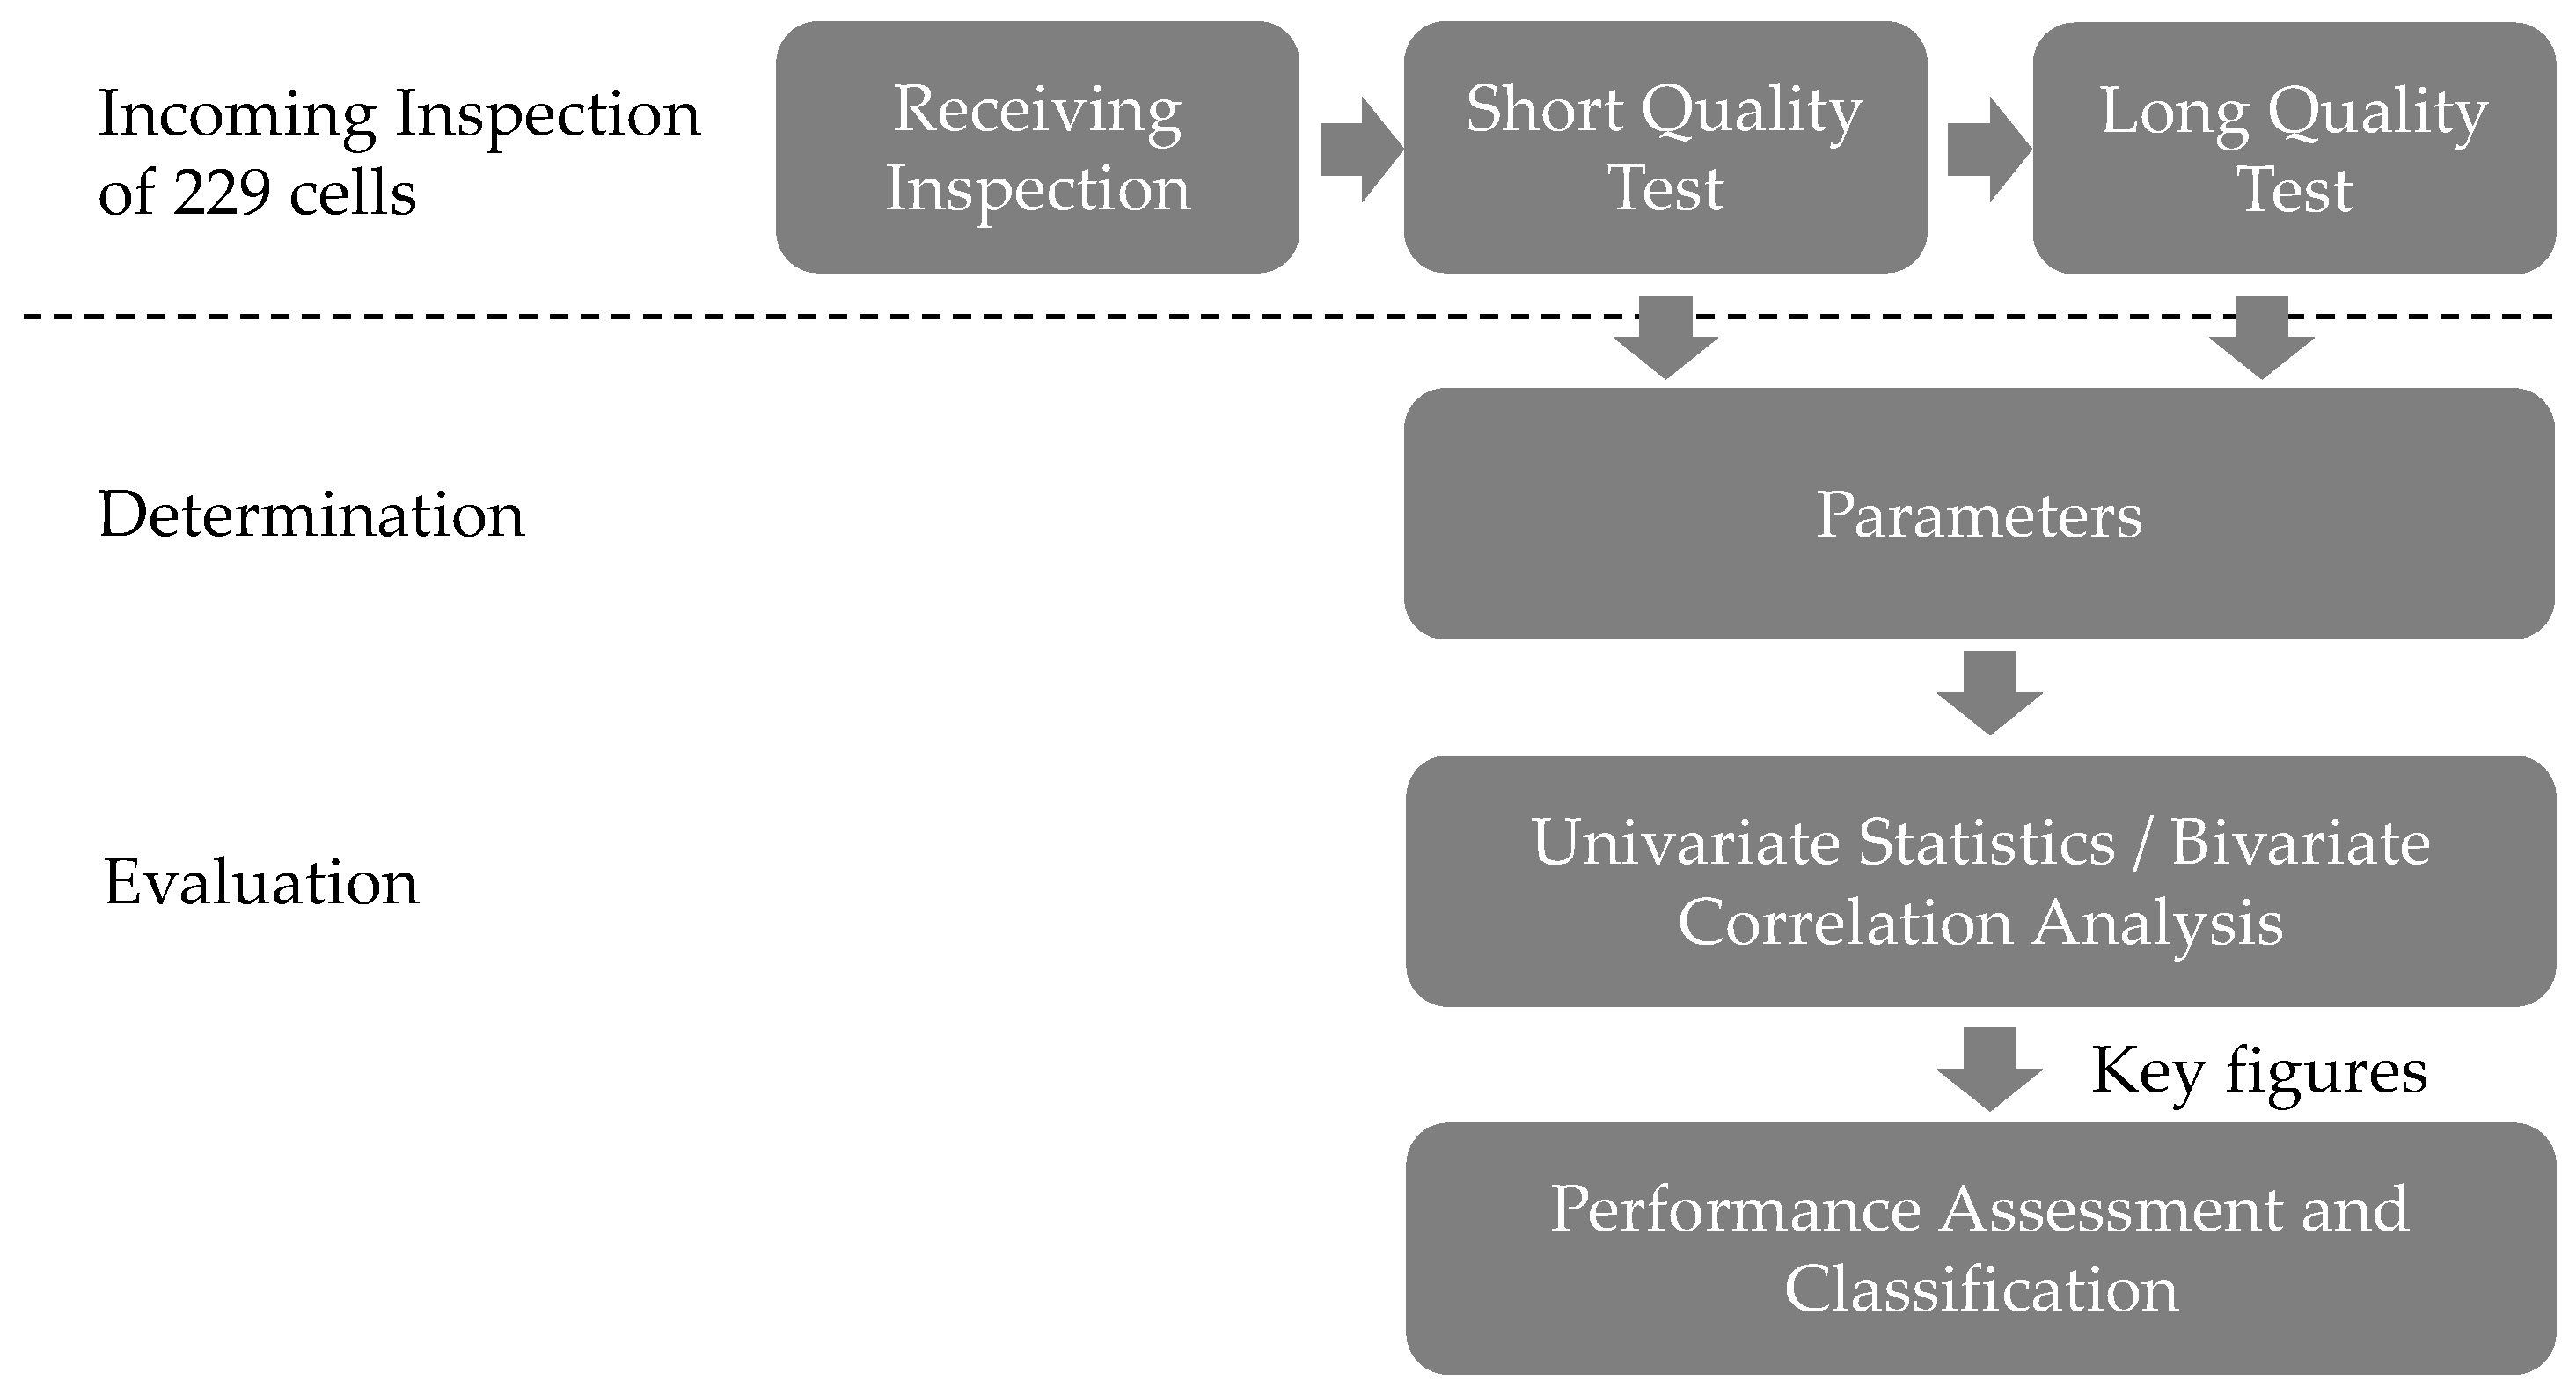
The test scheme of the incoming inspection consisted of three sections, which were passed through by all 229 cells in the same order. The procedure of the incoming inspection is shown schematically in Figure 1 and was designed based on the results of Westerhoff, see [14].
In the first step, the outer condition of the cells was examined and a weight and voltage check was carried out. This test section was referred to as receiving inspection and took about 5 min per cell. The purpose of this test section was to determine the general battery condition at the time of delivery.
After the receiving inspection, the cells passed through two different test strategies, starting with the short quality test (SQT). In the SQT the cells were tested according to the test schedule in Table 1, which consisted primarily of four steps. The first step was a discharge pulse of 10 s at 5C and served to determine the internal resistance. The following discharge step at 1C (C0.1) served to preset the SoC at 0% for the subsequent capacity test (C1), which was carried out by 1C (charge) and 5C (discharge). The last step (C0.2) was to set the original SoC. The duration of the SQT was about 4 h per cell. The purpose of this test section was to provide a short test unit. Both absolute values for the description of cell properties and approaches for classification were considered using the short variant of the incoming inspection.
The SQT was followed by the long quality test (LQT) in which the cells were tested according to the test protocol in Table 2. The test started with a discharge step (C2) of 1C for presetting the SoC to 0% for the subsequent cycles. This was followed by five 1C–1C full cycles (C3–C7) in which the capacity was determined. The repetitions served to reduced possible reversible ageing effects, which might have occurred during the storage period. Afterwards the pseudo-OCV (C8) was measured at 0.1C–0.1C and the current rate dependent performance (C9–C11) was determined by three different discharge rates (0.5C, 3C and 5C). The maximum C-rate of 5C was based on the manufacturer’s specifications. Subsequently, the internal resistances (C12) were determined depending on the SoC and the C-rate. The SoC was set between 10% and 90% in 10% steps. Each defined SoC step was followed by a 30 s charge and discharge step at C-rates 0.5, 1, 3 and 5C with a relaxation time of 4 min between each pulse. The last step (C13) was to set the original SoC. Cycles C2–C7 are referred to as the regeneration phase, cycles C8-11 as the current rate dependent performance test section and cycles C12–C13 as the SoC dependent internal resistance determination.
The duration of the LQT was about 62 h per cell. Compared to the SQT, this variant represented a long version of an incoming inspection. As with the SQT, the absolute values and approaches for the classification of the cells were considered.
While the receiving inspection is a component of the incoming inspection, which should always be kept in stock, the SQT and LQT variants were to be understood as competing units. The investigations should show which test variant provides reliable information about the absolute values of cell properties and allows classification of the cells.
2.3. Parameter Determination and Evaluation
The measurement data from SQT and LQT were used to determine parameters that describe the cell properties. Basically, the components of the test procedures were divided into two categories—full cycles and current pulses. In the following the respective parameters were listed for both categories.
Up to 23 parameters were determined from each full cycle, depending on the charge/discharge conditions shown in Table 1 and Table 2. Table 3 summarizes the parameters that can be derived from a full cycle. The parameters were divided into the five categories average voltage, capacity, energy, time and efficiency. These are parameters that are widely and commonly used. For details on the parameters refer to [21,22,23,24]. The average voltage contains a single parameter. The categories capacity, energy and time each contain three parameters: a total value and partial values for CC and CV shares. The category efficiency evaluates the efficiency between the charging and the discharging step for the voltage, the capacity and the energy.
All parameters except those listed under the term efficiency were determined and from the charge and the discharge step. The parameters assigned to the efficiency were calculated using the values from charging and discharging. For the further designation of the parameters, it was specified that the appendix “_C” in the index of a parameter corresponded to values from the charge step and “_D” to values from the discharge step. In addition to the designation, the formula symbol and the formula, the table also indicates which characteristic value the parameter should ideally have. An arrow pointing upwards indicates that the parameter should have the highest possible value, while the arrow pointing downwards indicates that the value of the parameter should be as small as possible. For the average voltage the ideal level depends on the direction of the storage reaction. For charging processes the average voltage should be as low as possible because it is directly related to the unwanted overpotentials. Since the conditions in the discharging process are reversed, the average voltage during discharging should be as high as possible. For all other parameters it can be said in summary that those related to CV phases should be as small as possible. This also corresponds with the overpotentials. High overpotentials cause the cut-off voltage of charging and discharging to be reached earlier, thus terminating the CC phase. In the case of charging, this extends the charging time and in the case of discharging, it reduces the usable capacity for the user. For further details on the division of CC and CV phase refer to [24].
Table 4 shows the internal resistance as the most important parameter that can be determined from a current pulse. For details on how to determine the internal resistance from current pulses, refer to Westerhoff [14] and Dubarry et al. [25]. In general, the internal resistance is calculated from a voltage change with respect to a current change. Therefore, a relaxation phase is usually combined with a current pulse (charge or discharge). Unless otherwise specified, all internal resistances were determined based on the differences in the voltage and current between the last value of a preceding rest phase and the value after 1 s with current load applied. Ideally, the internal resistance should be as small as possible to have low overpotentials in the cells.
For the evaluation of the parameters regarding their significance, the parameters were analyzed under consideration of two aspects. The procedure is shown schematically in Figure 2. On the one hand, the absolute values and the corresponding scatter of the individual cycles and the development over the cycles were in focus. For this purpose, methods of univariate statistics were used especially the mean value and standard deviation and outlier identification. In addition, the dependencies between the parameters were examined by means of bivariate correlation analysis. The focus was on the statement that capacity and internal resistance did not correlate with each other (see [18]). It therefore could clarify the dependencies of the other parameters with these two key figures, verified the assumption about the ideal levels (see Table 3 and Table 4) and allowed the identification of parameters with the same or very similar significance like the two key figures.
On the other hand, the parameters were analyzed with respect to a classification of the cells. From the numerous possible parameters a few, the so-called key figures, were selected, taking into account the previous results of the univariate statistics and bivariate correlation analysis.
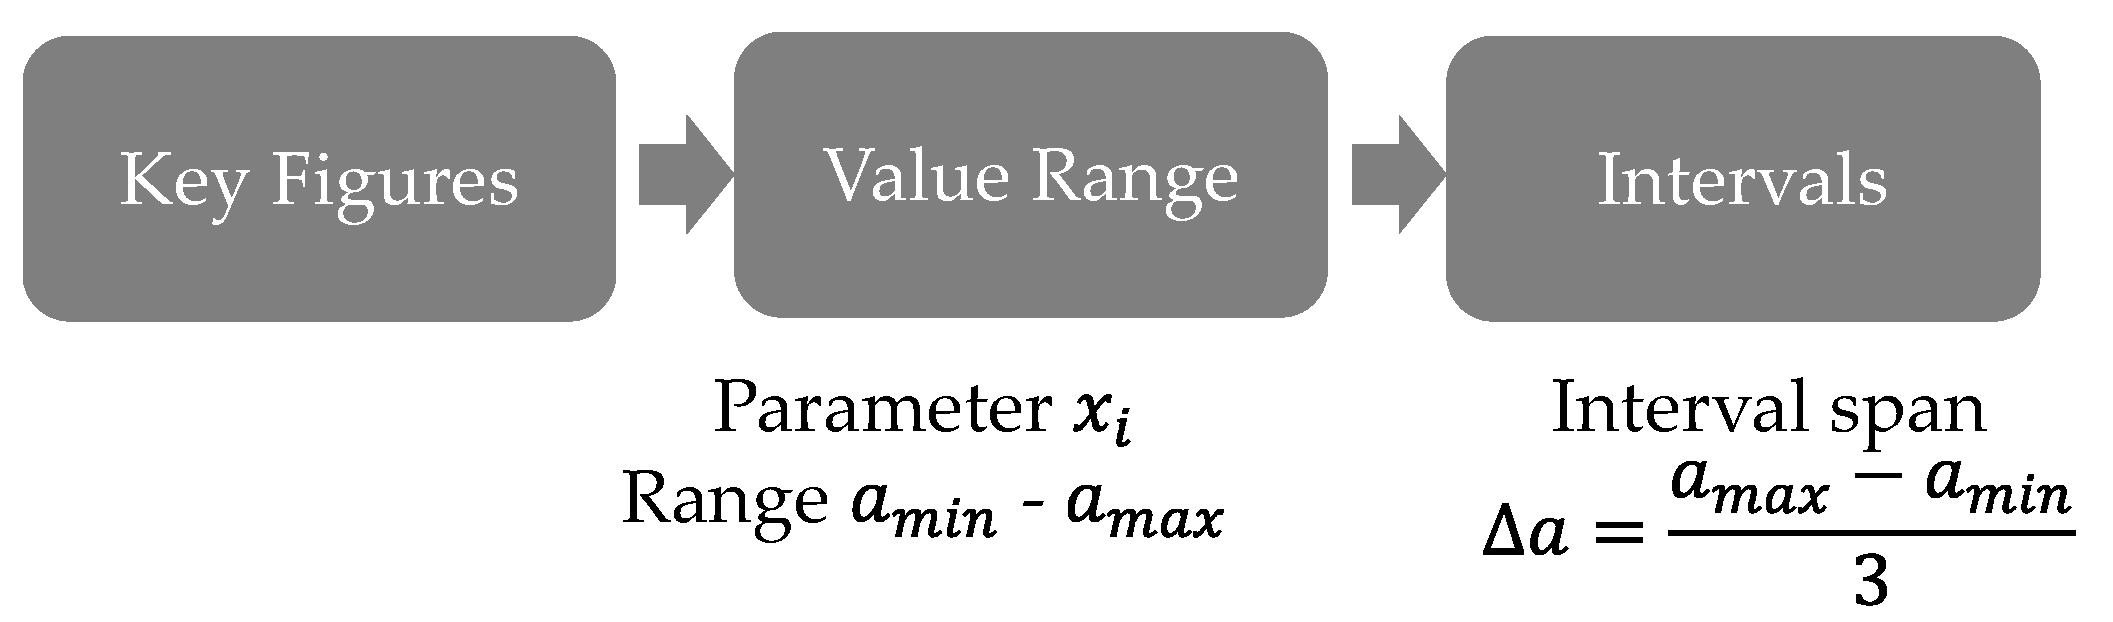
For the classification of cells the procedure shown in Figure 3 was followed. For each key figure the value range was determined by calculation of the span between the minimum and maximum value. Previously, outliers that exceeded 1.5 times the interquartile distance above the upper interquartile or below the lower interquartile were removed from the value range. Then the range of values was divided into three intervals.
The division of the value range into intervals was chosen based on the procedure from Westerhoff [14]. For the classification of the cells, Westerhoff had sorted the cells according to the characteristic values in ascending or descending order [14]. Each cell has thus been assigned a placement value. Since this procedure is susceptible to errors even between repeat measurements due to measurement uncertainty, a value range was defined here.
3. Results
In this section, the results are presented followed by their discussion in Section 4. For the general structure of the investigations performed in this study, Figure 1 from Section 2.3 can be referred.
The presentation of the results was divided into three sections. First, the results of the correlation analysis are shown. Second, the results of the performance assessment are considered. It is based on the key figures that were previously selected using the correlation analysis. The last section contains the results of the key figures in comparison between the two different test strategies.
3.1. Correlation of Parameters
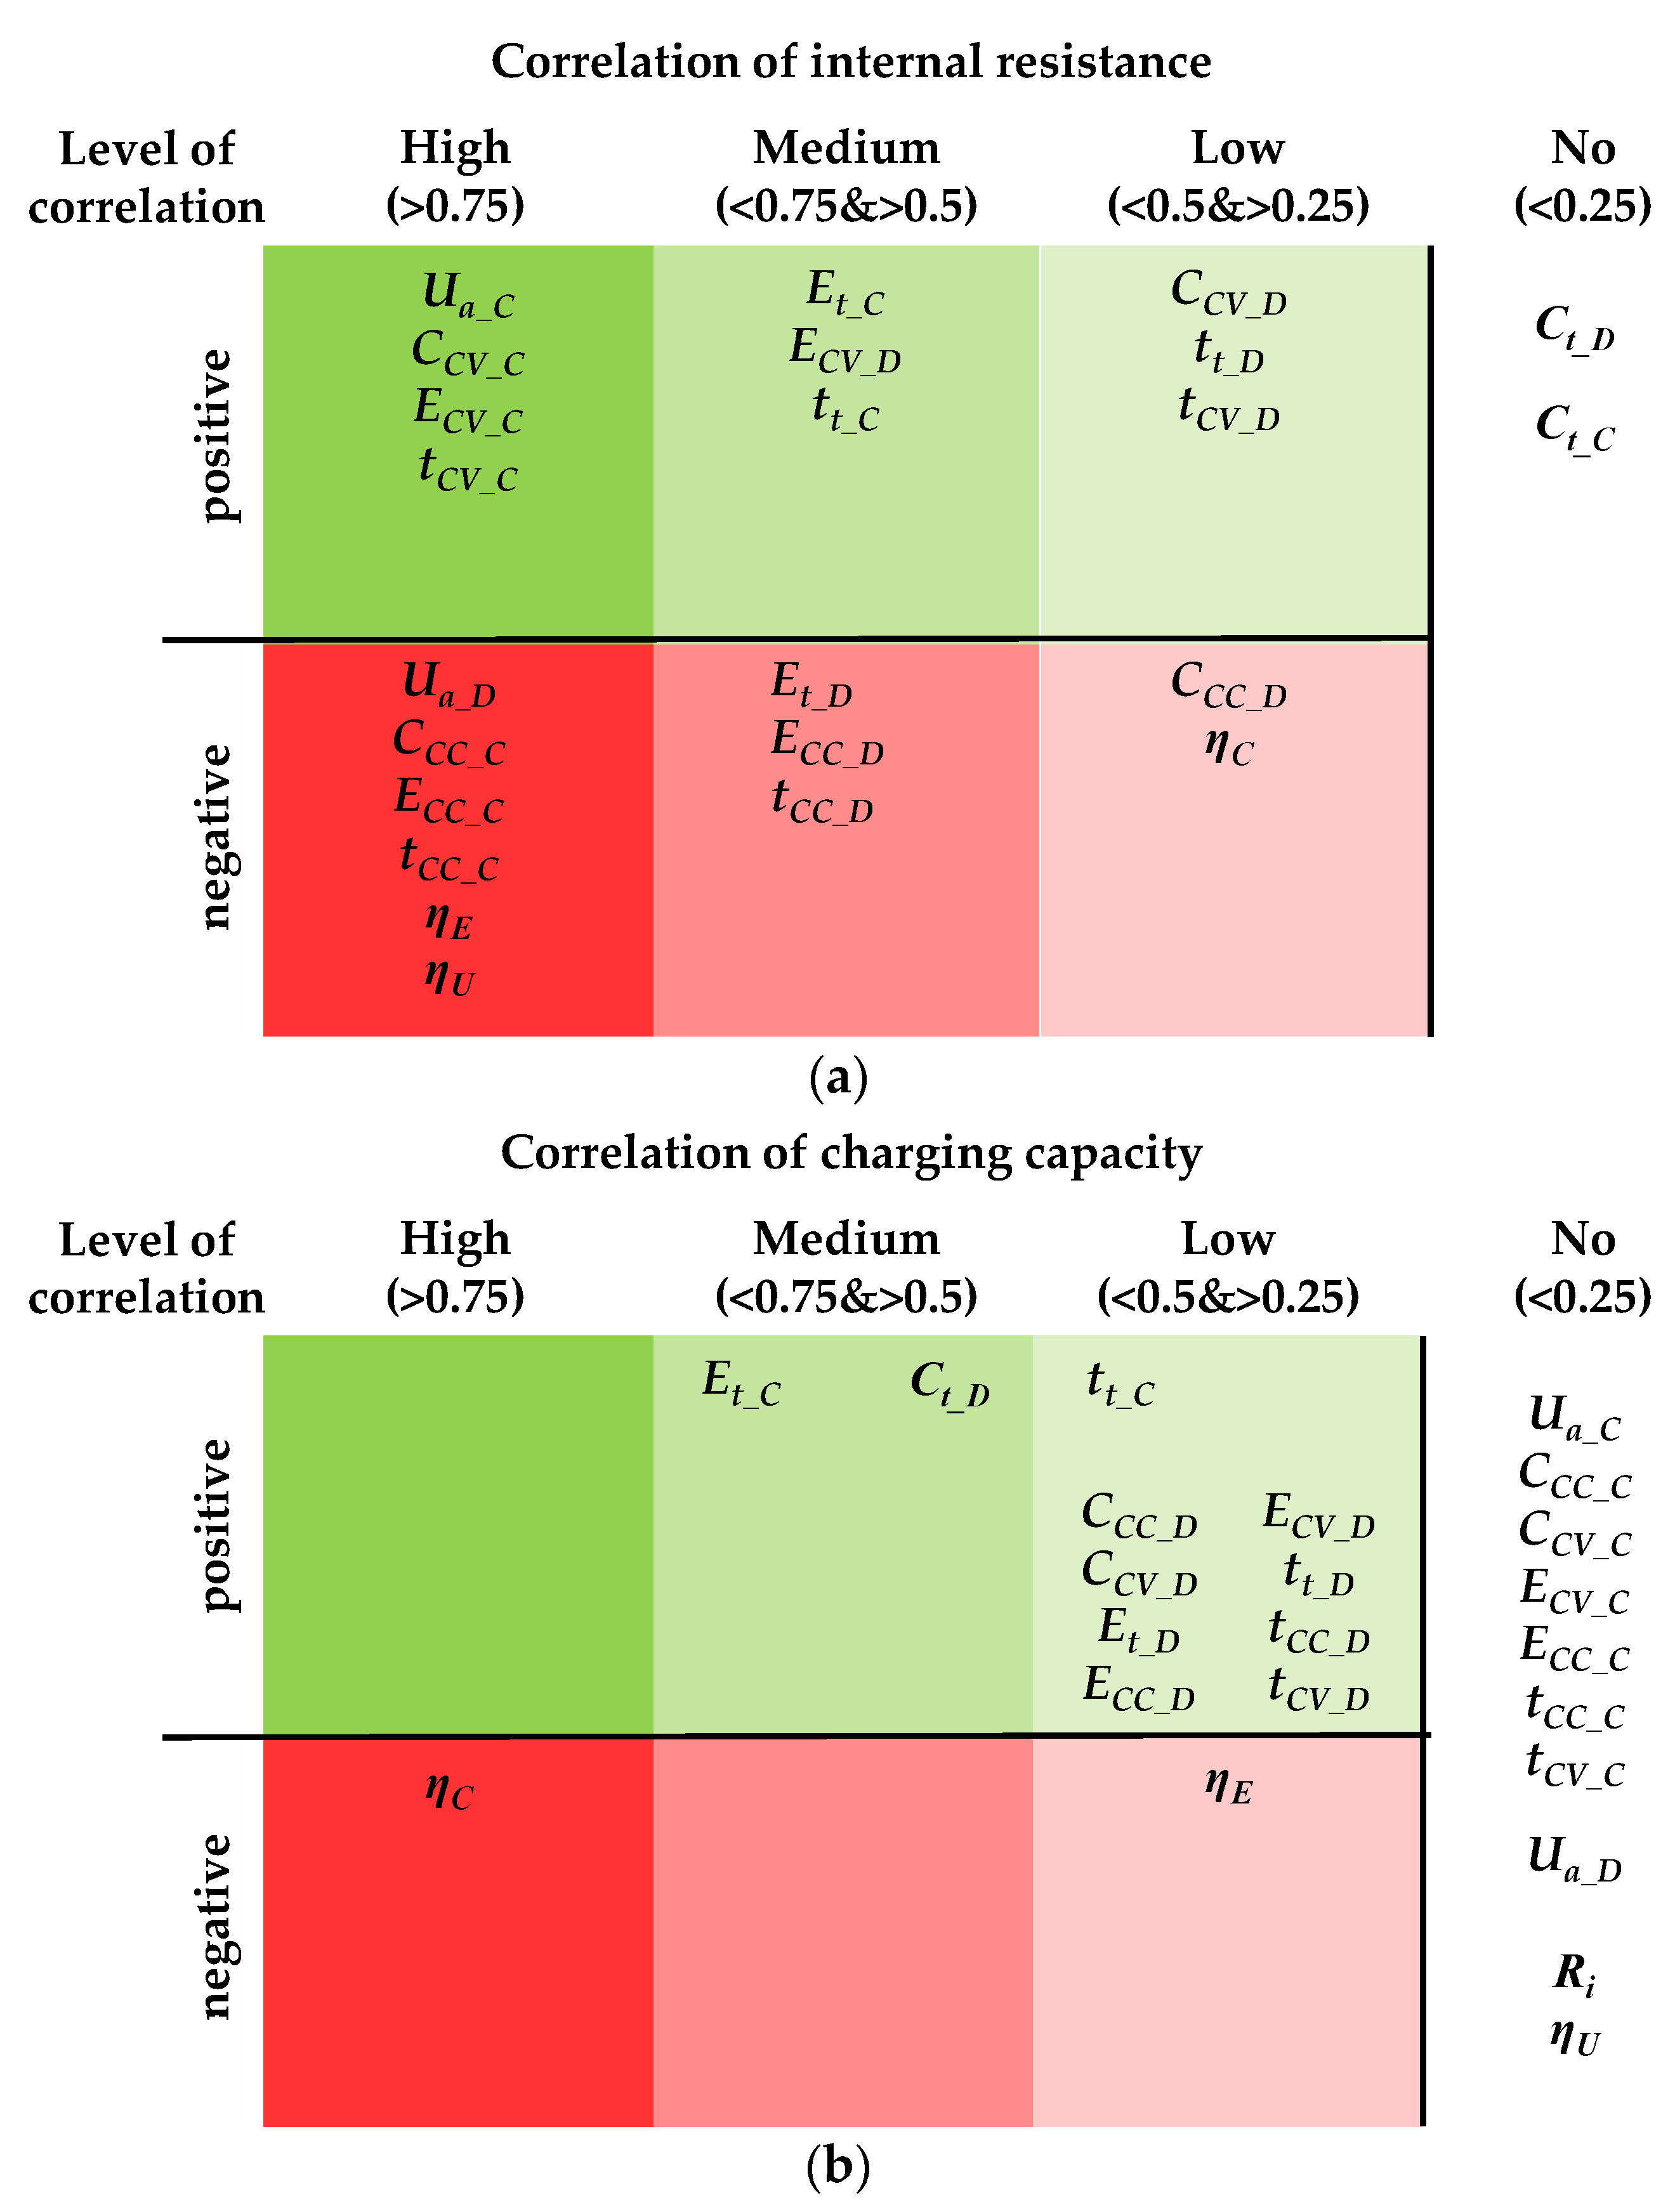
As described above (see Section 1), it is known that the internal resistance and the capacity did not correlate with each other. As these two parameters are still those that are most frequently used to evaluate cells, they were in focus here. In order to determine how the considered parameters from Table 3 and Table 4 (see Section 2.3) correlated with these two parameters and to determine the assumptions made about the ideal level of the parameters, a bivariate correlation analysis was carried out. The correlation analysis was performed with the preimplemented functions in MATLAB (The Mathworks Inc., Version R2019.b) using the statistics and machine learning toolbox. The results for the internal resistance and the total charging capacity are summarized in Figure 4.
In Figure 4a the correlation of the internal resistance with the other parameters are represented. High positive correlation can be revealed for the charging parameters regarding the average voltage Ua_C and the CV shares of capacity CCV_C, energy ECV_C and time tCV_C. The total charging energy Et_C and the total charging time tt_C correlate at a medium level with the internal resistance. In return, the CC shares CCC_C, ECC_C and tCC_C depend negatively on the internal resistance. For the discharging parameters, the results are less clear. There are medium and low positive correlations for the CV shares CCV_D, ECV_D and tCV_D, the total discharging energy Et_D and the total discharging time tt_D whereas medium and low negative correlations exist for the CC shares CCC_D, ECC_D and tCC_D. The average voltage of the discharging process Ua_D is the only key figure that correlates highly negatively with the internal resistance. The efficiencies of energy ηE and voltage ηU depend negatively on the internal resistance at a high level and the efficiency of the capacity ηC depends negatively at a low level. The total capacity of charging Ct_C and the total capacity of discharging Ct_D do not show any correlation tendencies with the internal resistance.
The correlation results of the charging capacity are shown in Figure 4b. The most important result is that only one high negative correlation with the efficiency of the capacity ηC could be identified. Furthermore, there are medium positive correlations with the total charging energy Et_C and the total discharging capacity Ct_D. Low positive correlations can be found for the total discharging energy Et_D and the total discharging time tt_D and for the CV and CC shares (capacity, energy and time) of the discharging process. There are no correlations for the average voltages Ua_D and Ua_D, the CC and CV shares of capacity, energy and time for the charging process, the internal resistance Ri and the efficiency of voltage ηU.
According to these results, the focus for the following performance assessment and classification is on a selection of the parameters, which will be referred to as key figures. The key figures are the total charging/discharging capacity on one side and the internal resistance on the other side. In addition to the internal resistance, the average voltage and the distribution of the capacity to the CC and CV phase are considered. Due to the strong correlation with the internal resistance, it is assumed that these allow a similar statement about the cell properties. In general, while the internal resistance mainly influences the kinetic properties of the cells, the total charging/discharging capacity characterizes the storage capacity of the cells. These key figures are therefore used to describe two cell properties that are almost completely independent of each other.
3.2. Key Figure Based Performance Assessment
The results of the performance assessment are divided into three parts according to the test scheme presented in Figure 1. Details are described in Section 2.2.
3.2.1. Receiving Inspection
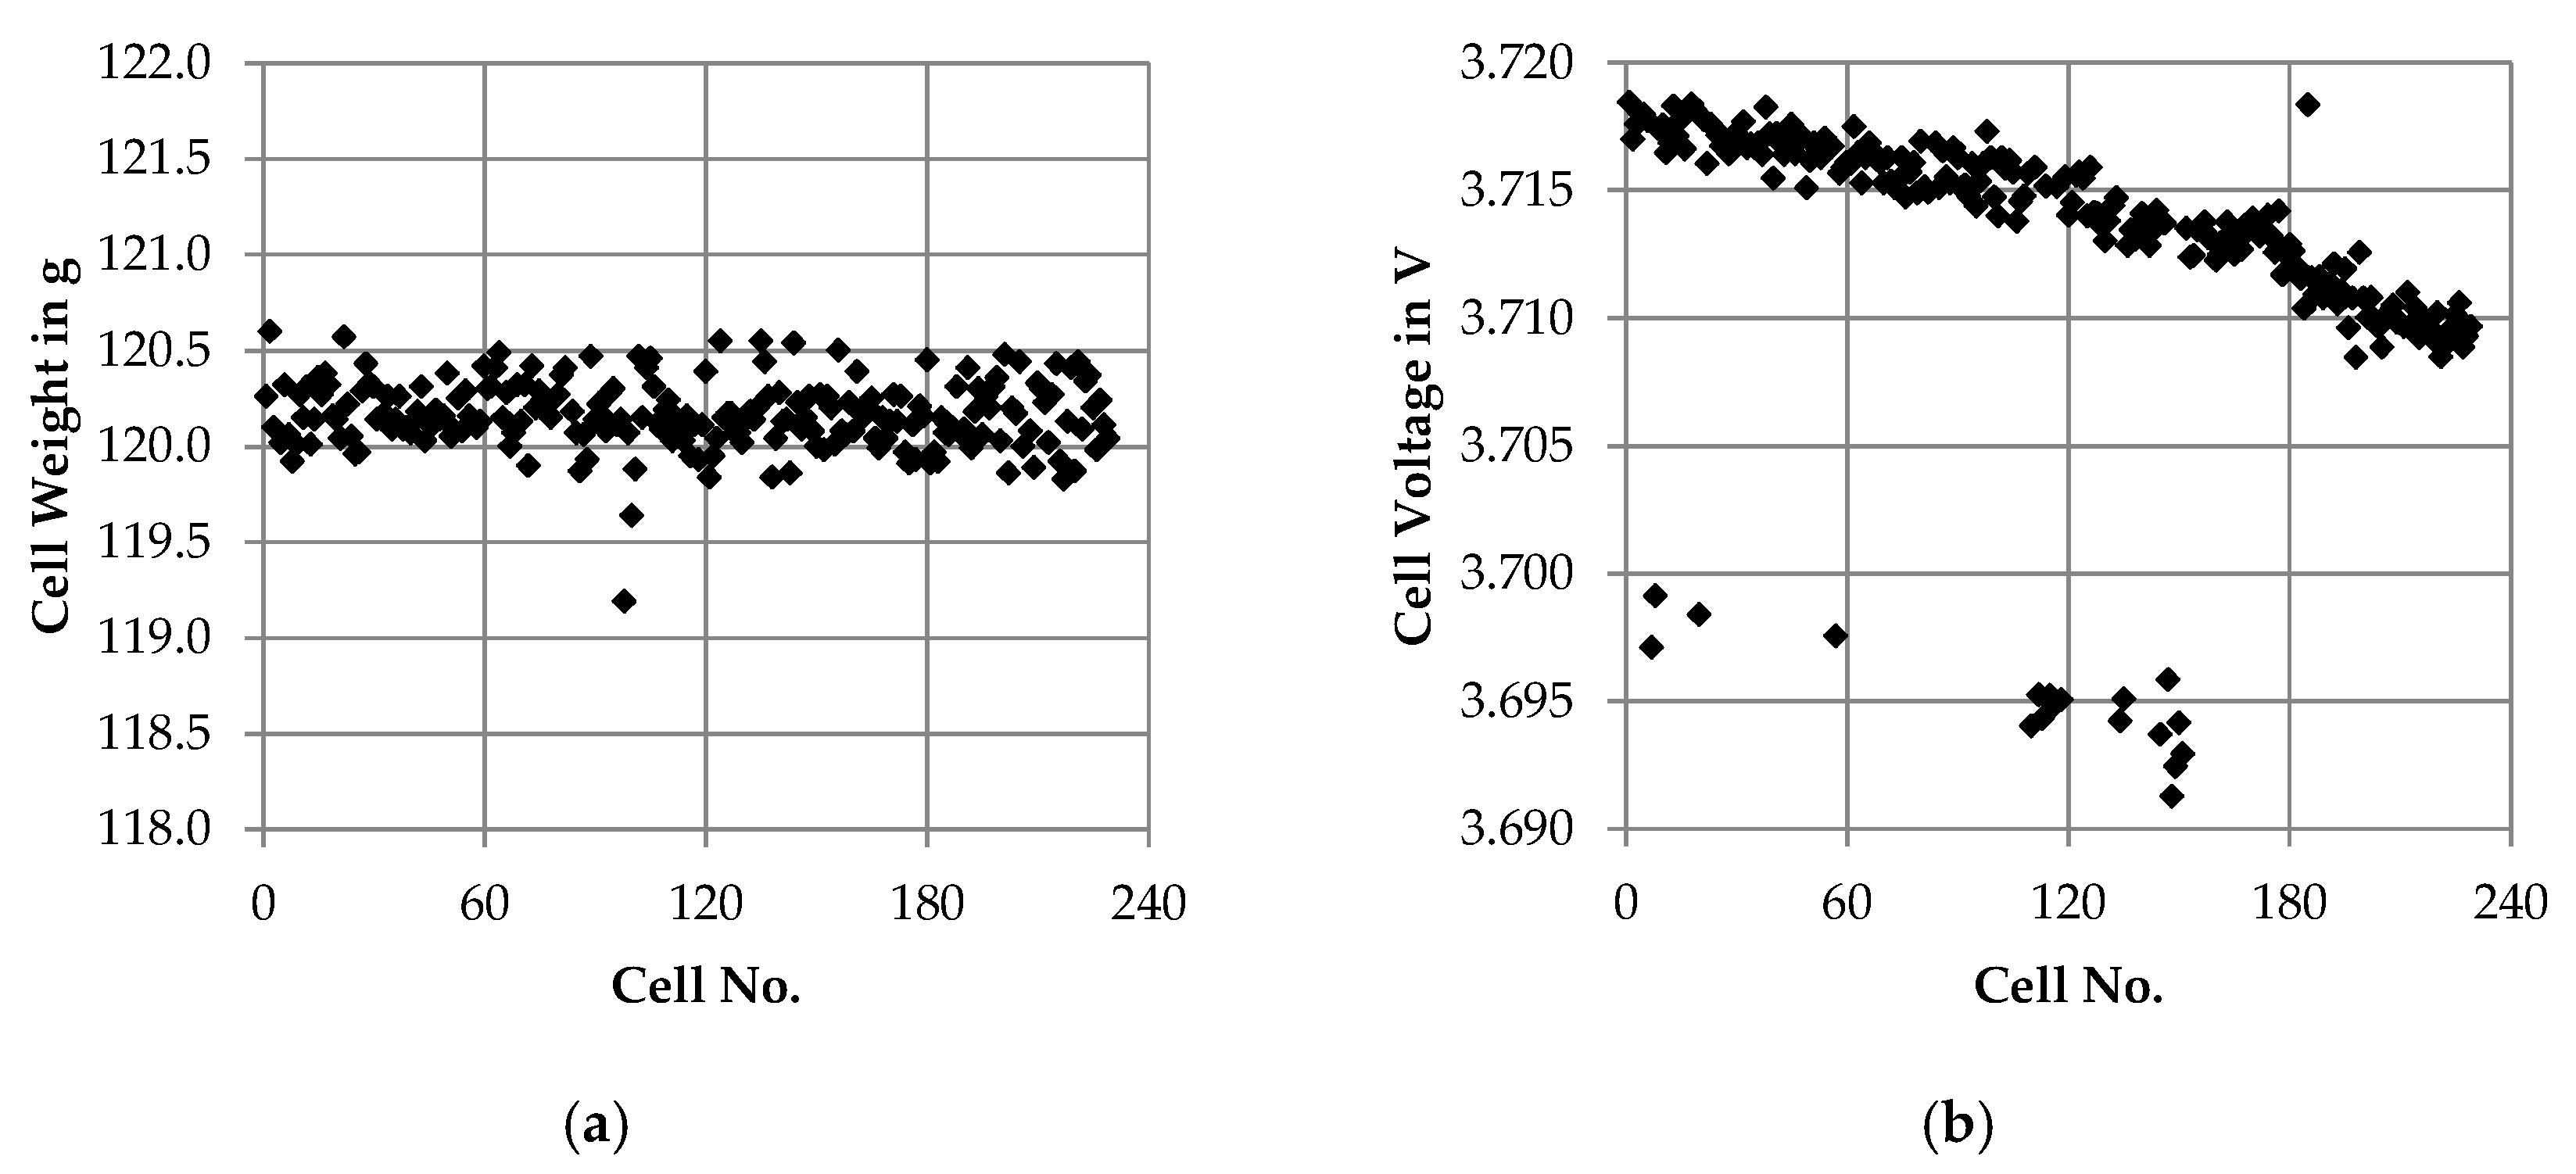
The receiving inspection consists of three steps: the observational check, the gravimetric control and the measurement of the open circuit voltage (see Section 2.2). In the observational check, no irregularities were found in any of the 229 cells. The gravimetric control shows that all cells were below the maximum weight of 140 g specified by the manufacturer. The average cell weight was 120.164 g with a standard deviation of ± 0.175 g, see Figure 5a. The measurement of the open circuit voltage revealed the distribution shown in Figure 5b. For the display, the cells were assigned an ascending numbering from 1 to 229 according to the cell numbers assigned by the manufacturer. A decreasing trend of the cell voltage can be observed. Whereas the cells no. 1–20 had an average cell voltage of 3.718 ± 0.001 V, the cells 209–229 show an average value of 3.709 ± 0.001 V. Assuming 3.720 V as the defined storage cell voltage by the manufacturer, the cells 209–229 display a self-discharge of 0.3%. In addition, 23 cells show a clear deviation independent of the decreasing trend and were identified as outliers by the statistical evaluation. On average, they reached only 3.695 ± 0.002 V.
3.2.2. SQT—Short Quality Test
After the receiving inspection, the cells first passed the short quality test (see Section 4.2). The main results are summarized in Figure 6.
The distribution of the capacity of the 1C–5C full cycle C1 in Figure 6a revealed a charge capacity of 5.572 ± 0.016 Ah and a discharge capacity of 5.345 ± 0.029 Ah. The standard deviation was rather small, which was to be expected, since these were cells from one batch. The corresponding average voltages in Figure 6b had values of 3.919 ± 0.006 V and 3.300 ± 0.028 V. In both cases, the values of the 5C discharge step show a slightly higher scattering. In Figure 6c the split of the total charging load between the CC and CV phase was visualized. Whereas the CC capacity was 4.790 ± 0.044 Ah, the CV capacity was 0.782 ± 0.039 Ah. By considering the coefficient of variance, the CV capacity was found to be about 5%. For comparison, the coefficient of variance of the CC capacity was only almost 1%. The internal resistances were determined from a 5C discharging pulse before cycle C0.1 and from the beginning of the discharge of cycle C0.1, both at a state of charge (SoC) level of approximately 30% (see Figure 6d). The SoC level was based on the manufacturer information and was not self-determined because there was not enough information from the test sections of the SQT to determine the SoC itself. The internal resistance determined by the 5C discharging pulse had a value of 27.358 ± 2.126 mΩ and the internal resistance from the C0.1 discharge step was 31.314 ± 1.699 mΩ.
In summary, the results of the SQT revealed no abnormalities. With regard to capacity, the manufacturer’s specifications, which were specified as a minimum of 5 Ah and an average of 5.5 Ah, were met. For all other parameters, there were no comparable values in the data sheet, which would allow a statement in this respect.
3.2.3. LQT—Long Quality Test
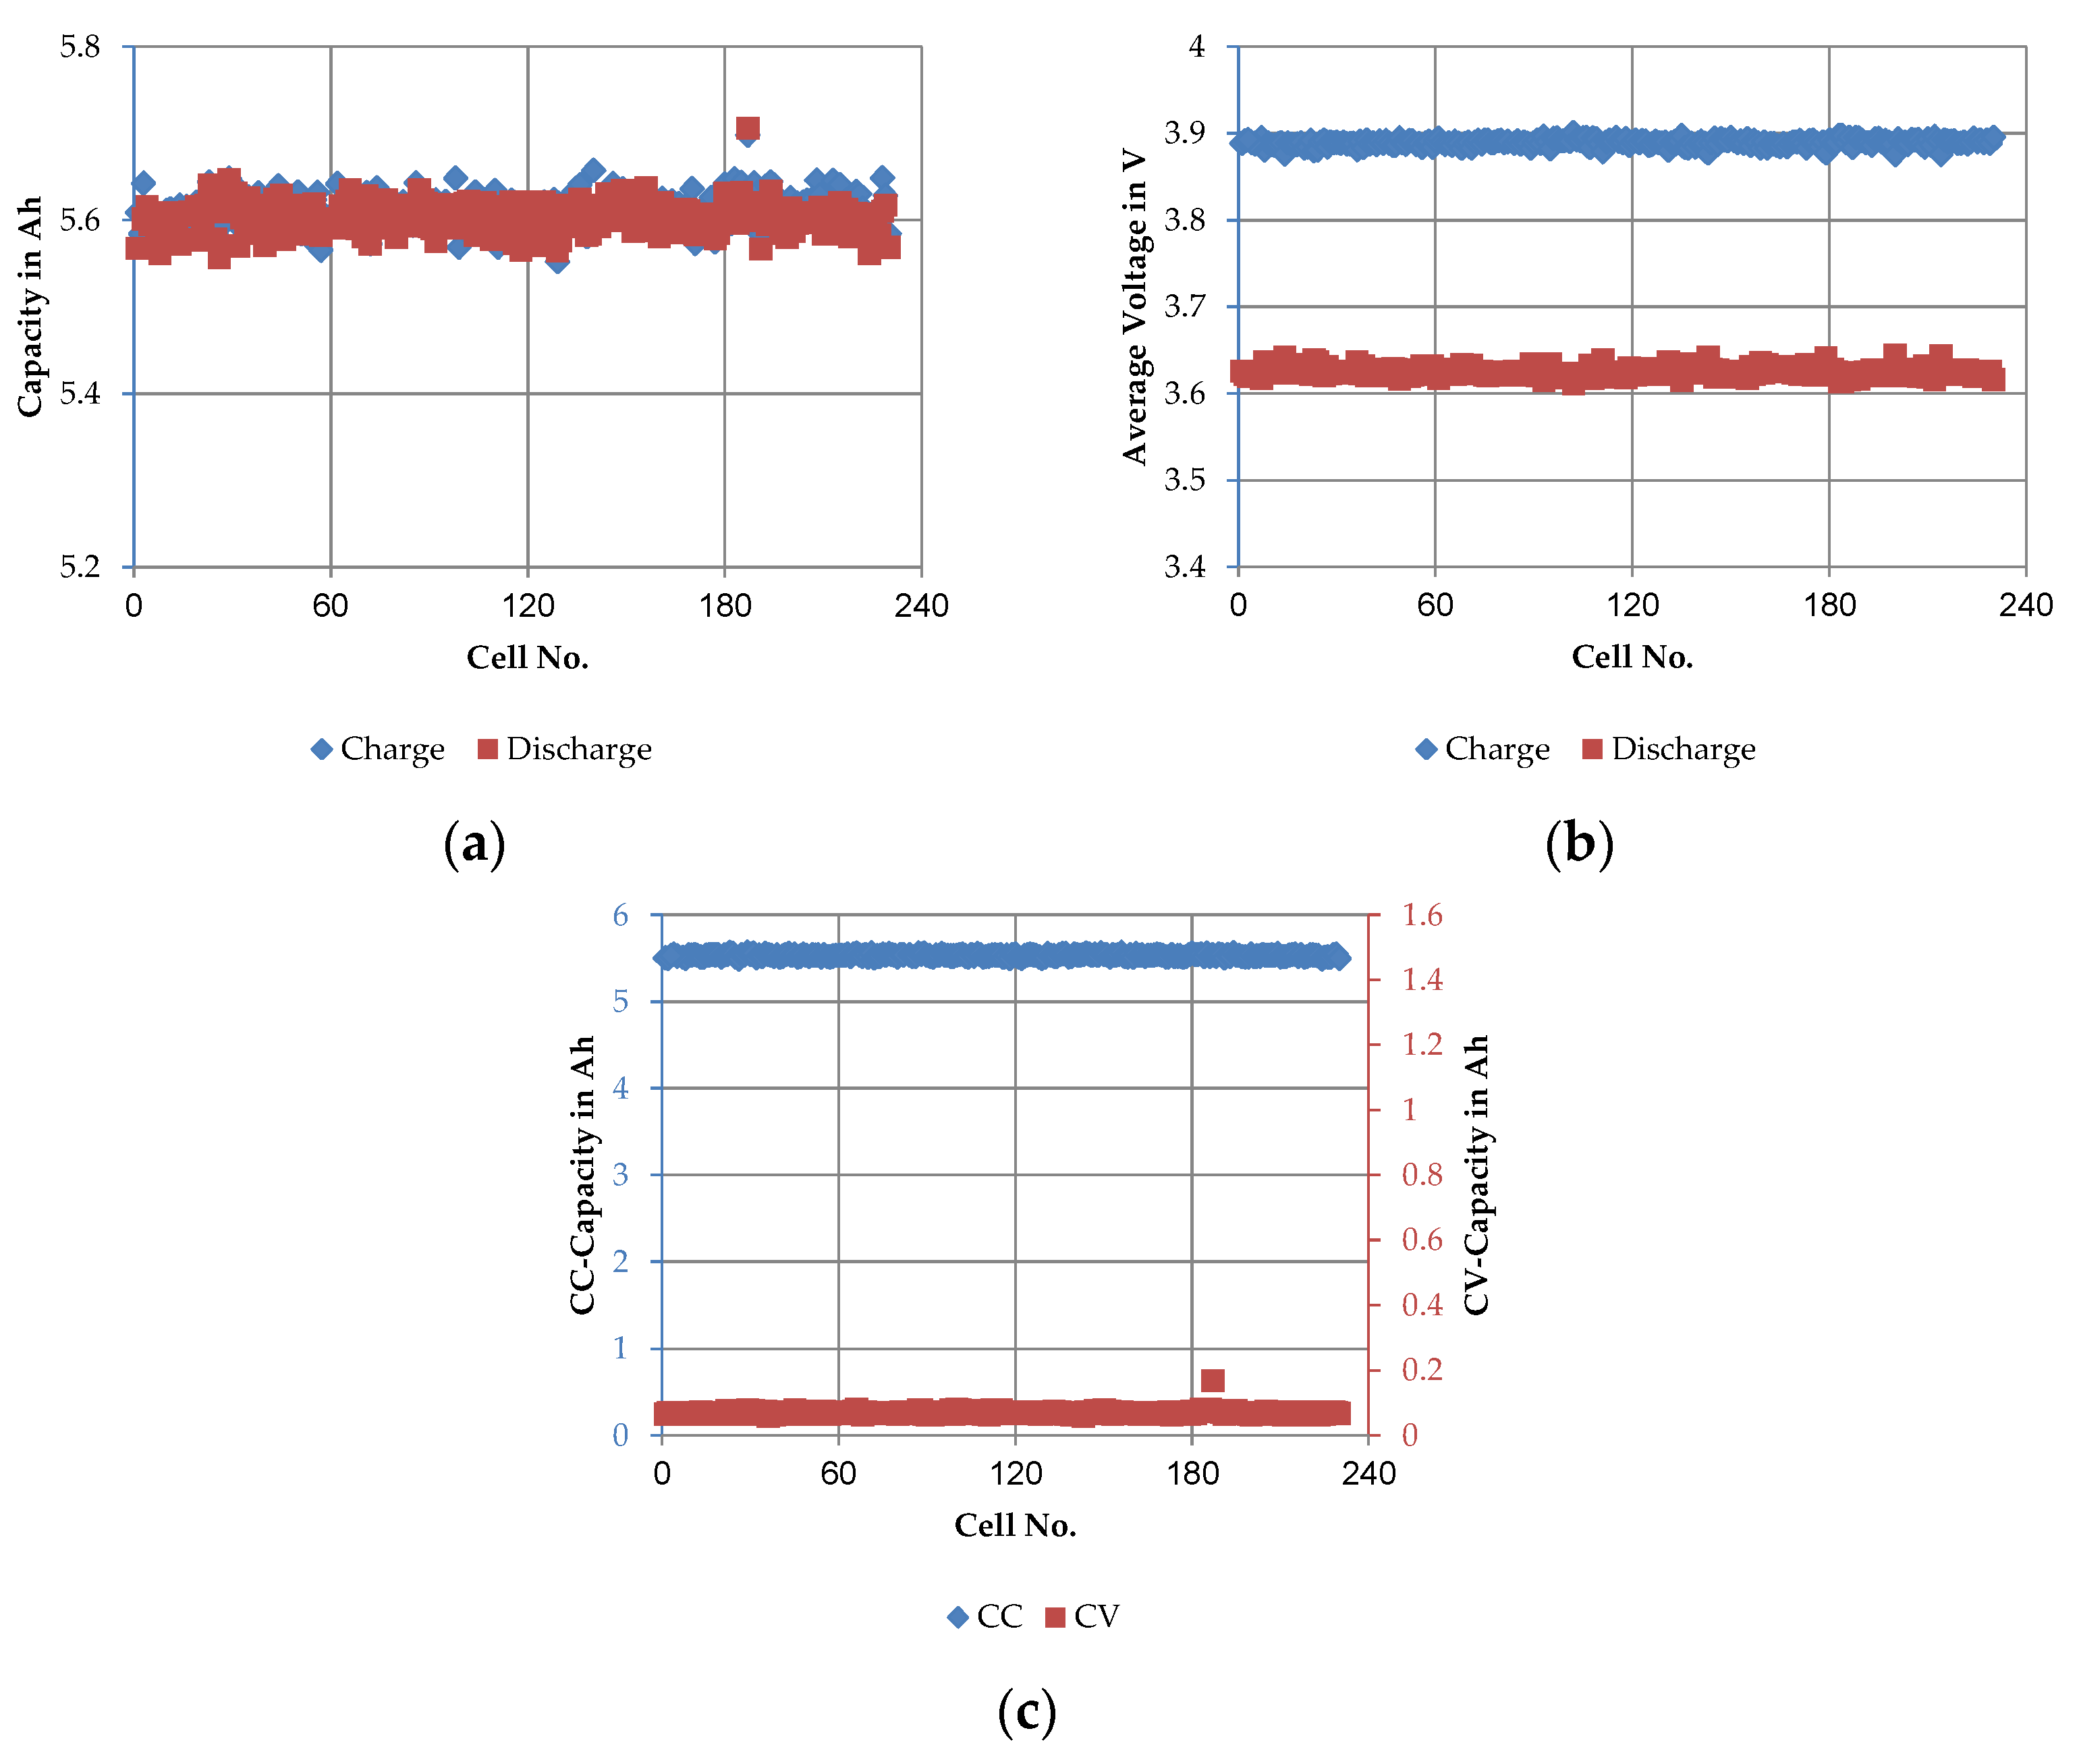
After the short quality test, the cells passed the long quality test. This test procedure consists of three parts: regeneration phase, current rate dependent performance test section and SoC dependent internal resistance determination. Details of the test procedure can be found in Section 2.2. The main results of the regeneration phase are summarized in Figure 7.
The average charge capacity over the five full cycles (C3–C7) at 1C/1C including the CV step (see Figure 7a) was 5.612 ± 0.012 Ah. The achieved discharge capacity amounted to 5.602 ± 0.001 Ah. Since both charge and discharge steps were performed at the same C-rate, including a CV-step, the capacities achieved did not differ significantly. The coefficient of variance of the charge step was about 0.2% whereas the coefficient of variance of the discharge step was only about 0.02%. The corresponding average voltages, as shown in Figure 7b, assumed values in the range of 3.894 ± 0.003 V in the charge step and 3.619 ± 0.001 V in the discharge step. In comparison, the coefficient of variance was very low, ranging from 0.03% (charge) to 0.08% (discharge). The division of the total discharge capacity between the CC and CV phase is illustrated in Figure 7c. The CC capacity was 5.529 ± 0.001 Ah with a coefficient of variance of 0.01% and the CV capacity was 0.073 ± 0.001 Ah with a coefficient of variance of about 1%. The values point out that the CV discharge step represents only about 1.3% of the total capacity.
To be able to compare the actual SoC level with the manufacturer’s specifications, the SoC level was determined at the end of the regeneration phase. Based on the amount of charge discharged from the cells in C0 and the total discharging capacity from the last cycle of the regeneration phase (C7), the storage SoCs was determined. On average, the SoC was 26.6%, with the distribution corresponding to the cell voltage from the receiving inspection (see Figure 5b). The difference between the mean value of the SoC of the cells 1–20 and 200–220 was 0.5%.
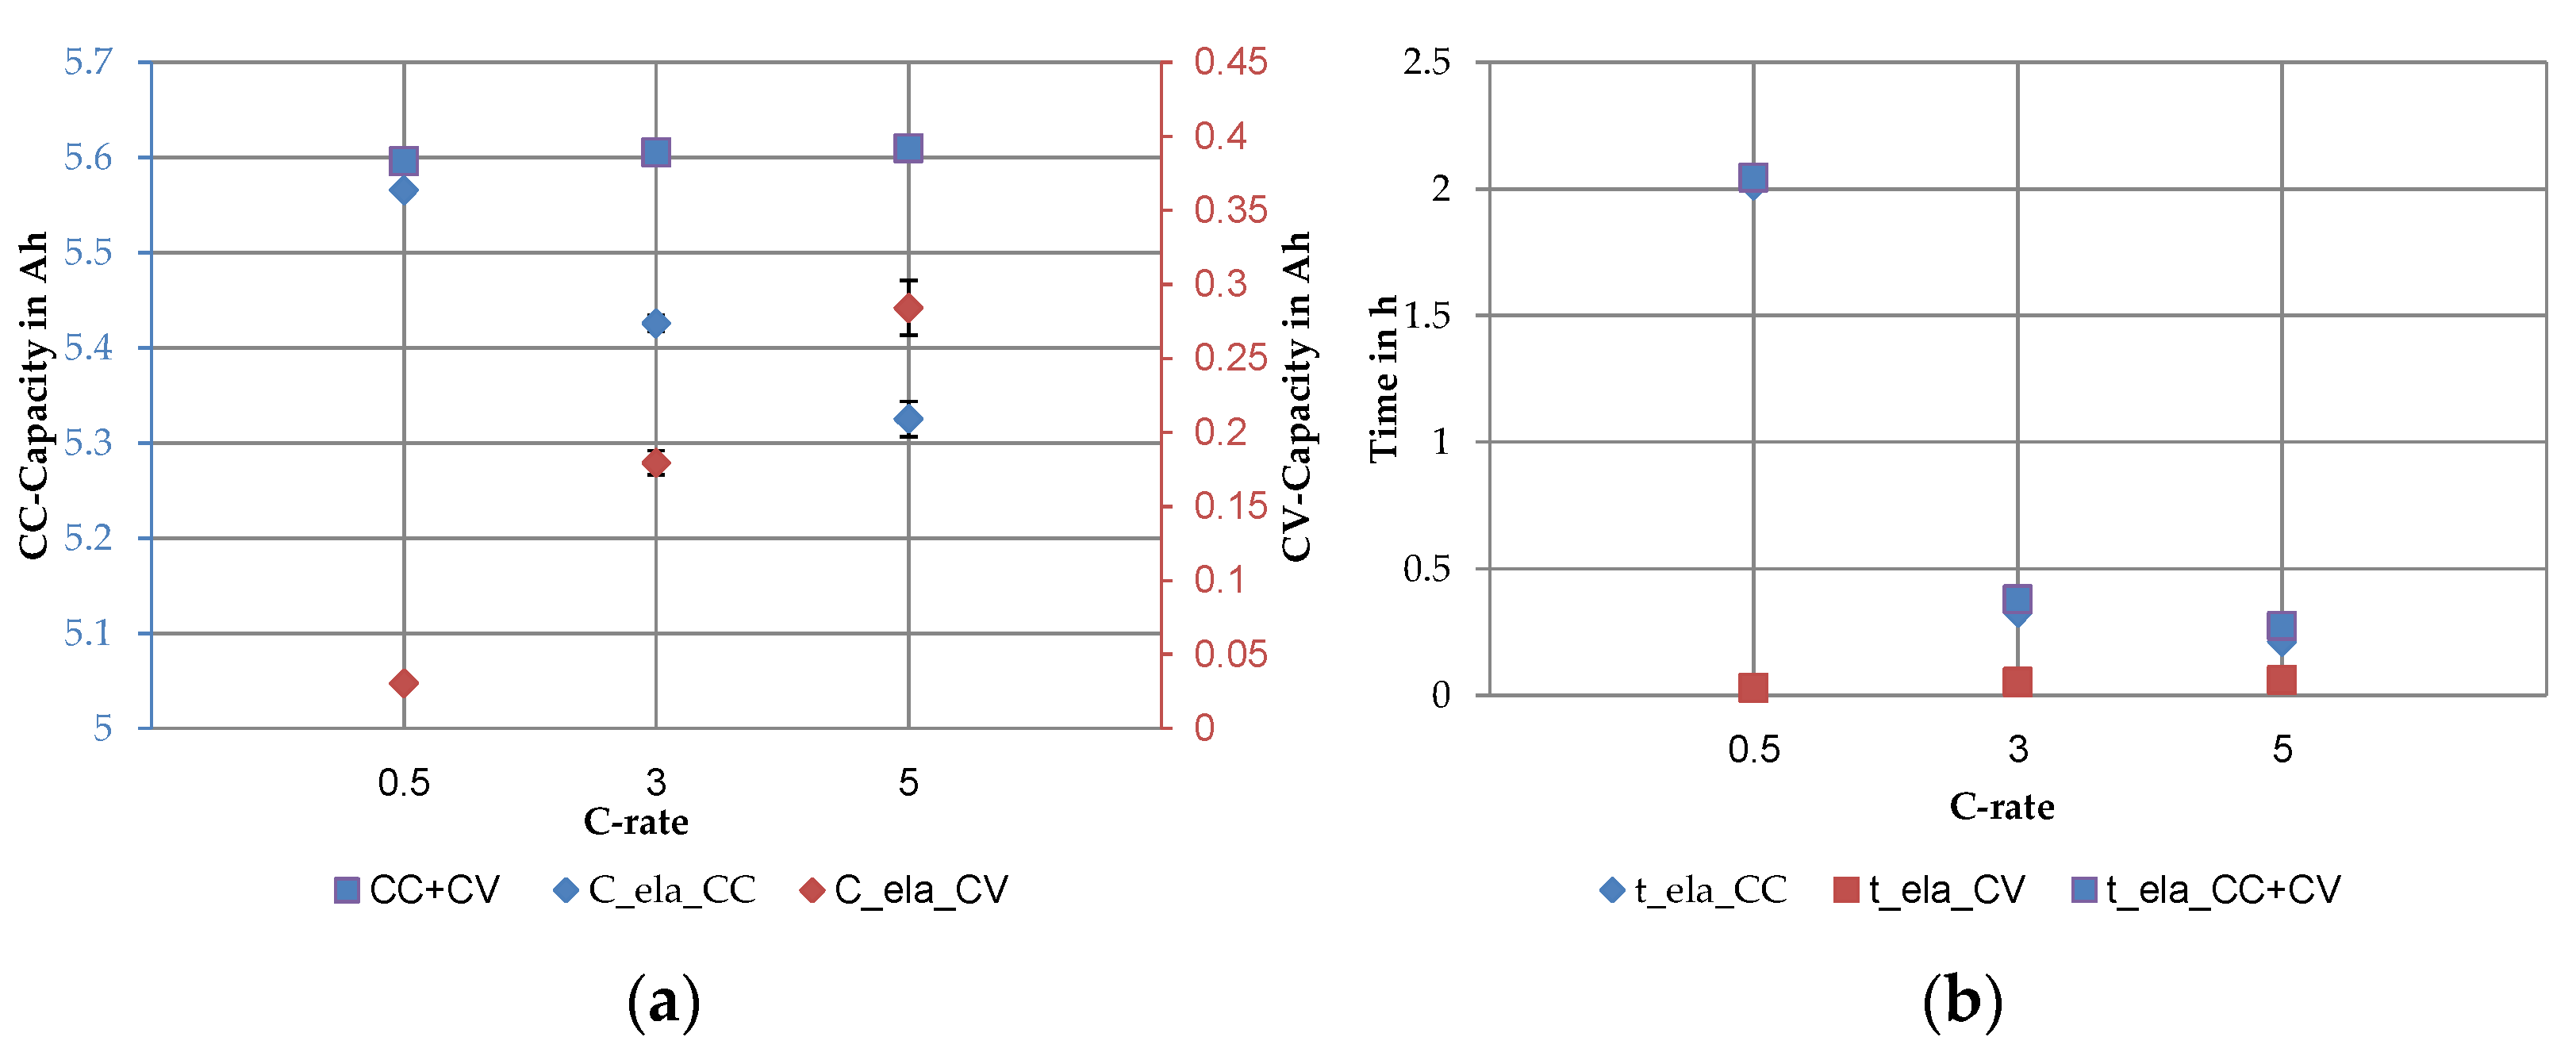
The recovery cycles were followed by the current rate dependent performance test. Three different discharge C-rates (0.5C, 3C and 5C) were tested, with the charge C-rate remaining constant at 1C. The main results are presented in Figure 8.
The mean values and the scattering of the average discharge capacity and the share of the CC and the CV step visualized the current rate dependent in Figure 8a. The average discharge capacity at 0.5C was 5.596 ± 0.011 Ah. The value consists of a CC part of 5.566 ± 0.010 Ah and a CV part of 0.030 ± 0.002 Ah. The discharge capacity at 3C of 5.605 ± 0.009 Ah was divided into a CC capacity of 5.426 ± 0.008 Ah and a CV capacity of 0.180 ± 0.008 Ah. At 5C the average discharge capacity was 5.610 ± 0.009 Ah, composed of 5.326 ± 0.016 Ah CC capacity and 0.284 ± 0.019 Ah CV capacity. Thus, at 0.5C, nearly 0.5% of the total capacity was discharged via the CV step. At higher C-rates the percentage increased to 3.30% at 1C and to 5.30% at 5C. The standard deviation of the CV steps increased in absolute values with increasing C-rate. If the coefficients of variance are considered, no trend can be seen. They were 6.8% at 0.5C, 4.5% at 3C and 6.7% at 5C. Furthermore, a slightly increased scatter of CC-capacity could be seen at higher C-rates. The total discharge time decreased with increasing current rate (see Figure 8b). The CC discharge was mainly responsible for the total time. The average CC discharge time was 2.014 ± 0.002 h at 0.5C, 0.327 ± 0.0004 h at 3C and 0.214 ± 0.0006 h at 5C. Compared to the CC step, the time reduction in the CV step was not proportional to the current rate. With a duration of 0.030 ± 0.002 h at 0.5C, 0.053 ± 0.001 h at 3C and 0.062 ± 0.002 h at 5C the CV discharge times did not differ greatly. In percentage terms, the CV step required 1.47% of the total discharge time at 0.5C, 13.16% at 3C and 22% at 5C.
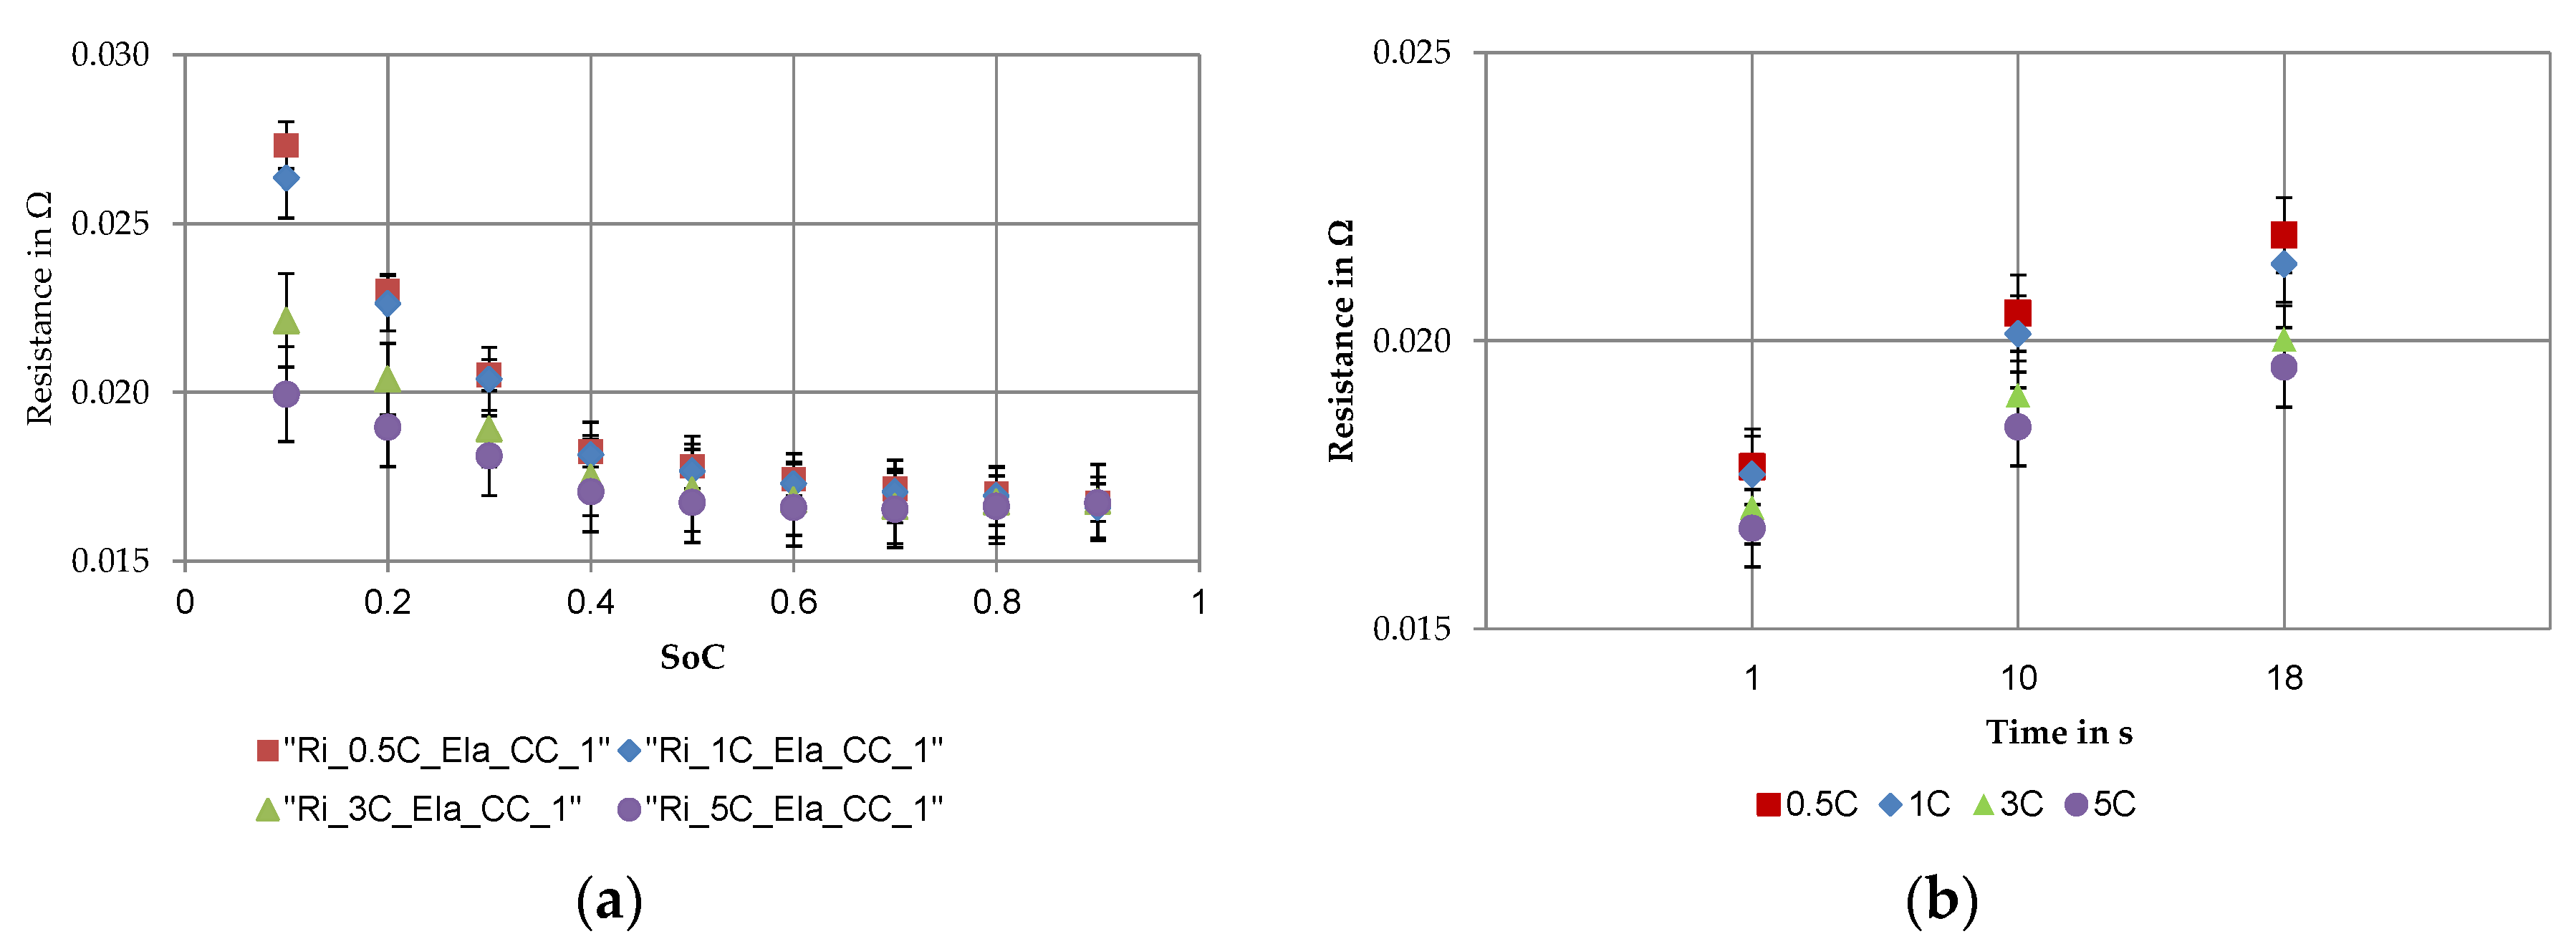
The third section of the long quality test consisted of the SoC and time dependent internal resistance determination. The main results are given in Figure 9.
The internal resistances were calculated from the discharge pulses at nine different SoCs, in 10% steps starting at 10% and ending at 90% at different current rates (a). At 10% state of charge, there were significant differences in the values of the internal resistances, determined at different C-rates. The values decreased from 27.325 ± 0.691 mΩ at 0.5C over 26.364 ± 0.602 mΩ at 1C and 22.137 ± 0.547 mΩ at 3C to 19.950 ± 0.592 mΩ at 5C. With increasing SoC this current dependent separation of the determined internal resistance was less pronounced. From a 50% state of charge on, the deviations were no longer significant and the internal resistances approached a value independent of the current rate. At 50% SoC the internal resistance was approximately 17.334 ± 0.656 mΩ. The coefficient of variation increased at the same C-rate from 10% SoC to 50%. For example, at 0.5C the value went up from 2.5% to 3.8%. As already elaborated, the determined internal resistances were not significant at different current rates from 50% state of charge up to 90%. Therefore, Figure 9b shows the internal resistances at 50% SoC at different pulse durations. The value increased from 1 s over 10–18 s. With a 10 s discharge pulse the internal resistance was 19.537 ± 0.649 mΩ, whereas with 18 s the resistance was already 20.681 ± 0.648 mΩ. Thus, the average internal resistance increased by 19% from 1 to 18 s. The standard deviations were small regardless of the pulse duration. With longer pulse duration this current rate dependent separation increased. The values of the internal resistance at different pulse durations and C-rates are shown in Table 5.
In summary, the results of the LQT, just like the results of the SQT, revealed no abnormalities. With regard to capacity, the manufacturer’s specifications, which were specified as a minimum of 5 Ah and an average of 5.5 Ah, were met. For 5C the manufacturer specified more than 80% of the nominal capacity. Related to 5 Ah these were at least 4 Ah and related to 5.5 Ah and 4.4 Ah. As the CC discharge capacity for 5C was on average 5.326 Ah, this requirement was clearly met. For all other parameters, there were no comparable values in the data sheet, which would allow a statement in this respect.
3.3. Key Figures of SQT and LQT in Comparison
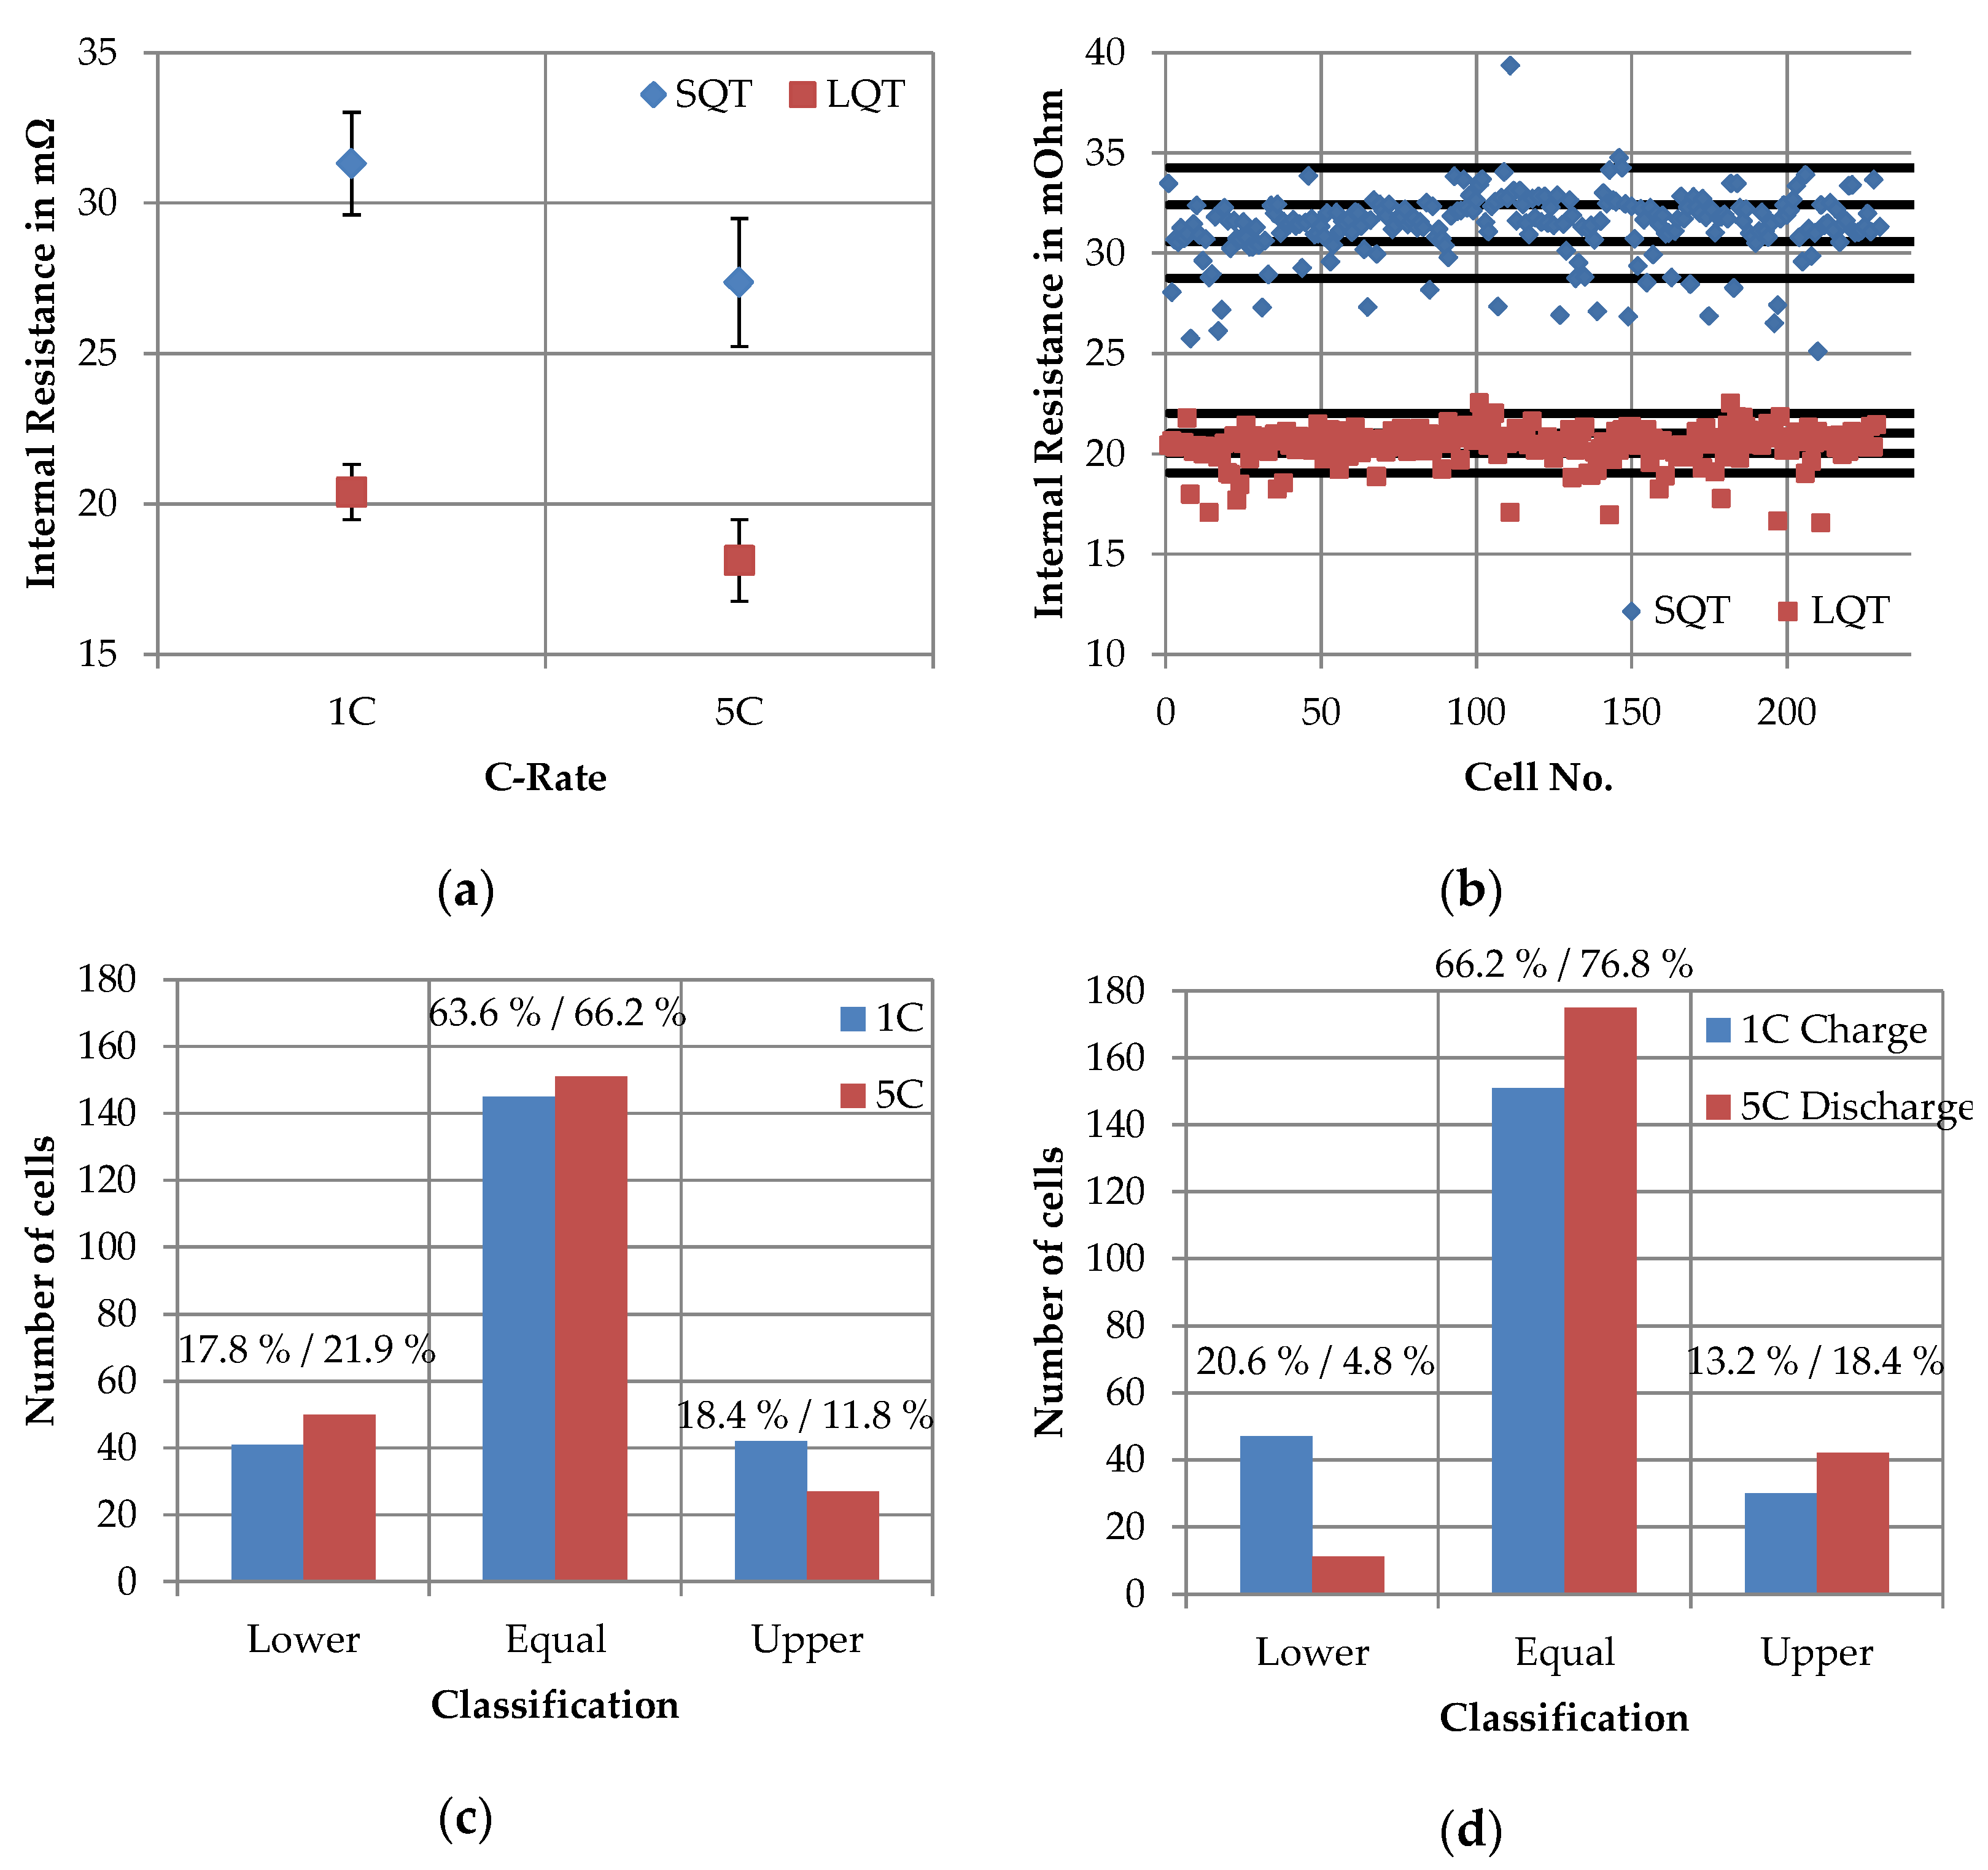
First of all, the internal resistances, which were determined at different times in the SQT and LQT, were compared. Therefore, Figure 10a shows the internal resistances from SQT and LQT determined by the 1C discharge step and the 5C discharge step at 30% SoC. While the 1C value between SQT and LQT decreased by 10.921 mΩ, the 5C value decreased by 9.239 mΩ. In relation to the SQT values, this represents a decrease of 34.9% and 33.8% respectively. In addition, the scattering decreased from 1.699 to 0.922 mΩ for 1C and from 2.126 to 1.360 mΩ for 5C between the values of the SQT and the LQT.
In order to evaluate whether and how the positions of the cells change in their characteristics relatively to each other, the value ranges were divided into intervals according to the procedure described in Section 2.3. For illustration purposes, the subdivision of the value ranges is shown in Figure 10b using the example of the 1C internal resistance. Figure 10c shows the change in the assignment of the cells to the value intervals. The results were very similar for the 1C and 5C values. While 63.6% and 66.2% were assigned to the equal value interval, 17.8% and 21.9% were assigned to a lower and 18.4% and 11.8% to an upper value interval. The determination of outliers between SQT and LQT results was only about 60% consistent. This means that 60% of the outliers determined in the SQT were also identified as outliers in the LQT.
Since the results of the correlation analysis (see Section 3.1) have shown that the internal resistance correlated strongly with the average voltage and that this parameter was at the same time completely unaffected by the total charging capacities, the matching results of the average voltages are shown for comparison in Figure 10d. The comparison was made between cycle 1 (SQT) and cycle 12 (LQT), both for charging at 1C and discharging at 5C. The matching results for the 1C charge show 20.6% in the lower interval, 66.2% in the same interval and 13.2% in the higher interval, while the matching results for the 5C discharge were 4.8% (lower), 76.8% (equal) and 18.4% (upper).
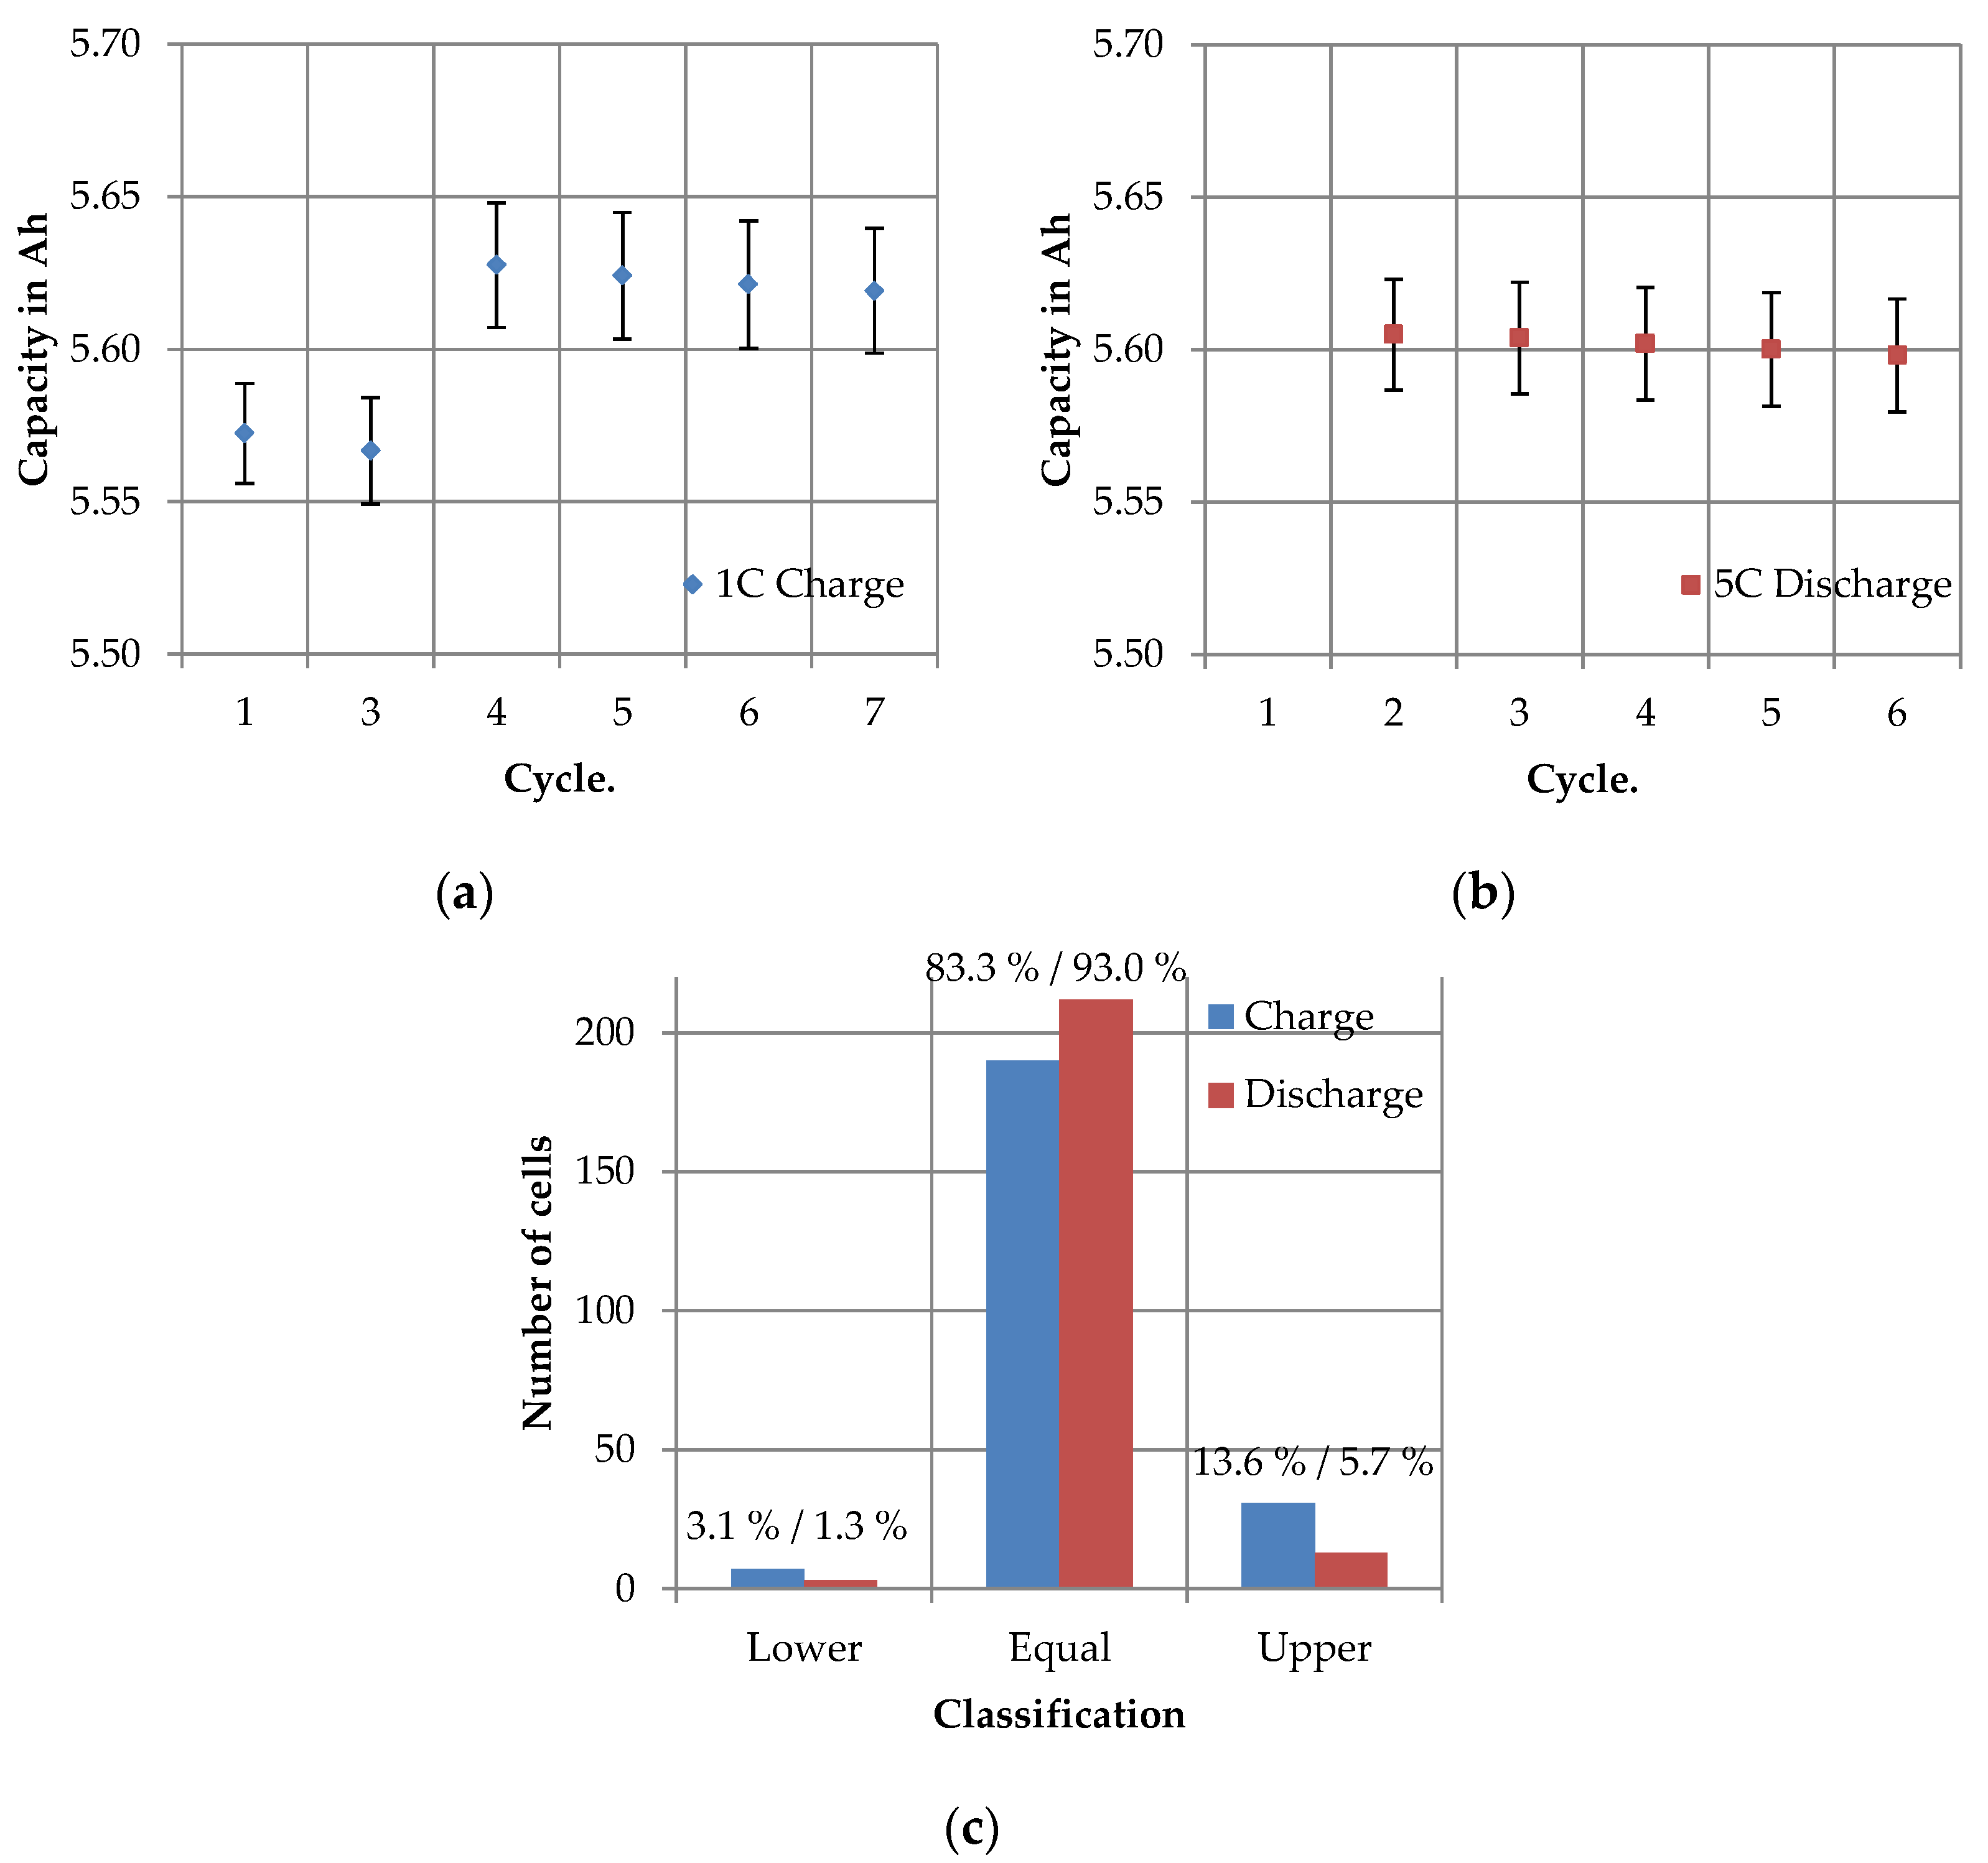
Secondly, the total charging and discharging capacities of the cycles charged and discharged with 1C were considered. Therefore in Figure 11a the absolute values for the total charging capacity and in Figure 11b for the total discharging capacity are shown. Between cycle 3 and 4 there was a very abrupt increase in the charging capacity from 5.567 to 5.628 Ah, both with a standard deviation of ±0.021 Ah. This represents an increase of about 1.1%. Since the value after cycle 4 remained at the same level and the increase was continuously detectable for all cells, it was assumed that the increase was not caused by measurement uncertainty but could be traced back to the influence of the test design. In contrast, the total discharging capacity did not change. For cycle 1 there was no value for the total discharging capacity, because the discharge step consisted only of a CC phase. In cycle 3 the value of the total discharging capacity was even higher than the value of the total charging capacity. In general, a slightly decreasing trend could be observed from cycle 3 to cycle 7, but this was not statistically significant, which is why a constant value was assumed for the discharge steps.
In order to evaluate whether and how the positions of the cells changed their characteristics relatively to each other, the value ranges were also divided into intervals according to the procedure described in Section 2.3. Figure 11c represents the matching results between cycle 3 (LQT, first cycle of regeneration phase) and cycle 7 (LQT, last cycle of regeneration phase). In the charging step 83.3% and in the discharging step 93.0% remained in the same value interval. For charging 3.1% and 1.3% for discharging were assigned to a lower interval and 13.6% for charging and 5.7% for discharging were assigned to a higher interval.
4. Discussion
According to the structure of the results the discussion follows. It starts with the discussion of the correlation analysis and continues with the discussion of the key figure based performance assessment. Afterwards, the results of the comparison between SQT and LQT were considered. Based on the results and conclusions, recommendations for the design of test procedures in the incoming inspection are given.
4.1. Correlation of Parameters
The correlation analysis confirmed that the internal resistance and the total charging capacity were two parameters that did not depend on each other. Apart from the Coulomb efficiency, which is not a true correlation due to the formula-technical relationship with the capacity (see Table 3 in Section 2.3), no high correlations could be found for the total charging capacity (see Figure 4b). Likewise, the connections to the total amounts of energy and time for charge and discharge and the total discharging capacity were plausible by looking at the formula-technical connections. The low positive correlation for the CC and CV shares of the discharging step can be attributed to the fact that with a higher total charging capacity, the shares in the discharge were higher as well. However, in general the distribution on the CC and CV phase was significantly influenced by the kinetic properties of the cells independent of the storage capacity. For all other parameters, no relevant correlations could be found.
The internal resistance showed differently distinct and directed correlations with all parameters except the total capacity of the charging and discharging process (see Figure 4a). The high correlation with the average voltage was obvious, because it describes the average overpotentials. According to the calculation in Section 2.3, the internal resistance was mainly the result of the ohmic overpotential components. Thus, it represents a part of the total overpotential, which was described by the average voltage. Furthermore, the correlation with the CC and CV shares was also plausible, since the level of the overpotentials influenced the reaching of the charge or discharge end voltage. The distribution of capacity, energy and time to the CC and CV phase was determined by reaching the respective voltage limit. The high negative correlations with the efficiencies of voltage and energy were also plausible. Since the Coulomb efficiency was usually close to one, the energetic efficiency was mainly influenced by the overpotentials. The voltage efficiency describes the voltage losses caused by overpotentials.
The most important result in the comparison between the correlations of the internal resistance and the correlations of the capacity was that the average voltages did not correlate with the capacity but highly correlated with the internal resistance. This offers the potential to derive comparable statements about the differences in kinetic properties from the data of a full cycle independent of a current pulse by using the average voltage from a full charging or discharging step.
4.2. Performance Assessment
4.2.1. Receiving Inspection
The checks carried out in the test section of the receiving inspection are necessary steps to take into account the general battery condition. By means of visual inspection, it can be ensured that cells with mechanical damage were sorted out. The voltage measurement is a first indication of whether the cells are also electrically in the expected state. In the case of increased self-discharge, smaller deviations can be attributed to different storage periods. In principle, reversible and irreversible aging effects as a result of storage should also always be taken into account. With longer storage time the presence of such effects becomes more probable. In this context, the higher self-discharge as a link to longer storage periods can be a first indication that more pronounced aging effects are present. However, a quantitative assessment is not possible. In the case of larger deviations in the cell voltage defects such as local mini short circuits must be considered. This is especially important if the voltage falls below the lower voltage limit specified by the manufacturer. For these cells, it must be examined very carefully whether a further application is acceptable in terms of safety. By means of gravimetric control, a rough estimate can be made whether the cells comply with the manufacturer’s specifications.
In the present cells, there were no abnormalities during optical and gravimetric control (see Figure 5a). For the cell voltage a decreasing trend was determined (see Figure 5b), which might be a hint for varying lengths of the storage period between the end-of-line test of the manufacturer and the initial tests at our laboratory. Despite the decreasing trend and the outliers, no links to the SQT and LQT parameters could be established depending on this information. It is therefore concluded that the deviations of the cell voltage in the present case were so small that they were not relevant.
In summary, the receiving inspection served to evaluate the general battery condition. Mechanical faults were detected, rough indications of electrical malfunction became visible and the manufacturer’s specifications were checked. However, a quality analysis and classification of the cells was not possible with this information.
4.2.2. Short Quality Test
Besides the absolute values, the results from the short quality test provided hardly any significant findings.
The key figures of the 1C charging step from cycle C1 showed only small standard deviations (see Figure 6a–c), except for the parameters for quantifying the CV shares. In comparison, the standard deviations of the parameters from the 5C discharge step were all slightly increased. From this, it can be concluded that especially parameters from cycle with high C-rate were more sensitive to differences in the cells. Nevertheless, the differences were generally rather small in the present cell population, thus it was assumed that the cells were very similar in the cell properties overall.
The first unexpected result is the difference between the internal resistances of the different C-rates (see Figure 6d). Possible causes are explained in the discussion of the LQT results and are not presented here (see Section 4.2.3).
4.2.3. Long Quality Test
Since the long quality test consists of more characterization units than the SQT, the evaluation of cell properties was more detailed and could be divided into three main categories: regeneration phase, current rate dependent performance test and SoC dependent internal resistance determination at different pulse durations and C-rates.
The key figures from the regeneration phase were the charge and discharge capacity at a current rate of 1C from cycles C3 to C7 and the division of them in CC and CV capacity. The mean value over the 5 cycles showed high reproducibility and small standard deviation. Due to the integration of the CV steps in both the charge and discharge steps, the capacities from charging and discharging were also very comparable (see Figure 7a,c). From this section of the quality test it could be concluded that low C-rates did not allow a classification of the cells due to the small differences in the cell population.
The current rate dependent performance of cycles C9 to C11 resulted in different discharge capacities of the CC phases with relatively low standard deviations (see Figure 8a). On closer inspection, it was recognized that the standard deviation increased at higher discharge currents. This confirms the findings of the SQT that the characteristics from cycles with higher C-rate were more sensitive to the differences in the cells (see Section 4.2.2). Since the discharge step always included a CV step, the total capacity did not differ significantly. A closer look at the division of CC and CV capacity revealed surprisingly that the major share of the capacity resulted mainly from CC capacity even at higher C-rates. Thus, the CV step did not contribute significantly to the total discharge capacity at higher C-rates. Considering the total discharge time and the time splitting into CC and CV step (see Figure 8b), it was obvious that the CV step needed about the same time independent of the C-rate. In summary, despite the faster C-rate, there was no significant loss of capacity in the CC step that would need to be compensated in a significantly longer CV step.
In the current rate dependent internal resistance test in cycle C12 internal resistances determined from the discharge pulses were considered. The values of the discharge were of special interest because on the one hand they evaluate the performance from the user’s point of view and on the other hand the values from the discharge pulses were more sensitive to differences between the cells. Furthermore, pulse lengths in the range of 1–30 s were tested. On this time scale, electron transfer, ion transfer and ion diffusion contributed to the resistance. In the presentation of the results, the internal resistance test was limited to pulse lengths of 1 s, 10 s and 18 s because the 1 s internal resistance is relevant in the pilot scale and the longer pulse durations are used in the automotive sector for the specification of battery cells in modules. The internal resistance at 1 s should be significantly determined by the ohmic resistance, whereas the 10 s and 18 s resistance is due to charge transfer and polarization resistances [26]. The value of the internal resistance decreased steadily up to a SoC of 50% (see Figure 9a). At higher states of charge, no significant variations could be seen. This typical course was consistent with the internal resistance characteristics [6,27]. This can be explained by the intercalation of the lithium ions during the charging process [24]. As the intercalation of lithium ions into the anode progresses, the conductivity increased and the internal resistance decreased. Furthermore, a dependence of the C-rate could be determined at low charge states. With increasing current rate the internal resistance decreased at the same state of charge. Above a SoC of 50% this effect was no longer observed because the internal resistance in this wide range generally varies little. However, such a behavior should not apply to the ohmic resistance, since this should be independent of the SoC and current rate according to Ohm’s law. Therefore the 1 s resistance must be composed of a certain extent of charge transfer and polarization resistance [28]. The C-rate dependence at low states of charge is attributed to the various electrochemical processes that are activated within the cells when heat is generated by the pulse currents. For higher C-rates, such electrochemical processes are activated earlier and more heat is developed, which effectively increases the internal temperature of the battery and contributes to the resistance decrease [26]. However, the temperature dependence was hardly visible in the current cells because of the high measurement inaccuracy (±2 °C) and the measurement setup, which was performed with a sensor on the cell surface.
For each SoC, both charging and discharging pulses were performed successively with increasing C-rate. The rest phase between the pulses was constant at 4 min. With increasing C-rate in the current pulses the cells were charged and discharged during the internal resistance tests. Since it cannot be assumed that the parts from charging to discharging balance each other out, the state of charge of the battery changes. In addition, the rest step was not adapted to the higher C-rates, so that the relaxation time was not long enough to return the system back to its initial state. This can result in a state of charge change so that the current dependent internal resistance tests were not directly comparable to each other. Furthermore, the time dependence of the discharge pulses was also investigated. The C-rate dependent separation can be observed for different pulse durations at a SoC of 50% from a pulse length of 10 s (see Figure 9b). The separation increased with longer pulses because the earlier activation of the electrochemical processes and the increased heat generation rise at higher C-rates were disturbed at higher pulse durations.
Parts of the argumentation applied to the results of the SQT internal resistance test (see Section 4.2.2), too. So, it could be assumed that the state of charge changes by the 5C discharge pulse in comparison to the following 1C discharge step and the relaxation time between pulse and discharge step with 5 min was not sufficient.
4.3. Key Figures of SQT and LQT in Comparison
The comparison of the results (see Section 3.3) for the internal resistances and the total capacities of the SQT and LQT revealed a decreasing trend for the internal resistances (see Figure 10a) and an abrupt increase for the total charging capacities (see Figure 11a). No changes could be observed for the total discharging capacities (see Figure 11b).
The uniform decrease of the internal resistance can be attributed to two causes. On the one hand, the SoCs of the comparison points were not exactly in balance. While the internal resistances of the SQT were determined based on the storage SoC, the SoC was set to 30% for all cells in the LQT. In the SQT, the SoC was an average of approximately 26.6%. With the results from Section 3.2.3 the internal resistance decreased with increasing SoC. A part of the decrease of the internal resistance could therefore also be attributed to the higher SoC in the LQT.
One the other hand the decrease of the internal resistance indicates that the kinetic properties of the cells improved during the cycles. This can be attributed to reversible aging effects that have built up during the storage period. Due to the correlation of the internal resistance to most of the other parameters (see Section 3.1), it can be assumed that their absolute values and relative position to each other (interval assignments) were similarly strongly influenced by the reversible aging effects. This was confirmed by considering the average voltage (see Figure 10d). The matching results for the internal resistance showed that only 63.6% (1C, discharge pulse) and 66.2% (5C, discharge pulse) respectively of the cells were assigned to the same value interval (see Figure 10c). From this, it can be concluded that the cells were not equally affected by the reversible aging effects and the degree of recovery varies. This is particularly evident from the fact that the SQT values scattered much more than the LQT values (see Figure 10b). Furthermore, based on the performance assessment from the LQT, it should be noted that for SoCs below 50%, the internal resistance shows a strong dependence on the SoC. Since the comparison values were determined at 30%, even slight deviations in the SoCs could lead to changes in the internal resistance. Therefore, the classification results were subject to uncertainty due to possible inaccuracies in the SoC setting.
In summary, the relative positions of the cells with respect to the internal resistance from the 5C current pulse of the SQT were associated with high uncertainty, since about one third of the cells changed their relative position to the other. Therefore no classification with the internal resistance is possible before full cycles have been performed on the cells and the cell kinetics have stabilized. For the average voltage of the 1C charging step the results corresponded approximately to the matching results of the internal resistance. For the 5C discharge, even with 76.8% agreement, much more reliable values could be obtained. Due to the strong correlation between the internal resistance and the average voltage, it is therefore concluded that almost the same information can be obtained about the average voltage, so that a separate current pulse is not necessary, especially at the beginning of a test procedure.
Despite the change in the total charging capacities between cycle 3 and 4, the matching results derived from the total charging and discharging capacities were better than for the internal resistances, because 83.3% (charge) and 93.0% (discharge) of the cells were assigned to the same value interval (see Figure 11c). From this it was concluded that right at the beginning of the test procedure (here cycle 3), despite regeneration of the kinetic properties, a reliable evaluation of the cells to each other and thus classification of the cells regarding their storage capacity is possible. The abrupt increase in the total charging capacities was not attributed to reversible aging effects, but to the test design. Cycle 1 and 3 were each executed after a test step consisting of only CC discharge (C0.1 and C2). Accordingly, less charge was withdrawn from the cells in the discharge than in comparable discharge processes with CV phase. Since the discharges were carried out with the CV phase from cycle 3 onwards, the amount of charge was increased. Since the distribution of the charge quantity on the CC and CV phase correlated with the internal resistance, this resulted in an indirect influence of the total charging capacity in cycle 3 by the kinetic properties. As these were still in the regeneration phase, the matching results of the charge were associated with higher uncertainty. These dependencies should be considered when designing test procedures and are discussed in Section 4.4.
4.4. Recommendations for the Design of Test Procedures in the Incoming Inspection
Based on the previously presented and discussed results, the following points arose with regard to the design of test procedures in the incoming inspection, which should be considered.
The first drawn conclusion is that no reliable information can be obtained from the SQT. The 5C current pulse directly at the beginning of the procedure to determine the internal resistance is not useful for two reasons. Firstly, the exact SoC is unknown and may differ between the cells due to different storage periods, so that no direct comparison is possible between the cells and at a later comparison point with exact SoC settings. Secondly, reversible aging effects have been shown with regard to the kinetic properties. The results of the internal resistance from the first discharge pulse and the average voltage from the first cycle were not reproducible in the following discharge pulses and steps. This concerns both, the absolute values and the relative positions of the values to each other. Furthermore, the total charging capacity in cycle 1 is due to the previous discharge step without the CV phase influenced by the kinetic cell properties. The same applies to the total discharging capacity of cycle 1 due to the missing CV step. Therefore, the SQT does not provide results regarding the storage capacity that are unaffected by the kinetic properties.
From the results of the performance assessment of the LQT, it could be concluded that the current dependent test could be limited to high C-rates, because the differences between the cells were more pronounced. By integrating a CV phase in all charge and discharge steps, the total charge/discharge capacity was obtained independently of the C-rate. The test duration could thus be significantly reduced by avoiding low C-rates. Regarding the design of the internal resistance test, it could be concluded that relaxation time must be increased for pulses with higher C-rates in order to minimize temperature influence. With successive pulses it must be considered that the state of charge could change, so that the comparability could be difficult. Furthermore, the large number of pulse currents for internal resistance determination could be minimized. Since the internal resistances scattered very strongly below a state of charge of 50%, it is recommended to determine the internal resistance from SoC 50% onwards.
5. Conclusions
In summary, test procedures in the incoming inspection should always include a regeneration phase of at least five full cycles to reduce possible reversible aging effects in the cells thus stabilizing the kinetic properties and the storage capacity. In addition to the CV phase in the charging steps, the CV phase in the discharge steps is necessary to eliminate kinetic effects from the discharging capacities and to gain information about the total cell capacity independently of the C-rate. The additional time required for CV phases in the discharge steps is negligible compared to CV phases in the charge steps because even at high discharge rates the CV steps only take a few minutes. With regard to possible classifications in the incoming inspection, the occurrence of possible reversible aging effects was also identified as the greatest hurdle. Consequently, a classification of the cells is only possible in a meaningful way once the cell properties have stabilized, since not all cells are affected equally. As two essential criteria for the classification the internal resistance as the basis for the evaluation of the kinetic properties and the total capacity as the basis for the evaluation of the storage capacity have emerged. The internal resistance has the potential to be replaced by the average voltage, which would eliminate the need for current pulses in the test procedures. While the current pulses themselves do not require much time, the necessary presettings of the SOC level and the state of equilibrium require time periods of several hours.
In further investigations, the next step should be examining cells that differ more strongly in their properties in order to investigate the classification approach more closely. A starting point could be an evaluation of different batches of the same cell type because in the scope of this work only the cells from a single batch were considered. Furthermore, the applicability to other battery systems should be the subject of future research activities. The basis for these studies should be a test procedure adapted on the basis of the obtained results. The procedure should include at least a recovery phase of 5 cycles, a C-rate test with C-rates higher than 1C and, at an average state of charge (50–70%), a discharge pulse of a defined C-rate. By the aging of the cells, it can be tested additionally, how the cells, in the different classes behave in the course of aging.
The determination of the internal resistance also offers great potential for the following investigations. In addition to the current pulses used here to determine the internal resistance, there is also the possibility to determine the internal resistance using the SoC setting steps of the test procedures. In this case the difference between the current load from the SoC setting compared to a defined time at the following relaxation phase would be the basis for the internal resistance determination. If applicable, this approach could be used to completely eliminate the current pulses and further shorten the test procedure.
Author Contributions
K.R.: preparation, conceptualization, investigations, data analysis, and writing of the original draft. L.H.: data analysis, discussion and writing of the original draft. O.L.: discussion, writing—review and editing. F.L.: discussion, project administration. M.K.: discussion, supervision. All authors have read and agreed to the published version of the manuscript.
Funding
The results were generated in the project BaSS (16EMO0318) funded by the Federal Ministry of Education and Research. The authors express their gratitude for the financial support by the Ministry and for the project management by the VDI/VDE/IT. Furthermore we acknowledge support by the German Research Foundation and the Open Access Publication Funds of Technische Universität Braunschweig.
Institutional Review Board Statement
Not applicable, as studies on humans and animals are not involved.
Informed Consent Statement
Not applicable, as studies on humans are not involved.
Data Availability Statement
The data are not publicly available due to the data required to reproduce these findings forms part of an ongoing study.
Acknowledgments
The authors would like to thank the Battery LabFactory Braunschweig, which provided the measurement infrastructure to carry out the investigations.
Conflicts of Interest
The authors declare no conflict of interest.
References
- Leuthner, S.; Korthauer, R. Handbuch Lithium-Ionen-Batterien; Springer: Berlin/Heidelberg, Germany, 2013. [Google Scholar]
- Placke, T.; Kloepsch, R.; Dühnen, S.; Winter, M. Lithium ion, lithium metal, and alternative rechargeable battery technologies: The odyssey for high energy density. J. Solid State Electrochem. 2017, 21, 1939–1964. [Google Scholar] [CrossRef]
- Winter, M.; Barnett, B.; Xu, R. Before Li Ion Batteries. Chem. Rev. 2018, 118, 11433–11456. [Google Scholar] [CrossRef] [PubMed]
- Schmuch, R.; Wagner, R.; Hörpel, G.; Placke, T.; Winter, M. Performance and cost of materials for lithium-based rechargeable automotive batteries. Nat. Energy 2018, 3, 267–278. [Google Scholar] [CrossRef]
- Wagner, R.; Preschitschek, N.; Passerini, S.; Leker, J.; Winter, M. Current research trends and prospects among the various materials and designs used in lithium-based batteries. J. Appl. Electrochem. 2013, 43, 481–496. [Google Scholar] [CrossRef]
- Lu, L.; Han, X.; Li, J.; Hua, J.; Ouyang, M. A review on the key issues for lithium-ion battery management in electric vehicles. J. Power Sources 2013, 226, 272–288. [Google Scholar] [CrossRef]
- Thielmann, A.; Sauer, A.; Isenmann, R.; Wietschel, M.; Plötz, P. Produkt-Roadmap Lithium-Ionen-Batterien 2030; Fraunhofer ISI: Karlsruhe, Germany, 2012. [Google Scholar]
- Michaelis, S. Roadmap Batterie-Produktionsmittel 2030; VDMA Batterieproduktion: Frankfurt am Main, Germany, 2016. [Google Scholar]
- Nationale Plattform Elektromobilität (NPE). Forschungsbericht 2018—Markthochlaufphase; Gemeinsame Geschäftsstelle Elektromobilität der Bundesregierung: Berlin, Germany, 2018. [Google Scholar]
- Campestrini, C.; Keil, P.; Schuster, S.F.; Jossen, A. Ageing of lithium-ion battery modules with dissipative balancing compared with single-cell ageing. J. Energy Storage 2016, 6, 142–152. [Google Scholar] [CrossRef]
- Jossen, A.; Weydanz, W. Moderne Akkumulatoren Richtig Einsetzen; Reichardt Verlag: Untermeitingen, Germany, 2006; pp. 221–230. [Google Scholar]
- Meuser, C. Physikalische und chemische Charakterisierung von Lithiumionenzellen. Ph.D. Dissertation, Technische Universität Dresden, Dresden, Germany, 2011. [Google Scholar]
- Petzl, M. Zerstörungsfreie Charakterisierung von Lithium-Plating in Lithium-Ionen-Batterien. Ph.D. Dissertation, Ulm University, Ulm, Germany, 2015. [Google Scholar]
- Westerhoff, U. Klassifizierung von Lithium-Ionen-Batteriezellen mittels kenngrößenbasierter Methoden. Ph.D. Dissertation, Technischen Universität Carolo-Wilhelmina zu Braunschweig, Braunschweig, Germany, 2018. [Google Scholar]
- Schmidt, J.P. Verfahren zur Charakterisierung und Modellierung von Lithium-Ionen Zellen. Ph.D. Dissertation, Karlsruher Institut für Technologie, Karlsruhe, Germany, 2013. [Google Scholar]
- Bloom, I.; Jansen, A.N.; Abraham, D.P.; Knuth, J.; Jones, S.A.; Battaglia, V.S.; Henriksen, G.L. Differential voltage analyses of high-power, lithium-ion cells. 1. Technique and application. J. Power Sources 2005, 139, 295–303. [Google Scholar] [CrossRef]
- Pastor-Fernández, C.; Uddin, K.; Chouchelamane, G.H.; Widanage, W.D.; Marco, J. A Comparison between Electrochemical Impedance Spectroscopy and Incremental Capacity-Differential Voltage as Li-ion Diagnostic Techniques to Identify and Quantify the Effects of Degradation Modes within Battery Management Systems. J. Power Sources 2017, 360, 301–318. [Google Scholar] [CrossRef]
- Liao, Q.; Mu, M.; Zhao, S.; Zhang, L.; Jiang, T.; Ye, J.; Shen, X.; Zhou, G. Performance assessment and classification of retired lithium ion battery from electric vehicles for energy storage. Int. J. Hydrogen Energy 2017, 42, 18817–18823. [Google Scholar] [CrossRef]
- Wolter, M.; Fauser, G.; Bretthauer, C.; Roscher, M.A. End-of-Line Testing and Formation Process in Li-Ion Battery Assembly Lines. In Proceedings of the 9th International Multi-Conference on Systems, Signals and Devices, Chemnitz, Germany, 20–23 March 2012. [Google Scholar]
- KOKAM Li-ion/Polymer Cell. Available online: https://kokam.com/wp-content/uploads/2016/03/SLPB-Cell-Brochure.pdf (accessed on 13 January 2021).
- Kurzweil, P.; Dietlmeier, O.K. Elekotrochemische Speicher—Superkondensatoren, Batterien, Elektrolyse-Wasserstoff, Rechtliche Rahmenbedingungen; Springer: Wiesbaden, Germany, 2018; pp. 29–30, 233–235. [Google Scholar]
- Wenzl, H. Batteries—Capacity. In Encyclopedia of Electrochemical Power Sources 2009; Garche, J., Ed.; Elsevier Science: Amsterdam, The Netherlands, 2009; pp. 395–400. [Google Scholar]
- Keil, P.; Jossen, A. Charging protocols for lithium-ion batteries and their impact on cycle life—An experimental study with different 18650 high-power cells. J. Energy Storage 2016, 6, 125–141. [Google Scholar] [CrossRef]
- Winter, M.; Besenhard, J.O.; Spahr, M.E.; Novak, P. Insertion Electrode Materials for Rechargeable Lithium Batteries. Adv. Mater. 1998, 10, 725–763. [Google Scholar] [CrossRef]
- Dubarry, M.; Truchot, C.; Liaw, B.Y. Synthesize battery degradation modes via a diagnostic and prognostic model. J. Power Sources 2012, 219, 204–216. [Google Scholar] [CrossRef]
- Barai, A.; Uddin, K.; Widanage, W.D.; McGordon, A.; Jennings, P. A study of the influence of measurement timescale on internal resistance characterisation methodologies for lithium-ion cells. Sci. Rep. 2018, 21, 8. [Google Scholar] [CrossRef] [PubMed]
- Piller, S.; Perrin, M.; Jossen, A. Methods for state-of-charge determination and their applications. J. Power Sources 2001, 96, 113–120. [Google Scholar] [CrossRef]
- Ratnakumar, B.V.; Smart, M.C.; Whitcanack, L.D.; Ewell, R.C. The impedance characteristics of Mars Exploration Rover Li-ion batteries. J. Power Sources 2006, 159, 1428–1439. [Google Scholar] [CrossRef]
Figure 1.
Test scheme for the analysis of the initial state of the cells after procurement.

Figure 2.
Procedure for evaluation of the parameters.

Figure 3.
Procedure for classification.

Figure 4.
Results of the correlation analysis: (a) correlation of internal resistance with parameters and (b) correlation of total charging capacity with parameters.
Figure 4.
Results of the correlation analysis: (a) correlation of internal resistance with parameters and (b) correlation of total charging capacity with parameters.

Figure 5.
Main results of the receiving inspection: (a) distribution of the cell weight and (b) distribution of the open circuit voltage measured before running initial tests.
Figure 5.
Main results of the receiving inspection: (a) distribution of the cell weight and (b) distribution of the open circuit voltage measured before running initial tests.
Figure 6.
Main results of the short quality test: (a) 1C charge capacity vs. 5C discharge capacity, cycle C1; (b) average voltage of 1C charging step vs. average voltage of 5C discharging step, cycle C1; (c) share of 1C-CC capacity vs. share of 1C-CV capacity, cycle C1 and (d) internal resistance from 5C discharge pulse and discharge step of cycle C0.1.
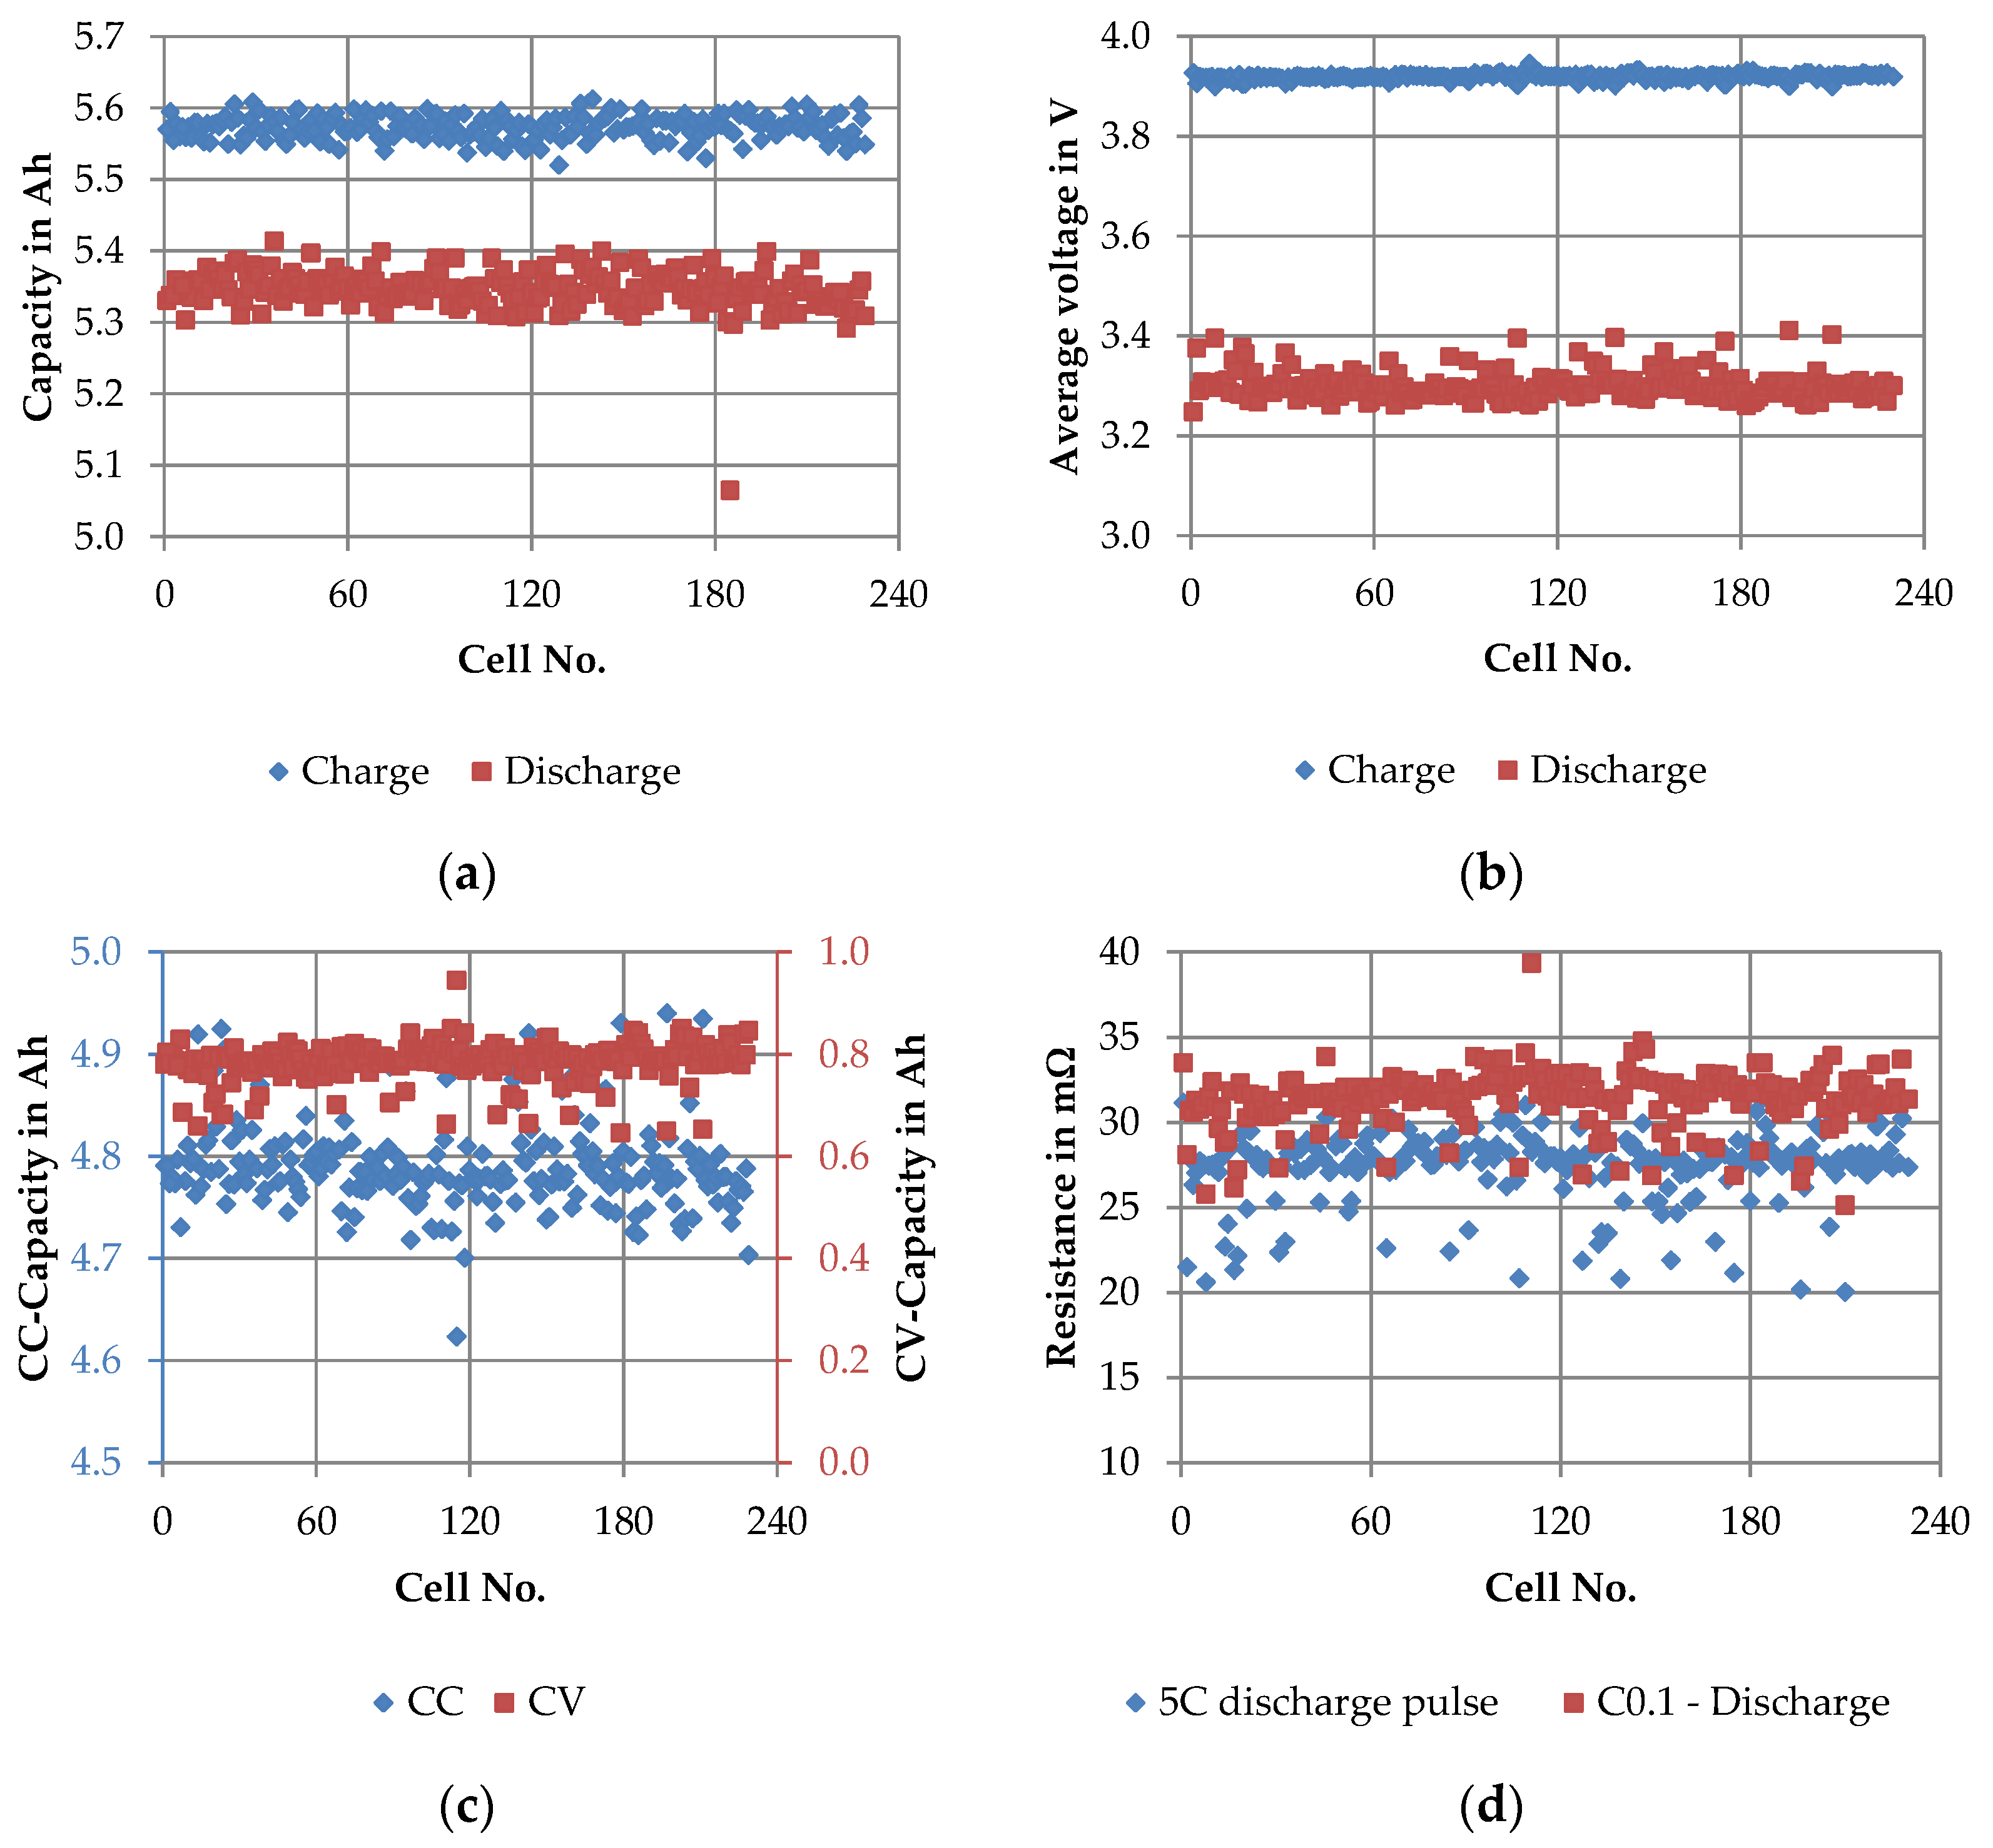
Figure 7.
Main results of the regeneration phase of the long quality test: (a) average 1C-CCCV charge capacity vs. 1C-CCCV discharge capacity, cycle C3–C7; (b) average voltage of 1C charging step vs. average voltage of 1C discharging step, cycle C3–C7 and (c) average values of 1C-CC discharge capacity vs. average values of 1C-CV discharge capacity, cycle C3–C7.

Figure 8.
The main results of the current rate dependent performance test section averaged over all cells: (a) share of the CC vs. CV discharge capacity and average capacity, cycle C9–C11 and (b) share of the time for the CC vs. CV discharge step, cycle C9–C11.
Figure 8.
The main results of the current rate dependent performance test section averaged over all cells: (a) share of the CC vs. CV discharge capacity and average capacity, cycle C9–C11 and (b) share of the time for the CC vs. CV discharge step, cycle C9–C11.

Figure 9.
The main results of the internal resistance determination of the discharge pulse at different current rates averaged over all cells: (a) state of charge (SoC) dependent absolute values of internal resistance and (b) time dependent absolute values of internal resistance at a SoC level of 50%.

Figure 10.
1C and 5C internal resistance determined in short quality test (SQT) and long quality test (LQT) at a SoC level of 30%: (a) absolute values of the 1C and 5C internal resistance; (b) subdivision in values intervals using the example of the 1C internal resistance; (c) changes in the assignment of the cells to the value intervals for 1C and 5C internal resistances and (d) changes in the assignment of the cells to the value intervals for the average voltage of 1C charging step (C1 vs. C12) and the average voltage of the 5C discharging step (C1 vs. C12).

Figure 11.
Total charging and discharging capacities of the 1C cycles determined in SQT and LQT: (a) absolute values of the 1C total charging capacities; (b) absolute values of the 1C total discharging capacities and (c) changes in the assignment of the cells to the value intervals for 1C total charging and discharging capacities between cycle 3 and cycle 7 (LQT).

Table 1.
The testing protocol of the short quality test.
| Cycle | Step | C-Rate | Cond. | Rep. | Explanation |
|---|---|---|---|---|---|
| Discharge pulse, 10 s; followed by 5 min break | 5C | - | 1 | Internal resistance | |
| C0.1 | Discharge | 1C | CC | 1 | Presetting for subsequent cycle |
| C1 | Charge/Discharge | 1C/5C | CC-CV/CC | 1 | Capacity test |
| C0.2 | Charge | 1C | CC-CV | 1 | Set original SOC |
Table 2.
The testing protocol of the long quality test.
| Cycle | Step | C-Rate | Cond. | Rep. | Explanation |
|---|---|---|---|---|---|
| C2 | Discharge | 1C | CC | 1 | Presetting for subsequent cycle |
| C3–C7 | Charge/Discharge | 1C/1C | CC-CV/CC-CV | 5 | Capacity test |
| C8 | Charge/Discharge | 0.1C/0.1C | CC-CV/CC-CV | 1 | Pseudo-OCV measurement |
| C9–C11 | Charge/Discharge | 1C/0.5C 1C/3C 1C/5C | CC-CV/CC-CV | 1 | Current rate dependent performance |
| C12 | Charge | 1C | CC | 9 | Set SoC in 10% steps |
| Charge/Discharge pulse, 30 s; each followed by 4 min break | 0.5C/0.5C 1C/1C 3C/3C 5C/5C | - | Current rate dependent internal resistance (SoC 10–90%) | ||
| Charge/Discharge | 1C/1C | CC-CV/CC | 1 | Presetting for subsequent cycle | |
| C13 | Charge | 1C | CC-CV | 1 | Set original SoC |
Table 3.
Parameters derived from full cycles.
| Parameter | Symbol | Equation | Ideal Level | |
|---|---|---|---|---|
| Average Voltage | Ua | Ua = ECC/CCC | C: ↓, D: ↑ | |
| Capacity | Total | Ct | Ct = CCC + CCV | ↑ |
| CC | CCC | ↑ | ||
| CV | CCV | ↓ | ||
| Energy | Total | Et | Et = ECC + ECV | ↑ |
| CC | ECC | ↑ | ||
| CV | ECV | ↓ | ||
| Time | Total | tt | - | ↑ |
| CC | tCC | - | ↑ | |
| CV | tCV | - | ↓ | |
| Efficiency | Voltage | ηU | ηU = Ua_D/Ua_C | ↑ |
| Capacity | ηC | ηC = Ct_D/Ct_C | ↑ | |
| Energy | ηE | ηE = Et_D/Et_C | ↑ | |
Table 4.
Parameter derived from the current pulse.
| Parameter | Symbol | Equation | Ideal Level |
|---|---|---|---|
| Internal Resistance | Ri | Ri = ∆U/∆I | ↓ |
Table 5.
Internal resistances at different current rates and pulse durations at a SoC level of 50%.
| Internal Resistance/mΩ | ||||
|---|---|---|---|---|
| Pulse Duration | 0.5C | 1C | 3C | 5C |
| 1 s | 27.325 ± 0.691 | 26.364 ± 0.602 | 22.137 ± 0.547 | 19.950 ± 0.592 |
| 10 s | 20.476 ± 0.663 | 20.120 ± 0.661 | 19.051 ± 0.596 | 18.502 ± 0.678 |
| 18 s | 21.832 ± 0.654 | 21.330 ± 0.662 | 20.024 ± 0.589 | 19.539 ± 0.687 |
Publisher’s Note: MDPI stays neutral with regard to jurisdictional claims in published maps and institutional affiliations. |
© 2021 by the authors. Licensee MDPI, Basel, Switzerland. This article is an open access article distributed under the terms and conditions of the Creative Commons Attribution (CC BY) license (http://creativecommons.org/licenses/by/4.0/).
Share and Cite
MDPI and ACS Style
Ryll, K.; Hoffmann, L.; Landrath, O.; Lienesch, F.; Kurrat, M. Key Figure Based Incoming Inspection of Lithium-Ion Battery Cells. Batteries 2021, 7, 9. https://0-doi-org.brum.beds.ac.uk/10.3390/batteries7010009
AMA Style
Ryll K, Hoffmann L, Landrath O, Lienesch F, Kurrat M. Key Figure Based Incoming Inspection of Lithium-Ion Battery Cells. Batteries. 2021; 7(1):9. https://0-doi-org.brum.beds.ac.uk/10.3390/batteries7010009
Chicago/Turabian StyleRyll, Kerstin, Louisa Hoffmann, Oliver Landrath, Frank Lienesch, and Michael Kurrat. 2021. "Key Figure Based Incoming Inspection of Lithium-Ion Battery Cells" Batteries 7, no. 1: 9. https://0-doi-org.brum.beds.ac.uk/10.3390/batteries7010009
Note that from the first issue of 2016, this journal uses article numbers instead of page numbers. See further details here.