1. Introduction
Current knowledge of stream fish ecology—including such critical aspects as individual dispersal and habitat use—is based primarily on observations of post-larval stages. While it has long been recognized that year-class strength and population dynamics are driven by larval survival in marine systems [
1,
2,
3,
4], relatively little is known in river and stream systems [
5]. Spatiotemporal patterns of larval dispersal and habitat use in freshwater systems [
6,
7,
8] are unexplored for most species, especially for species lacking economic importance. To relate abundance of larval fishes to population persistence and dynamics, we need a better understanding of the ecology of fish larvae. Unfortunately, studies of larval fish have been scarce due to the difficulty in collecting them effectively and identifying individuals to species [
9].
Identification of larval fishes to species is complicated by their rapid progress through different developmental stages and poorly defined expression of morphological or morphometric characters that distinguish closely related species at later life stages [
9]. With co-occurrence of closely related species in a system, investigators often cannot reliably identify larval fishes to species [
6,
8]. For some purposes—e.g., assessment of the occurrence or abundance of imperiled species—identification to species is critical.
Molecular genetics-based tools can help overcome the difficulty of larval fish identification and facilitate studies of larval fish ecology, but these tools may need to be refined for species-specific applications. Sequencing of mitochondrial genes, especially cytochrome oxidase I (
COI), has proven a fast, inexpensive way to accurately identify individuals to species [
10,
11,
12]. The approach has been applied to characterize larval fish aggregations in various ecological contexts. Pegg et al. [
13] assessed mitochondrial DNA barcode-based identification of fish larvae in the southern Great Barrier Reef of Australia, and found both hypervariable region and
COI sequences sufficiently diverse to support robust species identification. Examining early life-stages of marine fishes from the Yucatan Peninsula of Mexico, Valdez-Moreno et al. [
14] revealed major range extensions and overlooked taxa, as well as new information about spawning locality and time for hogfish,
Lachnolaimus maximus. Burghart et al. [
15] applied DNA barcoding and showed disparity between the compositions of planktonic fish egg and larval communities within Tampa Bay, Florida (USA). DNA barcoding elucidated multiple, complex reproductive interactions among stream-dwelling cyprinids associated with gravel nests built by chubs
Nocomis sp. [
16,
17,
18]. Comparison of DNA barcoding and morphological identification of larval fish and embryos from Lake Huron in Canada [
19] showed that while each method has pros and cons, barcoding was more cost-effective and efficient for monitoring at a large scale. However, applications of DNA barcoding to the study of freshwater stream fish communities are relatively few.
Darters (Percidae: Etheostomatinae) are small, often sexually dimorphic and dichromatic freshwater fishes of the genera
Percina,
Etheostoma, and
Ammocrypta [
20]. The southeastern United States is the center of diversity for darters [
21], resulting from a natural history of allopatric speciation and diversification [
22,
23,
24,
25] that gave rise to 205 described members of the genus
Etheostoma and 54 of the genus
Percina [
26]. Many darters are imperiled and subject to legal protection under the U.S. Endangered Species Act or analogous state authorities. For example, the upper Roanoke River is home to seven darter species [
20], including the federally endangered Roanoke logperch (
Percina rex), which is endemic to the Roanoke and Nottoway river basins of Virginia and North Carolina. Chainback darter
P.
nevisense, Roanoke darter
P. roanoka, Riverweed darter
Etheostoma podostemone, Johnny darter
E. nigrum, fantail darter
E. flabellare, and glassy darter
E. vitreum also occur in the upper Roanoke River drainage. All of these darters occur in other Virginia and regional rivers, and the genera are well distributed across eastern North America [
21,
22]. Hence, any technical advances in larval identification and particular findings could contribute to advances in our understanding of larval darter ecology across a wide range of streams and rivers of eastern North America.
The most effective means of collecting larval darters has not been reported. The effectiveness of alternative gears for collecting larval fishes varies with ecological context and larval behavior [
9]. Towed plankton nets are not suitable for collecting larval fishes in rapid, shallow rivers. Larvae of some species are attracted to light [
27]; light traps, such as quatrefoil traps [
28], have proved useful for collecting larvae of such species. Other larval trap designs (such as staked drift nets) work by straining larval fish passively swept by the current and retained by the mesh.
There is little information available to distinguish larvae of the seven darter species collected in this study. While Simon and Wallus [
29] described larval darters of the Ohio River drainage, including morphometric and meristic characters (pre-anal length, post-anal length, total length, pre-anal body length as a percentage of total length, numbers of pre-anal myomeres, post-anal myomeres, and total myomeres), five species in this study are native to Atlantic-slope drainages and were not included in that series of volumes, which is the most comprehensive study of larval freshwater fishes written to date. Knowledge of larval abundance and distribution is crucial for assessing vulnerability and ecological factors limiting darter populations in the Roanoke River watershed, especially in the context of manageable anthropogenic impacts (e.g., water withdrawal and urbanization) that can affect recruitment of the federally endangered Roanoke logperch
Percina rex.
In this first study of larval fishes in the upper Roanoke River system, we sampled larval darters from 18 sites and then used phenotypic characters and known mitochondrial COI gene sequences to identify larvae to species. Because of the presence of the endangered P. rex in the drainage, we focused on members of the genus Percina and aimed to: (1) assess the utility of phenotypic characters as a means for identifying larval darters; (2) assess the utility of DNA barcoding as a means for identifying larval darters; (3) evaluate alternative methods for collecting larval darters; and (4) elucidate the relative contributions of these species to the larval drift.
2. Results
We collected 12,762 larval and juvenile fishes in 2015 and 10,258 in 2018. After visually screening all larvae (most individuals collected, which were distinguished from juveniles by the presence of a finfold and incomplete fin development) and juveniles (< 10, barely past larval stage), we identified 3433 as larval darters or unknowns (i.e., specimens in poor condition). We attempted to barcode 1368 larvae, including all Percina individuals collected. After barcoding an initial batch of 28 darter larvae representing distinct morphometric groups, we were able to sort Percina from Etheostoma visually and to remove the latter, although some were barcoded incidentally among those unidentified because of poor condition.
2.1. Molecular Identification
Our custom primers amplified a 286-bp fragment of the
COI gene, and subsequent genetic identification of larval darters generally was successful. Sequences for 1339 larvae matched archived
COI sequences for one of the seven darter species known to occur in the upper Roanoke River with 98%–100% identity over that sequence (
Table 1,
Supplemental Table S1), within the range of intraspecific variation for that region. Sequences for an additional 12 larvae matched fantail darter
Etheostoma flabellare with only 95%–97% identity; however, based on their distinct morphology and pigmentation, we are confident these 12 larvae were identified correctly as
E. flabellare. Sequences for 63 larvae matched two species, Johnny darter
E. nigrum or riverweed darter
E. podostemone, with equal identity. The inability to distinguish these species likely related to the relatively short sequence used to query the archive of
COI sequences. Hereafter, we refer to these 63 larvae as “
E. nigrum/
podostemone” and count them as a single species. Forty-one low-quality sequences failed to match any archived species with at least 98% identity and were excluded from further analyses. The darter
COI sequences that we amplified have been submitted to GenBank; sequences representing each species are shown in
Supplemental Figure S1. Overall, based on molecular markers, we identified 960 larval
Percina roanoka, 259
P. rex, 63
E. nigrum/podostemone, 36
P. nevisense, 21
E. vitreum, and 12
E. flabellare. The lower numbers of
Etheostoma were not representative of their relative abundance in the samples, but rather reflected our emphasis on collecting, identifying, and performing morphometric analyses of
Percina larvae.
2.2. Correspondence of Molecular Identifications with Phenotypic Characters
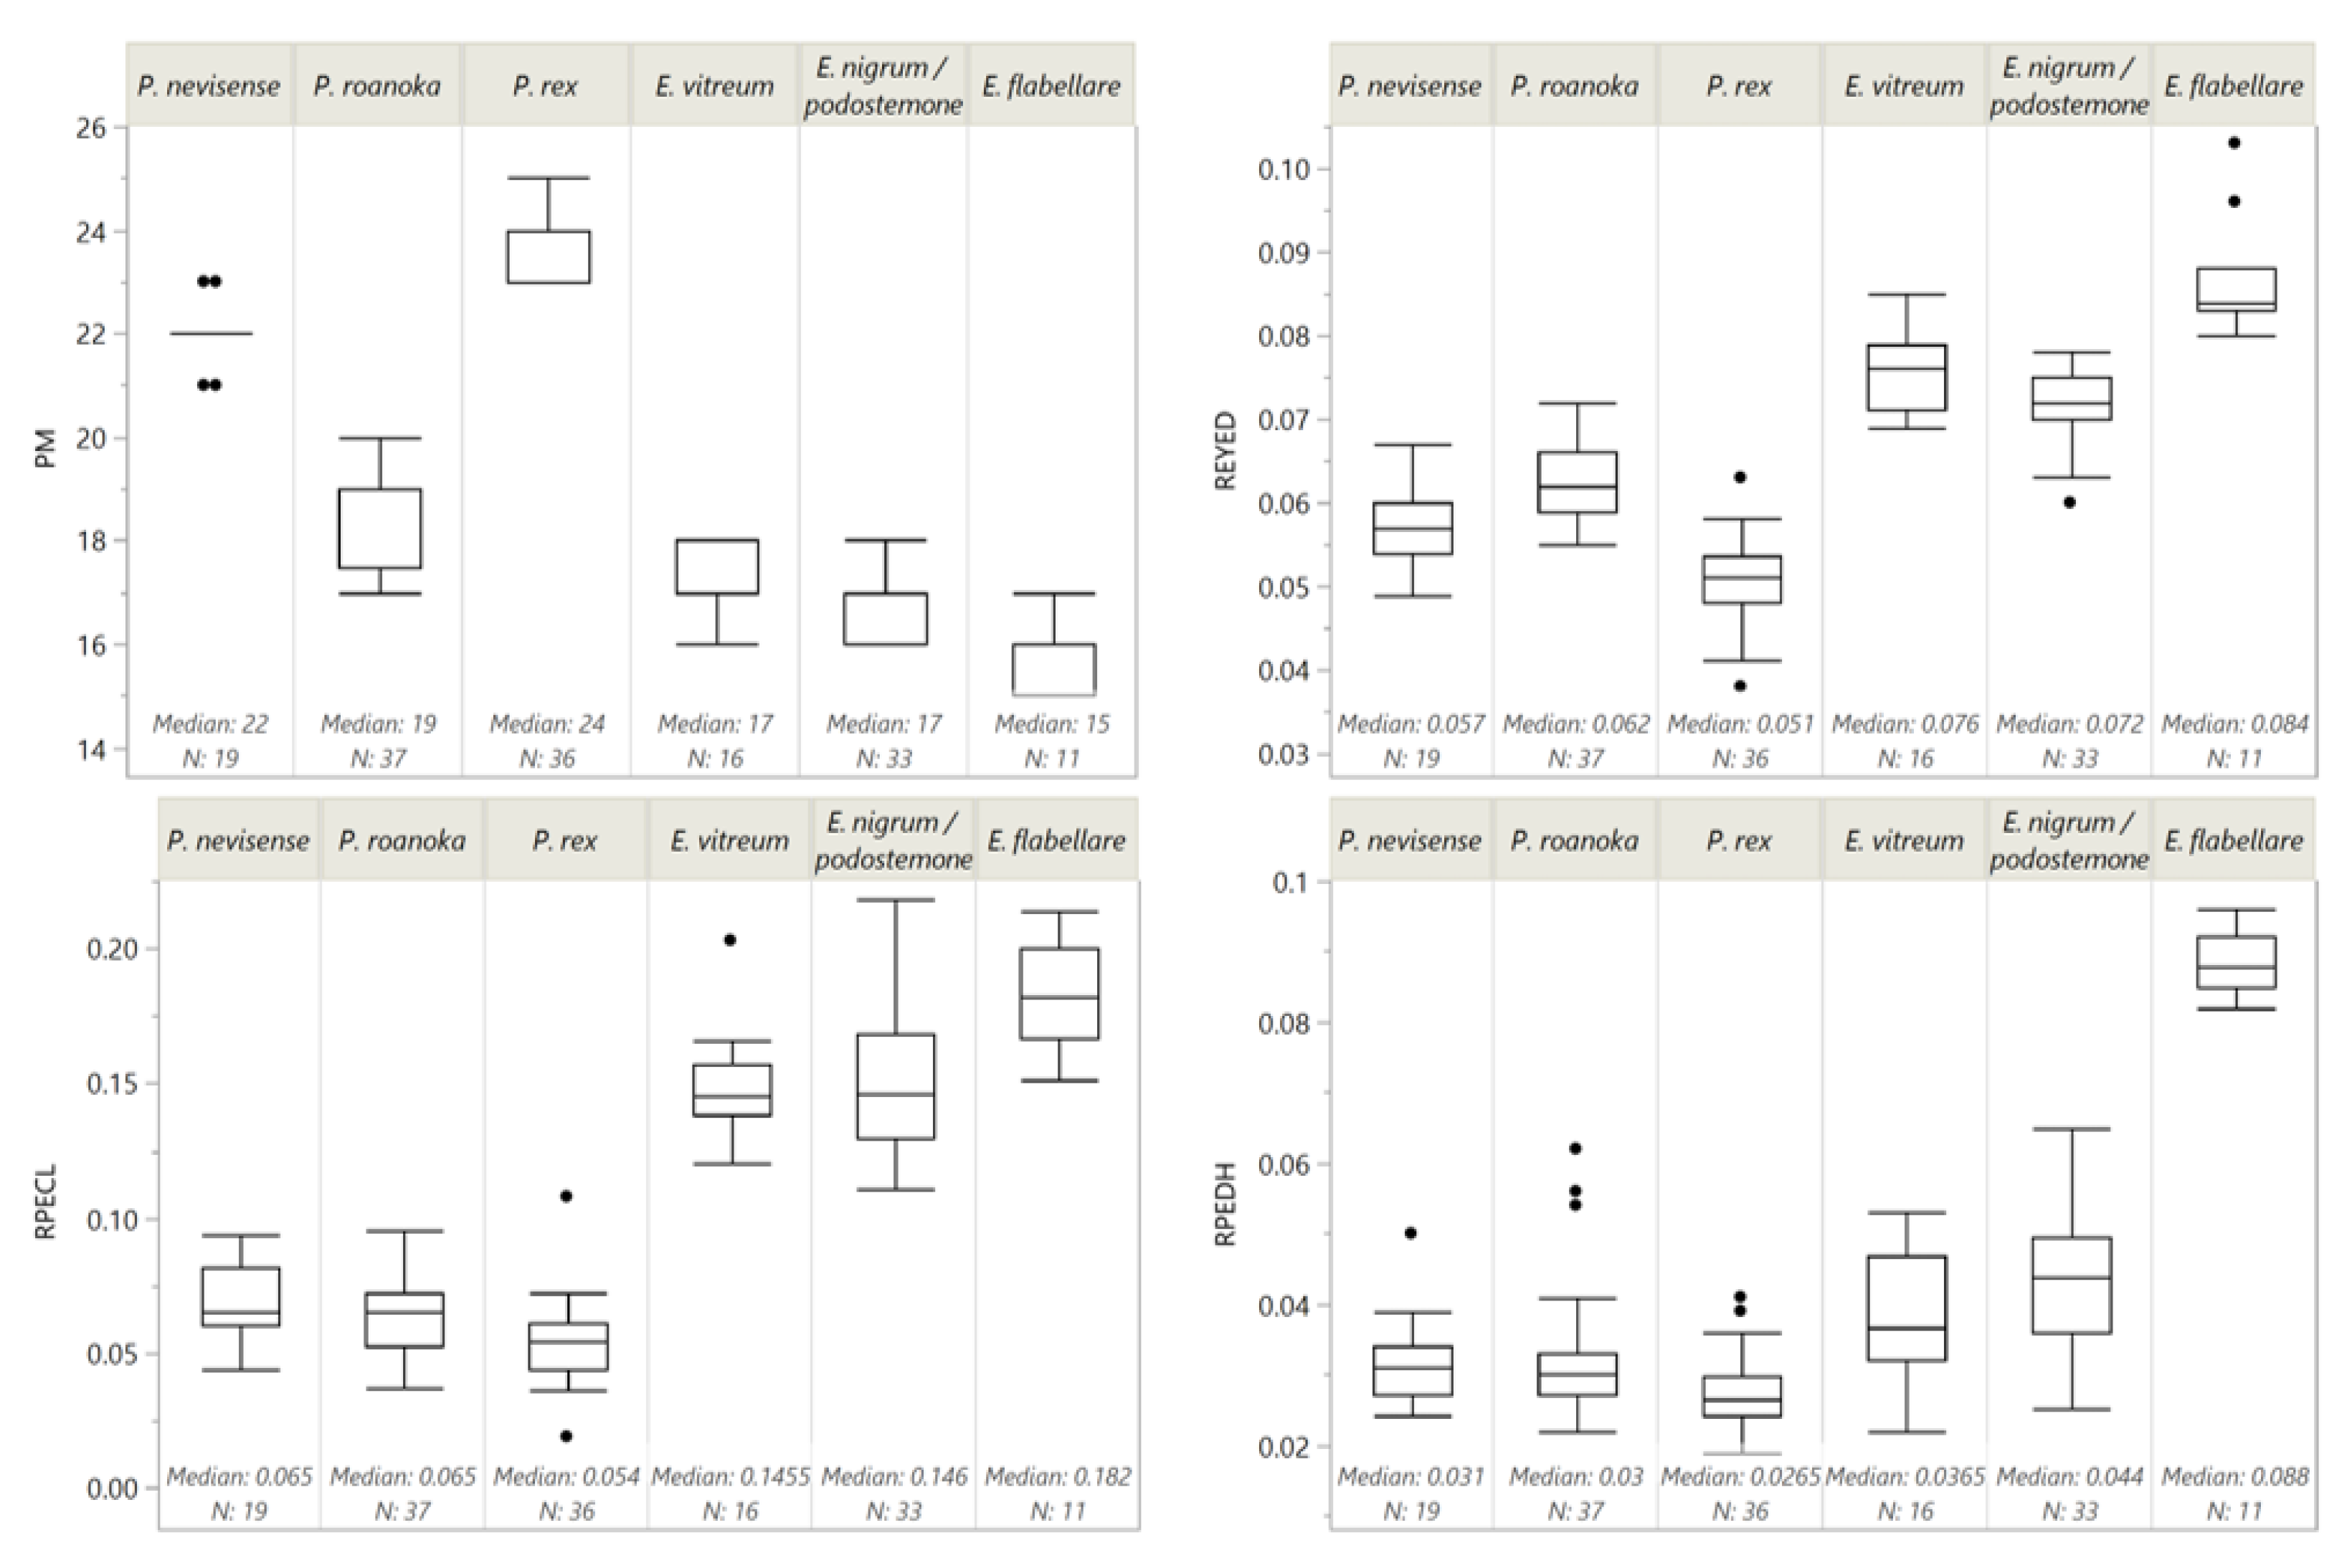
We performed morphometric measurements on 152 of the 1351 individuals collected. With the molecular identifications in hand, we assessed whether counts of pre-anal myomeres (
PM) were useful for identification of larval darters of the upper Roanoke River, as is the case for many darters [
29].
P. rex had the highest median
PM count of 24, followed by
P. nevisense (22),
P. roanoka (19),
E. nigrum/podostemone (17),
E. vitreum (17), and
E. flabellare (15). Critically for our purposes, there was overlap across species (
Figure 1); therefore,
PM count alone cannot reliably distinguish all larval darter species of the upper Roanoke River system.
Etheostoma and
Percina in our sample had completely non-overlapping distributions of relative pectoral fin length (
RPECL), with all
Etheostoma species having
RPECL ≥ 0.11 (approximately 2 × eye diameter) and all
Percina < 0.11 (1 × eye diameter) (
Figure 1).
PM completely segregated
P. roanoka (
PM < 21) from the two other
Percina species (
PM ≥ 21), but 2 of 19
P. nevisense, and 14 of 36
P. rex had
PM = 23 (
Figure 1).
E. flabellare had a completely disjoint distribution of relative caudal peduncle height (
RPEDH) (≥0.082) compared to all individuals of other species (
RPEDH ≤ 0.065) (
Figure 1).
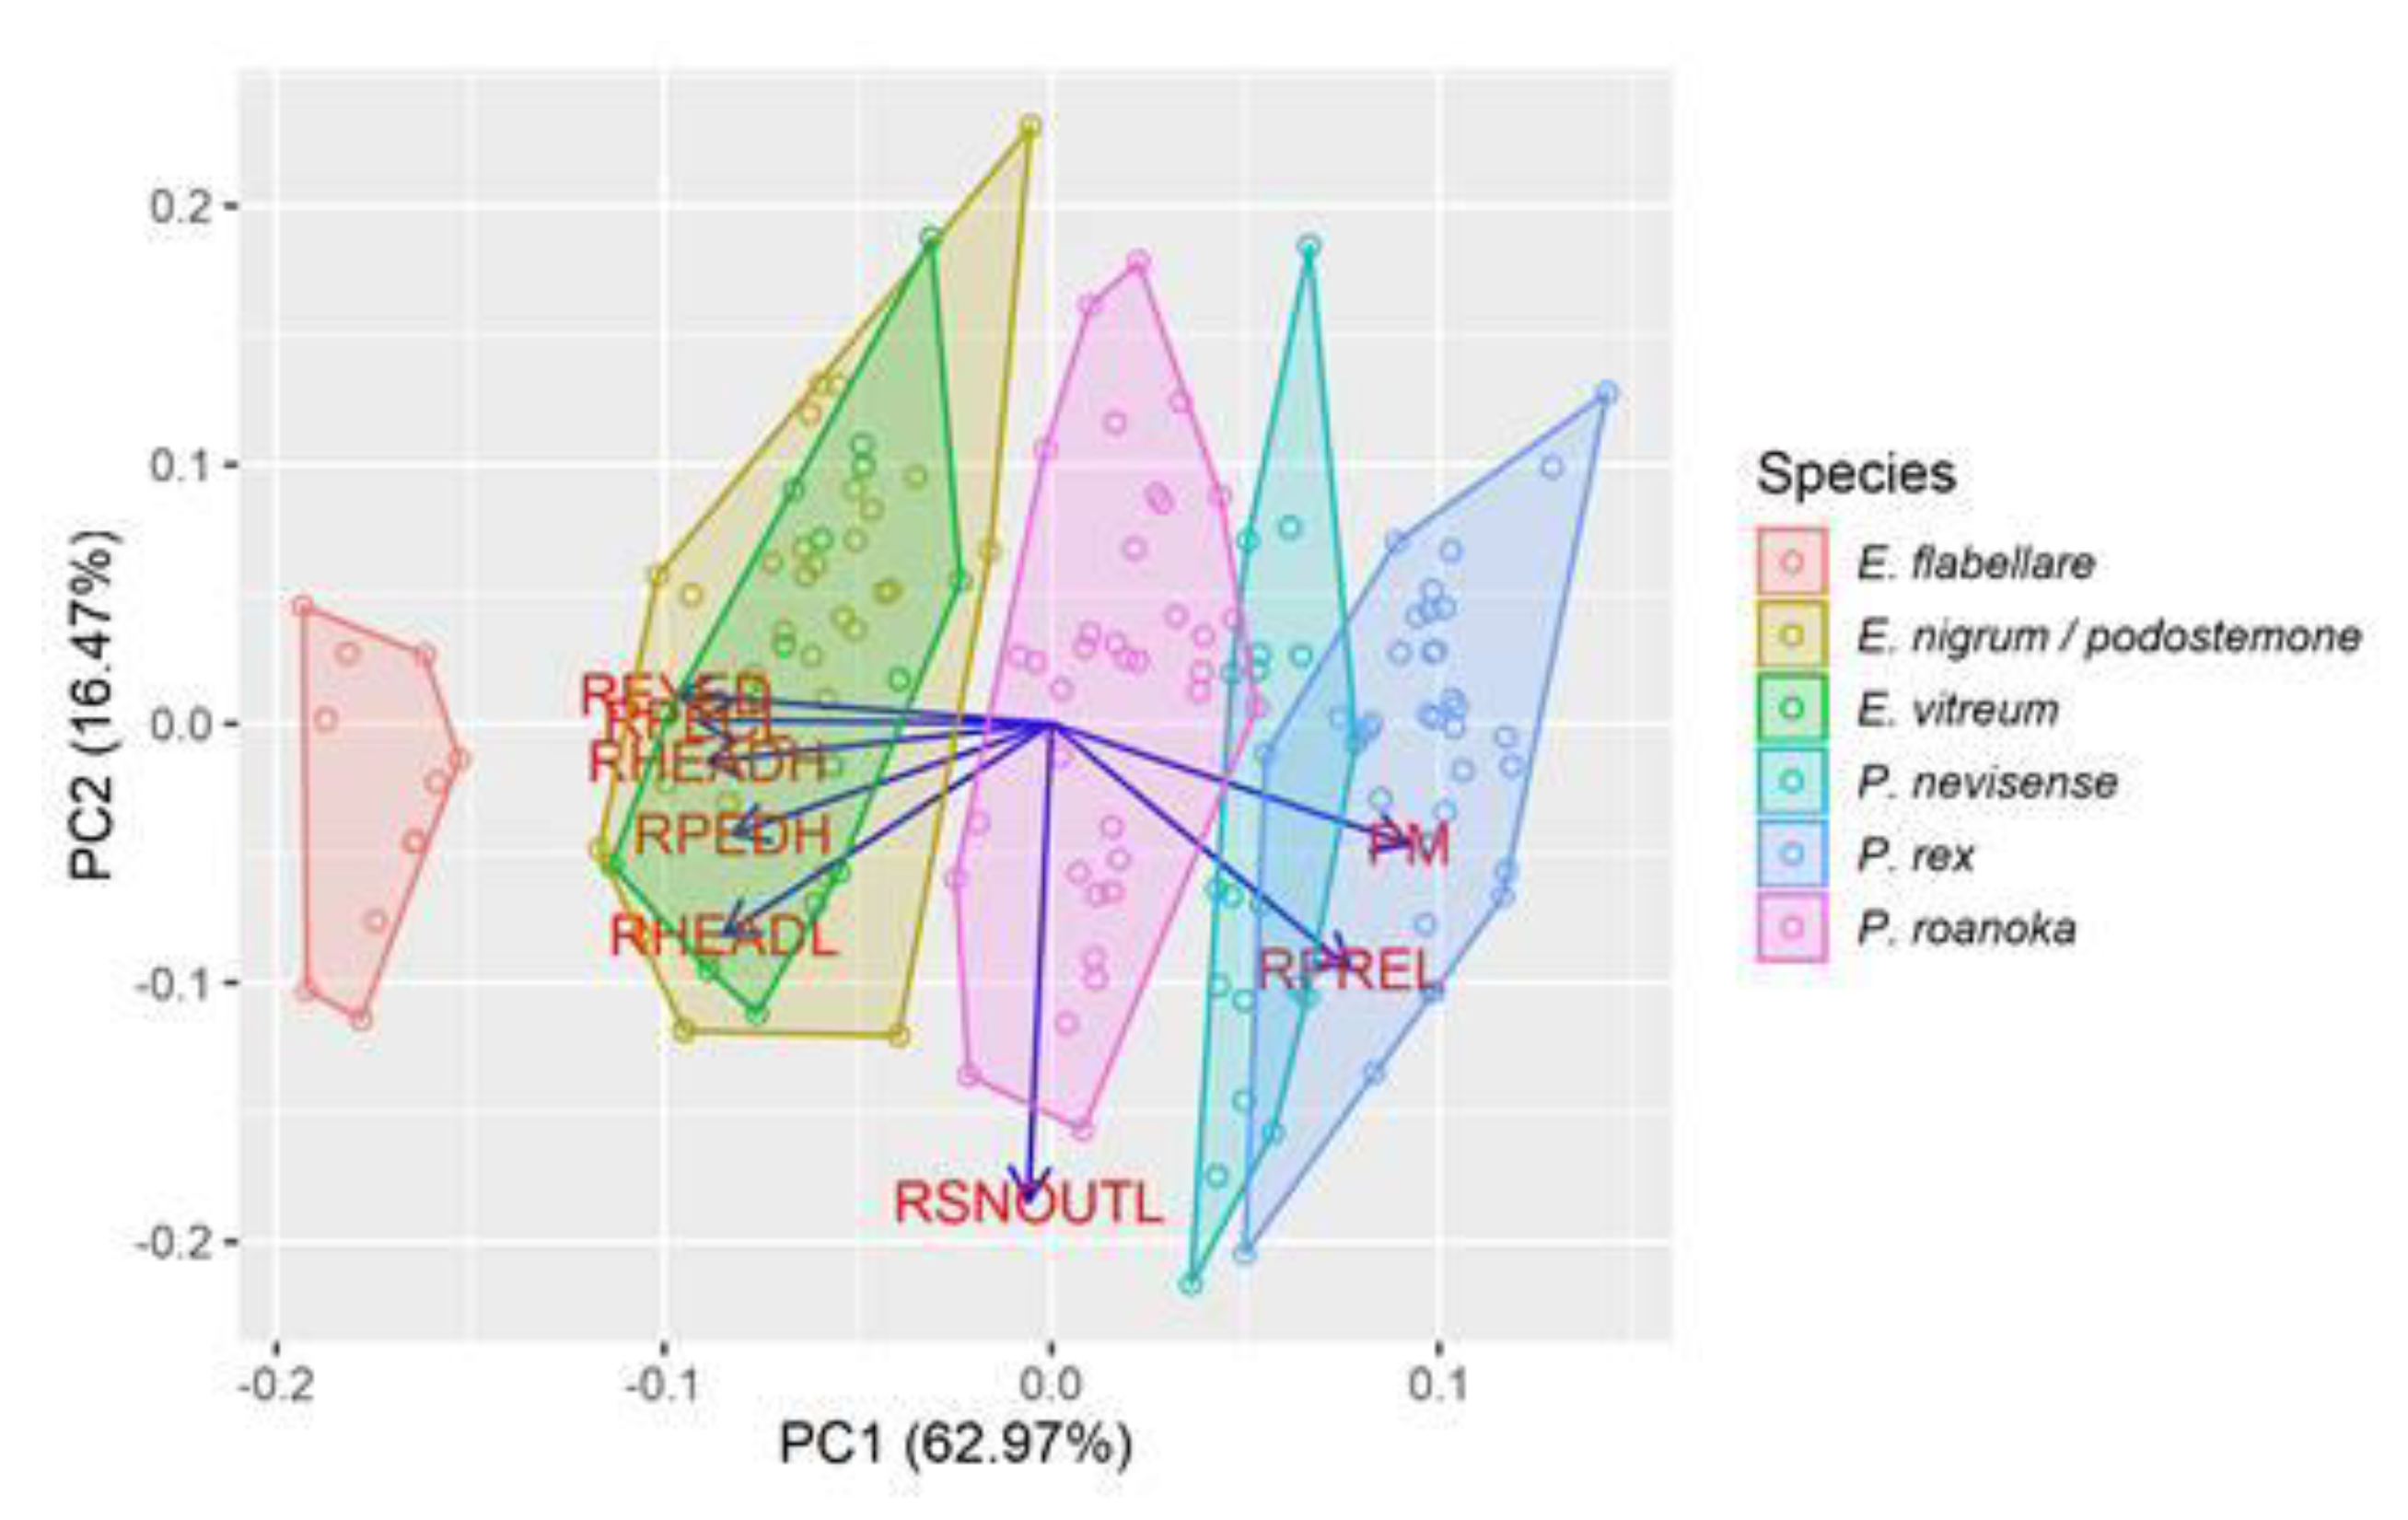
To explore how phenotypic characters for the 152 darter larvae were distributed in multivariate morphometric space, we ran a principal components analysis on eight morphometric characters using the
prcomp function in R v. 3.6.0 [
30]. Groups of larvae along the first component were generally consistent with species identifications from DNA barcoding (
Figure 2). However,
E. vitreum and
E. nigrum/podostemone overlapped broadly, and the three
Percina species overlapped marginally. The first component was positively related to
PM and relative preanal length (
RPREL) and negatively related to relative eye diameter (
REYED), relative pectoral fin length (
RPECL), relative head height (
RHEADH), least caudal peduncle height excluding finfold (
RPEDH), and relative head length (
RHEADL), and explained 63% of the morphometric variation among individuals. The second component was strongly influenced by relative snout length (
RSNOUTL), but explained only 16.5% of the variability among individuals.
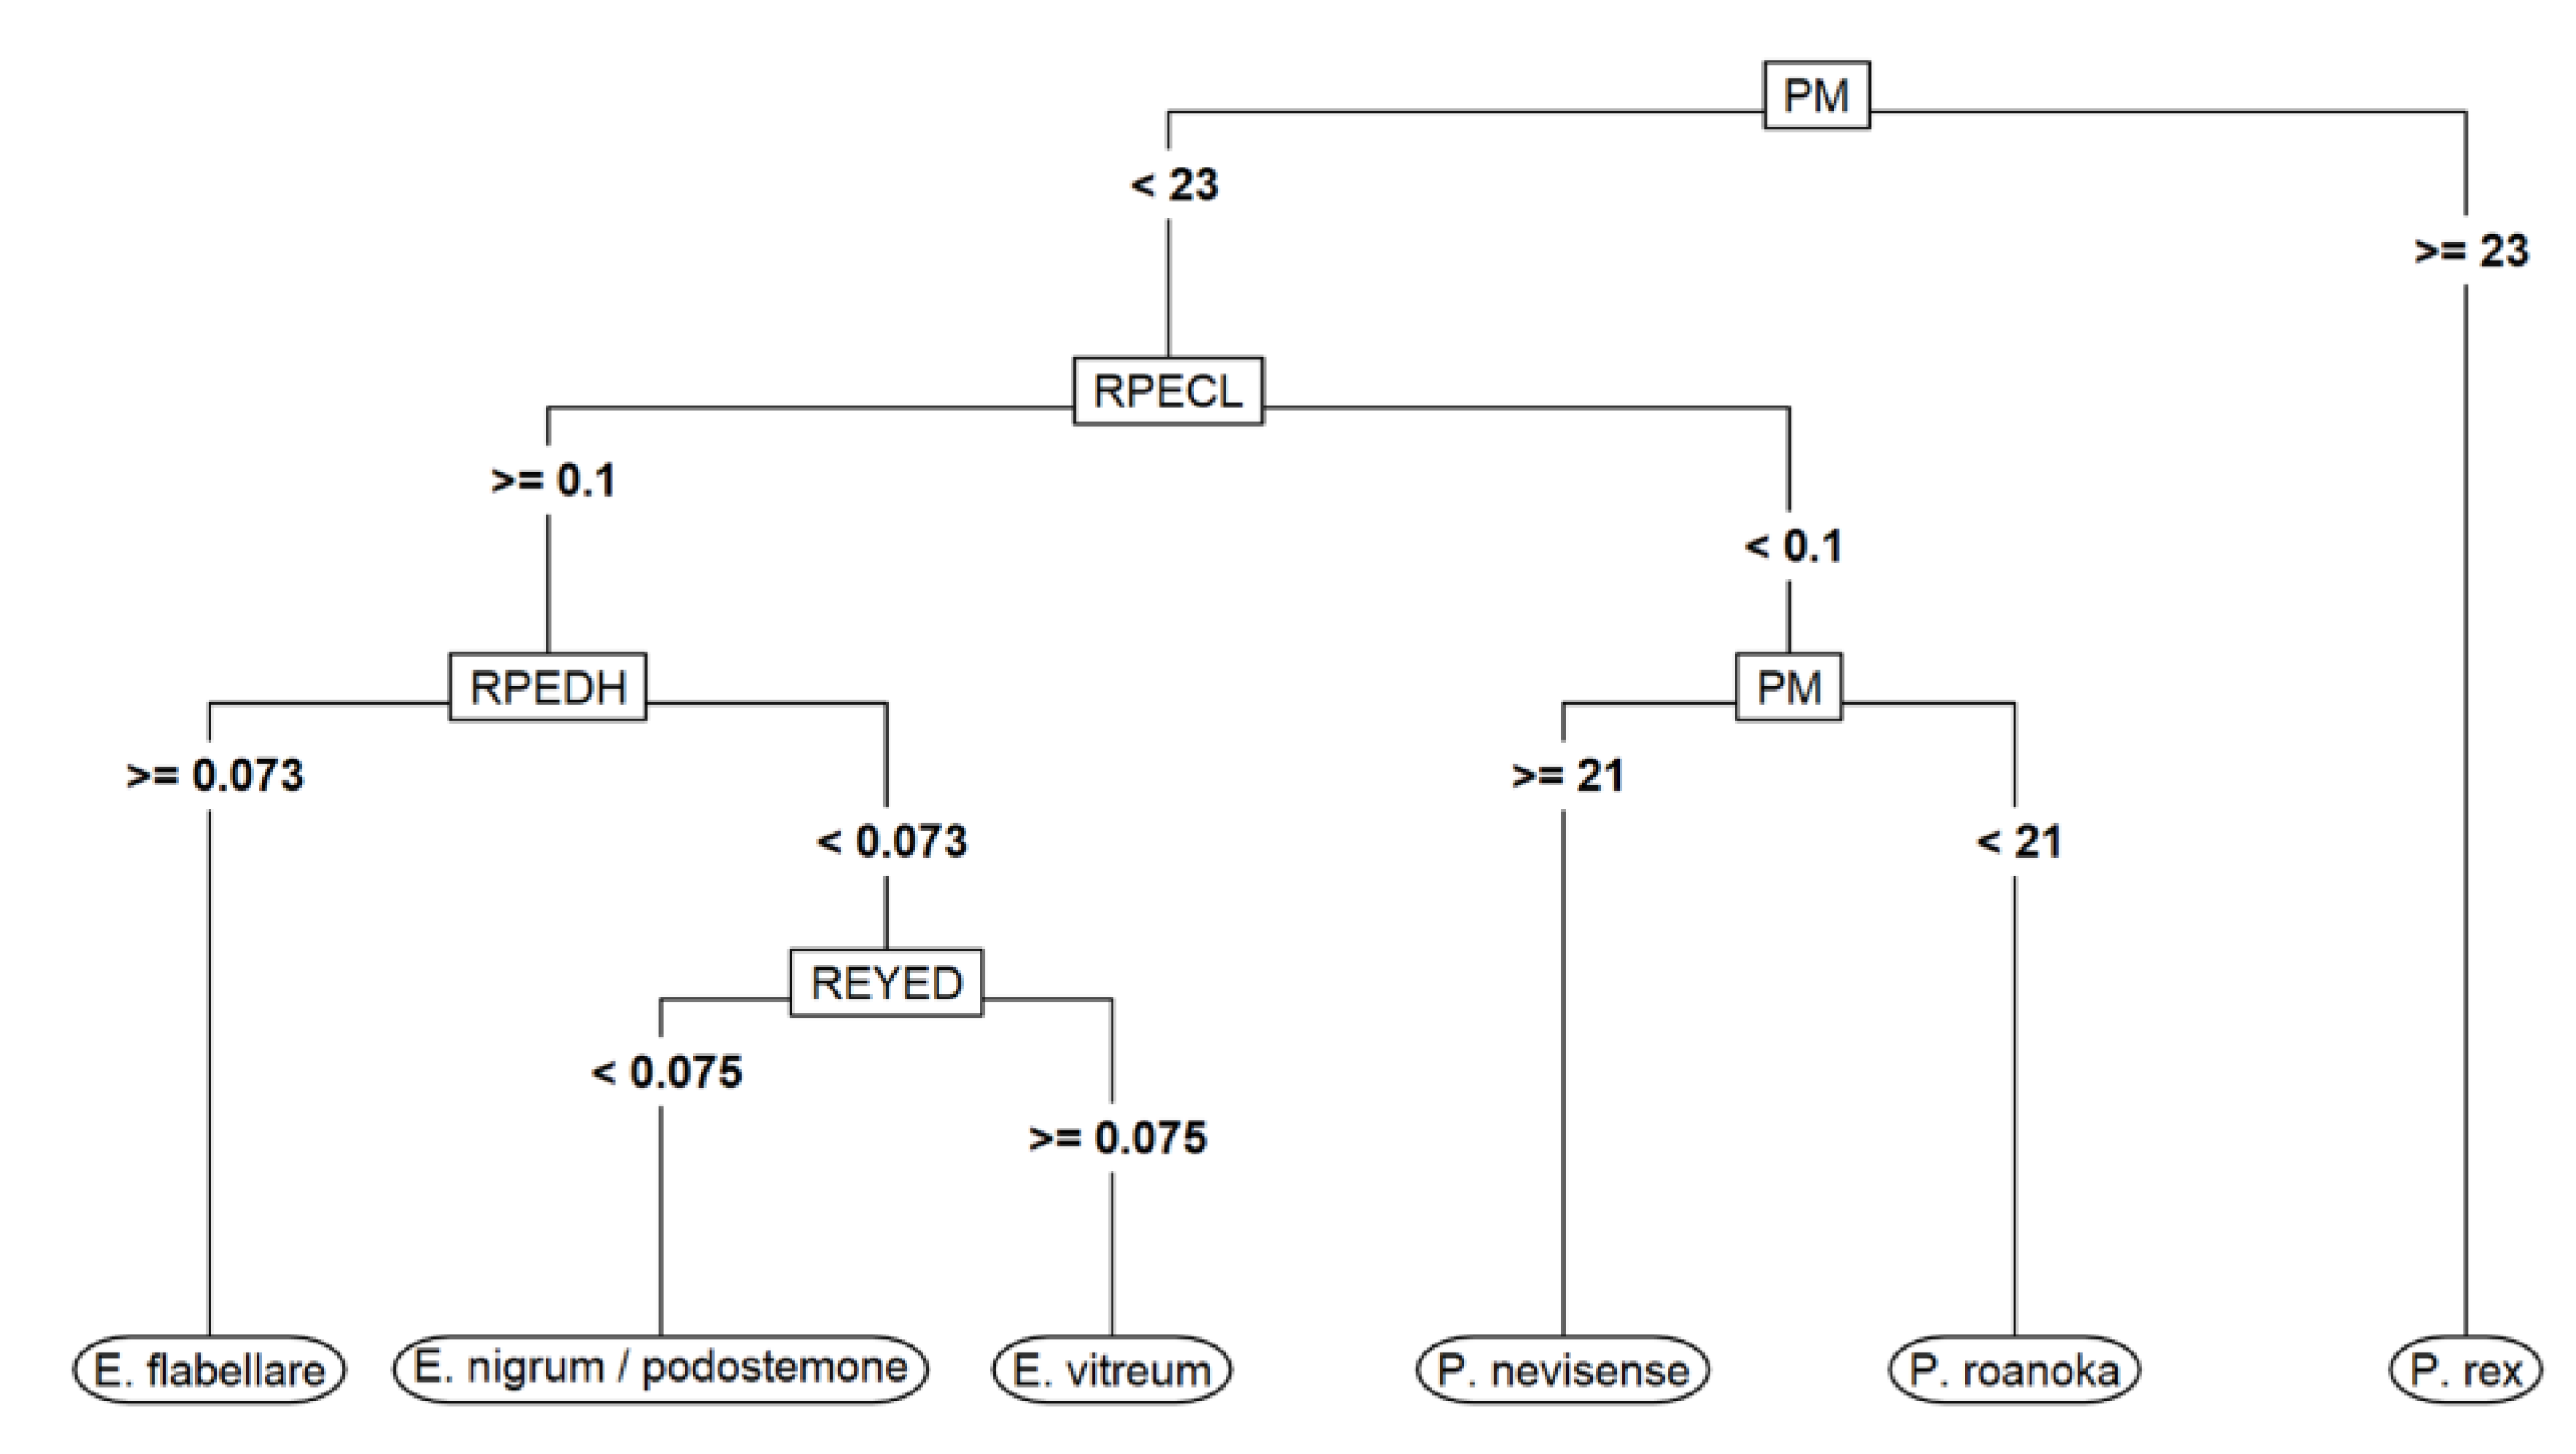
To further quantify the utility of morphometrics in identifying larval darters to species, we built a classification tree model, which is easy to interpret and has a clear graphical representation (
Figure 3). We built the tree model with the
rpart package [
31] in R 3.6.0, used 10-fold cross-validation (CV) to tune the tree-complexity parameter to maximize CV accuracy, and assessed model accuracy using predictions for each of the 152 larvae based on the CV folds in which they were held out. Important morphometrics in the classification tree included preanal myomere count (
PM),
RPECL, and
RPEDH. The other five morphometric variables were either pruned or performed poorly when used in a split (i.e., relative eye diameter–
REYED). The tree model was 100% accurate in predicting the genus (
Etheostoma or
Percina) of CV hold-outs, and 136 of 152 predictions to species were correct (89.5% overall accuracy) (
Table 1). Of the 16 misclassifications, 13 involved confusion (in both directions) between
E. vitreum and
E. nigrum/podostemone, 2 were
P. nevisense predicted as
P. rex, and 1 was
E. vitreum predicted as
E. flabellare. One species (
P. roanoka) had no prediction errors.
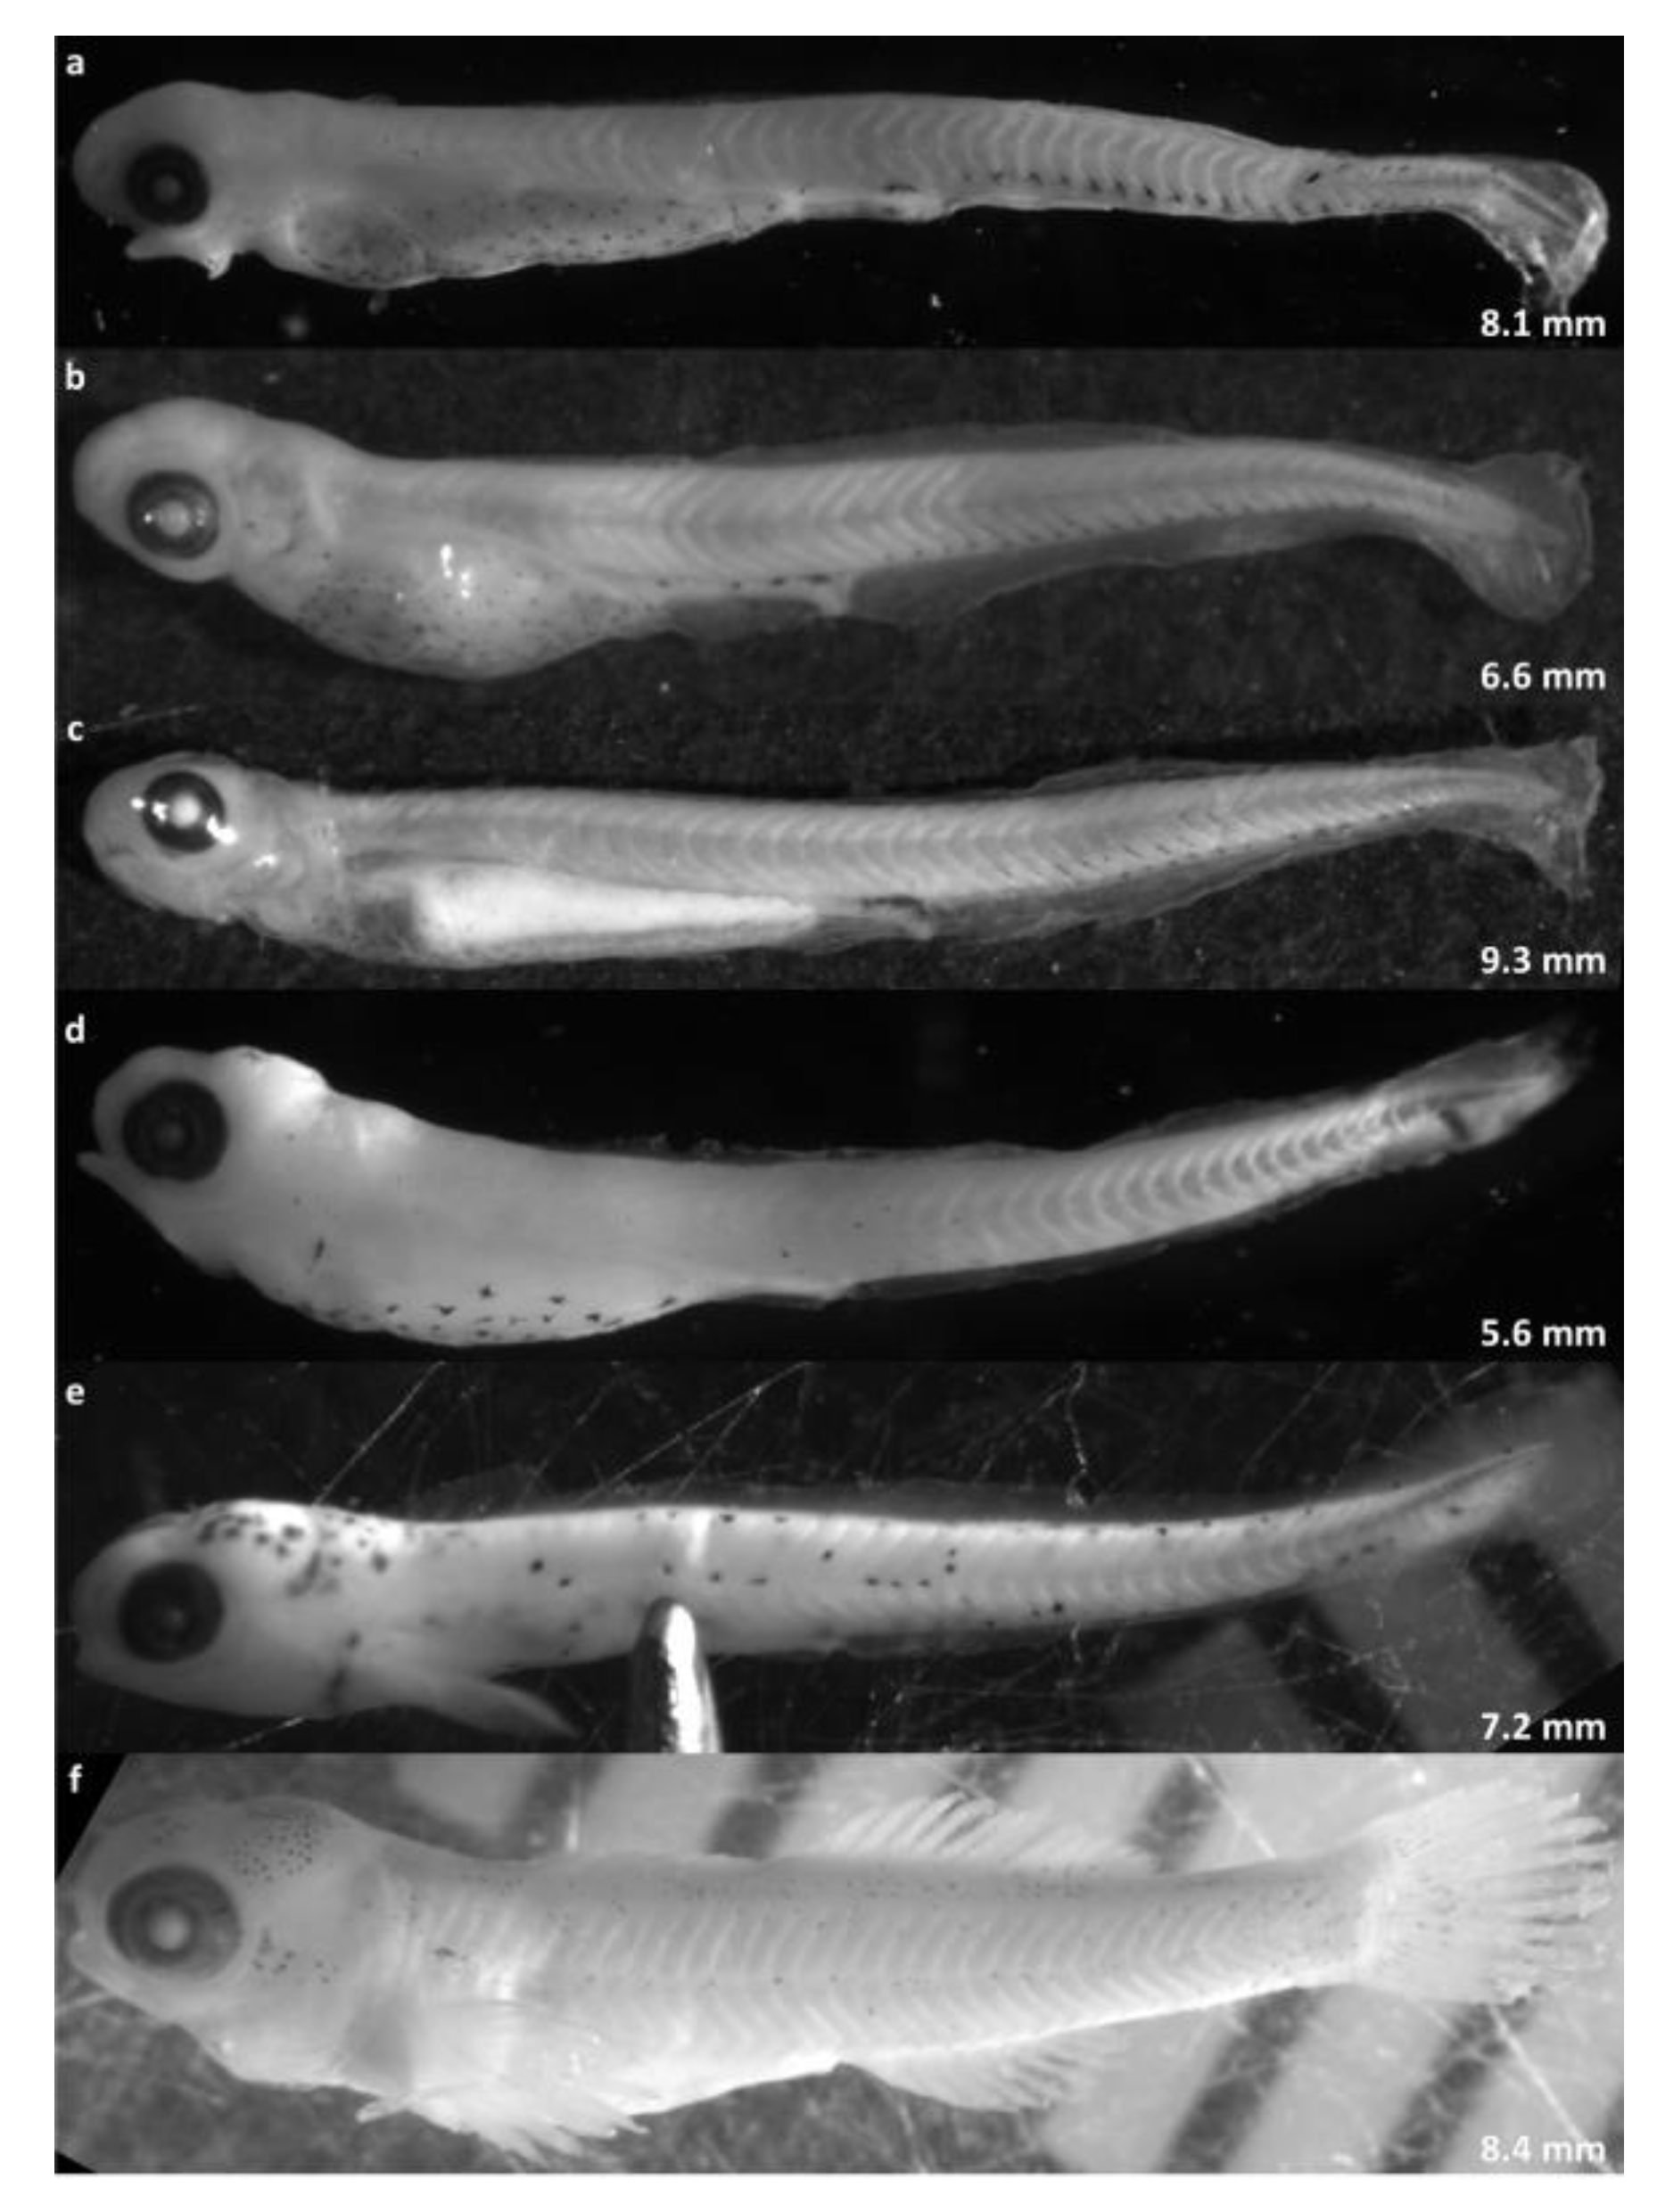
Qualitative characters, especially body pigmentation, provided additional support for the morphometric classifications described above, and were especially useful in distinguishing between genera (
Etheostoma vs.
Percina), and between the three
Etheostoma species (
Table 2,
Figure 4).
Percina larvae in our sample appeared nearly naked, with no melanophores on the cranium, dorsum, or preanal myomeres (
Figure 4a–c), whereas
Etheostoma had obvious melanophores on the cranium (optic lobe and/or cerebellum) and flecks/speckles/spots across the body (
Figure 4d–f).
E. nigrum/podostemone (
Figure 4e) were readily distinguished by black spots scattered across the body, cranium, and yolk sac, which did not occur on any other species. Among individuals identified as
Percina, most showed very similar pigmentation. Only subtle (and perhaps unreliable) differences in the shape (stellate versus punctate) and position (more or less ventral) of melanophores on the yolk sac and postanal myosepta were noted among
Percina larvae.
2.3. Effectiveness and Size Selectivity of Gear Types
Gear types varied considerably in their capture efficacy for larval darters. We collected larval darters of all six species in each of the three gear types used, but most (80%) of the 1351 percid larvae were collected in drift nets, a passive sampling gear most likely to capture individuals unable to swim upstream against the current (
Table 3). Quatrefoil (14% of the catch) and funnel (6%) light traps, which capture larvae that actively swim into them, were much less effective at collecting larval darters, although light traps, especially funnel traps, appeared to show greater selectivity for
Etheostoma than for
Percina.
Comparing mean larval TL (M ± SD) between gear types, larvae caught by drift net (7.28 ± 1.55 mm) were significantly shorter than those caught by quatrefoil light trap (9.35 ± 2.93 mm, t = −13.69, p < 0.0001, df = 1315). This pattern held for P. rex, P. roanoka, and E. nigrum/podostemone. For the other three darter species, low sample size for one or more gear types precluded statistical comparisons of TL. Mean TL of larval darters (all species combined) caught by drift net did not differ significantly between 2015 (7.35 ± 1.72 mm) and 2018 (7.21 ± 1.36 mm, t = 1.49, p = 0.1372, df = 1014).
2.4. Drift of Percina Larvae
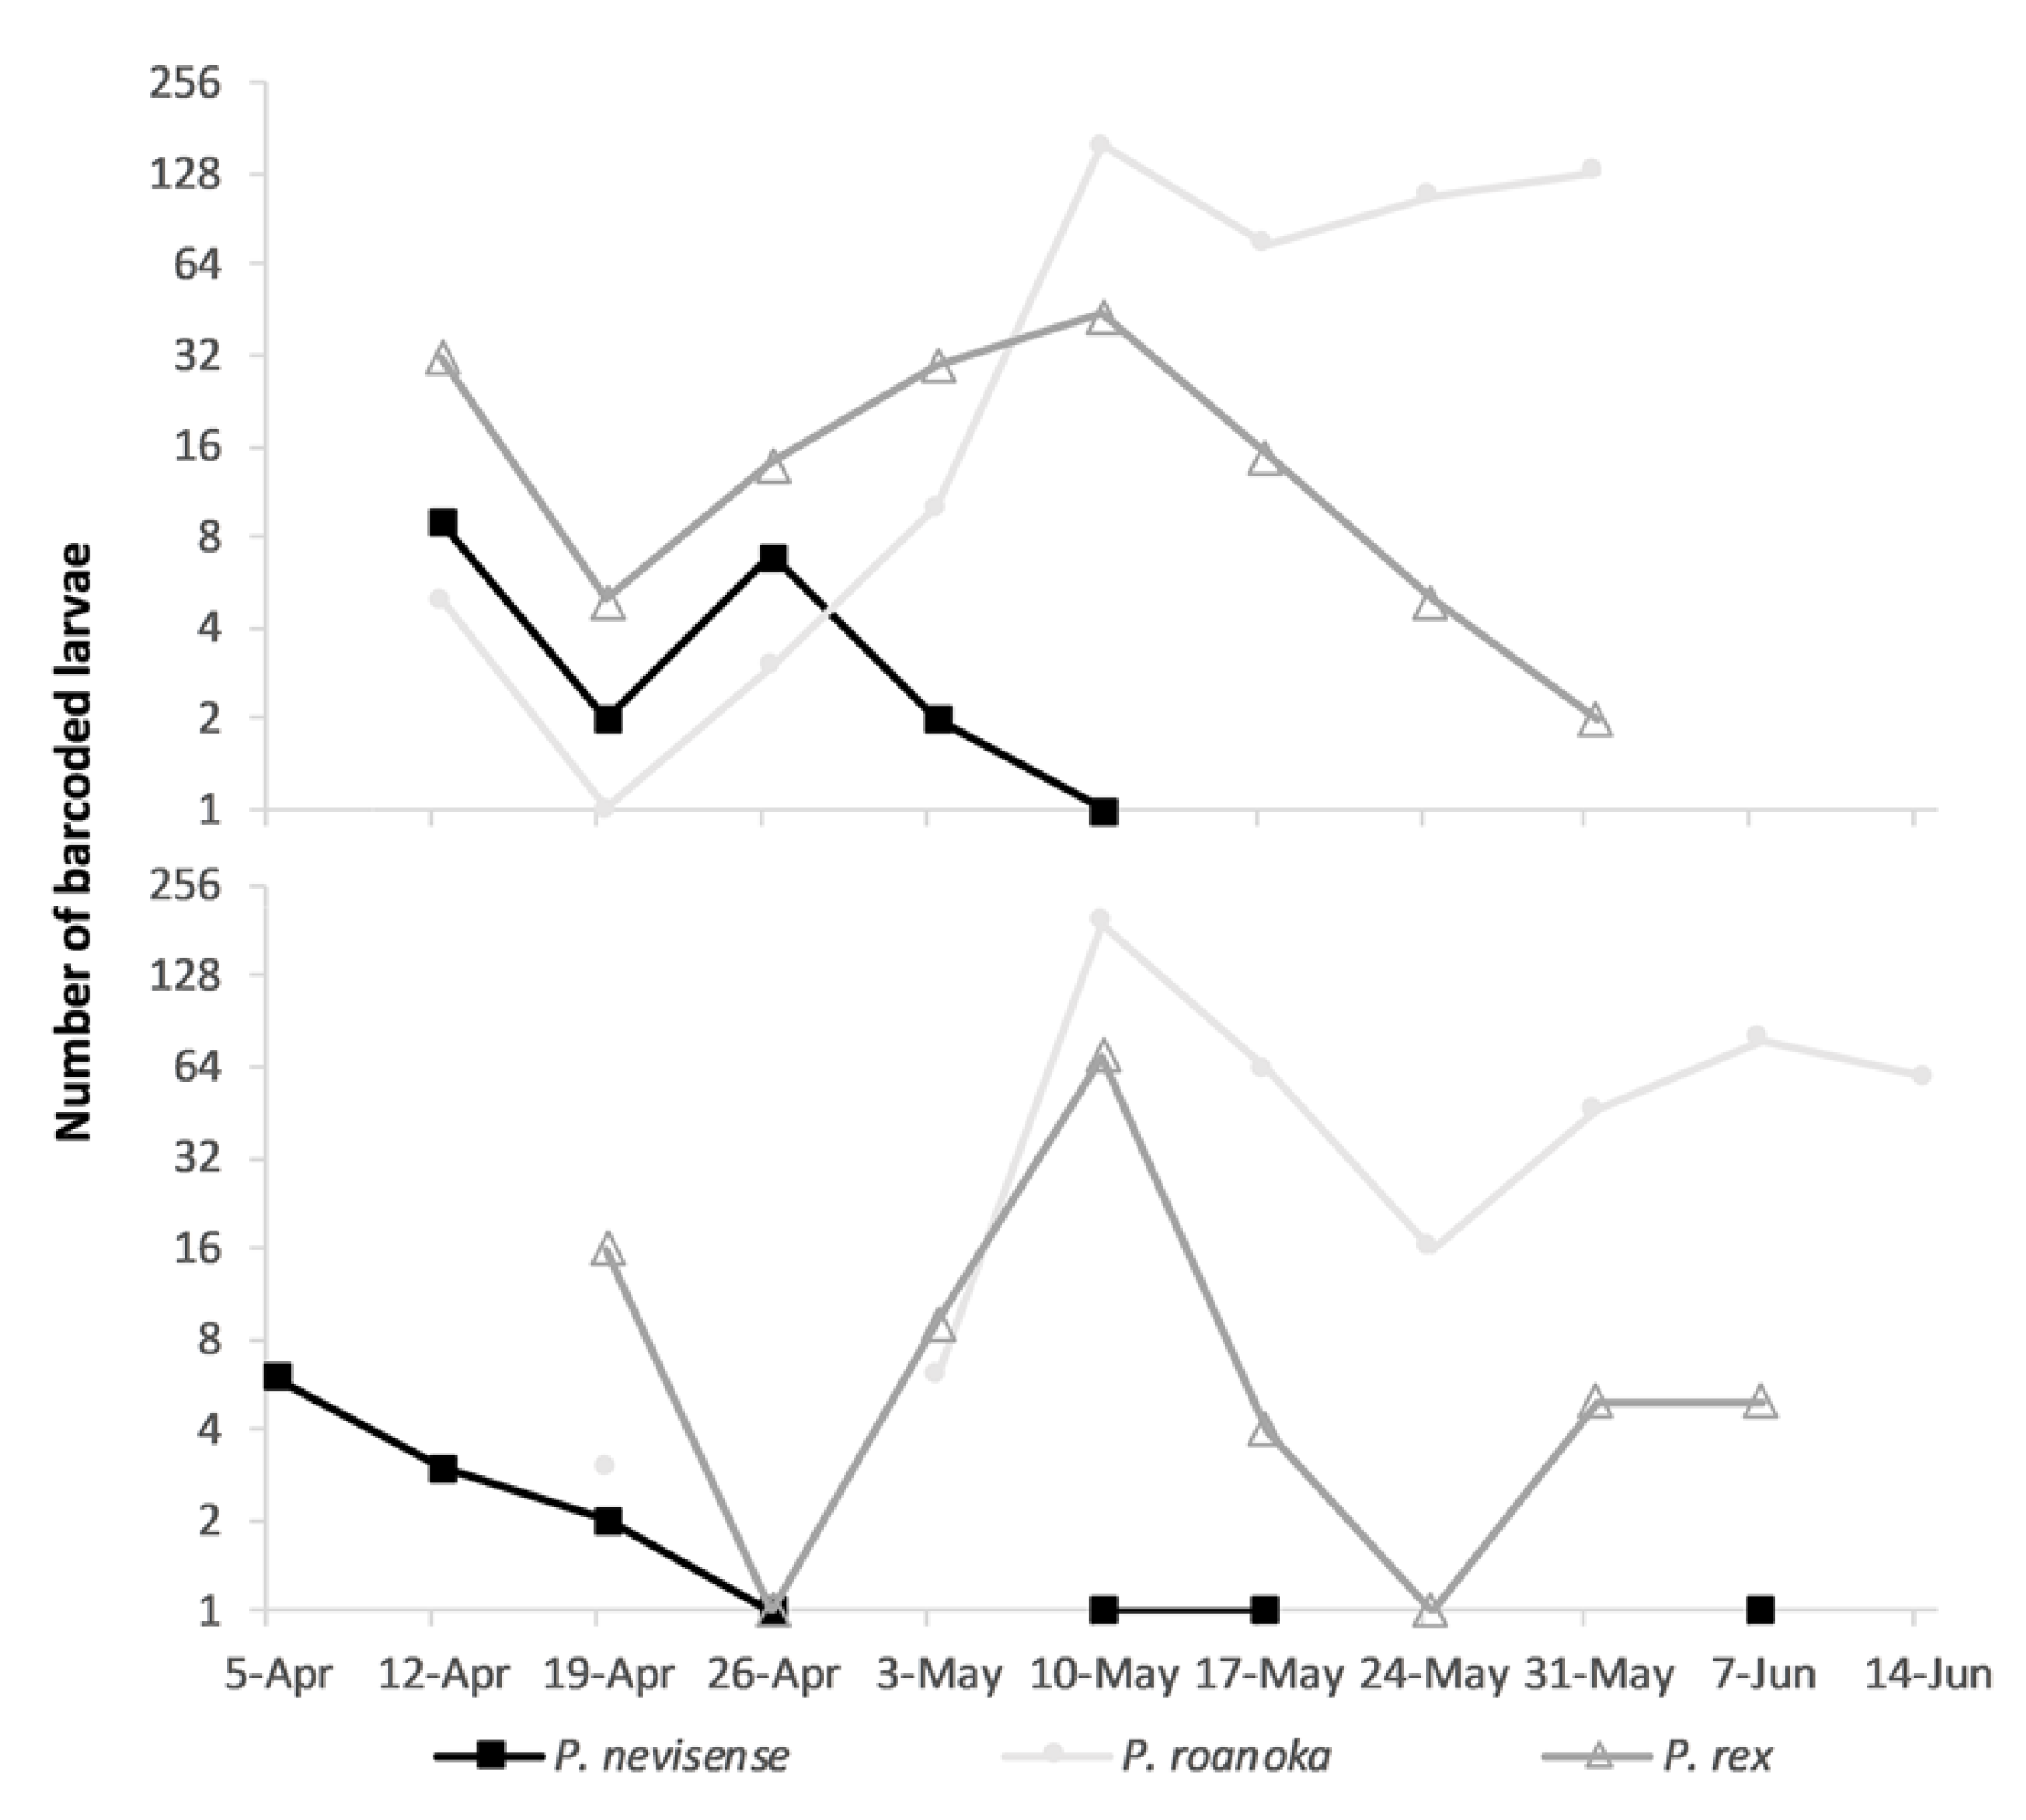
We focus our description of larval drift on
Percina because our larval sampling and identification efforts targeted
Percina and therefore likely underestimated abundance of
Etheostoma. In 2015, we began sampling on 18 March, but did not collect any larval darters until 12 April. In 2018, we started sampling on 3 April, and caught our first larval darter (
P. nevisense) on 5 April (
Figure 5,
Supplemental Figure S2).
Etheostoma larvae did not appear in samples until 29 April 2015 and 8 May 2018. By the end of our sampling period (4 June 2015 and 15 June 2018), larval emergence for
P. rex and
P. nevisense appeared to have ended, while our catch of
P. roanoka continued (
Figure 5). We caught
P. nevisense during 12 April–14 May in 2015 and 5 April–7 June in 2018. We caught
P. rex during 12 April–4 June in 2015 and 20 April–11 June in 2018. In 2015, we captured
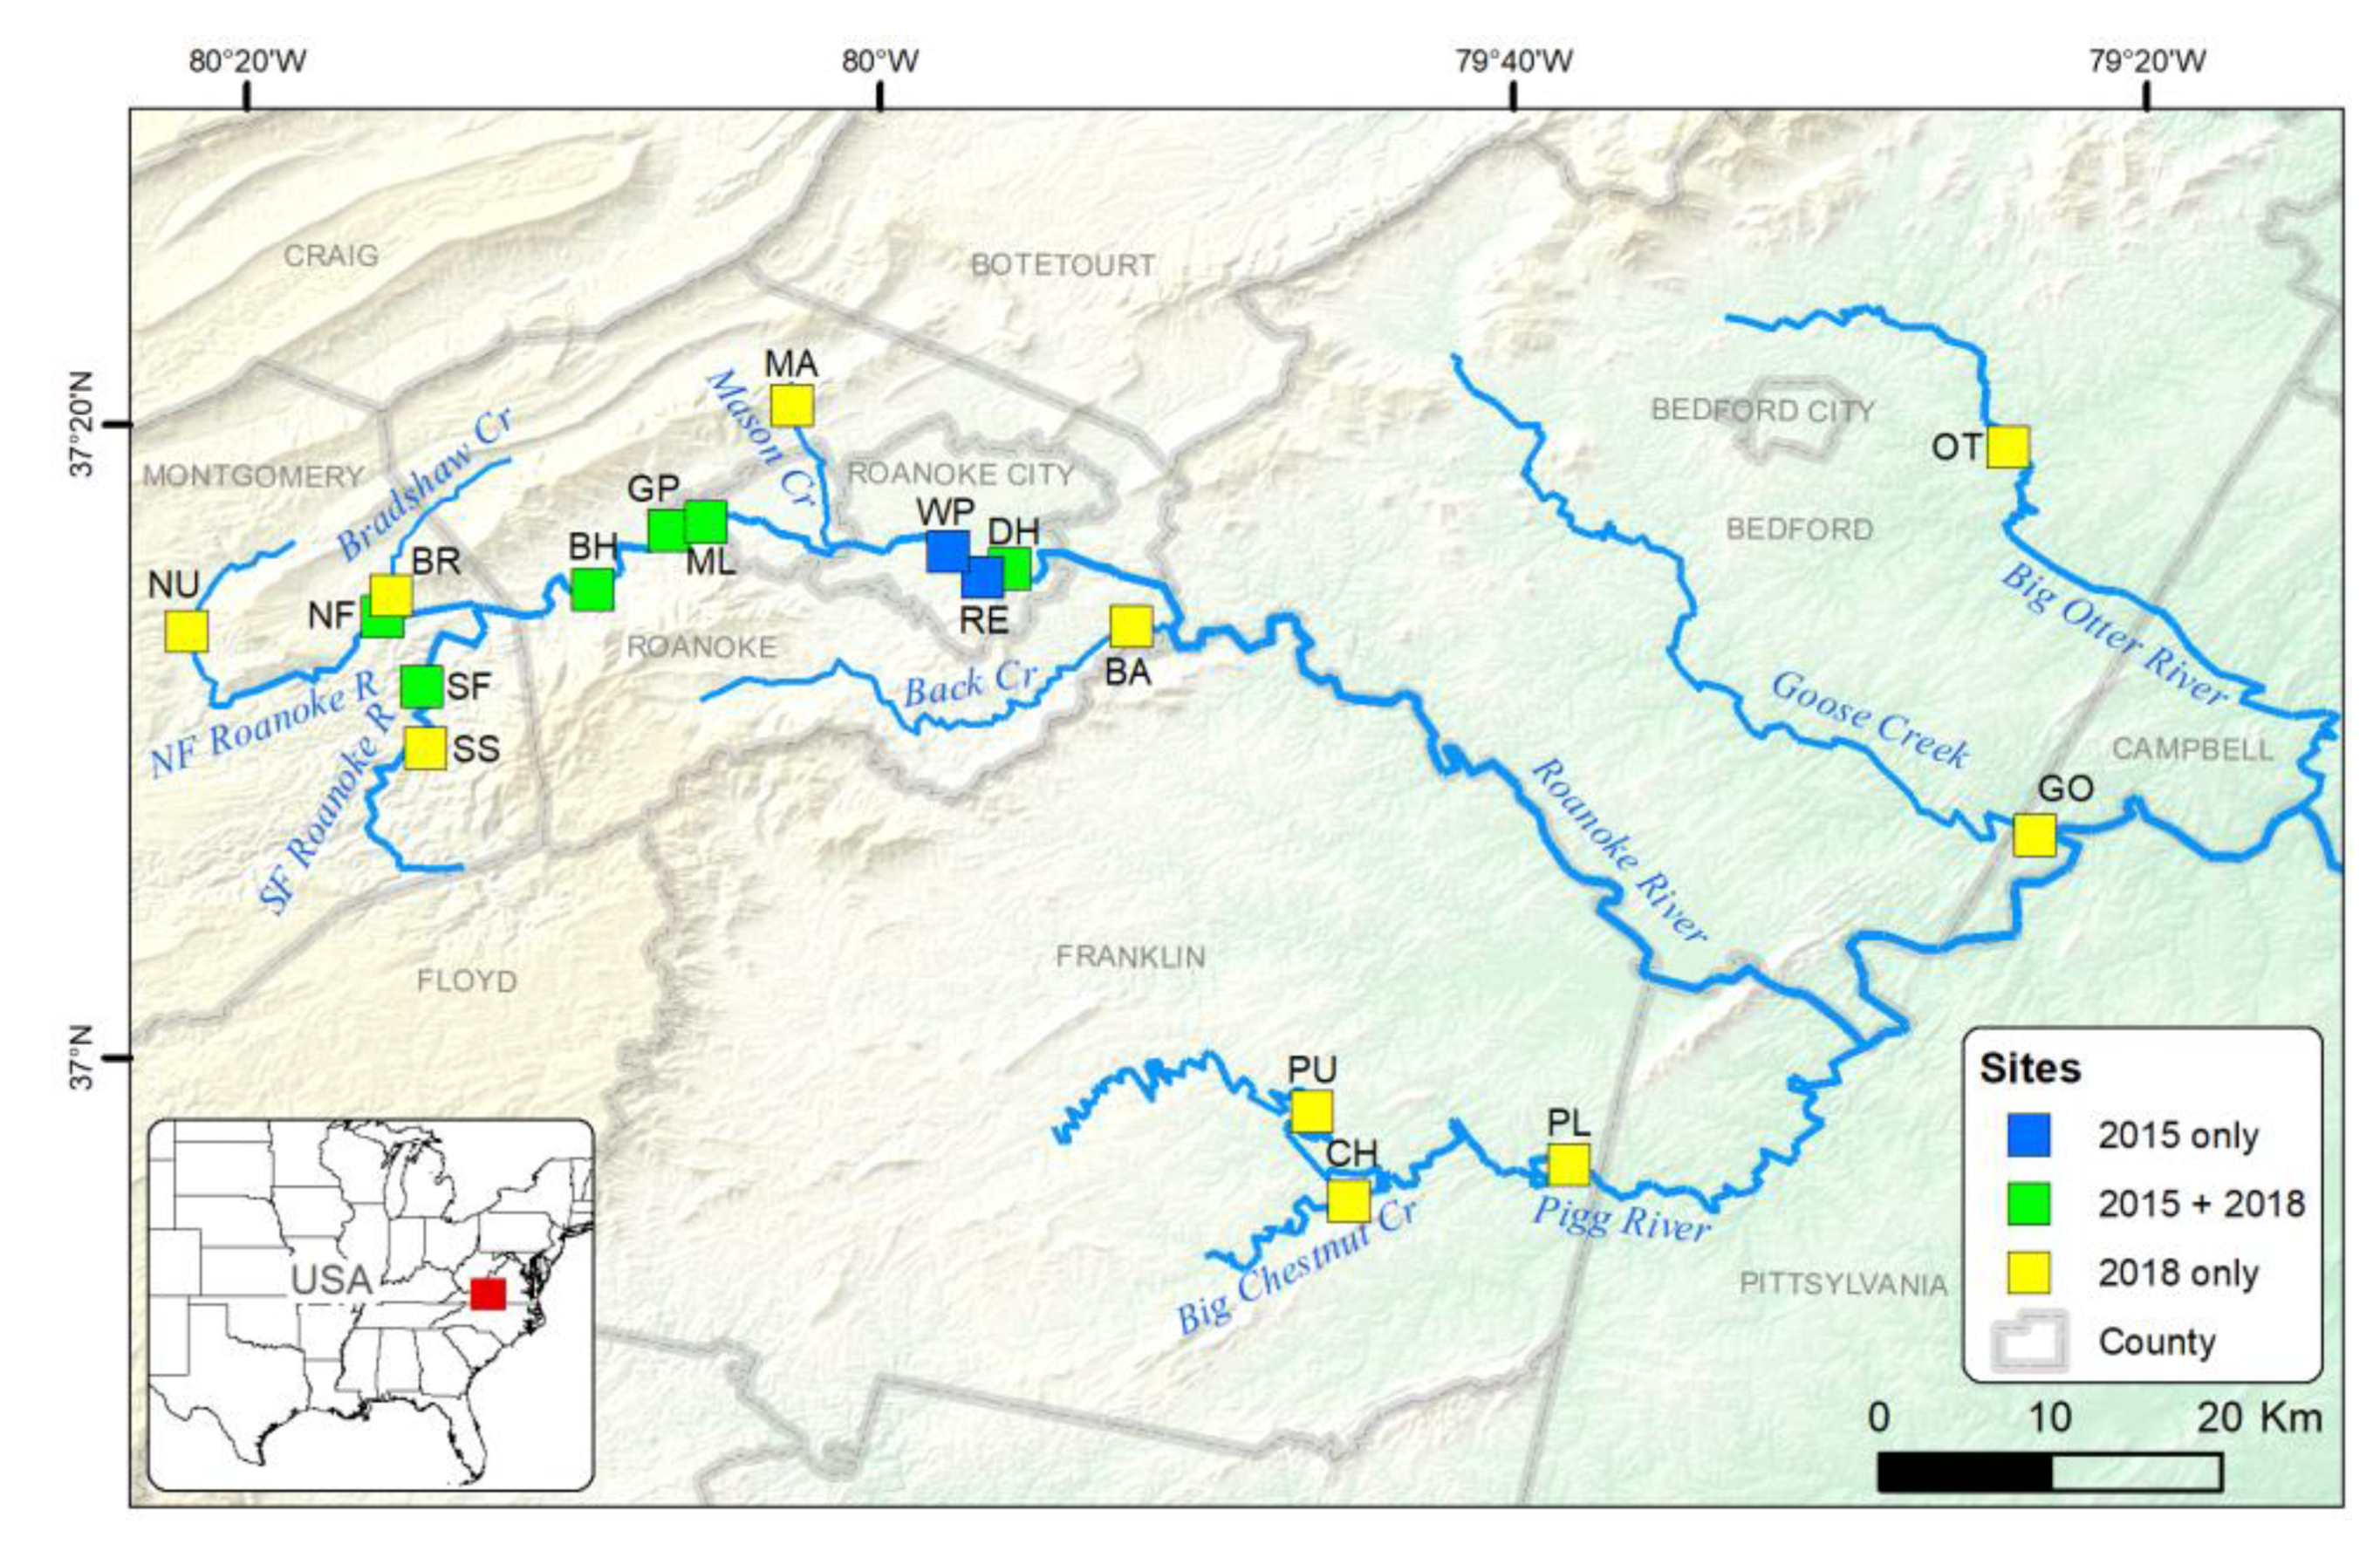
P. rex from the drift at all eight sites sampled (
Figure 6). In 2018,
P. rex were captured at 10 of 16 sampled sites and were collected at all sites sampled both years except at one site (Downstream Hospital), where they were collected in 2015 but not in 2018. There were five sites where
P. rex were not collected throughout the study (Bradshaw, Mason, North Fork Upper, Pigg Lower, and Pigg Upper). We caught
P. roanoka starting 18 April in 2015 and 20 April in 2018.
P. nevisense catch peaked during the first two weeks of April both years, and only four individuals were collected after the first of May across both sample years. Catch of
P. rex and
P. roanoka peaked during the week of 10 May both years.
The median number of
Percina larvae per drift-net set in 2018 (including only sets that caught one or more larvae of a given species) was 1 for
P. nevisense and
P. rex and 2 for
P. roanoka. The maximum was 3 for
P. nevisense, 9 for
P. rex, and 33 for
P. roanoka, and the 75th percentile values were 2.00, 3.25, and 4.25, respectively. Each 20-min drift-net set in 2018 filtered from 0.007 to 0.23 (median = 0.090) megaliters (ML) of water. The median number of
Percina larvae caught per ML of water was 13 for
P. nevisense, 14 for
P. rex, and 27 for
P. roanoka, and the maximum was 29, 178, and 333, respectively (
Supplemental Figure S2). The early drift-net set typically caught more larvae than the late set (
Supplemental Figure S2); however, based on paired
t-tests on the (log+1 transformed) larvae counts from early versus late sets, the difference was significant for
P. roanoka (
t = 3.441,
df = 62,
p = 0.0005), but not for
P. rex (
t = 1.202,
df = 27,
p = 0.120) or
P. nevisense (
t = 0.497,
df = 6,
p = 0.318).
3. Discussion
3.1. Molecular Versus Phenotypic Characterization of Larval Darters
While it would be useful to have real-time estimates of the phenology and species composition of emerging larvae, fisheries scientists have been limited in their ability to identify larval fishes—including darters—to species based simply on morphology and morphometrics. The advent of DNA barcoding introduces the possibility of identifying and counting wild-caught larval fishes. With the availability of an archive of mitochondrial DNA cytochrome oxidase I (
COI) sequences, it is possible to amplify that gene from DNA extracted from fish larvae collected in the field and to identify them to species. When our early results showed that ‘universal’ PCR primers for mitochondrial
COI were not universally effective, we developed and demonstrated primers that did work for our focal darter species. The two species that we could not distinguish on a molecular basis—
E. nigrum and
E. podostemone—are both members of subgenus
Boleostoma; while they are closely related phylogenetically, screening of a longer fragment of the
COI gene or of other mitochondrial sequences that distinguish them [
25] could provide the basis for development of diagnostic barcoding markers. Similar issues were found regarding inability of
COI to resolve members of genus
Coregonus, the whitefishes, by Hulley et al. [
19].
With DNA-based identifications in hand, we were able to develop phenotypic markers to distinguish among species. Pectoral fin length expressed as a multiple of eye diameter, pectoral fin position, as well as very different pigmentation, distinguish Etheostoma and Percina. PM counts of less than 21 distinguish P. roanoka from the other Percina. RPEDH distinguishes E. flabellare larvae from all other upper Roanoke River darters. Although they completely overlap in morphometric space, E. nigrum/podostemone and E. vitreum are clearly differentiated by pigmentation. After considering both morphometrics and pigmentation, P. nevisense versus P. rex is the only species pair for which some uncertainty remains (~10% of P. nevisense—those that have PM = 23—may be misclassified as P. rex, but not vice versa), although these can be distinguished on a molecular basis.
Taken together, our molecular and phenotypic results provide effective methods for collecting and identifying larval darters captured in the upper Roanoke River system. We suggest these molecular and phenotypic methods can be extended to other species groups and river systems.
3.2. Relative Utility of Gear Types
Our results show that larval darters of the upper Roanoke River can be collected using multiple gear types, and that drift nets are particularly effective at collecting
Percina larvae. Most
Percina species have pelagic larvae that exhibit drift behavior [
29]. Conversely,
Etheostoma species exhibit a range of drift behaviors [
29]. These behaviors affect the degree to which the respective species are vulnerable to the collection gears that we evaluated. A greater proportion of our catch of
Etheostoma (38%) versus
Percina (19%) was caught in light traps across both years. This pattern suggests that larval
Etheostoma in the upper Roanoke system are more likely than
Percina to occur in slack water in stream margins where we found light traps to be effective for larval collection, or that
Percina larvae are less attracted to light. The limited spatiotemporal extent of our sampling precluded us from characterizing the transition of
Percina larvae from their drifting phase to their benthic phase, both in terms of when during ontogeny the transition occurs and which benthic habitats are selected.
3.3. Larval Ecology
Because many
Percina species occur mainly in larger rivers, collection and study are difficult, and the reproductive biology of these species is poorly known [
29]. Larvae of almost all members of the genus drift for long distances downstream from their spawning habitats. For example, dispersal distances for
P. rex have been estimated to be as large as 55 km [
32], although that estimate also includes post-larval dispersal. Until their organ systems are fully formed and they can capture food and respire efficiently, larvae must conserve energy and stay in well-oxygenated water. Drifting behavior may enable larval
Percina to meet these requirements while being transported away from high-gradient spawning habitats to lower-gradient, plankton-rich nursery habitats downstream [
33,
34].
Our work extends knowledge of the spawning timing of
P. rex. Burkhead [
35] reported that spawning probably occurs in mid-April and early May and may not extend into June in the upper Roanoke River. Jenkins and Burkhead [
20] reported having observed spawning on 20 April 1982 in the upper Roanoke River. While the early ontogeny of
P. rex has not been characterized, our collection of
P. rex larvae on 12 April 2015 shows that
P. rex can start spawning in early April. Our collection of yolk-sac larvae at five sites during 1–8 June 2018 indicates that
P. rex spawned through the end of May.
Numerous observations of
P. roanoka larvae contribute to our knowledge of its spawning timing as well. On the basis of gonadal condition, Hobson [
36] reported the spawning period as late May to early June in the Virginia mountains. Jenkins and Burkhead [
20] reported observation of spawning in the upper Roanoke River system on 23 April 1982 and suggested that spawning starts in early April on the coastal plains and extends to early June in the mountains. We first collected
P. roanoka larvae on 12 April 2015 at River’s Edge and Wasena Park in Roanoke. Numbers of
P. roanoka collected peaked the week of 10 May both years and remained relatively high through the end of our sampling period in mid-June.
To our knowledge, there are no published studies of the spawning ecology or larval development of P. nevisense. Larvae of this species were never particularly numerous in our catch, but were observed from 5 April through 7 June in 2018, with most (83%) collected in April across both years.
Numbers of Etheostoma larvae in our results are limited. A greater effort to barcode larvae collected later in the season, especially in smaller tributaries of the Roanoke River, would be needed to better characterize Etheostoma larvae in our focal ecosystem. A different molecular genetic assay will be needed to distinguish E. nigrum and E. podostemone.
3.4. Future Research
Our results demonstrate the utility of multiple collection gear types and combining information from phenotypic traits and DNA barcoding to identify larval darters to species. As noted below, these techniques can be applied to answer questions of interest to darter conservation. Moreover, the respective approaches can be applied more generally to perform tasks useful for advancing science and management of fishes, including molecular identification of larvae of economically important, imperiled, and sentinel [
37] species.
While our results demonstrate the feasibility of morphological identifications of upper Roanoke River darter larvae to species, development and validation of a reliable dichotomous key will require morphological examination, including classifying pigmentation patterns, of additional larvae of known identity and varying stages of development, especially for P. nevisense, E. vitreum, and E. flabellare. We emphasize the importance of minimizing variation in morphometric measurements by clearly defining the features to be measured and training observers in how to take accurate and consistent measurements.
Factors driving the timing of spawning and larval drift might include day length, temperature, and stream discharge. Data on site-specific temperatures and discharges could be used to assess the relative importance of these factors to larval darter phenology.
Knowledge of basic life-history attributes and life stage-specific habitat use is critical for conservation of fish species. After applying an occupancy estimation framework to six species within a Great Plains fish assemblage, Falke et al. [
7] showed the importance of sustaining flows that maintain the density and sizes of habitats needed for successful spawning and recruitment. With data from more intensive spatial and temporal sampling, we may be able to identify critical nursery habitats and environmental conditions driving abundance of larval darters, including the imperiled
P. rex.
Following the experimental design of Roberts et al. [
32], who used a suite of nuclear DNA markers and parentage inference programs, dispersal patterns for members of different full- and half-sib darter families could be determined, enabling them to characterize minimum movement distances and duration. The factor limiting the power of such an experiment is the number of family members collected; hence, we would need on the order of hundreds of larvae of a species collected at a given site and time. These samples would be screened using at least six to eight microsatellite DNA loci to have enough variability to definitively and defensibly ascertain family relationships (e.g., full- versus half-sibs) [
38]. Ideally, this procedure would need to be conducted simultaneously at multiple sites in the focal system.
Our understanding of factors influencing the demographics of
P. rex populations is limited. A key factor is presumed to be larval recruitment. While we can obtain reasonable estimates of the number of spawners, only at the end of the first growing season when juveniles can be captured with a seine can we estimate year-class strength [
32]. With the demonstration of effective larval collection gear and development of the
COI assay, we can more purposefully quantify larval abundance across space and time. We then can seek to relate larval abundance to subsequent recruitment of
P. rex or other darters of interest.
4. Materials and Methods
4.1. Field Methods
We used three gear types (
Supplemental Figure S3) to sample larval fishes during the
Percina spawning period in spring and early summer of 2015 and 2018. In 2015, we made 117 collections at eight sites in the North and South forks and mainstem upper Roanoke River over 78 days between 18 March and 4 June (
Supplemental Table S2). In 2018, we resampled six of the sites in the core area from 2015 and added ten new sites (16 total) in additional tributaries (
Figure 6), for a total of 276 collections over 73 days from 3 April to 15 June. The sites encompassed a longitudinal gradient of known
Etheostoma and
Percina habitats and represented spatial variation in environmental conditions encountered by larval darters. Each site was sampled an average of 14.6 (13–16) times in 2015 and 17.2 (15–19) times in 2018, equivalent to one sample every 5.3 (4.9–6) days in 2015, and one sample every 4.2 (3.8–4.9) days in 2018.
Each night, two teams sampled 2–3 sites each (4–6 sites sampled each night). Sampling began soon after sunset (8–9 pm) and was completed between 11 p.m. and 2 a.m. Sampling at each site included two 20-min drift-net sets (early and late) of one (in 2018) to two side-by-side (in 2015) nets, and one 2-h set of two (in 2018) to four (in 2015) light traps. The early drift-net set (net opening 45.7 × 30.5 cm, 363-micron mesh,
Supplemental Figure S3c) was deployed when we first arrived at a site. Drift net(s) were staked into the substrate in a riffle or run. Depth and velocity were measured at the mouth of each net. During the early drift-net set, we set light traps as described in the next paragraph. Two hours later (after setting nets and light traps at 1–2 other sites), we redeployed the drift net(s) for the late set, then pulled the light traps and processed the catch.
After the early drift net(s) were set, we deployed four (in 2015) or two (in 2018) light traps (1–2 quatrefoil traps and 1–2 funnel traps) (
Supplemental Figure S3) fitted with white LED lights to attract larvae. All light traps were placed in slack water near the stream edge. Specific trap locations were chosen to represent main-channel, near-bank habitats that were deep enough to accommodate the traps and not associated with dense aggregations of woody debris. The funnel traps typically were deployed at the stream margin in 10–40 cm of water, whereas the quatrefoil traps required deeper (40–60 cm) water to be fully immersed. Once deployed, the traps remained in place until the end of the sampling night (about 2 h).
Volume of water filtered by a drift net was calculated as the product of water velocity measured when each net was set, set duration (typically 20 min), and area of the net opening (30.5 × 45.7 cm, unless the net was set in water shallower than 30.5 cm, in which case water depth was used).
All solid material (larvae + debris) from a sample (segregated by gear and set) was placed in MS-222 (Syndel, Inc., Ferndale, WA, USA) solution (5 mL each of MS-222 powder and baking soda dissolved in 1 L of stream water) until any larvae stopped moving, which was then strained, and transferred into 240-mL glass jars containing 95% ethanol. Samples were labeled by site, date, collection gear, and set number.
4.2. Processing of Field Samples
Larval darters were separated from those of other families based on distinguishing characters, including vent location, yolk sac, and oil globule characters; pectoral fin development, myomere count; and pigmentation patterns [
29]. Each darter larva was photographed under magnification (M80 stereo-scope, Leica Microsystems, Wetzlar, Germany) and stored in 95% ethanol in a microcentrifuge tube labeled with a unique identification number.
4.3. Genetic Methods
We extracted DNA from larval specimens using the Qiagen Blood and Tissue Kit (Qiagen, Germantown, MD, USA). The quantity and quality of DNA were assessed using a μLite Spectrophotometer (NanoDrop, Cambridge, UK).
Two sets of ‘universal’ fish polymerase chain reaction primers [
10] failed to amplify DNA of our darter larvae, even after considerable troubleshooting Upon close examination of April et al. [
11], we noted that our species of interest were not included in their results and inferred that their primers were not well suited for amplifying
Percina DNA. We chose three
Percina (
P. nevisense,
P. roanoka, and
P. rex) and three
Etheostoma (
E. nigrum,
E. vitreum, and
E. podostemone) species to design custom primers using DNA sequences from GenBank (ncbi.nlm.nih.gov/genbank/gov/pubmed/29140468), and used the Primer Blast tool [
39] to identify candidate primer pairs for the mitochondrial
COI,
ND2, and
cytB regions for
Percina macrolepida, the only
Percina species for which the whole mitochondrial genome was available on GenBank. Using these primers, DNA from the collected larvae was successfully amplified for all three regions. Because DNA barcoding has been based upon the
COI gene and there is a large reference database, we went forward with amplifications of
COI for our unidentified percid larvae using the primers PREX
COIF—TGC TTG AGC CGG AAT AGT GG, and PREX
COIR—TAC TCC GGA GGA GGC AAG AA.
We performed PCR amplification of the
COI mitochondrial region using a modified protocol of Ivanova et al. [
10]. PCR reactions had a volume of 22 μL consisting of 14.7 μL of ultrapure water, 2 μL of 5xPCR buffer (10 mM KCl, 10 mM (NH
4)
2SO
4, 20 mM Tris-HCl (pH 8.8), 2 mM MgSO
4, and 0.1% Triton X-100), 2 μL MgCl
2 (25 mM), 0.1 μL of each dNTP (10 mM), 0.1 μL of
Taq DNA polymerase (New England Biolabs), 0.4 μL (10 µM) of each custom primer (Prex
COIF and Prex
COIR), and 2 μL of DNA template. We conducted all reactions on BioRad MyCycler or T-100 thermocyclers with a temperature profile of 94 °C for 2 min; 35 cycles of: 94 °C for 40 s, 52 °C for 60 s, and 72 °C for 90 s; and a final extension for 10 min at 72 °C. Amplification products were sent to the Virginia Biocomplexity Institute (VBI) for sequencing of forward and reverse sequences. Bidirectional sequences were aligned, assembled, and trimmed to ~230 bp using Geneious 10.0.9 software (Geneious, Auckland, New Zealand). We used the Basic Local Alignment and Search Tool (BLAST; [
40]) to search GenBank for archived sequences with high sequence identity. Sequences were considered a match when >98% sequence identity (>95% identity for
E. flabellare) and >200 bp coverage was shown for a percid species known to occur in the Roanoke River system. Our quality control procedures adhered to recommendations made by Hyde et al. [
41] in terms of sampling the larvae collected, selection of the molecular marker, interpretation of chromatograms, and critical questioning of the species identifications that resulted from querying the
COI sequence archive.
4.4. Morphometric Methods
For each of four species (Etheostoma flabellare, E. nigrum/podostemone, E. vitreum, and Percina nevisense), we had <35 larvae whose bodies were sufficiently intact for accurate morphometric analysis, so we collected morphometric data on all available larvae of these species. We collected morphometrics on random subsamples of the other two species, P. roanoka and P. rex, for which we had >35 intact barcoded specimens. We continued measuring morphometrics on additional randomly selected specimens until the mean and SD of PM from 1000 bootstraps sampled from the available PM counts stabilized (i.e., remained within ±10% with the addition of five more PM counts).
On this subset of 152 barcoded larvae representing the six species found in our sample, we counted preanal myomeres (
PM) and measured total length (
TL) along with seven other body measurements, which we expressed relative to (i.e., as a ratio of)
TL, including: preanal length (
RPREL, tip of snout to posterior margin of vent), head height (
RHEADH, apex of optic lobe to ventral margin of head), head length (
RHEADL, tip of snout to pectoral fin insertion), snout length (
RSNOUTL, tip of snout to anterior margin of eye iris), eye diameter (
REYED, longitudinal iris diameter), pectoral fin length (
RPECL, from foremost visible point of fin insertion to distal tip of the membranous edge), and caudal peduncle height (
RPEDH, least peduncle height excluding finfold). Except for
RPECL, lengths were measured parallel to, and heights perpendicular to, the longitudinal body axis with mouth closed. We counted all preanal myomeres between the anterior-most myoseptum and an imaginary vertical line drawn at the posterior margin of vent, including any bisected by the line [
29]. We also noted any distinctive qualitative characters (pigmentation and morphological features,
Table 2).
4.5. Permits and Ethical Aspects
This work was conducted under the auspices of U.S. Fish and Wildlife Service permit TE-697823, VDGIF permits 059600 and 061522, and Virginia Tech Institutional Animal Care and Use Committee protocols 14-106-FIW and 18-021.

 ,
, 


