Article

Morphology, Transcriptomics and In Vitro Model of Skin from Polar Cod (Boreogadus Saida) and Atlantic Cod (Gadus Morhua)

1
Nofima, Muninbakken 9–13, Breivika, 9019 Tromsø, Norway
2
Sechenov Institute of Evolutionary Physiology and Biochemistry Russian Academy of Sciences, Torez 44, 194223 Saint-Petersburg, Russia
3
Department of Arctic and Marine Biology, UiT The Arctic University of Norway, Tromsø PO Box 6050, N-9037 Langnes, Norway
*
Author to whom correspondence should be addressed.
Submission received: 12 October 2020 / Revised: 27 October 2020 / Accepted: 28 October 2020 / Published: 4 November 2020

Abstract

:
Fish skin is a multifunctional barrier tissue with high regeneration capacity that interacts with the surrounding environment and provides protection. Functional importance, high complexity and activity make skin an attractive tissue for studying the effects of environmental challenges and chemical stressors in fish. The aim of this work was to characterize skin from polar cod (Boreogadus saida) and Atlantic cod (Gadus morhua), and to test cod skin as an in vitro model in exposure studies. Both species have similar skin structures including epidermis, mucous cells, club cells and scales. However, microarchitectural differences were detected; Atlantic cod has a smooth epidermal surface and overlapping scales, whereas polar cod has a folded outer surface and discontinuous scales. Genome-wide microarray found 6.5k genes with expression differences, which suggested more active turnover of proteins, proliferation and motility of cells in skin of polar cod. Hydrogen peroxide (H2O2) was used to examine skin responses. Transcriptome response was stronger in the skin of polar cod, with 155 differentially expressed genes. The skin from Atlantic cod was further used to develop a cell culture. H2O2 decreased the cell migration rate in a dose-dependent manner, which could indicate reduced skin healing capacity. The results revealed novel skin structures and confirmed that the skin from cod is a promising tissue for evaluation of stressors.

1. Introduction

Insight into the molecular, cellular and physiological responses to environmental challenges is vital for sustainable growth of aquaculture and preservation of wild populations. Atlantic cod (Gadus morhua) and polar cod (Boreogadus saida) are gadoid species which differ in habitat, lifestyle and many biological characteristics. Atlantic cod is of great importance for commercial fisheries in the North Atlantic, and polar cod is a key species in the Arctic food web [1,2]. Atlantic cod catches and spawning stock biomass have been declining over the last several decades, and fisheries of cod may further reduce due to climate change and increased oil drilling activity [3,4]. A predicted decline in the availability of wild cod in the near future has renewed interest in cod farming in Norway [5]. Polar cod is not commercially exploited. However, this sentinel Arctic fish occurring in large numbers directly underneath the Arctic sea ice [6,7] is used in numerous environmental studies with a focus on pollution and thermal stress [8,9,10]. The decrease of wild populations, growing potential for cod farming, exposure to pollutant and climate change stimulate interest in cod research, which will grow in the future. Development of specific and reliable biological markers, in vitro systems for diagnostics of adverse conditions, better understanding of biological processes and monitoring of health in fish are among the research priorities.
Skin is a barrier tissue that interacts directly with the environment, provides protection against external agents and has a high capacity for healing and regeneration (reviewed in [11]). It is involved in numerous physiological processes, including sensory perception, concealment, epithelial transport and swimming [12,13,14,15]. Fish skin consists of four main parts: an outer mucous layer, which lubricates and protects the epithelial surface, the epidermis consisting of live epithelial cells (keratocytes) that cover and seal the surface, the dermal layer and the hypodermis, which provides vascularization, pigmentation and mechanical strength. Other structures, such as strength-increasing scales [16] and taste buds, the latter of which are involved in chemoreception [17], are found in many species. Taste buds, or sensory cells, are secondary epidermal cells with a single apical microvillus that protrudes between the cells of the superficial layer of epidermis (reviewed in [18]). Club cells are also common in fish skin. They are located in the deeper epidermis and are regarded as alarm cells, releasing chemical substances that evoke an antipredator responses to nearby shoal mates [19]. Club cells are also suggested to be involved in immune response and epidermal regeneration [20]. The keratocytes in the epidermis are highly active cells that respond to changes in environment, toxic substances and to ectoparasites [21,22,23,24,25]. Parasite infection and wounds rapidly induce extremely complex transcriptional responses [26,27], and large-scale changes that are also associated with environmental and seasonal conditions [28,29]. These properties make fish skin an attractive tissue for studying responses to environmental changes, external stimuli and chemical stressors.
Unlike mammalian skin, teleost skin is a non-keratinized tegument with living cells that continue their activity several hours after the fish has been killed. It is therefore possible to conduct exposure trials on dead fish and further grow keratocytes and perform functional studies directly from the scales [28,29], making these cells appropriate for developing in vitro models. For Atlantic salmon (Salmo salar), semi-in vivo techniques [30] and in vitro cell cultures [26] have been developed and have shown mirror effects observed in vivo. These methods make observation of acute responses and long-term effects on morphology and performance of cultivated skin cells possible. Taking into account interspecific variation [31,32], a different model is required for each species. No such system is currently available for cod keratocytes, and only a few papers describe cod skin in general [33,34].
In this study, we characterized skin from two cod species (farmed Atlantic cod and wild polar cod) and tested an in vitro approach to use of Atlantic cod skin as a model for exposure to stressors. The presented study includes a description of skin morphology based on histology and scanning electron microscopy (SEM), comparison of the transcriptomes with use of a genome-wide microarray and development of a primary in vitro culture of Atlantic cod keratocytes as a tool to follow cell responses. Cultures were exposed to hydrogen peroxide (H2O2), a compound with a rapid oxidizing effect with the potential of disrupting membrane properties [35]. H2O2 is commonly used in salmon farming as a treatment for salmon lice (Lepeophtheirus salmonis) [36] and previously tested as a stressor in a similar studies with Atlantic salmon.

2. Results

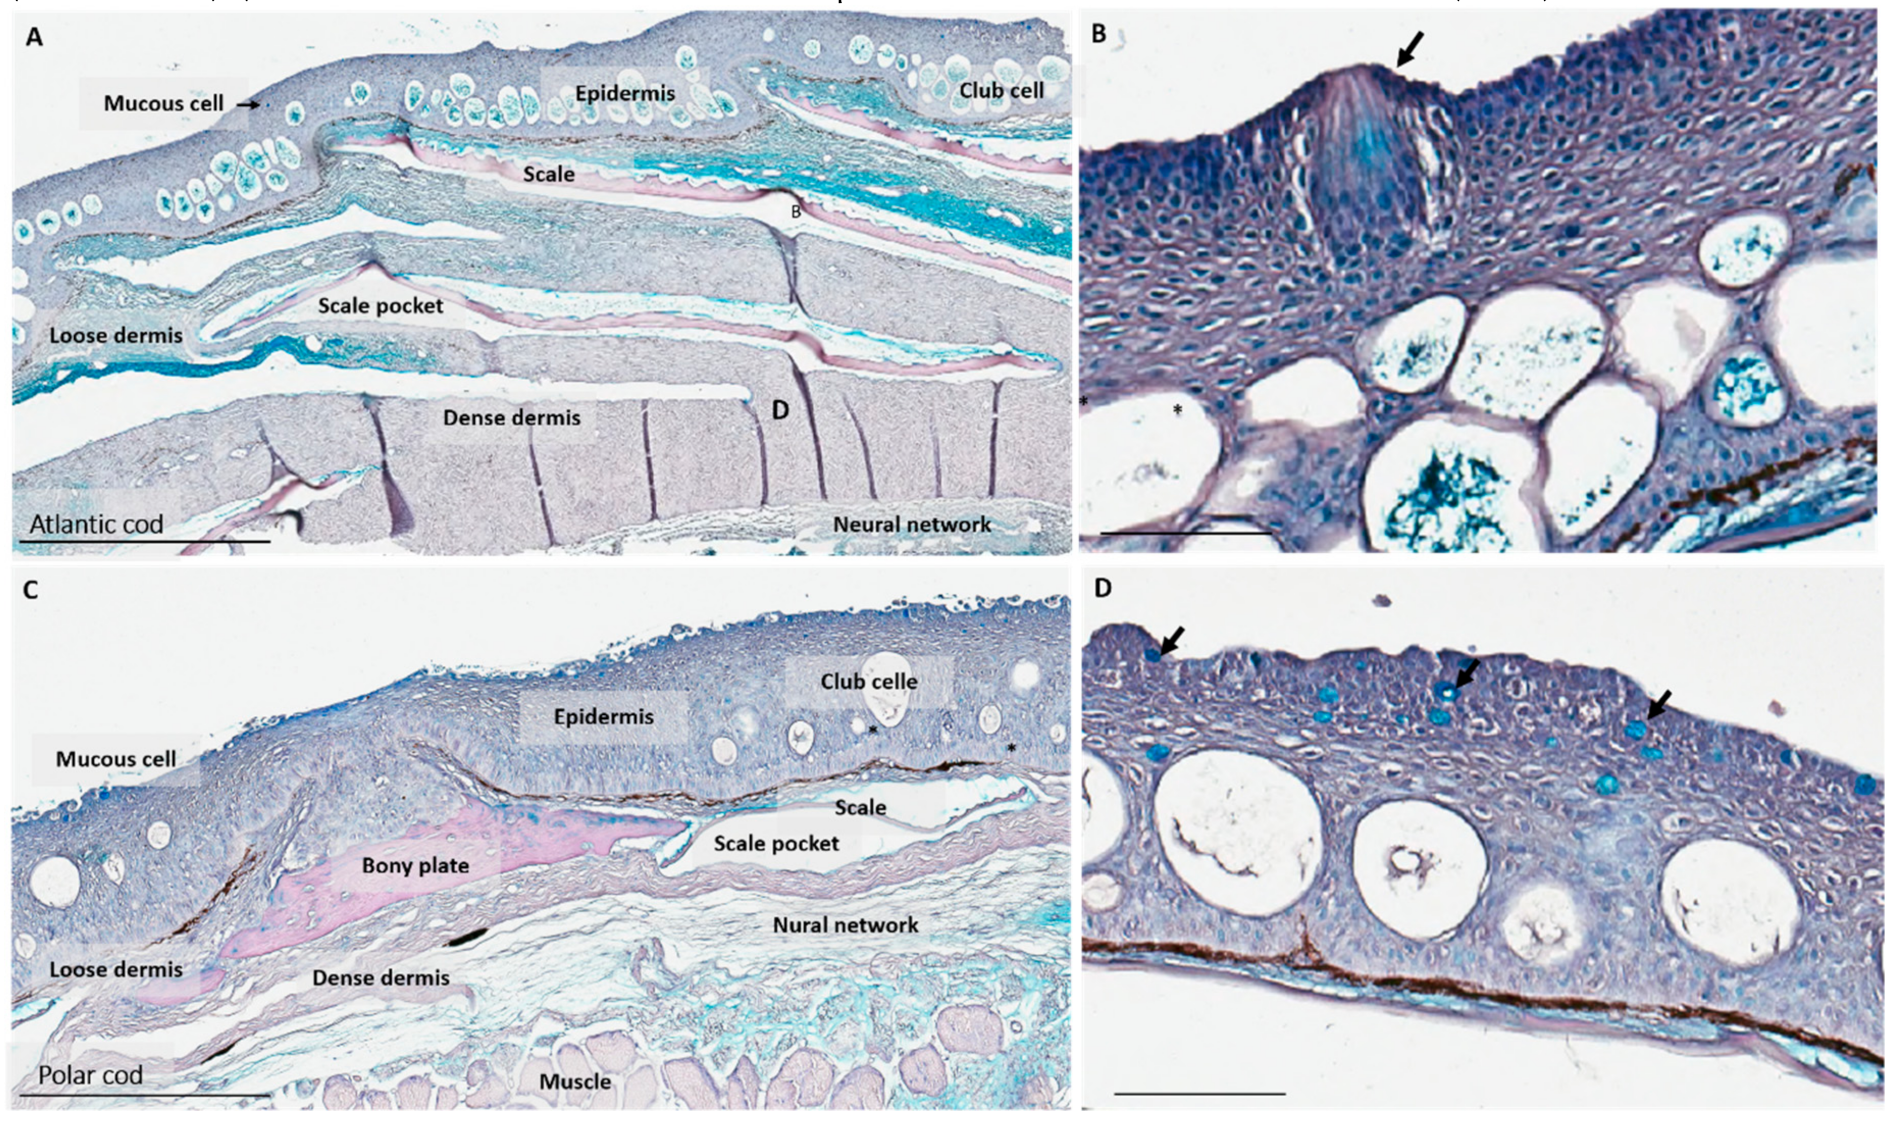
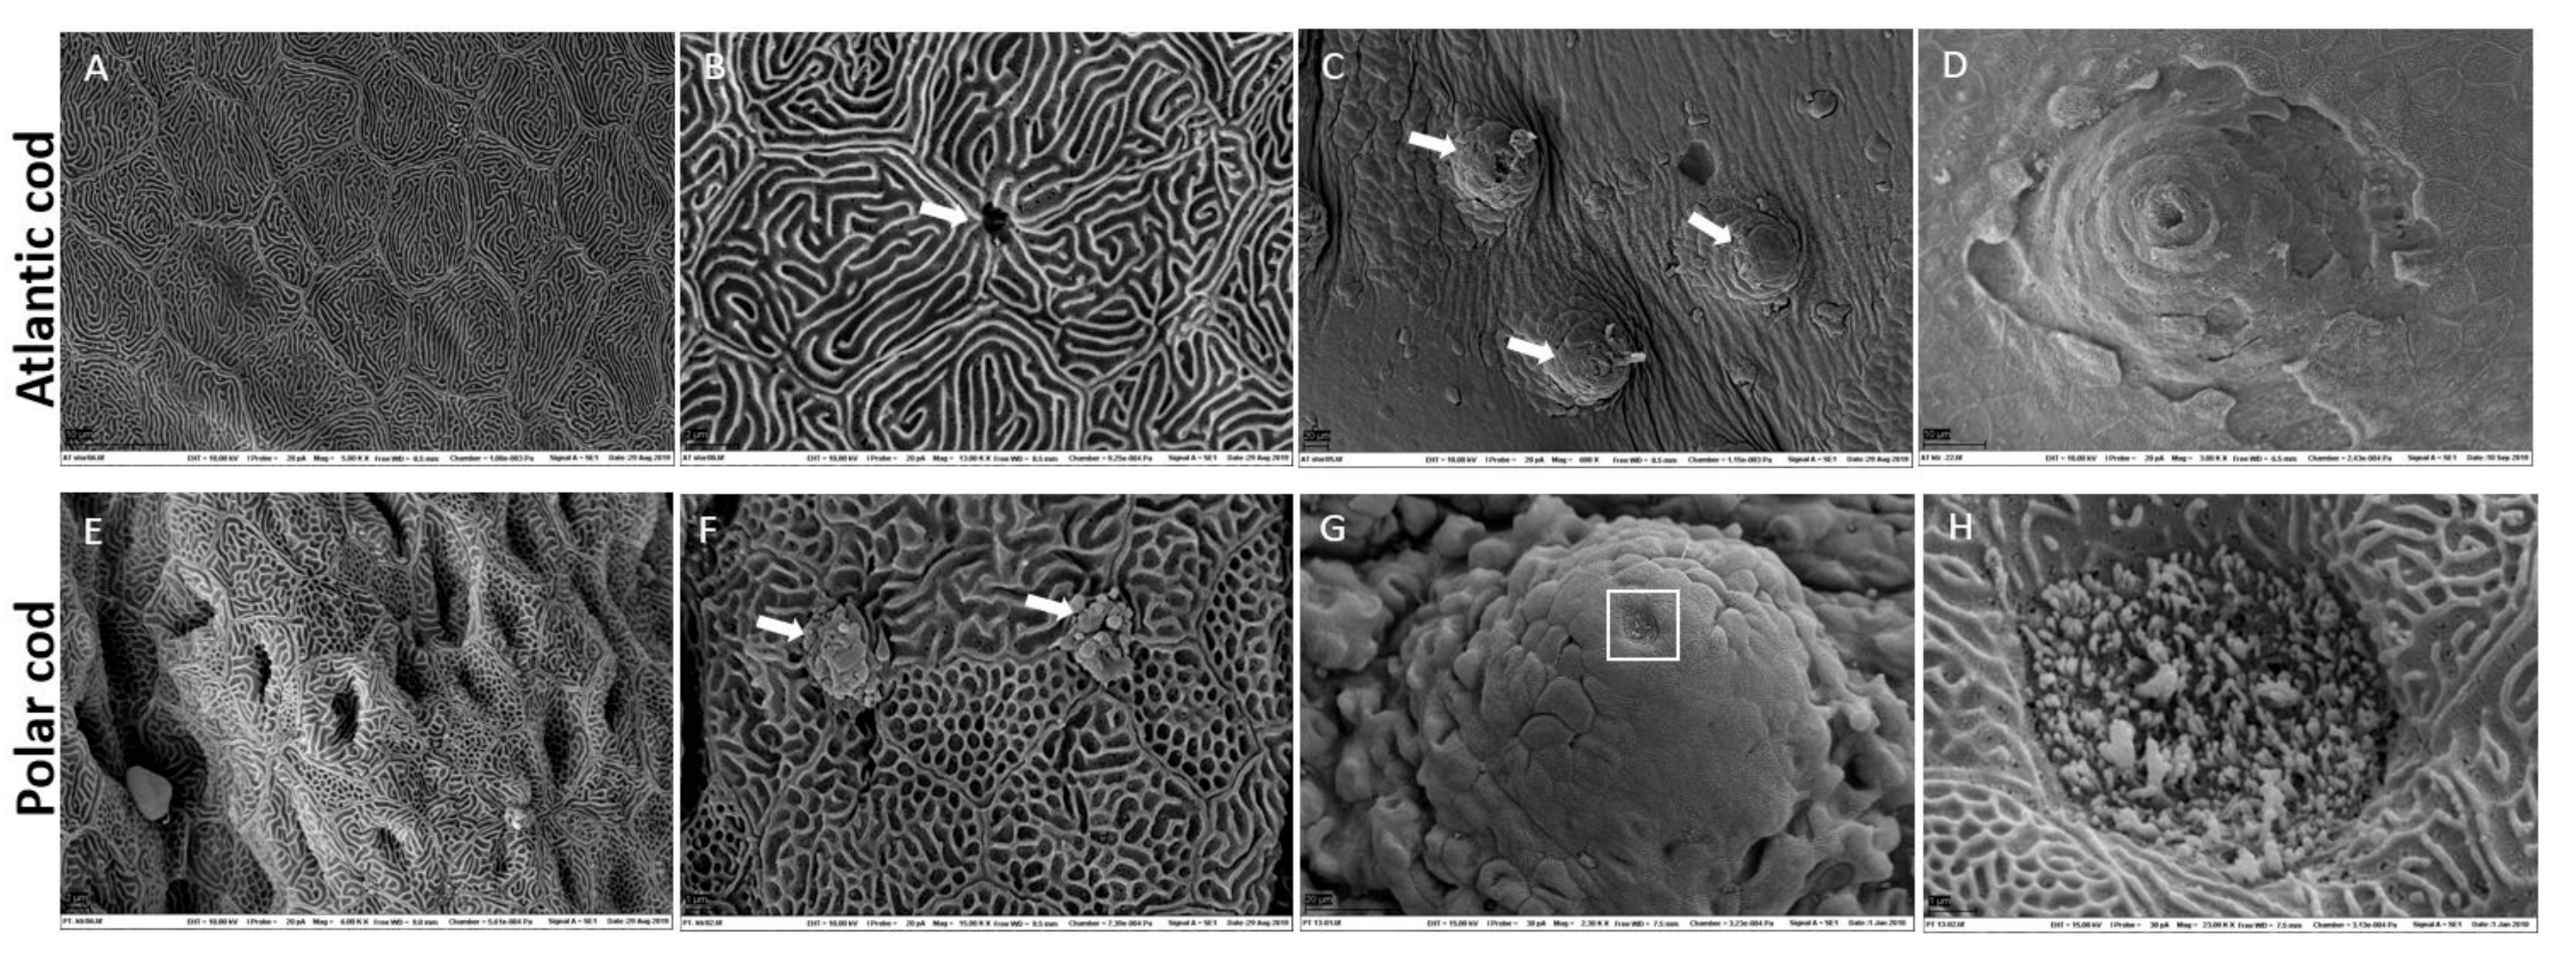
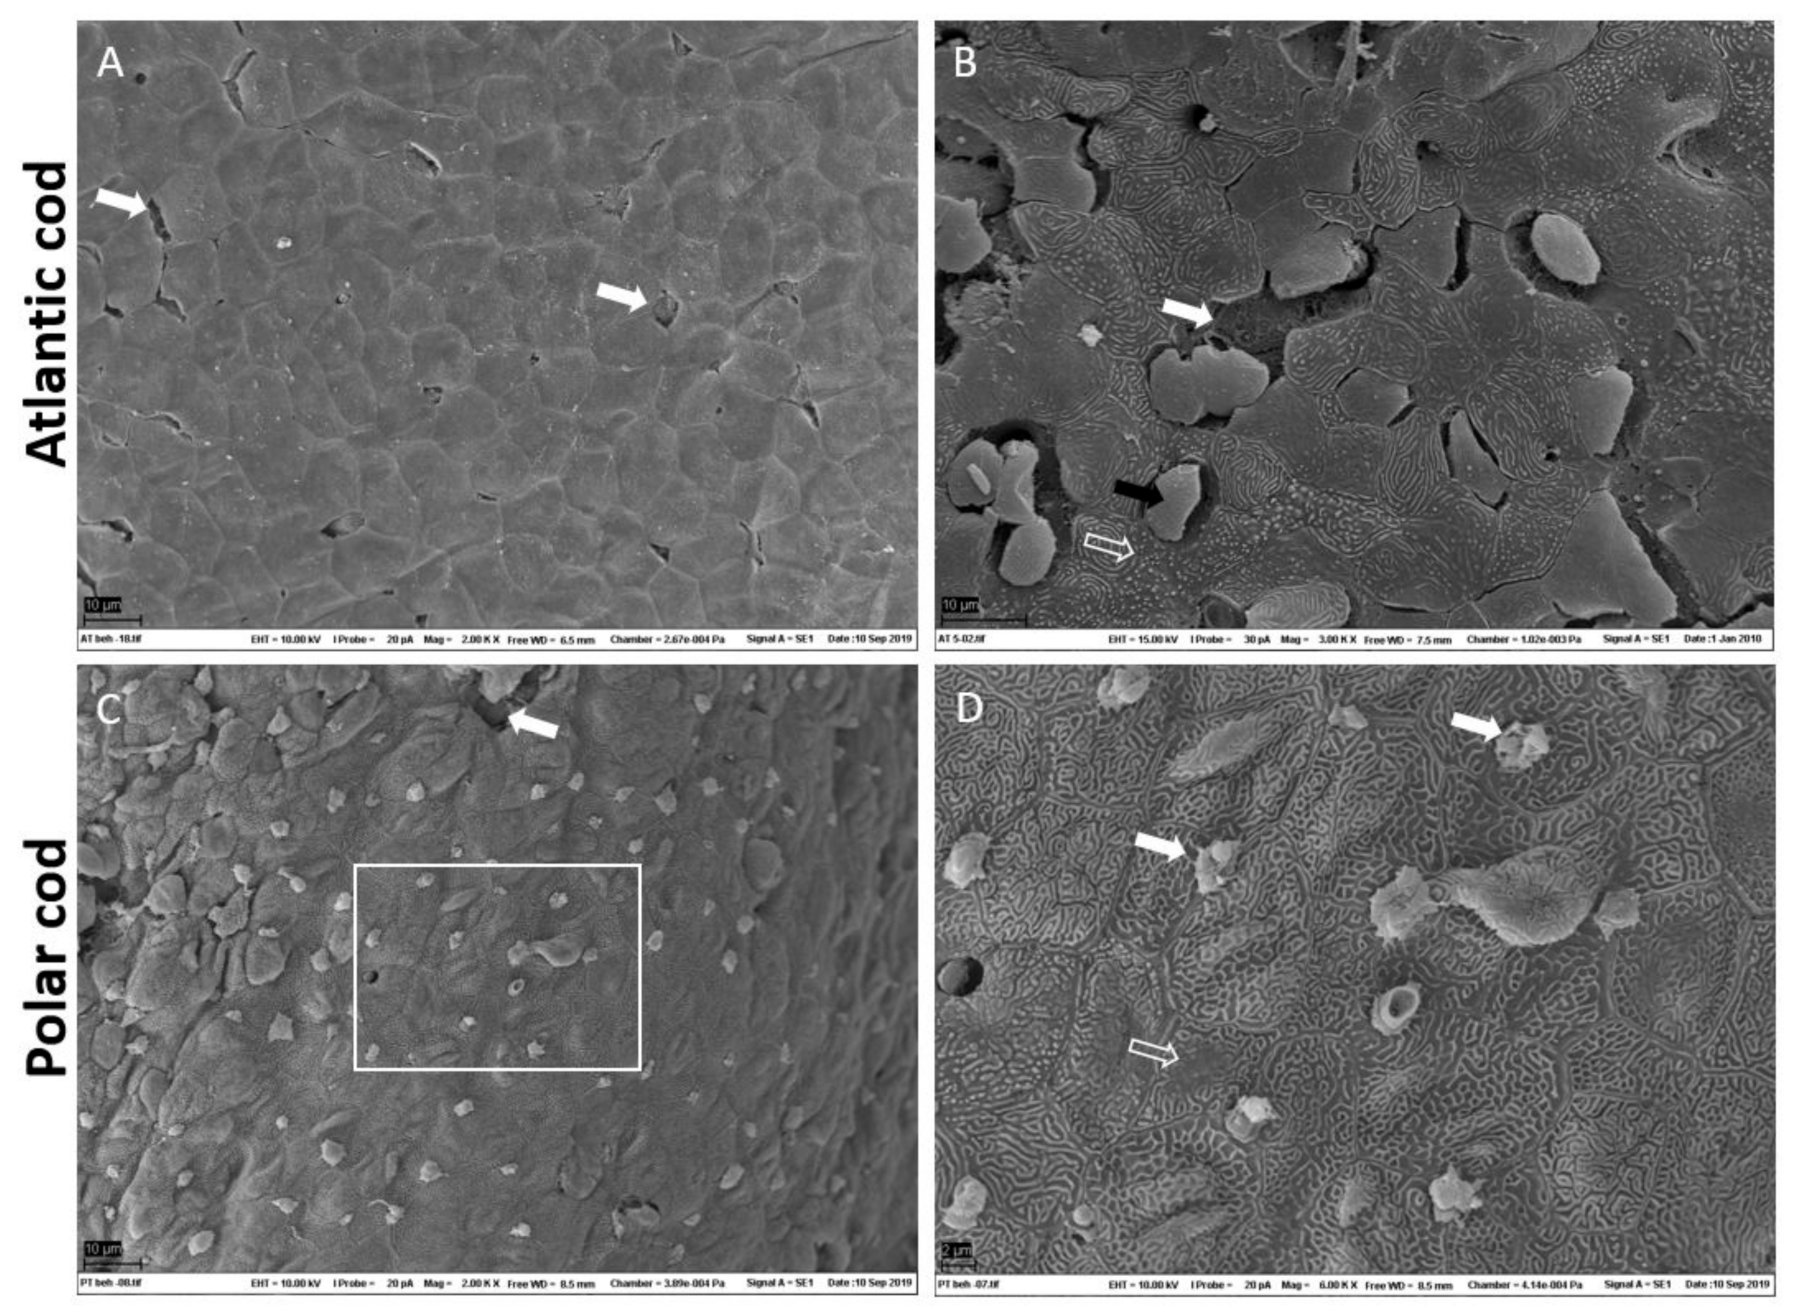
2.1. Characterization of Skin

The micro-architectures of skin from Atlantic cod (n = 9) and polar cod (n = 6) were characterized using Alcian Blue/Periodic Acid - Schiff (AB/PAS) -stained sections (Figure 1). Skin from both species has an overall similar structure, including epidermis, mucous cells, club cells, scales and dermis. In addition, both species have sensory cells in epidermis (Figure 1B). Some specific features were found. Polar cod has disjointed scales and bony plates located mostly in the dermis which do not extend into the epidermis, unlike the scales in Atlantic cod (Figure 1A,C). In Atlantic cod, the overlapping scales extend into the loose connective tissue, influencing the structure of club cells in the epidermis. Polar cod has scales only in the dense connective tissue, which explains its more compact appearance in comparison with Atlantic cod. Polar cod also has more mucous cells (3.77 ± 0.02) than Atlantic cod (0.27 ± 0.07) (mean mucous cell number/100 µm of skin ± standard deviation (STD).
The skin surfaces from Atlantic cod (n = 9) and polar cod (n = 6) were characterized using SEM (Figure 2). The keratocytes make up a continuous layer of cells attached to each other, sealing the outer epidermal border. SEM showed a smooth outer appearance of Atlantic cod keratocytes (Figure 2A). Polar cod has more grooves and folds (Figure 2E) and the abundance of mucous cells is higher (Figure 2B,F). Both species have characteristic structures on the keratocyte surface facing the outer environment called microridges (Figure 2B,F), which are typical for fish [11]. Sensory cells were found in the epidermis of both species, and had the morphology resembling the pores of external taste buds (Figure 2C,D,G,H).

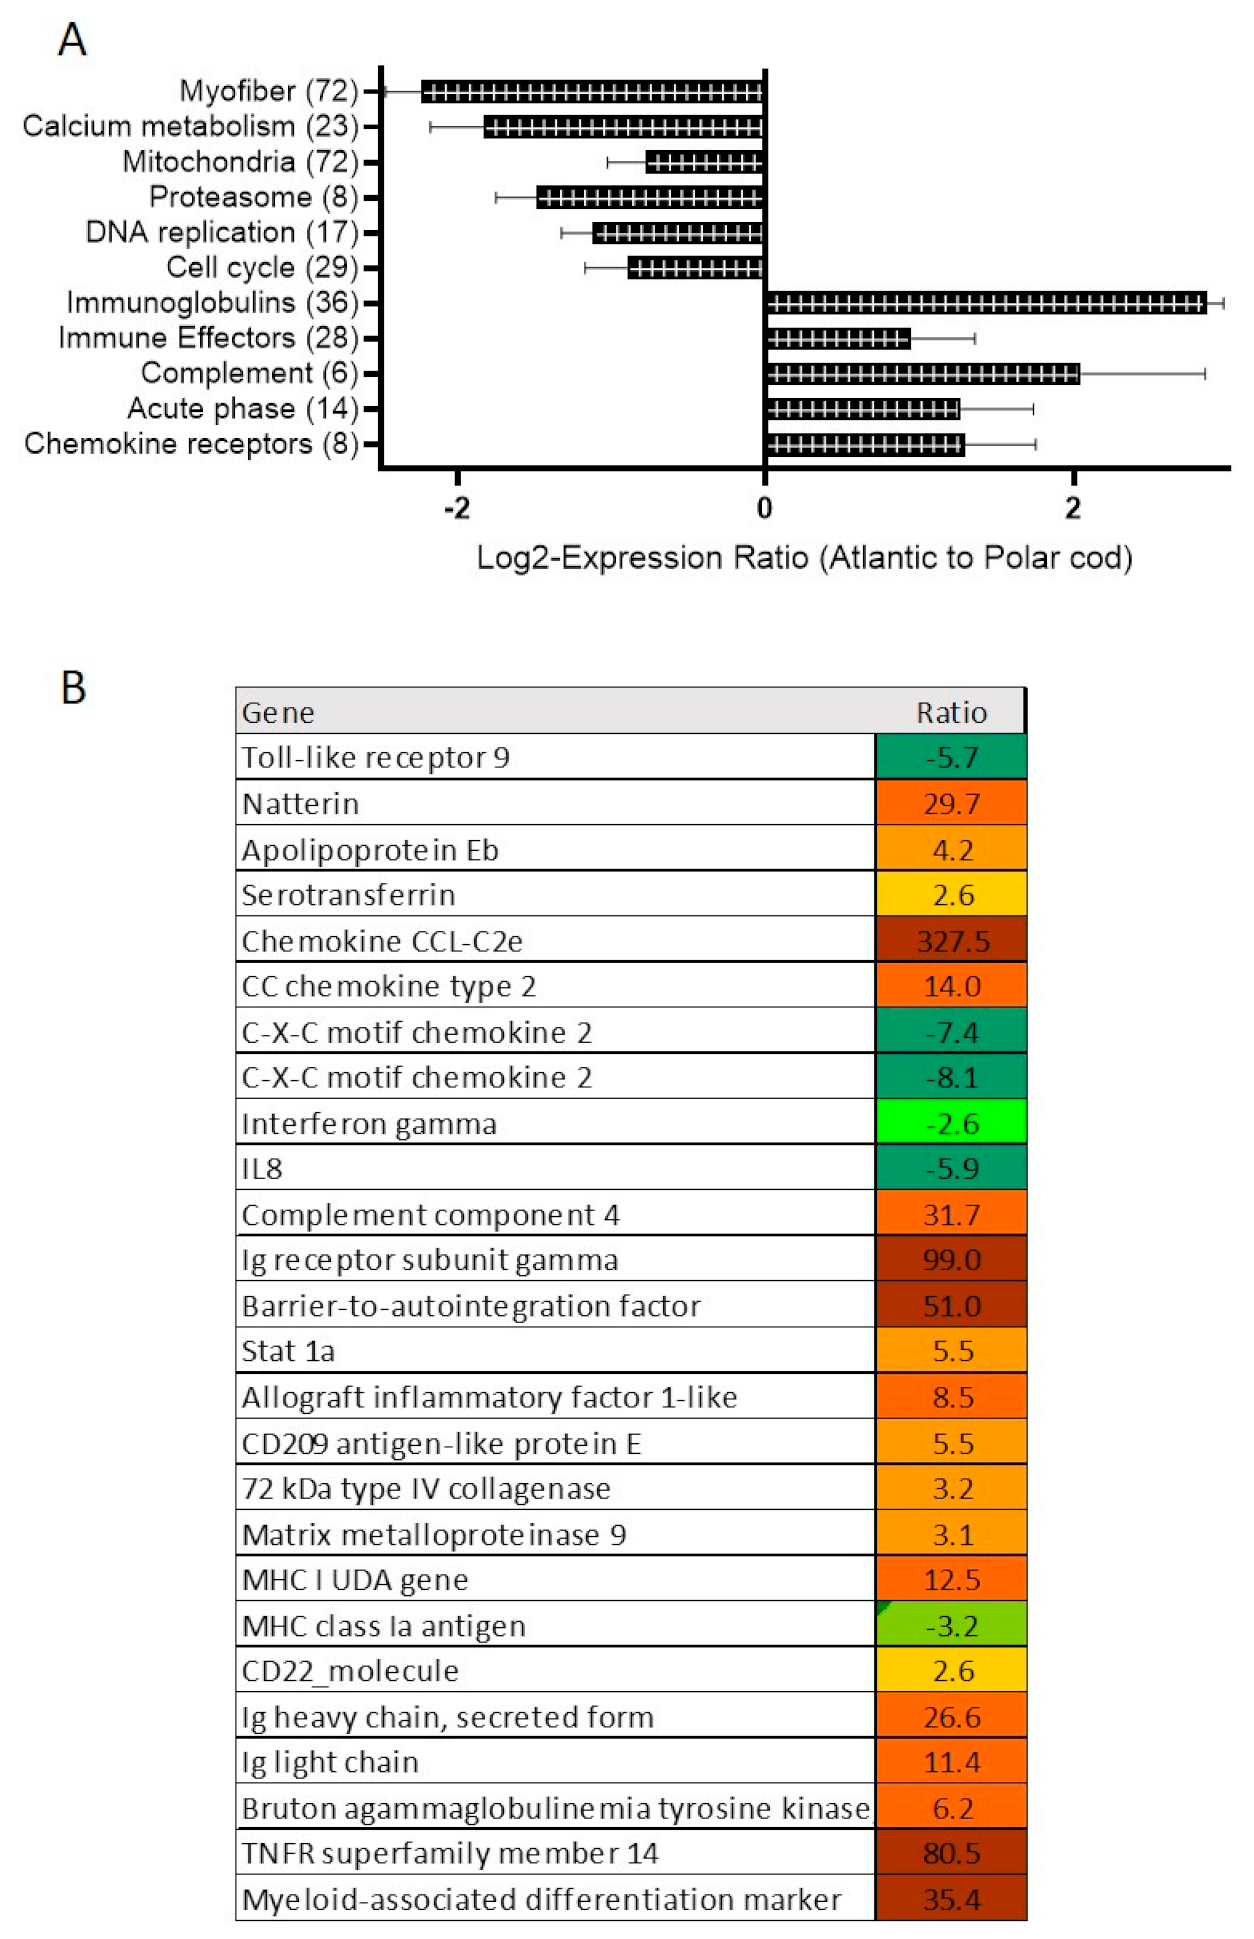
2.2. Skin Transcriptome

Comparison of transcriptomes (n = 6 in polar cod, n = 9 in Atlantic cod) found 6546 genes with differential expression between two species (Supplementary Materials S1). Differentially expressed genes (DEG) from several functional groups showed similar expression profiles (Figure 3A). Differences suggested more active proliferation of cells, turnover of proteins, energy metabolism and motility of cells in skin of polar cod. All functional groups with higher expression in Atlantic cod belonged to the immune system, the greatest difference observed in immunoglobulins. Figure 3B presents genes with diverse immune roles known for strong responses to pathogens and inflammatory agents. Several immune genes showed higher expression in polar cod (e.g., tlr9 and interferon gamma, il-8), but many more immune genes were characterized with higher activity in Atlantic cod, especially genes related to adaptive responses (e.g., bruton tyrosine kinase and tnfr superfamily member 14).

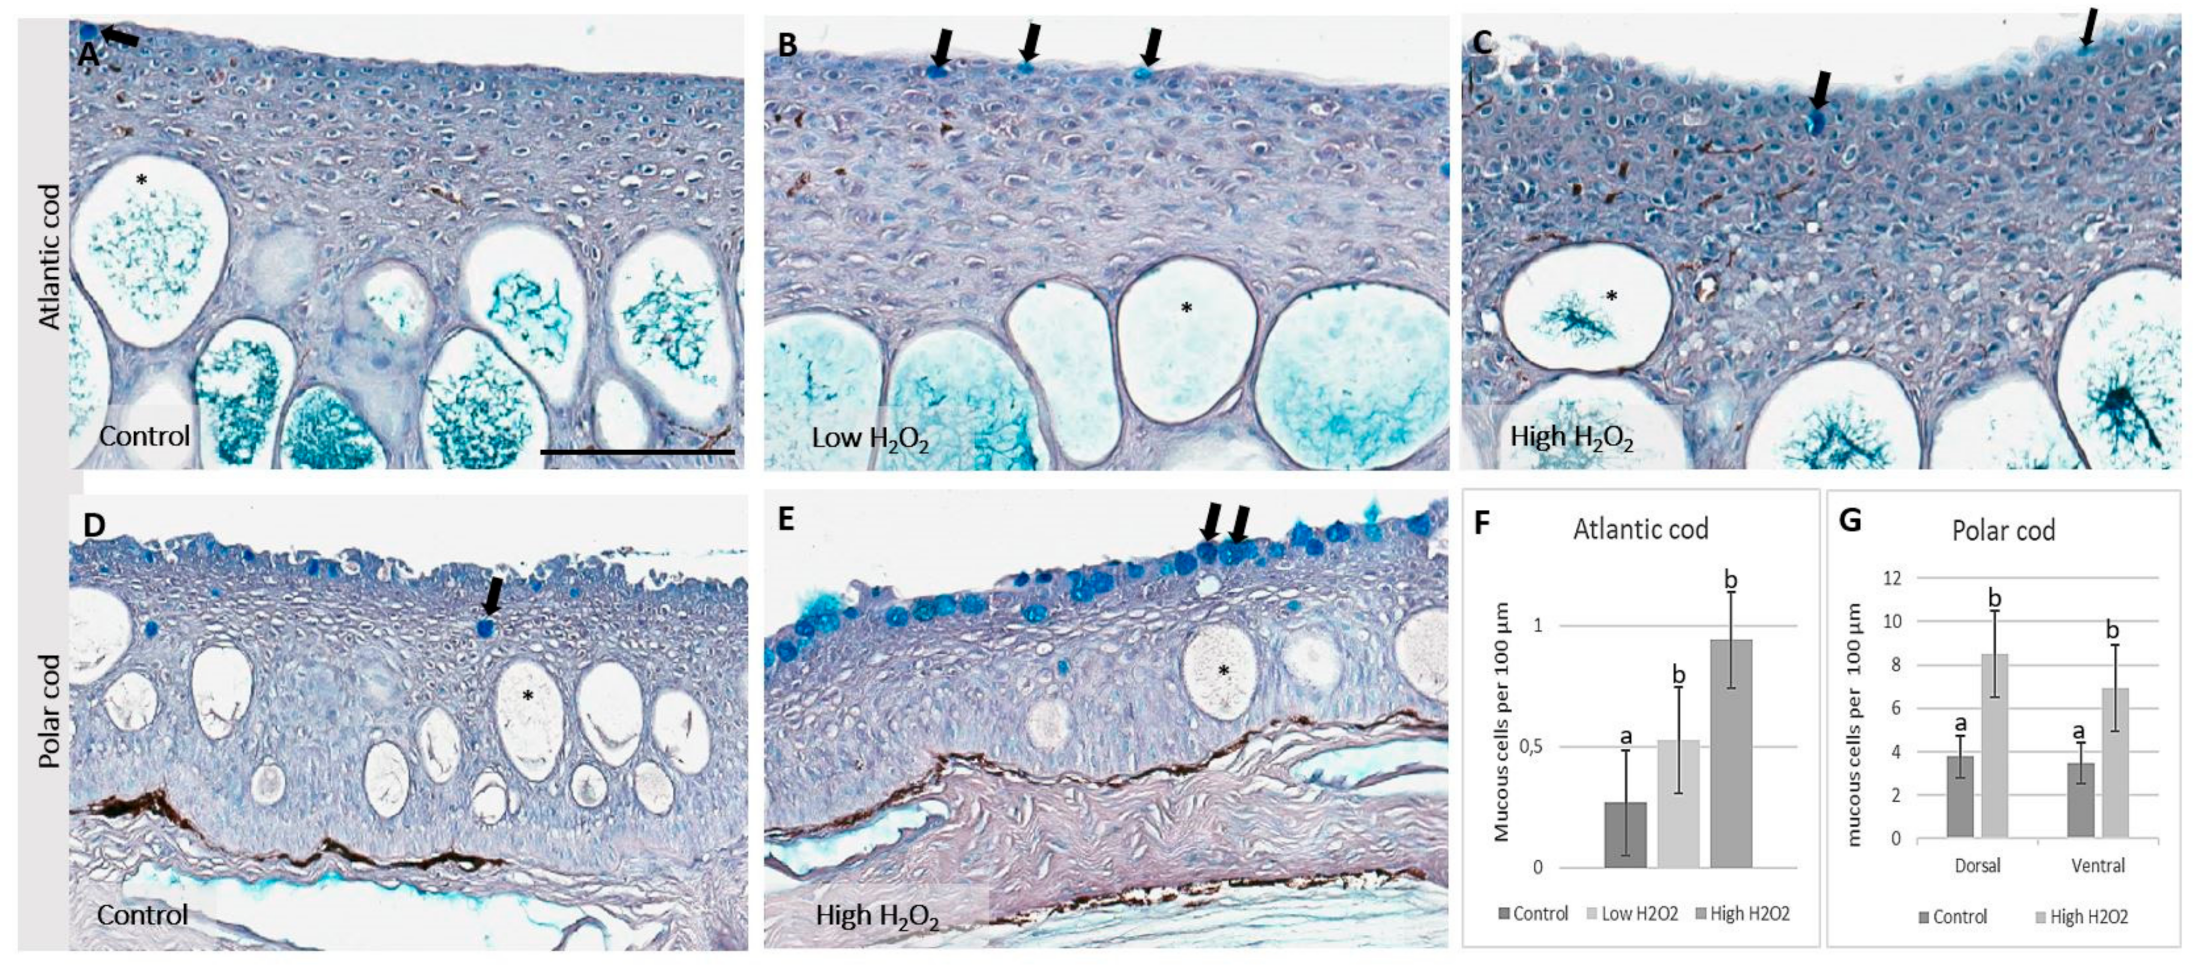
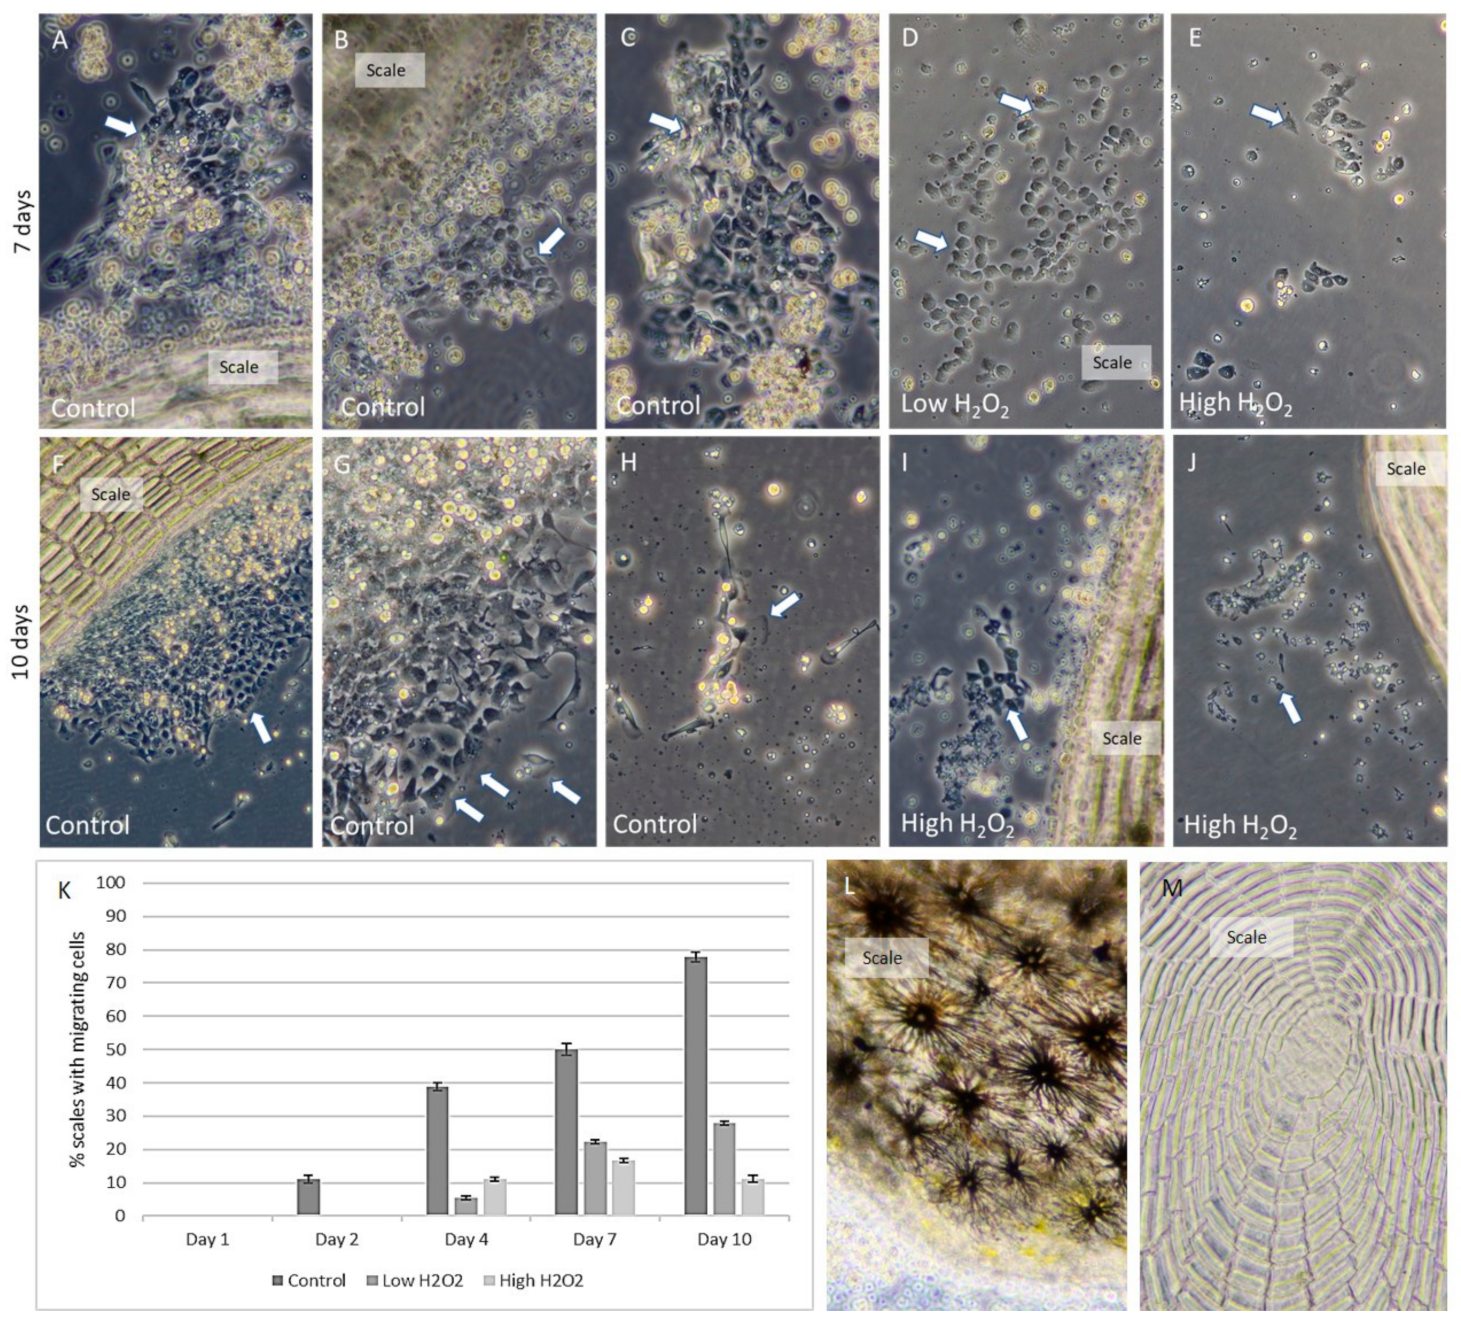
2.3. Effects of Hydrogen Peroxide Exposure on Skin

Morphological changes in skin were revealed after 20 min of exposure to H2O2. Both species had a rougher outer border of keratocytes compared to the control (Figure 4). The number of mucous cells increased after exposure in a dose-dependent manner in Atlantic cod, being most pronounced after exposure to the high concentration. In polar cod, mucous cells increased at both the dorsal and the ventral side (Figure 4G,H). The responses were different between species: in polar cod, mucous cells tended to accumulate in the outermost epidermal layer (Figure 4F), whereas in Atlantic cod, the recruited mucous cells were distributed more evenly in the epidermis.
The histological findings were confirmed with SEM (Figure 5). Exposed keratocytes from both species had reduced microridges and more cracks and crazing in the continuous epidermal layer, which could be due to cells falling off, dying or shrinking, as shown in Figure 5B. This was more apparent in Atlantic cod, but crazing and reduced microridges could also be observed in polar cod (Figure 5C,D). SEM confirmed the increased number of mucous cells on the skin surface of polar cod (Figure 5D).
Microarray analyses also revealed marked differences of responses to H2O2 in the two cod species. The effects of treatment on skin of Atlantic cod was minor: only one DEG at low dose and 21 DEG at high dose (Supplementary Materials S1). Thirteen DEG belonged to different functional groups, and the rest had unknown roles. In polar cod, 46 and 108 genes were respectively upregulated and downregulated. Decreased expression of diverse immune genes, components of the extracellular matrix and modifying enzymes were observed (Table 1). Downregulation was shown by three genes for laminin, the main component of basal membrane, and five genes encoding transglutaminases.

2.4. Primary Cell Culture of Atlantic Cod Keratocytes

To assess effects of H2O2 on keratocytes, their migration from Atlantic cod scales was analyzed. Cultured keratocytes migrate from scales onto the bottom of the plate, making confluent cell sheets, and reduced motility may reflect impaired performance of these cells [37]. There was no migration from the scales on the first day after any of the treatments, but movement was observed the following days (Figure 6). Sheets of keratocytes spread out from the scales, and individually migrating keratocytes were also observed. Seven days after isolation, cells migrated from 50% of the scales from control fish (Figure 6A–C), but only from 20% and from less than 15% of scales from fish exposed to low and high doses of H2O2, respectively. Appearance of cells in cultures from the control group was typical for fish keratocytes, with a main core and a lamellipodium defining the direction of movement [38]. In wells with scales from fish exposed to H2O2, keratocytes had a rounder and more condensed appearance (Figure 6D,E). The experiment was terminated at day 10 when ~80% of the control scales, ~30% of the scales from the fish exposed to the low dose and ~10% of the scales from the fish exposed to the high dose had migrating cells (Figure 6K). In wells with cells from the high dose exposed fish, few cells could be detected at this time point (Figure 6J); the remaining cells had a condensed and rounded shape. Melanocytes were found on top of the scales (Figure 6L) and the scales had mineralized ring shaped structures (Figure 6M) as previously described [31].

3. Discussion

Understanding responses of marine species to contaminants and environmental variables is essential to assess impacts and to predict consequences of future changes in the oceans with respect to conservation of wild fish stocks, management of fisheries and development of aquaculture. Common tests of chemical and environmental stressors are expensive and require live animals. Ethical and cost constraints drive development of methods that can mimic the in vivo situations with a smaller number of animals without the need to expose fish. We have developed tools and models for evaluation of Atlantic salmon skin that have been used to study effects of pH, temperature and toxic compounds [30,39,40]. In the present study, we characterized skin from Atlantic cod and polar cod and showed how cod skin from can be used in vitro for evaluation of chemical stressors.

3.1. Polar Cod and Atlantic Skin Differ in Skin Micro-Architecture

Polar cod and Atlantic cod have the four characteristics layers of skin. In addition, they have scales, club cells and sensory cells. Fish scales are common in fish skin, and are shields of armor to protect the animal against predators, enhance swimming and to serve as reservoirs for minerals [16,41,42,43]. Club cells and sensory cells in the epidermal layer of cod have previously been described [44]. Fish and other vertebrates use their taste bud cells to sample potential food and to either select or reject substances according to their edibility [45]. However, their exact role in cod need to be further elaborated.
A few differences in the skin micro-architectural structures were observed between the two cod species, such as the placement of scales, the number of mucous cells and the difference in folding of the epidermis. Since all skin samples were collected from mature individuals and at the same locations, the observed differences could reflect the different environments that the species live in and the different environmental challenges that they face. The higher number of mucous cells and the more folded structure of the skin surface in polar cod could function for better isolation and reflect an adaptation strategy to colder temperatures. For adaptation to the aquatic environment, fish skin is covered by mucous that serves to maintain health, homeostasis and integrity of the skin (reviewed in [11]). The superficial keratocytes in the epidermis are flat and display elevated structures called microridges [46], a pattern that provides a larger epidermal surface which is suggested to be involved in mucous retention [47]. Similar functions may apply for a more folded structure of the skin, where mucous and water may be captured in between the folds. However, differences between farmed and wild cod and adaptation to indoor research conditions must also be taken into consideration.
Polar cod has smaller scales compared to Atlantic cod; those smaller scales are embedded in the skin. They are placed deeper in the skin’s layers, do not overlap and the protection of the scales, therefore, is not continuous [31]. Polar cod also have bony plates which can be beneficial in periods with restricted availability of food [43]. Scales grows one ring at a time through coordinated processes of matrix production and bone mineralization [48,49]. Through dissolution by the bone resorptive cells, the osteoclasts, scales may act as a reservoir for calcium and phosphorus [50,51,52]. Similar functions may apply for the bone plates in polar cod. Since polar cod are strongly associated with the sea ice habitat, harsh conditions and periods with severe food restriction are probable [1,6].
Transcriptome analyses revealed major differences between the two species. Polar cod had a marked upregulation of genes encoding myofiber proteins, genes involved in DNA replication and cell cycle, protein turnover (proteasomes) and energy metabolism (mitochondria). These results may indicate greater motility and faster renovation of polar cod skin, as shown for zebrafish keratocytes [53]. Cell localization of myofiber proteins is still unknown, but they are likely to be expressed in highly motile keratocytes. Most genes and functional groups with higher expression in Atlantic cod have immune roles. Of note are genes related to adaptive responses, such as bruton tyrosine kinase, a master regulator of B cells development [54], and tnfr superfamily member 14, essential for differentiation of B and T cells [55]. These differences could be due to domestication and breeding, which gives advantage to the individuals with better ability to resist infections at high stocking densities. It is also possible that pathogen pressure is substantially lower in the habitat of polar cod, and a high activity of the defence system is not required. In future trials, it will be interesting to compare wild fish of both species and to perform common garden trials with Atlantic and polar cod.

3.2. Exposure to Hydrogen Peroxide

Skin from both cod species had increased areas of keratocytes with reduced microridges and increased crackings, indicating superficial damages to the skin after exposure to H2O2. As skin serves as a continuous protection, a compound that disrupts the epidermis barrier properties or regeneration capacity may threaten survival and health. H2O2 has a rapid oxidizing effect that potentially disrupts membranes [35]. Several studies have shown that different stressors can affect skin functions and morphology in a variety of fish species [56,57,58,59]. Chemicals, environmental conditions or stress may induce small breaches and wounds to this layer, thus weakening the skin’s barrier properties. Skin from carp (Cyprinus carpio) exposed to acidic water showed increased apoptosis in the outermost keratocytes [59] and damaged microridges were detected in the epithelial cells in bleak (Alburnus alburnus) after mercury exposure [58]. In Atlantic salmon, damaged outer epidermis has been reported after stress induced by crowding [26]. In our study, downregulation of genes encoding laminin and transglutaminases could reflect reduced strength in the epidermis. Laminins are a major part of the basement membrane, and transglutaminases are enzymes that catalyze cross-linking of epidermal cells [60]. Combined, these studies show that different stressors may induce structural damages to the outer epidermal layer of keratocytes that ultimately may weaken the protective properties of the skin as a barrier system.
The total mucous cell number increased after exposure to H2O2 in both species, indicating a response in the barrier defense system [57,61]. This is similar to the response seen in Atlantic salmon, where mucous cell numbers increased in skin after H2O2 exposure both in in vivo and in vitro trials. Polar cod showed a different response, with mucous cells translocating to the outermost part of the epidermis. This pattern of mucous cells has previously been reported in salmon exposed to chronic stress [39]. Mucous cell distribution has been shown to be stress-sensitive in other species and with other stressors, and both an increase and decrease in mucous cells have been reported [56,59]. In Arctic char (Salvelinus alpinus L.) [62], and in sea bass (Dicentrarchus labrax L.) [63], stress increased the mucous production. Difference in mucous cell response between the two cod species could indicate a higher responsiveness to environmental stressors in polar cod and preference for a proactive fight-or-flight response in wild fish.
Microarray analyses did not reveal a marked response to H2O2 in skin from Atlantic cod. In polar cod, downregulation of several immune genes and genes involved in development of extracellular matrix indicate that the chemical stressors may affect the protective and mechanical properties of skin. The observed gene expression changes were relatively small, especially in comparison with other interspecific differences. For salmon, documented treatment outcomes of H2O2 include oxidative and respiratory stress, physiological stress, transcriptome modulation of the skin and mortality [64,65,66]. Small transcriptional differences in this study could be due to sampling time after exposure (20 min), and other responses could possibly have been observed after longer exposure time and/or extended period of recovery.

3.3. Keratocyte Cod Cell Culture is a Promising In Vitro Model

The in vitro trial showed that keratocytes from Atlantic cod can be cultured, and that the cells are similar to those described for other fish species [11,38]. The keratocytes migrated from the fish scale onto the surface of the culture plate, resulting in confluent cell sheets. Migration of keratocytes is important for skin regeneration and wound healing, and reduced motility may delay the process [11,37]. The keratocytes from Atlantic cod responded to H2O2 in a dose-dependent manner, where the highest dose caused highest reduction in motility. H2O2 exposure also resulted in cells with a rounder and more condensed appearance, as described for retracting keratocytes in zebrafish (Danio rerio) [37]. Keratocyte locomotion in cold water species occur at a slower rate compared to warm water species, and this may influence and delay wound healing processes [67]. Our results show that additional exposure to chemicals may further retard migration of keratocytes, thus challenging cod health. The keratocyte cell culture represents a unique system where re-epithelialization, wound healing and effect of chemicals and environmental parameters may be studied in detail, similar to what has previously been described for other species [38,39,68].
Combined, our studies show that skin from cod respond to stimuli in a way that may be assessed and quantified with several different techniques. Histology, transcriptomics and migration capacity can detect the immediate and long-term effects of exposures. Thus, fish skin from both Atlantic cod and polar cod is a promising tissue for evaluation of different stressors on fish health, including acute and prolonged effects.

4. Materials and Methods

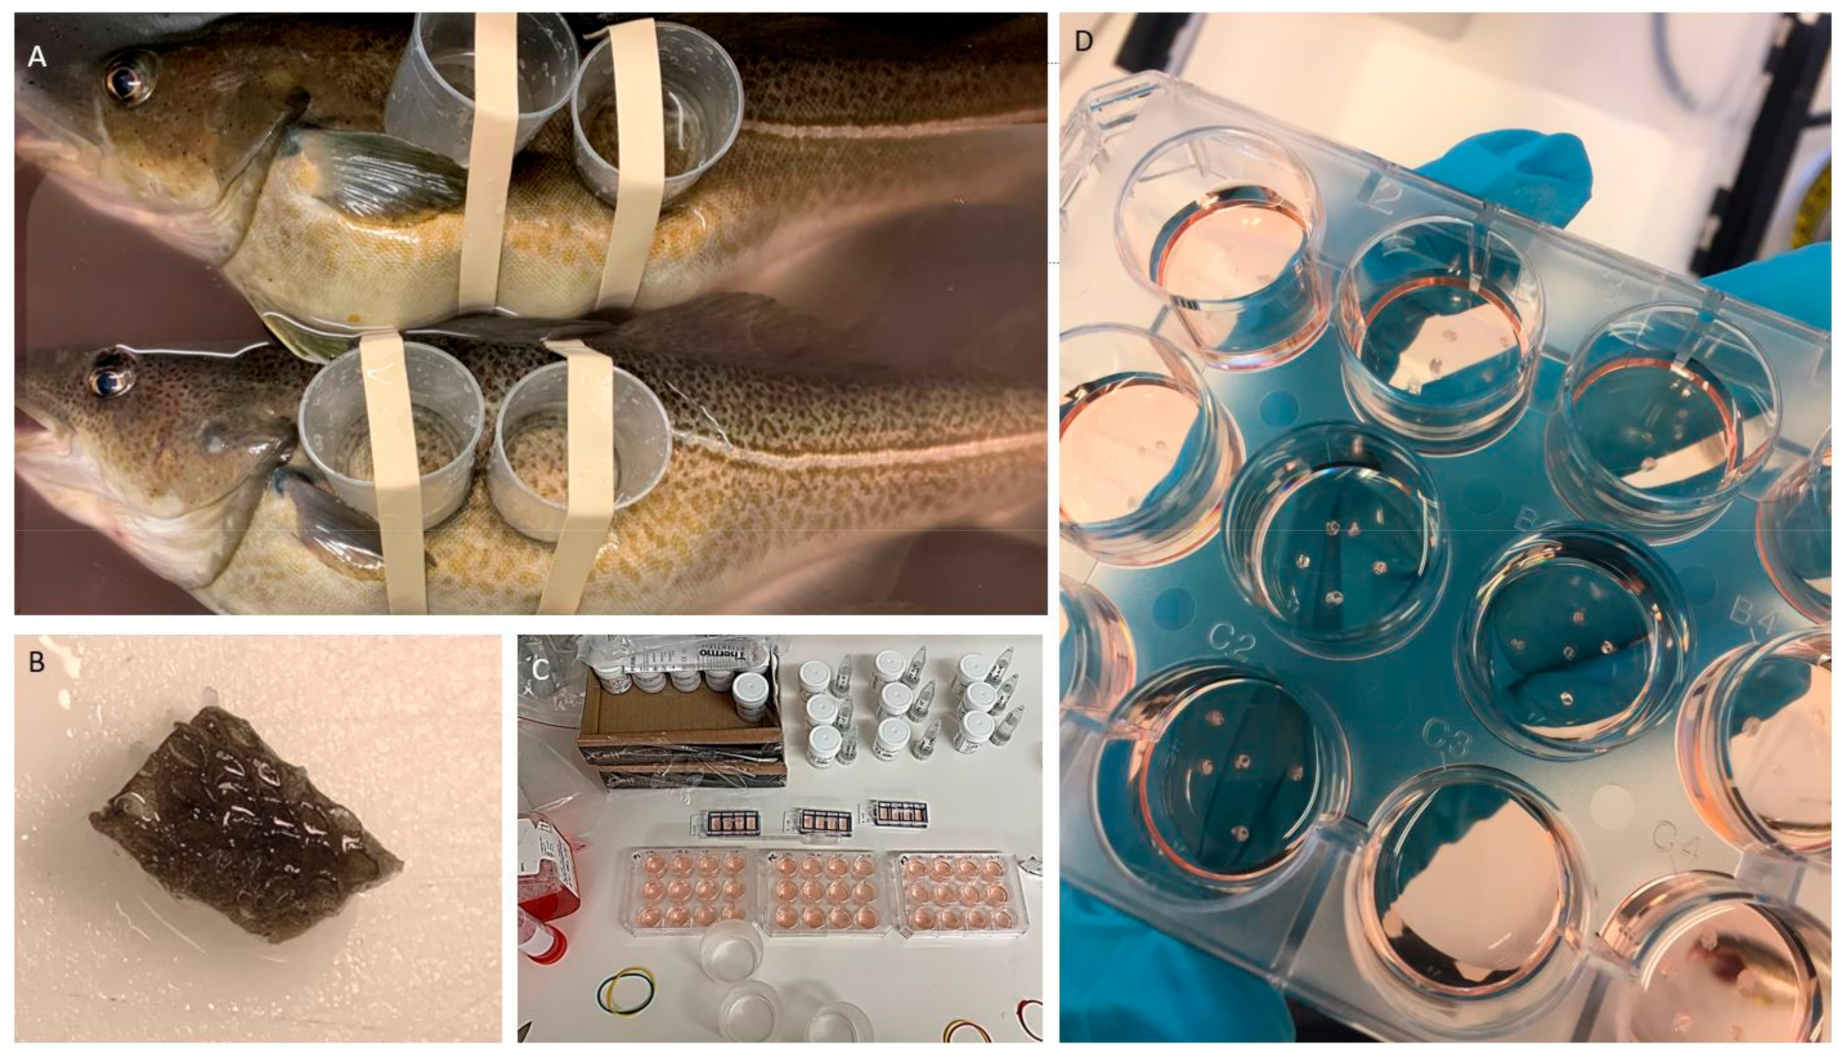
4.1. Experimental Setup and Sampling

The experiments on Atlantic cod and polar cod were conducted at the Centre for Marine Aquaculture and Tromsø Aquaculture research station, Tromsø, Norway, respectively. Atlantic cod, with an average weight of 3 kg, were from the national breeding program for cod’s 2016 year-class (fourth generation of selected cod). The polar cod, with an average weight of 200 g, were caught in Southeastern Hinlopen in November 2017 (78°55′ N, 23°40′ E). Fish were kept in flow through indoor tanks and continuously fed with natural food (Calanus sp. from CALANUS AS, Lofoten, Norway). Polar cod were kept at 4 °C and Atlantic cod at 8 °C at the time of sampling.
Hydrogen peroxide (H2O2, Sigma-Aldrich, UK) was applied as a chemical stressor. Atlantic cod (n = 3) were killed by blows to their heads. Exposure to high (1.15 g/L) and low (0.115 g/L) concentrations of H2O2 diluted in saltwater, or to saltwater (control) was conducted using a system modified from Karlsen and colleagues [30]. Cups were attached to the fish skin and sealed by elastic bands, as shown in Figure 7A. The H2O2 solutions and saltwater were poured into separate cups on the same fish. The high concentration of H2O2 was similar to what is used in Atlantic salmon farming for treatment against lice [36]. Control and exposed skin biopsies were sampled (Figure 7B). Samples for SEM and histology were fixed in formalin (CellstoreTM, CellPath, UK) and stored at 4 °C, and samples for gene transcription analyses were stored in RNA-later (Ambion, Thermo Fisher, MA, USA) at −20 °C. In addition, scales from control and exposed fish were sampled for in vitro studies (Figure 7C,D) as described in the following sections.
Polar cod were killed by blows to their heads and were exposed to the high H2O2 concentration (1.15 g/L) or kept in saltwater (control) for 20 min at 4 °C (n = 3 fish per treatment). Skin was sampled in the same regions and with the same techniques as described for Atlantic cod. The small size of polar cod allowed sampling skin sections containing both ventral and dorsal side in the same biopsy. Because the deep position of scales in the skin of polar cod made them inaccessible, the in vitro cultivation of keratocytes was not performed.

4.2. Histological Staining

Skin samples fixed in buffered 4% formalin (n = 3 per group), were carefully dissected, orientated and placed in tissue embedding cassette (Simport, Quebec, Canada). To decalcify the skin, samples were incubated in EDTA (Merck KGaA, Darmstadt, Germany), pH 7 for 4 days. The samples were dehydrated through 100% alcohol and then in a clearent Xylene bath, using an automated tissue processor (TP1020, Leica Biosystems, Nussloch GmbH, Germany), before they were infiltrated in melted 60 °C paraffin (Merck KGaA, Darmstadt, Germany). Paraffin-embedded tissue samples were cut in 5 µm sections using a Microtome (Leica RM 2165), mounted on polysin coated slides (VWR, Avantor, PA, USA) and dried overnight at 37 °C. The sections were deparaffinized and rehydrated, and staining was performed using an automated special stainer (Autostainer XL Leica Biosystems, Nussloch GmbH, Germany). Paraffin sections were stained with Alcian Blue Periodic Acid Schiff (AB/PAS, pH 2.5, Alcian Blue 8GX, Sigma Aldrich, Darmstadt, Germany). The slides were examined by light microscope slide scanner and evaluated in Aperio Image Scope (Leica Microsystems, Wetzlar, Germany) and statistical measures were calculated using the t-test (p < 0.05).

4.3. Scanning Electron Microscopy (SEM)

Skin samples for SEM were dehydrated from PBS to 100% EtOH and dried using a Critical Point Dryer (CPD 030, Bal-tec AG, Schalksmühle, Germany) with liquid carbon dioxide as the transitional fluid. The samples were then mounted on stubs with carbon tape and coated with gold–palladium (Polaron Emitech SC7640 Sputter Coater, Quorum technologies, East Sussex, UK). Imaging was performed at the Imaging Centre, Faculty of Biosciences, Norwegian University of Life Sciences (Zeiss EVO-50–EP, Carl Zeiss SMT Ltd., 511 Coldhams Lane, Cambridge CB1 3JS, UK).

4.4. RNA Extraction

Skin sections in RNA-later (n = 3 per group) were transferred to 1 mL TRIzol™ (Thermo Fisher Scientific, MA, USA) homogenized in a Precellys® 24 homogenizer. RNA was extracted from the homogenized tissues using PureLink™ Pro 96 well purification kit (Thermo Fisher Scientific) with on-column-DNase digestion (Qiagen, Hilden, Germany), according to the protocol for TRIzol-homogenized samples. Total RNA concentration was measured with NanoDrop 1000 Spectrometer (Thermo Fisher Scientific) and RNA integrity was determined with Agilent 2100 Bioanalyzer with RNA Nano kits (Agilent Technologies, CA, USA). Samples with RNA integrity number (RIN) of 8 or higher were accepted.

4.5. Microarray

Transcriptome analyses were performed using Nofima’s 44k genome-wide oligonucleotide Atlantic cod microarray. Due to the high similarity of protein coding sequences, this platform works equally well with both species [8,69]. Microarrays were manufactured by Agilent Technologies, and all reagents and equipment were purchased from the same provider. Analyses included controls and skin of fish exposed to low (Atlantic cod only) and high doses (both species) of H2O2. RNA amplification and labeling were performed with a One-Color Quick Amp Labelling Kit, and a Gene Expression Hybridization kit was used for fragmentation of labeled RNA. After overnight hybridization in an oven (17 h, 65 °C, rotation speed 0.01 g), arrays were washed (Gene Expression Wash Buffers 1 and 2) and scanned. Subsequent data analyses were performed with Nofima’s bioinformatic package STARS (Salmon and Trout Annotated Reference Sequences) [70]. Global normalization was performed by equalizing the mean intensities of all microarrays. The individual values for each feature were divided by the mean value of all samples producing expression ratios (ER). The log2-ER were calculated and normalized with the locally weighted non-linear regression (Lowess). DEG were selected by criteria: 1.75-fold and p < 0.05. STARS annotations were used for comparisons of functional groups of genes.

4.6. In Vitro Primary Keratocyte Cell Culture

Atlantic cod keratocytes cultured from whole scale explants [30,39] were used to investigate the effect of H2O2 on cell migration. Single scales were picked with forceps from the left side above the lateral line and placed in 12 well tissue culture plates (Falcon Multiwell™ Becton Dickinson, NJ, USA.), 5 scales per well, 3 wells per fish. Each well contained L-15 supplemented with fetal bovine serum (FBS) 10%, 25 μg amphotericin B, 10 mL/L antibiotics, antimycotics and 0.01 M HEPES (Sigma). Plates were incubated at 8 °C in a cell incubator without CO2. After one, two, four, seven and ten days, cells were microscopically analyzed (Zeiss, AxioVision, Germany). Cultures were compared by the percentage of scales with migrating cells (defined as cells moving to the bottom of the well making a confluent cell sheet surrounding the scales) to the total number of scales. Scales that loosened from the bottom were not considered.

Supplementary Materials

The following are available online at https://0-www-mdpi-com.brum.beds.ac.uk/2410-3888/5/4/34/s1, S1: Microarray data.

Author Contributions

Formal analysis, E.Y. and S.A.; investigation, E.Y., Ø.J.H. and A.K.; methodology, E.Y., V.H., S.A., I.V., J.N. and A.K.; project administration, E.Y., I.V. and A.K.; software, S.A. and A.K.; validation, E.Y. and A.K.; visualization, E.Y., V.H. and A.K.; writing—original draft, E.Y., Ø.J.H., V.H., I.V., J.N. and A.K.; writing—review and editing, E.Y., Ø.J.H., S.A., J.N. and A.K. All authors have read and agreed to the published version of the manuscript.

Funding

This research was funded by the Norwegian Research Council, grant number 194050. Polar cod was obtained from the “Nansen Legacy” project (RCN ID #275730, UiT The Arctic University of Norway).

Acknowledgments

The authors are grateful to the Imaging Centre, Faculty of Biosciences, Norwegian University of Life Sciences, where the SEM analyses were performed. Polar cod was obtained from the “Nansen Legacy” project (RCN ID #275730, UiT The Arctic University of Norway).

Conflicts of Interest

The authors declare no conflict of interest.

References

  1. Hop, H.; Gjøsæter, H. Polar cod (Boreogadus saida) and capelin (Mallotus villosus) as key species in marine food webs of the Arctic and the Barents Sea. Mar. Biol. Res. 2013, 9, 878–894. [Google Scholar] [CrossRef]
  2. Welch, H.E.; Bergmann, M.A.; Siferd, T.D.; Martin, K.A.; Curtis, M.F.; Crawford, R.E.; Conover, R.J.; Hop, H. Energy-flow through the marine ecosystem of the Lancaster Sound Region, Arctic Canada. Arctic 1992, 45, 343–357. [Google Scholar] [CrossRef] [Green Version]
  3. Misund, O.A.; Heggland, K.; Skogseth, R.; Falck, E.; Gjøsæter, H.; Sundet, J.; Watne, J.; Lønne, O.J. Norwegian fisheries in the Svalbard zone since 1980. Regulations, profitability and warming waters affect landings. Polar Sci. 2016, 10, 312–322. [Google Scholar] [CrossRef] [Green Version]
  4. Carroll, J.; Vikebø, F.; Howell, D.; Broch, O.J.; Nepstad, R.; Augustine, S.; Skeie, G.M.; Bast, R.; Juselius, J. Assessing impacts of simulated oil spills on the Northeast Arctic cod fishery. Mar. Pollut. Bull. 2018, 126, 63–73. [Google Scholar] [CrossRef] [PubMed]
  5. Henriksen, E.; Hansen, H.M.; Øyvind, J.; Mortensen, A. Kunnskaps-Og Erfaringsgrunnlag for Torskeoppdrett; Research Report; Nofima 23: Tromsø, Norway, 2018. [Google Scholar]
  6. David, C.; Lange, B.; Krumpen, T.; Schaafsma, F.; van Franeker, J.A.; Flores, H. Under-ice distribution of polar cod Boreogadus saida in the central Arctic Ocean and their association with sea-ice habitat properties. Polar Biol. 2016, 39, 981–994. [Google Scholar] [CrossRef]
  7. Lønne, O.J.; Gulliksen, B. Size, age and diet of polar cod, Boreogadus saida (Lepechin 1773), in ice covered waters. Polar Biol. 1989, 9, 187–191. [Google Scholar] [CrossRef]
  8. Andersen, O.; Frantzen, M.; Rosland, M.; Timmerhaus, G.; Skugor, A.; Krasnov, A. Effects of crude oil exposure and elevated temperature on the liver transcriptome of polar cod (Boreogadus saida). Aquat. Toxicol. 2015, 165, 9–18. [Google Scholar] [CrossRef] [PubMed]
  9. Nahrgang, J.; Camus, L.; Gonzalez, P.; Goksoyr, A.; Christiansen, J.S.; Hop, H. PAH biomarker responses in polar cod (Boreogadus saida) exposed to benzo(a)pyrene. Aquat. Toxicol. 2009, 94, 309–319. [Google Scholar] [CrossRef] [PubMed]
  10. Whiteley, N.M.; Christiansen, J.S.; Egginton, S. Polar cod, Boreogadus saida (Gadidae), show an intermediate stress response between Antarctic and temperate fishes. Comp Biochem. Physiol A Mol. Integr. Physiol 2006, 145, 493–501. [Google Scholar] [CrossRef]
  11. Sveen, L.; Karlsen, C.; Ytteborg, E. Mechanical induced wounds in fish–A review on models and healing mechanisms. Rev. Aquac. 2020, 1–20. [Google Scholar]
  12. Videler, J.J. Fish Swimming; Springer Science & Business Media: Berlin/Heidelberg, Germany, 2012. [Google Scholar]
  13. Glover, C.N.; Bucking, C.; Wood, C.M. The skin of fish as a transport epithelium: A review. J. Comp. Physiol. B 2013, 183, 877–891. [Google Scholar] [CrossRef] [PubMed]
  14. Groff, J.M. Cutaneous Biology and Diseases of Fish; Veterinary Clinics of North America: Exotic Animal Practice; Elsevier: Amsterdam, The Netherlands, 2001; Volume 4, pp. 321–411. [Google Scholar]
  15. Rubin, M.A. Thermal reception in fishes. J. Gen. Physiol. 1935, 18, 643–647. [Google Scholar] [CrossRef] [PubMed] [Green Version]
  16. Szewciw, L.; Barthelat, F. Mechanical properties of striped bass fish skin: Evidence of an exotendon function of the stratum compactum. J. Mech. Behav. Biomed. Mater. 2017, 73, 28–37. [Google Scholar] [CrossRef] [PubMed]
  17. Lane, E.B.; Whitear, M. Sensory structures at the surface of fish skin: I. Putative chemoreceptors. Zool. J. Linn. Soc. 2008, 75, 141–151. [Google Scholar] [CrossRef]
  18. Kotrschal, K. Ecomorphology of solitary chemosensory cell systems in fish: A review. In Ecomorphology of Fishes; Luczkovich, J.J., Motta, P.J., Norton, S.F., Liem, K.F., Eds.; Springer: Dordrecht, The Netherlands, 1995; pp. 143–155. [Google Scholar]
  19. Päkk, P.; Hussar, P.; Järveots, T.; Paaver, T. Club cells active role in epidermal regeneration after skin hyperplasia of koi carp Cyprinus carpio. AACL Bioflux 2011, 4, 455–462. [Google Scholar]
  20. Halbgewachs, C.F.; Marchant, T.A.; Kusch, R.C.; Chivers, D.P. Epidermal club cells and the innate immune system of minnows. Biol. J. Linn. Soc. 2009, 98, 891–897. [Google Scholar] [CrossRef]
  21. Ledy, K.; Giamberini, L.; Pihan, J.C. Mucous cell responses in gill and skin of brown trout (Salmo trutta) fario in acidic, aluminium-containing stream water. Dis. Aquat. Organ. 2003, 56, 235–240. [Google Scholar] [CrossRef]
  22. Holm, H.J.; Skugor, S.; Bjelland, A.K.; Radunovic, S.; Wadsworth, S.; Koppang, E.O.; Evensen, Ø. Contrasting expression of immune genes in scaled and scaleless skin of Atlantic salmon infected with young stages of Lepeophtheirus salmonis. Dev. Comp. Immunol. 2017, 67, 153–165. [Google Scholar] [CrossRef]
  23. Esteban, M. An overview of the immunological defenses in fish skin. ISRN Immunol. 2012, 2012, 29. [Google Scholar]
  24. Berntssen, M.H.G.; Kroglund, F.; Rosseland, B.O.; Wendelaar Bonga, S.E. Responses of skin mucous cells to aluminium exposure at low pH in Atlantic salmon (Salmo salar) smolts. Can. J. Fish. Aquat. Sci. 1997, 54, 1039–1045. [Google Scholar] [CrossRef] [Green Version]
  25. Zuchelkowski, E.M.; Lantz, R.C.; Hinton, D.E. Effects of acid-stress on epidermal mucous cells of the brown bullhead Ictalurus nebulosus (LeSeur): A morphometric study. Anat. Rec. 1981, 200, 33–39. [Google Scholar] [CrossRef]
  26. Sveen, L.R.; Timmerhaus, G.; Krasnov, A.; Takle, H.; Handeland, S.; Ytteborg, E. Wound healing in post-smolt Atlantic salmon (Salmo salar L.). Sci. Rep. 2019, 9, 3565. [Google Scholar] [CrossRef] [Green Version]
  27. Tadiso, T.M.; Krasnov, A.; Skugor, S.; Afanasyev, S.; Hordvik, I.; Nilsen, F. Gene expression analyses of immune responses in Atlantic salmon during early stages of infection by salmon louse (Lepeophtheirus salmonis) revealed bi-phasic responses coinciding with the copepod-chalimus transition. BMC Genom. 2011, 12, 141. [Google Scholar] [CrossRef] [PubMed] [Green Version]
  28. Karlsen, C.; Ytteborg, E.; Timmerhaus, G.; Høst, V.; Handeland, S.; Jørgensen, S.M.; Krasnov, A. Atlantic salmon skin barrier functions gradually enhance after seawater transfer. Sci. Rep. 2018, 8, 9510. [Google Scholar] [CrossRef]
  29. Kortner, T.M.; Skugor, S.; Penn, M.H.; Mydland, L.T.; Djordjevic, B.; Hillestad, M.; Krasnov, A.; Krogdahl, A. Dietary soyasaponin supplementation to pea protein concentrate reveals nutrigenomic interactions underlying enteropathy in Atlantic salmon (Salmo salar). BMC Vet. Res. 2012, 8, 101. [Google Scholar] [CrossRef] [Green Version]
  30. Karlsen, C.; Sorum, H.; Willassen, N.P.; Asbakk, K. Moritella viscosa bypasses Atlantic salmon epidermal keratocyte clearing activity and might use skin surfaces as a port of infection. Vet. Microbiol 2012, 154, 353–362. [Google Scholar] [CrossRef] [PubMed]
  31. Elliott, D. Functional morphology of the integumentary system in fishes. In Encyclopedia of Fish Physiology: From Genome to Environment; Farrell, A.P., Ed.; Academic Press: San Diego, CA, USA, 2011; Volume 1, pp. 476–488. [Google Scholar]
  32. Fontenot, D.K.; Neiffer, D.L. Wound management in teleost fish: Biology of the healing process, evaluation, and treatment. Vet. Clin. North Am. Exot. Anim. Pract. 2004, 7, 57–86. [Google Scholar] [CrossRef]
  33. Lazado, C.C.; Caipang, C.M. Probiotics-pathogen interactions elicit differential regulation of cutaneous immune responses in epidermal cells of Atlantic cod Gadus morhua. Fish Shellfish. Immunol. 2014, 36, 113–119. [Google Scholar] [CrossRef] [PubMed]
  34. Rajan, B.; Fernandes, J.M.; Caipang, C.M.; Kiron, V.; Rombout, J.H.; Brinchmann, M.F. Proteome reference map of the skin mucus of Atlantic cod (Gadus morhua) revealing immune competent molecules. Fish Shellfish. Immunol. 2011, 31, 224–231. [Google Scholar] [CrossRef]
  35. Torrissen, O.; Jones, S.; Asche, F.; Guttormsen, A.; Skilbrei, O.T.; Nilsen, F.; Horsberg, T.E.; Jackson, D. Salmon lice–Impact on wild salmonids and salmon aquaculture. J. Fish Dis. 2013, 36, 171–194. [Google Scholar] [CrossRef] [Green Version]
  36. Treasurer, J.W.; Grant, A. The efficacy of hydrogen peroxide for the treatment of farmed Atlantic salmon, Salmo salar L. infested with sea lice (Copepoda: Caligidae). Aquaculture 1997, 148, 265–275. [Google Scholar] [CrossRef]
  37. Rapanan, J.L.; Pascual, A.S.; Uppalapati, C.K.; Cooper, K.E.; Leyva, K.J.; Hull, E.E. Zebrafish keratocyte explants to study collective cell migration and reepithelialization in cutaneous wound healing. J. Vis. Exp. JoVE 2015, 96, e52489. [Google Scholar] [CrossRef] [Green Version]
  38. Keren, K.; Pincus, Z.; Allen, G.M.; Barnhart, E.L.; Marriott, G.; Mogilner, A.; Theriot, J.A. Mechanism of shape determination in motile cells. Nature 2008, 453, 475–480. [Google Scholar] [CrossRef] [PubMed] [Green Version]
  39. Sveen, L.R.; Timmerhaus, G.; Krasnov, A.; Takle, H.; Stefansson, S.O.; Handeland, S.O.; Ytteborg, E. High fish density delays wound healing in Atlantic salmon (Salmo salar). Sci. Rep. 2018, 8, 16907. [Google Scholar] [CrossRef] [PubMed]
  40. Mota, V.C.; Nilsen, T.O.; Gerwins, J.; Gallo, M.; Ytteborg, E.; Baeverfjord, G.; Kolarevic, J.; Summerfelt, S.T.; Terjesen, B.F. The effects of carbon dioxide on growth performance, welfare, and health of Atlantic salmon post-smolt (Salmo salar) in recirculating aquaculture systems. Aquaculture 2019, 498, 578–586. [Google Scholar] [CrossRef]
  41. Oeffner, J.; Lauder, G.V. The hydrodynamic function of shark skin and two biomimetic applications. J. Exp. Biol. 2012, 215, 785–795. [Google Scholar] [CrossRef] [Green Version]
  42. Wainwright, S.A.; Vosburgh, F.; Hebrank, J.H. Shark skin: Function in Locomotion. Science 1978, 202, 747–749. [Google Scholar] [CrossRef]
  43. De Vrieze, E.; Sharif, F.; Metz, J.R.; Flik, G.; Richardson, M.K. Matrix metalloproteinases in osteoclasts of ontogenetic and regenerating zebrafish scales. Bone 2011, 48, 704–712. [Google Scholar] [CrossRef] [Green Version]
  44. Harvey, R.; Batty, R.S. Cutaneous taste buds in cod. J. Fish Biol. 1998, 53, 138–149. [Google Scholar] [CrossRef]
  45. Hansen, A.; Reutter, K.; Zeiske, E. Taste bud development in the zebrafish, Danio rerio. Dev. Dyn. 2002, 223, 483–496. [Google Scholar] [CrossRef]
  46. Brown, G.; Wellings, S. Electron microscopy of the skin of the teleost, Hippoglossoides elassodon. Z. Zellforsch. Mikrosk. Anat. 1970, 103, 149–169. [Google Scholar] [CrossRef] [PubMed]
  47. Quilhac, A.; Sire, J.Y. Spreading, proliferation, and differentiation of the epidermis after wounding a cichlid fish, Hemichromis bimaculatus. Anat. Rec. 1999, 254, 435–451. [Google Scholar] [CrossRef]
  48. Sire, J.-Y.; Donoghue, P.C.J.; Vickaryous, M.K. Origin and evolution of the integumentary skeleton in non-tetrapod vertebrates. J. Anat. 2009, 214, 409–440. [Google Scholar] [CrossRef]
  49. Sire, J.-Y.; Donoghue, P.C.J.; Vickaryous, M.K. Scale development in zebrafish (Danio rerio). J. Anat. 1997, 190, 545–561. [Google Scholar] [CrossRef]
  50. Rotllant, J.; Redruello, B.; Guerreiro, P.; Fernandes, H.; Canario, A.V.; Power, D. Calcium mobilization from fish scales is mediated by parathyroid hormone related protein via the parathyroid hormone type 1 receptor. Regul. Pept. 2005, 132, 33–40. [Google Scholar] [CrossRef]
  51. Persson, P.; Takagi, Y.; Björnsson, B.T. Tartrate resistant acid phosphatase as a marker for scale resorption in rainbow trout, Oncorhynchus mykiss: Effects of estradiol-17β treatment and refeeding. Fish Physiol. Biochem. 1995, 14, 329–339. [Google Scholar] [CrossRef]
  52. Yasuo, M. The source of calcium in regenerating scales of the goldfish Carassius auratus. Comp. Biochem. Physiol. Part A Physiol. 1980, 66, 521–524. [Google Scholar] [CrossRef]
  53. Richardson, R.; Slanchev, K.; Kraus, C.; Knyphausen, P.; Eming, S.; Hammerschmidt, M. Adult zebrafish as a model system for cutaneous wound healing research. J. Investig. Dermatol. 2013, 133, 1655–1665. [Google Scholar] [CrossRef] [Green Version]
  54. Rawlings, D.J.; Witte, O.N. Bruton’s tyrosine kinase is a key regulator in B-cell development. Immunol. Rev. 1994, 138, 105–119. [Google Scholar] [CrossRef]
  55. Watts, T.H. TNF/TNFR family members in costimulation of T cell responses. Annu. Rev. Immunol. 2005, 23, 23–68. [Google Scholar] [CrossRef] [PubMed]
  56. Jensen, L.B.; Wahli, T.; McGurk, C.; Eriksen, T.B.; Obach, A.; Waagbo, R.; Handler, A.; Tafalla, C. Effect of temperature and diet on wound healing in Atlantic salmon (Salmo salar L.). Fish Physiol Biochem. 2015, 41, 1527–1543. [Google Scholar] [CrossRef]
  57. Pittman, K.; Pittman, A.; Karlson, S.; Cieplinska, T.; Sourd, P.; Redmond, K.; Ravnøy, B.; Sweetman, E. Body site matters: An evaluation and application of a novel histological methodology on the quantification of mucous cells in the skin of Atlantic salmon, Salmo salar L. J. Fish Dis. 2013, 36, 115–127. [Google Scholar] [CrossRef]
  58. Pevzner, R.A.; Hernádi, L.; Salánki, J. Effect of mercury on the fish (Alburnus alburnus) chemoreceptor taste buds. A scanning electron microscopic study. Acta Biol. Hung. 1986, 37, 159–167. [Google Scholar]
  59. Iger, Y.; Bonga, S.E.W. Cellular responses of the skin of carp (Cyprinus carpio) exposed to acidified water. Cell Tissue Res. 1994, 275, 481–492. [Google Scholar] [CrossRef] [Green Version]
  60. Peterson, L.L.; Zettergren, J.G.; Wuepper, K.D. Biochemistry of transglutaminases and cross-linking in the skin. J. Investig. Dermatol. 1983, 81 (Suppl. S1), 95s–100s. [Google Scholar] [CrossRef] [Green Version]
  61. Sveen, L.R.; Timmerhaus, G.; Torgersen, J.S.; Ytteborg, E.; Jørgensen, S.M.; Handeland, S.; Stefansson, S.O.; Nilsen, T.O.; Calabrese, S.; Ebbesson, L.; et al. Impact of fish density and specific water flow on skin properties in Atlantic salmon (Salmo salar L.) post-smolts. Aquaculture 2016, 464, 629–637. [Google Scholar] [CrossRef] [Green Version]
  62. Christiansen, J.; Jobling, M.; Amin, A.; Ribe, H. Histomorphological changes in epidermal structure of juvenile Arctic charr (Salvelinus alpinus L.) subjected to sustained exercise. Can. J. Zool. Rev. Can. De Zool. 1991, 69, 2450–2455. [Google Scholar] [CrossRef]
  63. Vatsos, I.N.; Kotzamanis, Y.; Henry, M.; Angelidis, P.; Alexis, M. Monitoring stress in fish by applying image analysis to their skin mucous cells. Eur. J. Histochem. 2010, 54, e22. [Google Scholar] [CrossRef] [Green Version]
  64. Vera, L.M.; Migaud, H. Hydrogen peroxide treatment in Atlantic salmon induces stress and detoxification response in a daily manner. Chronobiol Int. 2016, 33, 530–542. [Google Scholar] [CrossRef] [Green Version]
  65. Valenzuela-Muñoz, V.; Gallardo-Escárate, A.; Sáez-Vera, C.; Garcés, F.; Bonfatti, J.; Gallardo-Escárate, C. More than bubbles: In vivo assessment and transcriptome modulation of Caligus rogercresseyi and Atlantic salmon exposed to hydrogen peroxide (PARAMOVE®). Aquaculture 2020, 522, 735170. [Google Scholar] [CrossRef]
  66. Overton, K.; Samsing, F.; Oppedal, F.; Dalvin, S.; Stien, L.H.; Dempster, T. The use and effects of hydrogen peroxide on salmon lice and post-smolt Atlantic salmon. Aquaculture 2018, 486, 246–252. [Google Scholar] [CrossRef]
  67. Ream, R.A.; Theriot, J.A.; Somero, G.N. Influences of thermal acclimation and acute temperature change on the motility of epithelial wound-healing cells (keratocytes) of tropical, temperate and Antarctic fish. J. Exp. Biol. 2003, 206, 4539–4551. [Google Scholar] [CrossRef] [PubMed] [Green Version]
  68. Rapanan, J.L.; Cooper, K.E.; Leyva, K.J.; Hull, E.E. Collective cell migration of primary zebrafish keratocytes. Exp. Cell Res. 2014, 326, 155–165. [Google Scholar] [CrossRef]
  69. Skugor, A.; Krasnov, A.; Andersen, O. Genome-wide microarray analysis of Atlantic cod (Gadus morhua) oocyte and embryo. BMC Genom. 2014, 15, 594. [Google Scholar] [CrossRef] [Green Version]
  70. Krasnov, A.; Timmerhaus, G.; Afanasyev, S.; Jorgensen, S.M. Development and assessment of oligonucleotide microarrays for Atlantic salmon (Salmo salar L.). Comp. Biochem. Physiol. Part D Genom. Proteom. 2011, 6, 31–38. [Google Scholar] [CrossRef]
Figure 1. Alcian Blue/Periodic Acid - Schiff (AB/PAS)-stained sections of skin from Atlantic cod and polar cod. (A) Atlantic cod showing the main components in fish skin: epidermis, scales, club cells, dense and loose dermis. Scales extend into the epidermal layers. (B) Enlarged image of epidermis showing a sensory cell (arrow). (C) Polar cod skin differs from the Atlantic cod skin in that it has bony plates. Scales do not extend into the epidermis. (D) Enlarged image of polar cod epidermis, showing more mucous cells (arrows) compared to Atlantic cod. Scale bar = 500 µm (A,C) and 100 µm (B,D).
Fishes 05 00034 g001
Figure 2. Scanning electron microscopy (SEM) analyses of Atlantic cod and polar cod. (A) Skin surface of Atlantic cod with microridges at the surface of the keratocytes, enlarged in (B), showing details of the microridges and a mucous cell (arrow); (C) sensory cells in the skin, enlarged in (D); (E) polar cod has more grooves and folded skin structure and more mucous cells, enlarged in (F), showing keratocytes with microridges and mucous cells (arrows); (G) sensory cell; squared box enlarged in (H) showing the microvilli receptors of the sensory cell.
Fishes 05 00034 g002
Figure 3. Microarrays, comparison of Atlantic cod and polar cod. Positive and negative values mean higher and lower expression in Atlantic cod to polar cod. (A) Functional groups with significant differences between species (t-test, p < 0.05). Numbers of differentially expressed genes are indicated in brackets; (B) Differentially expressed immune genes between the two species, shades of color indicate different grade of up-regulation (red) or down-regulation (green). Data are log2-ER.
Fishes 05 00034 g003
Figure 4. Histological evaluation of Atlantic cod and polar cod. Skin from Atlantic cod (A) control fish showing normal histology with a smooth outer epidermis and mucous cell (arrow). Exposure to low (B) and high (C) doses of H2O2 increased the number of mucous cells (arrows) and the outer border became rougher. Skin from polar cod (D) control fish showed a rougher outer border and more mucous cells (arrow) compared to Atlantic cod. (E) Exposed fish had more mucous cells and rougher outer borders compared to control. Abundance of mucous cells increased in both species after exposure (F,G). Numbers are mucous cells per 100 µm ± SD. Different letters mark significance (p ≤ 0.05). Sections were stained with AB/PAS. Scale bar = 100 µm.
Fishes 05 00034 g004
Figure 5. SEM images of Atlantic cod and polar cod skin after exposure to the high dose of H2O2. Exposed skin from Atlantic cod showed (A) cranks in the skin structure (arrows); enlarged in (B), showing lost cells (white arrow), loose cells (black arrow) and reduced microridges (hollow arrow); (C) exposed skin from polar cod had cranks (white arrow) and increased number of mucous cells at the surface; square enlarged in (D) showing mucous cells (white arrow) and reduced microridges (hollow arrow).
Fishes 05 00034 g005
Figure 6. Primary culture of Atlantic cod keratocytes. (AC) Control cultures after 7 days. Arrows point at keratocytes. Cultures exposed to (D) low H2O2 and (E) high H2O2. Notice more rounded and contracted shape of cells in exposed cultures and less confluent cell sheets. Cultures examined after 10 days, (FH) control. White arrows point at keratocytes and the black arrow at the lamellipodium. (I) Low H2O2 and (J) high H2O2. Few cells are left in both exposed cultures. Arrows point at keratocytes; notice the altered cell morphology with increasing H2O2 concentrations. (K) Percentage of scales with migrating keratocytes from all treatments, n = 27 scales per treatment, ± standard deviation (STD). (L) Melanocytes in cod skin. (M) Mineralized ring-shaped structure in cod scales.
Fishes 05 00034 g006
Figure 7. Experimental setup. (A) The cup-based system used for exposure studies; (B) sampled skin section for histology and SEM, approximately 1 × 0.5 cm; (C) plates used for cell cultures; (D) five scales were placed in each well to study cell migration.
Fishes 05 00034 g007
Table 1. Microarray results. Genes that responded to H2O2 exposure in the skin of polar cod. Data are ratio of exposed to control skin (fold change) (Supplementary Materials S1).
GeneFold
Natterin−2.8
Leukocyte cell-derived chemotaxin 2−1.8
Myeloid-specific peroxidase−2.0
Matrix metalloproteinase 13−3.2
Matrix metalloproteinase 13a−4.6
Claudin g−4.8
Transglutaminase 2, like−18.7
Laminin gamma_3−7.3
Laminin subunit beta-1−13.9
Publisher’s Note: MDPI stays neutral with regard to jurisdictional claims in published maps and institutional affiliations.

