Vertebrae Morphometric Measurement and Ca/P Levels of Different Age European Seabass (Dicentrarchus labrax)


Abstract
:1. Introduction
2. Results
3. Discussion
4. Materials and Methods
4.1. Fish Sampling
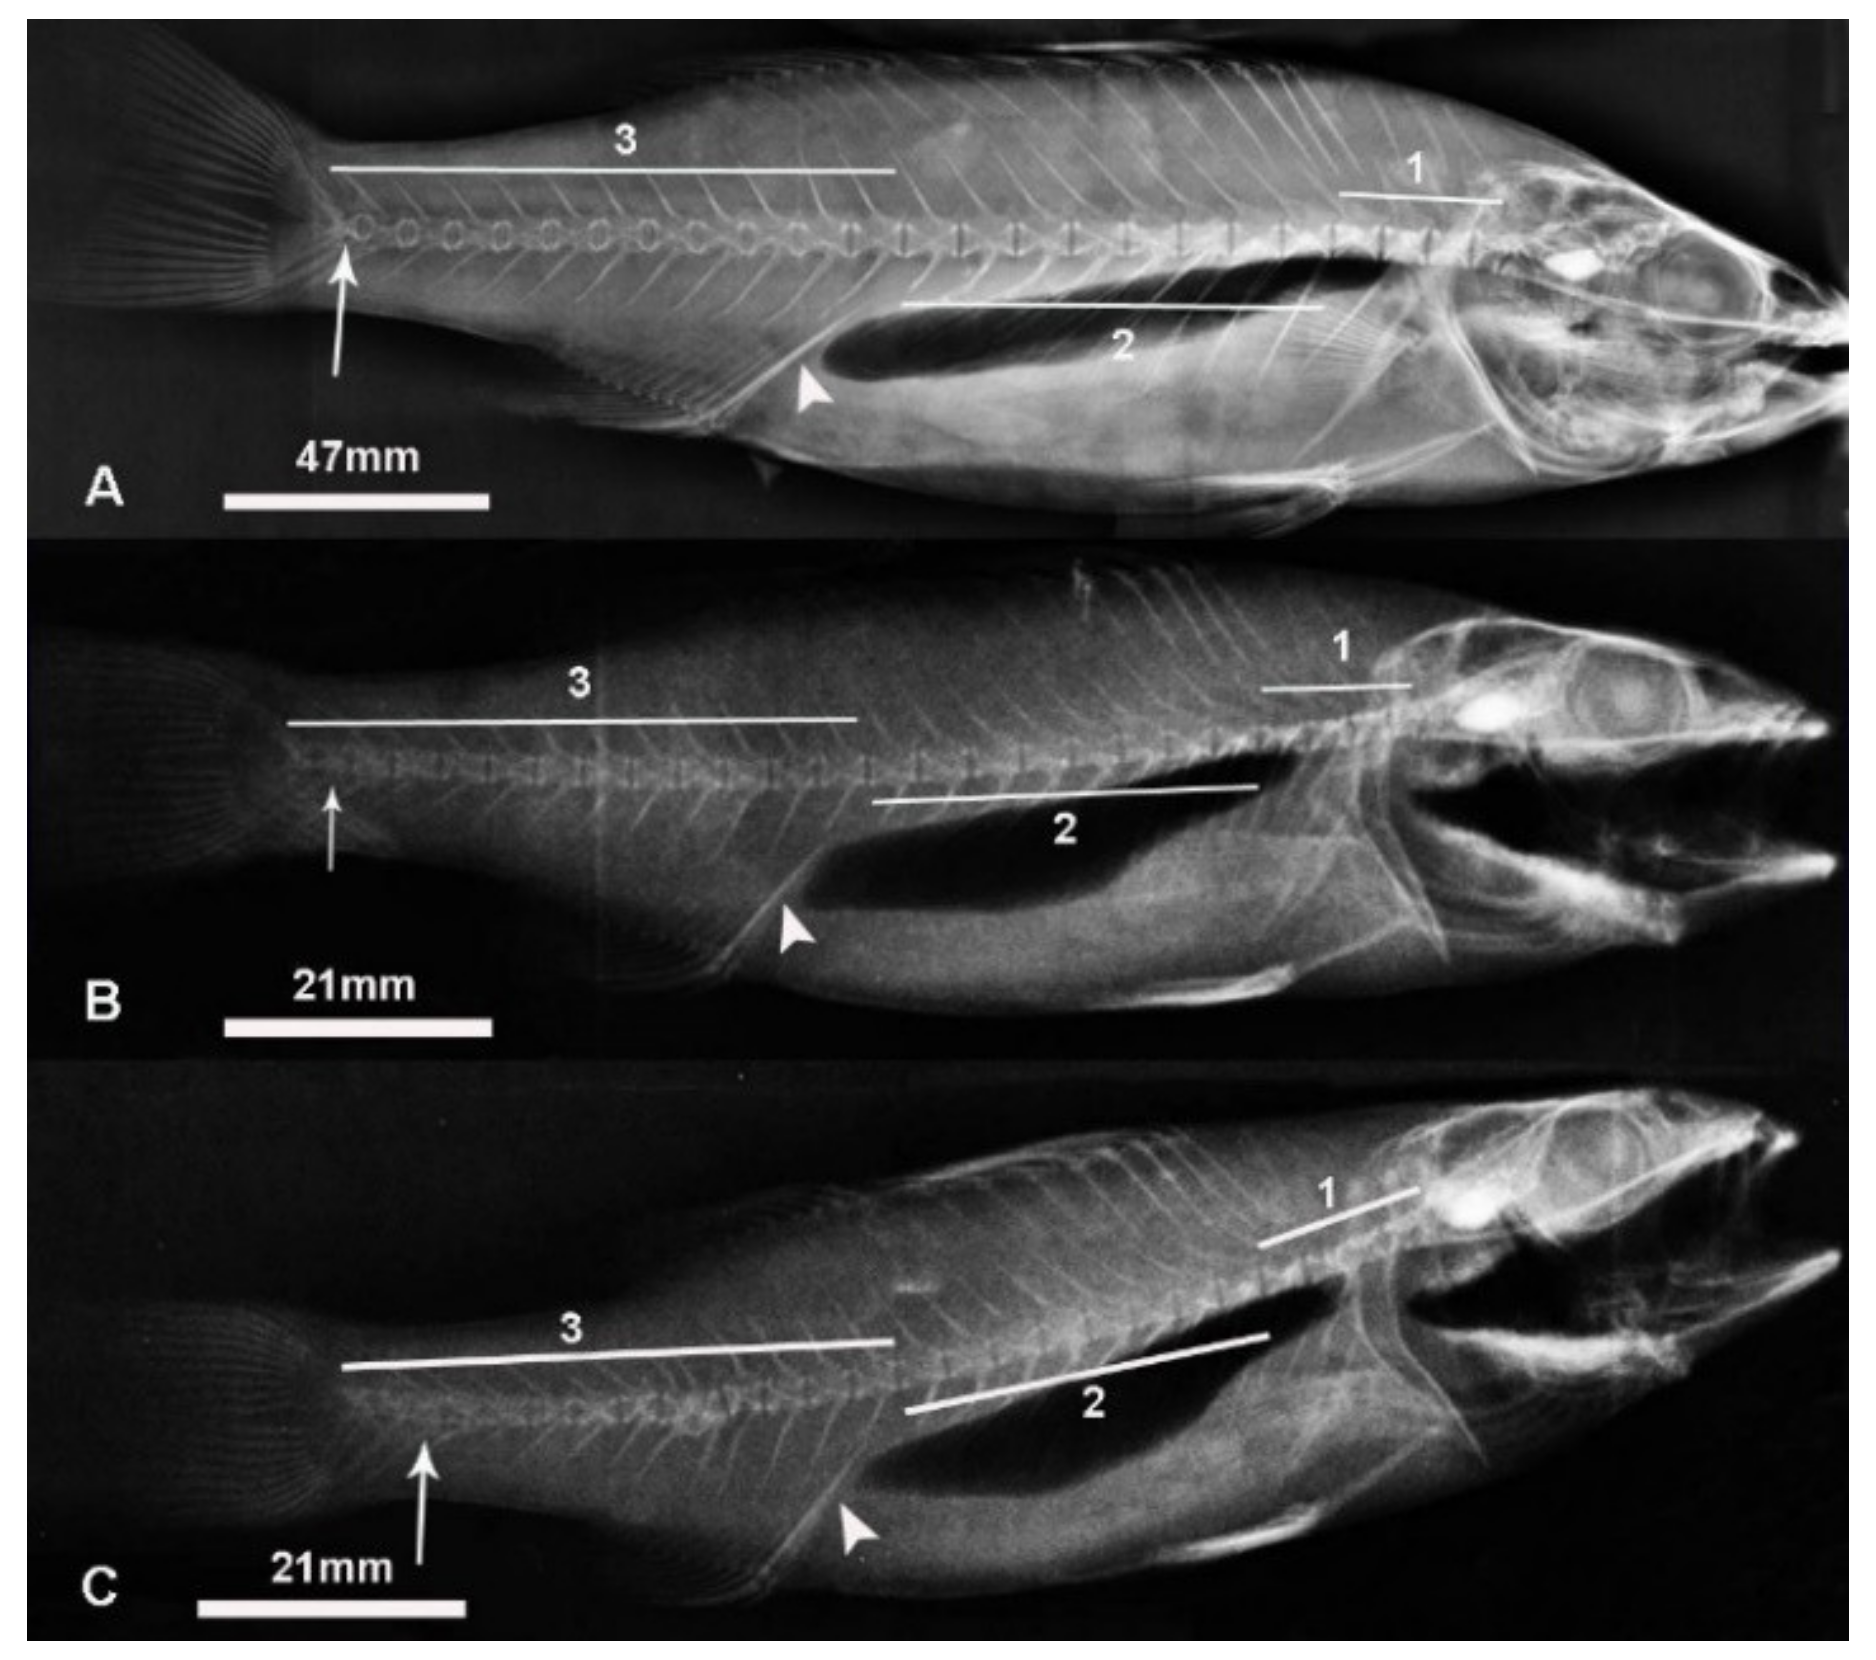
4.2. X-ray
4.3. Ca and P Level Measurement
4.4. Statistical Analysis
5. Conclusions
Author Contributions
Funding
Conflicts of Interest
References
- Federation of Greek Maricultures. Annual Report 2019. Available online: https://www.fgm.com.gr (accessed on 20 March 2020).
- Genten, F.; Terwinghe, E.; Danguy, A. Atlas of Fish Histology; Science Publishers: Enfield, NH, USA, 2009; p. 219. [Google Scholar]
- Moutou, A. Fish Physiology; University of Thessaly: Larissa, Greece, 2015; p. 26. [Google Scholar]
- Groman, D.B. Histology of the Striped Bass; American Fisheries Society: Bethesda, MD, USA, 1982; p. 116. [Google Scholar]
- Berillis, P.; Panagiotopoulos, N.; Boursiaki, V.; Karapanagiotidis, I.T.; Mente, E. Vertebrae length and ultra-structure measurements of collagen fibrils and mineral content in the vertebrae of lordotic gilthead seabreams (Sparus aurata). Micron 2015, 75, 27–33. [Google Scholar] [CrossRef] [PubMed]
- Boursiaki, V.; Theochari, C.; Zaoutsos, S.P.; Mente, E.; Vafidis, D.; Apostologamvrou, C.; Berillis, P. Skeletal Deformity of Scoliosis in Gilthead Seabreams (Sparus aurata): Association with Changes to Calcium-Phosphor Hydroxyapatite Salts and Collagen Fibers. Water 2019, 11, 257. [Google Scholar] [CrossRef] [Green Version]
- Nowroozi, B.N.; Harper, C.J.; De Kegel, B.; Adriaens, D.; Brainerd, E.L. Regional variation in morphology of vertebral centra and intervertebral joints in striped bass, Morone saxatilis. J. Morphol. 2012, 273, 441–452. [Google Scholar] [CrossRef] [PubMed]
- Bond, C.E. Biology of Fishes, 2nd ed.; Saunders College Publishing: Philadelphia, PA, USA, 1996; p. 514. [Google Scholar]
- Grande, L.; Bemis, W.E. A comprehensive phylogenetic study of amiid fishes (Amiidae) based on comparative skeletal anatomy. An empirical search for interconnected patterns of natural history. J. Vertebr. Paleontol. 1998, 18 (Suppl. S1), 1–696. [Google Scholar] [CrossRef]
- Darias, M.J.; Mazurais, D.; Koumoundouros, G.; Le Gall, M.M.; Huelvan, C.; Desbruyeres, E.; Quazuguel, P.; Cahu, C.L.; Zambonino-Infante, J.L. Imbalanced dietary ascorbic acid alters molecular pathways involved in skeletogenesis of developing European sea bass (Dicentrarchus labrax). Comp. Biochem. Phys. A 2011, 159, 46–55. [Google Scholar] [CrossRef]
- Zouiten, D.; Ben Khemis, I.; Slaheddin Masmoudi, A.; Huelvan, C.; Cahu, C. Comparison of growth, digestive system maturation and skeletal development in sea bass larvae reared in an intensive or a mesocosm system. Aquac. Res. 2011, 42, 1723–1736. [Google Scholar] [CrossRef] [Green Version]
- Weiss, R.E.; Watabe, N. Studies on the biology of fish bone. III. Ultrastructure of osteogenesis and resorption in osteocytic (cellular) and anosteocytic (acellular) bones. Calcif. Tissue Int. 1979, 28, 43–56. [Google Scholar] [CrossRef]
- Mahamid, J.; Sharir, A.; Addadi, L.; Weiner, S. Amorphous calcium phosphate is a major component of the forming fin bones of zebrafish: Indications for an amorphous precursor phase. Proc. Natl. Acad. Sci. USA 2008, 105, 12748–12753. [Google Scholar] [CrossRef] [Green Version]
- Moss, M.L. Studies of the acellular bone of teleost fish. Cells Tissues Organs 1961, 46, 343–362. [Google Scholar] [CrossRef]
- Lall, S.P. The minerals. In Fish Nutrition, 3rd ed.; Halver, J.E., Hardy, R.W., Eds.; Academic Press Inc.: San Diego, CA, USA, 2002; pp. 259–308. [Google Scholar]
- Ozawa, M.; Suzuki, S. Microstructural development of natural hydroxyapatite originated from fish-bone waste through heat treatment. J. Am. Ceram. Soc. 2002, 85, 1315–1317. [Google Scholar] [CrossRef]
- Gravier, R. Les bars (loups) du Maroc atlantique Morone labrax (Linné) et Morone punctata (Bloch). Rev. Trav. l’Inst. Pêches Marit. 1961, 25, 281–292. [Google Scholar]
- Bouain, A. Étude des caracters morphologiques et anatomiques de Dicentrarchus labrax (Linné 1758) et Dicentrarchus punctatus (Bloch 1792) des côtes tunisiennes. Bull. Soc. Sci. Nat. Tunisie Nouv. Ser. 1977, 12, 57–68. [Google Scholar]
- Nowroozi, B.N.; Brainerd, E.L. X-ray motion analysis of the vertebral column during the startle response in striped bass, Morone saxatilis. J. Exp. Biol. 2013, 216, 2833–2842. [Google Scholar] [CrossRef] [Green Version]
- Berillis, P. Factors that can lead to the development of skeletal deformities in fishes: A review. J. Fish. Sciences.com 2015, 9, 17–23. [Google Scholar]
- Divanach, P.; Boglione, C.; Menu, B.; Koumoundouros, G.; Kentouri, M.; Cataudella, S. Abnormalities in finfish mariculture: An overview of the problem, causes and solutions. In Handbook of Contributions and Short Communications, Presented at the International Workshop on Seabass and Seabream Culture: Problems and Prospects, Verona, Italy, 16–18 October 1996; European Aquaculture Society (EAS): Oostende, Belgium; pp. 45–66.
- Lim, C.; Lowell, R.T. Pathology of the vitamin C syndrome in channel catfish (Ictalurus punctatus). J. Nutr. 1978, 108, 1137–1146. [Google Scholar] [CrossRef]
- Tzaphlidou, M. The role of collagen in bone structure: An image processing approach. Micron 2005, 36, 593–601. [Google Scholar] [CrossRef]
- Lall, S.P.; Lewis-McCrea, L.M. Role of nutrients in skeletal metabolism and pathology in fish—An overview. Aquaculture 2007, 267, 3–19. [Google Scholar] [CrossRef]
- FAO. Aquaculture Feed and Fertilizer Resources Information System. Available online: http://www.fao.org/fishery/affris/species-profiles/european-seabass/nutritional-requirements/en/ (accessed on 21 September 2020).
- Oliva-Teles, A.; Pereira, J.P.; Gouveia, A.; Gomes, E. Utilisation of diets supplemented with microbial phytase by seabass (Dicentrarchus labrax) juveniles. Aquat. Living Resour. 1998, 11, 255–259. [Google Scholar] [CrossRef]
- Bass, J.K.; Chan, G.M. Calcium nutrition and metabolism during infancy. Nutr. J. 2006, 22, 1057–1066. [Google Scholar] [CrossRef]
- Zaichick, V.; Tzaphlidou, M. Determination of calcium, phosphorus, and the calcium/phosphorus ratio in cortical bone from the human femoral neck by neutron activation analysis. Appl. Radiat. Isotopes. 2002, 56, 781–786. [Google Scholar] [CrossRef]
- Song, J.Y.; Zhang, C.X.; Wang, L.; Song, K.; Hu, S.C.; Zhang, L. Effects of dietary calcium levels on growth and tissue mineralization in Japanese seabass, Lateolabrax japonicus. Aquac. Nutr. 2017, 23, 637–648. [Google Scholar] [CrossRef]
- Fortes-Silva, R.; Sánchez-Vázquez, F.J.; Martínez, F.J. Effects of pretreating a plant-based diet with phytase on diet selection and nutrient utilization in European sea bass. Aquaculture 2011, 319, 417–422. [Google Scholar] [CrossRef]
- Elsadin, S.; Nixon, O.; Mozes, N.; Allon, G.; Gaon, A.; Tandler, A.; Koven, W. The effect of dissolved carbon dioxide (CO2) on the bone mineral content and on the expression of bone-Gla protein (BGP, Osteocalcin) in the vertebral column of white grouper (Epinephelus aeneus). Aquaculture 2019, 511, 634196. [Google Scholar] [CrossRef]
- Driessens, F.C.; Verbeeck, R.K. Biominerals; CRC Press: Boston, MA, USA, 1990; p. 440. [Google Scholar]
- Cruz, J.S. Estudio comparado del desarrollo embrionario y larvario del bocinegro (Pagrus pagrus) y de la sama de pluma (Dentex gibbosus). Ph.D. Thesis, University of Las Palmas de Gran Canaria, Las Palmas, Gran Canaria, Spain, 2006. [Google Scholar]
- Biltz, R.M.; Pellegrino, E.D. The chemical anatomy of bone: I. A comparativestudy of bone composition in sixteen vertebrates. J. Bone Jt. Surg. 1969, 51, 456–466. [Google Scholar] [CrossRef]
- Lu, K.L.; Rahimnejad, S.; Ji, Z.L.; Zhang, C.X.; Wang, L.; Song, K. Comparative analysis of vertebral transcriptome in Japanese seabass (Lateolabrax japonicus) fed diets with varying phosphorus/calcium levels. Comp. Biochem. Phys. A 2019, 230, 49–55. [Google Scholar] [CrossRef]
- Zar, J.H. Biostatistical Analysis; Prentice-Hall: Bergen, NJ, USA, 1996; p. 663. [Google Scholar]


| Group 1—Fingerlings | Group 2—Juveniles | Group 3—Adults | |
|---|---|---|---|
| Individuals with 24 vertebrae | 95.35 a ± 1.54 (17) | 145.13 a ± 4.93 (4) | 328.03 a ± 16.31 (3) |
| Individuals with 25 vertebrae | 94.81 a ± 1.48 (22) | 142.57 a ± 3.67 (8) | 313.46 a ± 3.89 (5) |
| Individuals with 26 vertebrae | 94.45 a ± 1.33 (6) | 144.53 a ± 2.18 (6) | 319.4 a ± 1.00 (2) |
| Group 1—Fingerlings | Group 2—Juveniles | Group 3—Adults | ||
|---|---|---|---|---|
| Individuals with 24 vertebrae (Group A) | Cervical region | 1.50 a,a ± 0.06 (68) | 2.31 a,ac ± 0.11 (16) | 5.52 a,a ± 0.44 (12) |
| Abdominal region | 1.64 a,b ± 0.02 (136) | 2.59 a,a ± 0.08 (32) | 7.05 a,b ± 0.21 (24) | |
| Caudal region | 1.34 a,c ± 0.02 (204) | 2.21 a,c ± 0.07 (48) | 5.78 a,ac ± 0.24 (36) | |
| Individuals with 25 vertebrae (Group B) | Cervical region | 1.32 b,a ± 0.04 (88) | 1.95 a,a ± 0.10 (28) | 5.95 a,a ± 0.30 (20) |
| Abdominal region | 1.60 a,b ± 0.02 (176) | 2.69 a,b ± 0.06 (56) | 7.52 a,b ± 0.14 (40) | |
| Caudal region | 1.35 a,ac ± 0.02 (286) | 2.33 a,c ± 0.05 (91) | 5.93 a,ac ± 0.26 (65) | |
| Individuals with 26 vertebrae (Group C) | Cervical region | 1.26 b,a ± 0.06 (24) | 1.93 a,a ± 0.11 (20) | 6.05 a,a ± 0.34 (8) |
| Abdominal region | 1.60 a,b ± 0.03 (48) | 2.78 a,b ± 0.05 (40) | 7.56 a,b ± 0.14 (16) | |
| Caudal region | 1.32 a,ac ± 0.04 (84) | 2.31 a,c ± 0.06 (70) | 5.75 a,ac ± 0.33 (28) |
| Group 1—Fingerlings | Group 2—Juveniles | Group 3—Adults | |
|---|---|---|---|
| Individuals with 24 vertebrae | 1.19 a ± 0.08 (17) | 1.80 a ± 0.20 (4) | 3.97 a ± 0.69 (3) |
| Individuals with 25 vertebrae | 1.12 a ± 0.07 (22) | 1.82 a ± 0.19 (8) | 3.42 a ± 0.47 (5) |
| Individuals with 26 vertebrae | 1.27 a ± 0.12 (6) | 2.23 a ± 0.16 (6) | 3.50 a ± 0.70 (2) |
| Group 1—Fingerlings | Group 2—Juveniles | Group 3—Adults | |||||||
|---|---|---|---|---|---|---|---|---|---|
| Ca | P | Ca/P | Ca | P | Ca/P | Ca | P | Ca/P | |
| Individuals with 24 vertebrae | 19.99 a,a ± 1.60 (51) | 11.48 a,a ± 0.95 (51) | 2.08 a,a ± 0.16 (51) | 23.69 a,a ± 1.57 (12) | 14.18 a,a ± 3.27 (12) | 2.78 a,a ± 0.50 (12) | 52.32 b,a ± 1.45 (9) | 26.99 b,a ± 1.11 (9) | 1.95 a,a ± 0.20 (9) |
| Individuals with 25 vertebrae | 19.24 a,a ± 1.34 (66) | 13.41 a,a ± 1.19 (66) | 2.26 a,a ± 0.28 (66) | 22.67 a,a ± 2.35 (24) | 14.42 a,a ± 1.39 (24) | 1.82 a,a ± 0.24 (24) | 41.00 b,b ± 4.08 (15) | 22.66 b,b ± 2.52 (15) | 2.28 a,b ± 0.98 (15) |
| Individuals with 26 vertebrae | 14.83 a,a ± 2.02 (18) | 25.20 a,b ± 2.85 (18) | 0.73 a,b ± 0.14 (18) | 24.00 b,a ± 2.19 (18) | 14.38 b,a ± 1.37 (18) | 1.90 b,a ± 0.23 (18) | 54.83 c,a ± 2.20 (6) | 28.73 ac,a ± 1.78 (6) | 1.96 bc,a ± 0.44 (6) |
Publisher’s Note: MDPI stays neutral with regard to jurisdictional claims in published maps and institutional affiliations. |
© 2020 by the authors. Licensee MDPI, Basel, Switzerland. This article is an open access article distributed under the terms and conditions of the Creative Commons Attribution (CC BY) license (http://creativecommons.org/licenses/by/4.0/).
Share and Cite
Nikiforidou, V.; Zaoutsos, S.; Vlahos, N.; Berillis, P. Vertebrae Morphometric Measurement and Ca/P Levels of Different Age European Seabass (Dicentrarchus labrax). Fishes 2020, 5, 37. https://0-doi-org.brum.beds.ac.uk/10.3390/fishes5040037
Nikiforidou V, Zaoutsos S, Vlahos N, Berillis P. Vertebrae Morphometric Measurement and Ca/P Levels of Different Age European Seabass (Dicentrarchus labrax). Fishes. 2020; 5(4):37. https://0-doi-org.brum.beds.ac.uk/10.3390/fishes5040037
Chicago/Turabian StyleNikiforidou, Vasiliki, Stefanos Zaoutsos, Nikolaos Vlahos, and Panagiotis Berillis. 2020. "Vertebrae Morphometric Measurement and Ca/P Levels of Different Age European Seabass (Dicentrarchus labrax)" Fishes 5, no. 4: 37. https://0-doi-org.brum.beds.ac.uk/10.3390/fishes5040037