
Association of Performance in Strength and Plyometric Tests with Change of Direction Performance in Young Female Team-Sport Athletes

 and
and
Abstract
:1. Introduction
2. Materials and Methods
2.1. Subjects
2.2. Procedure
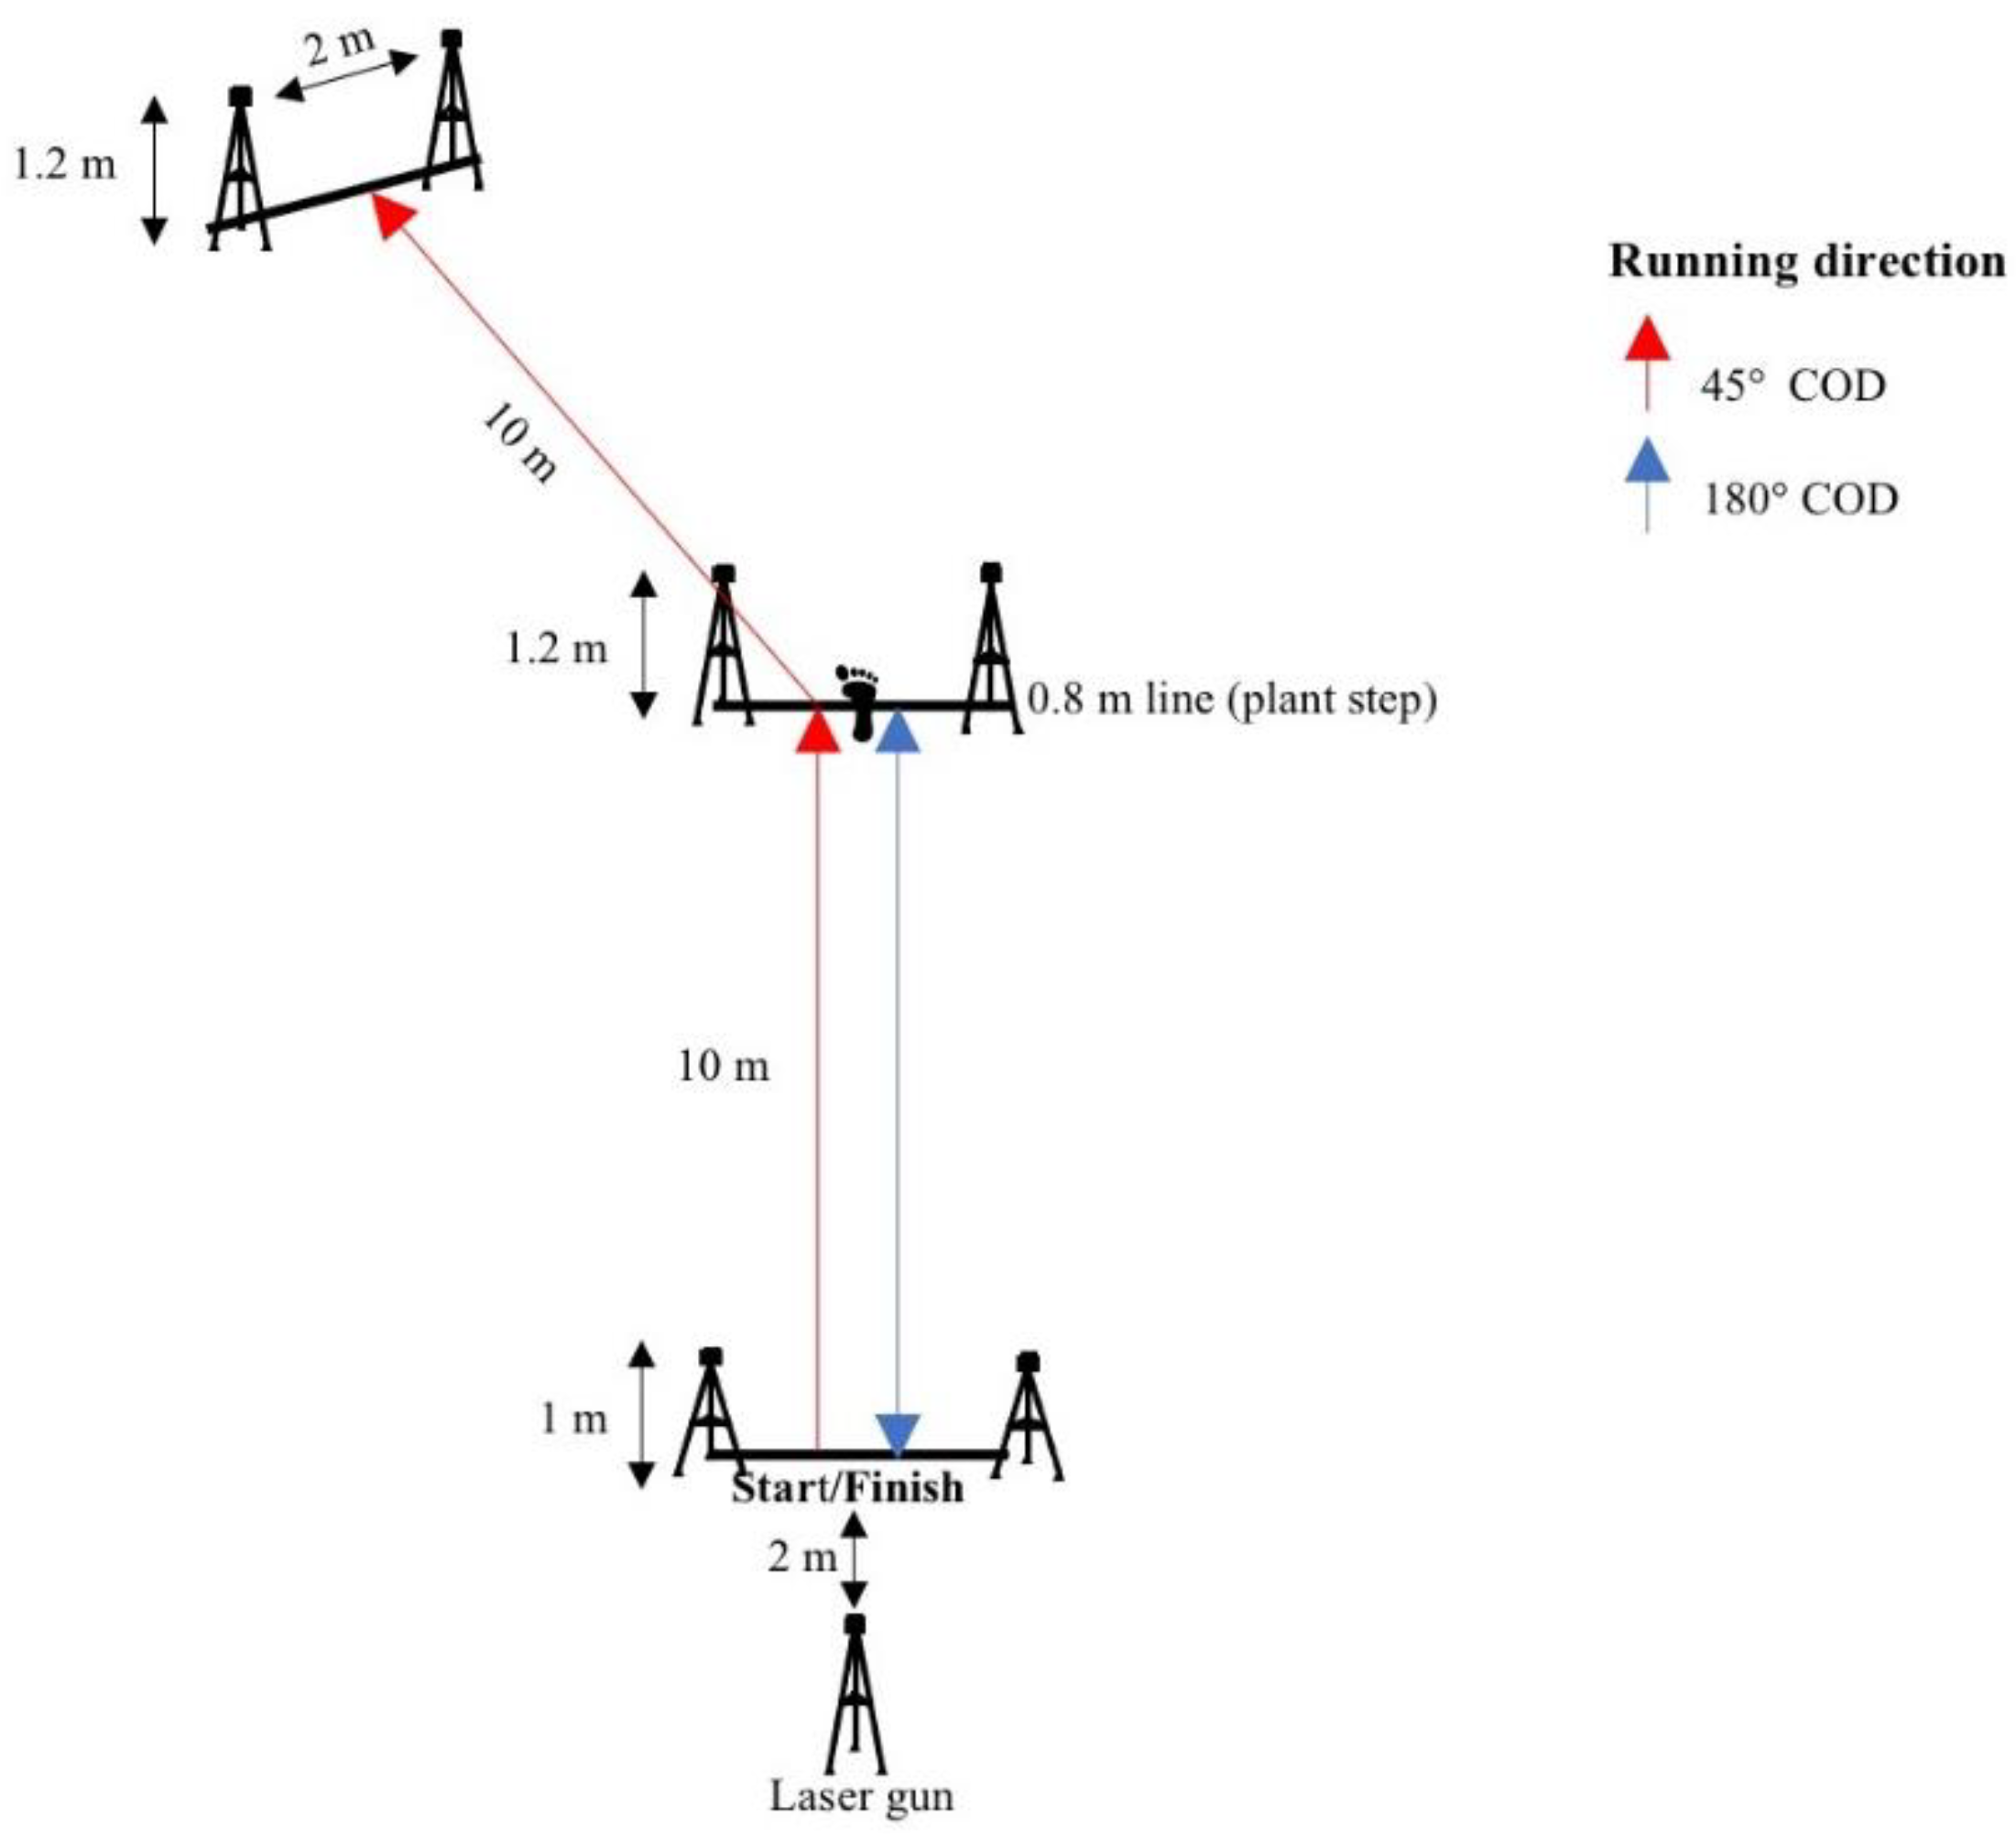
2.3. COD Tests
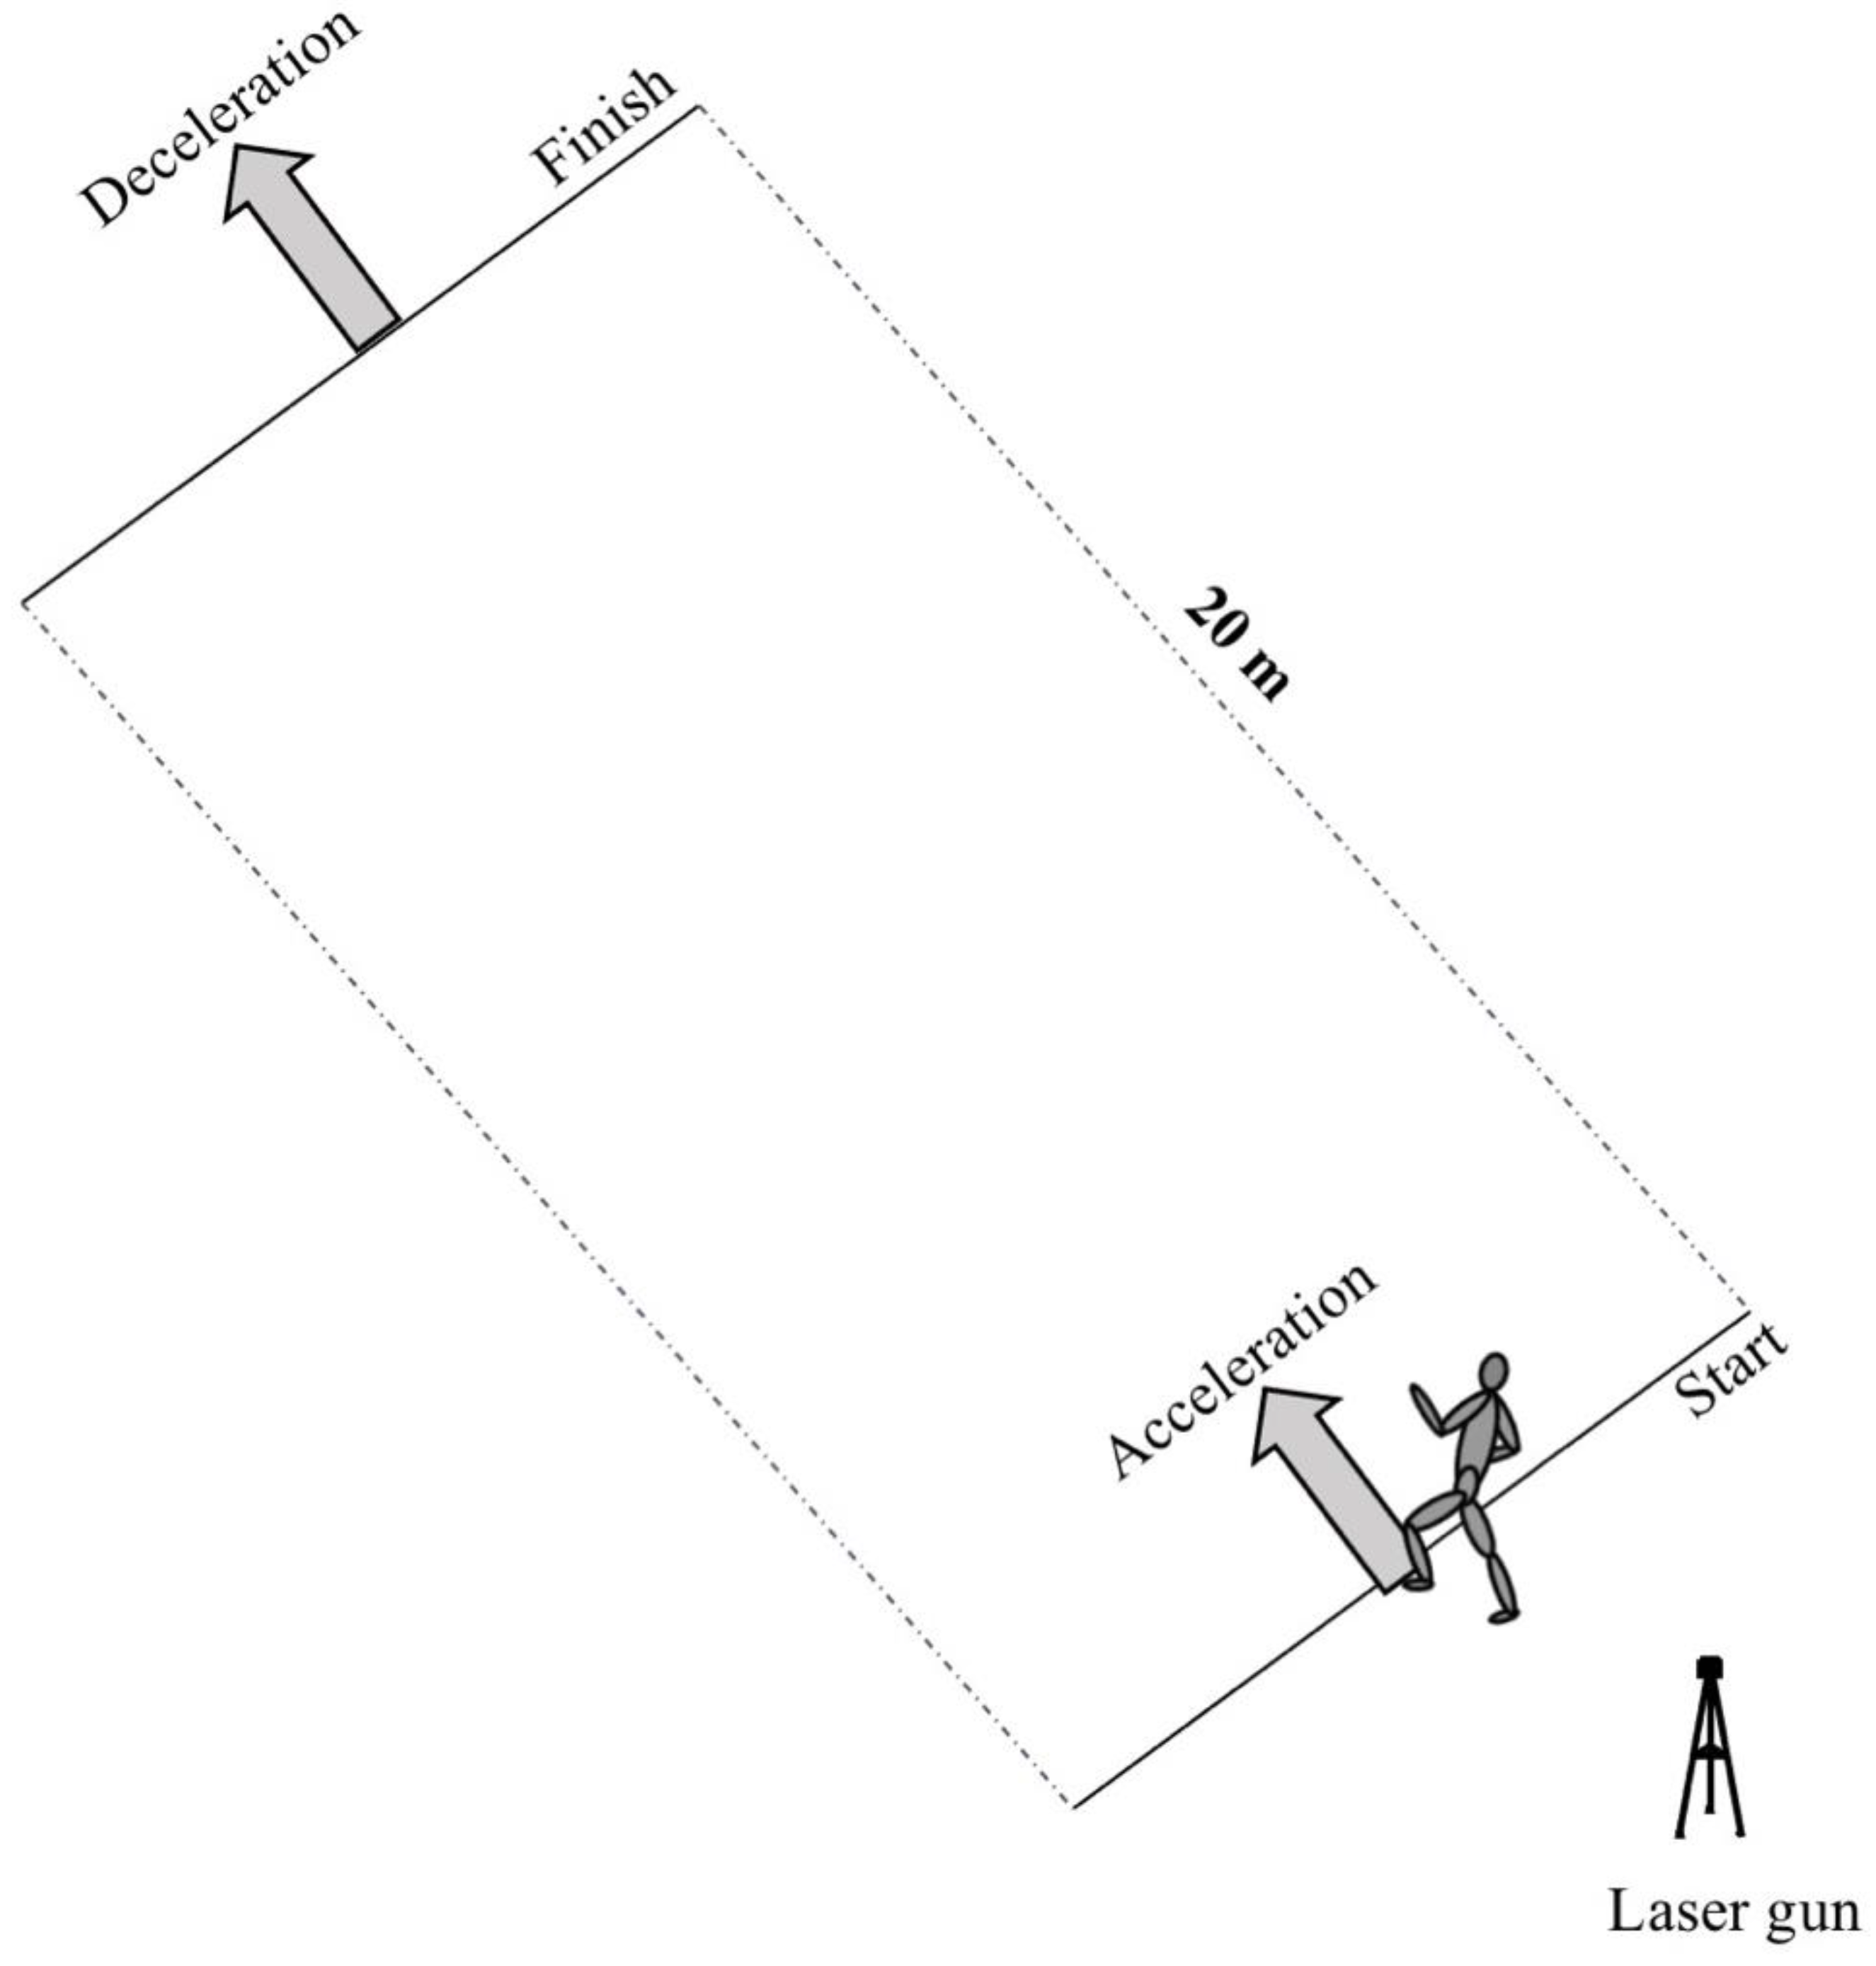
2.4. Sprint Test
2.5. Maximum Horizontal Braking Test
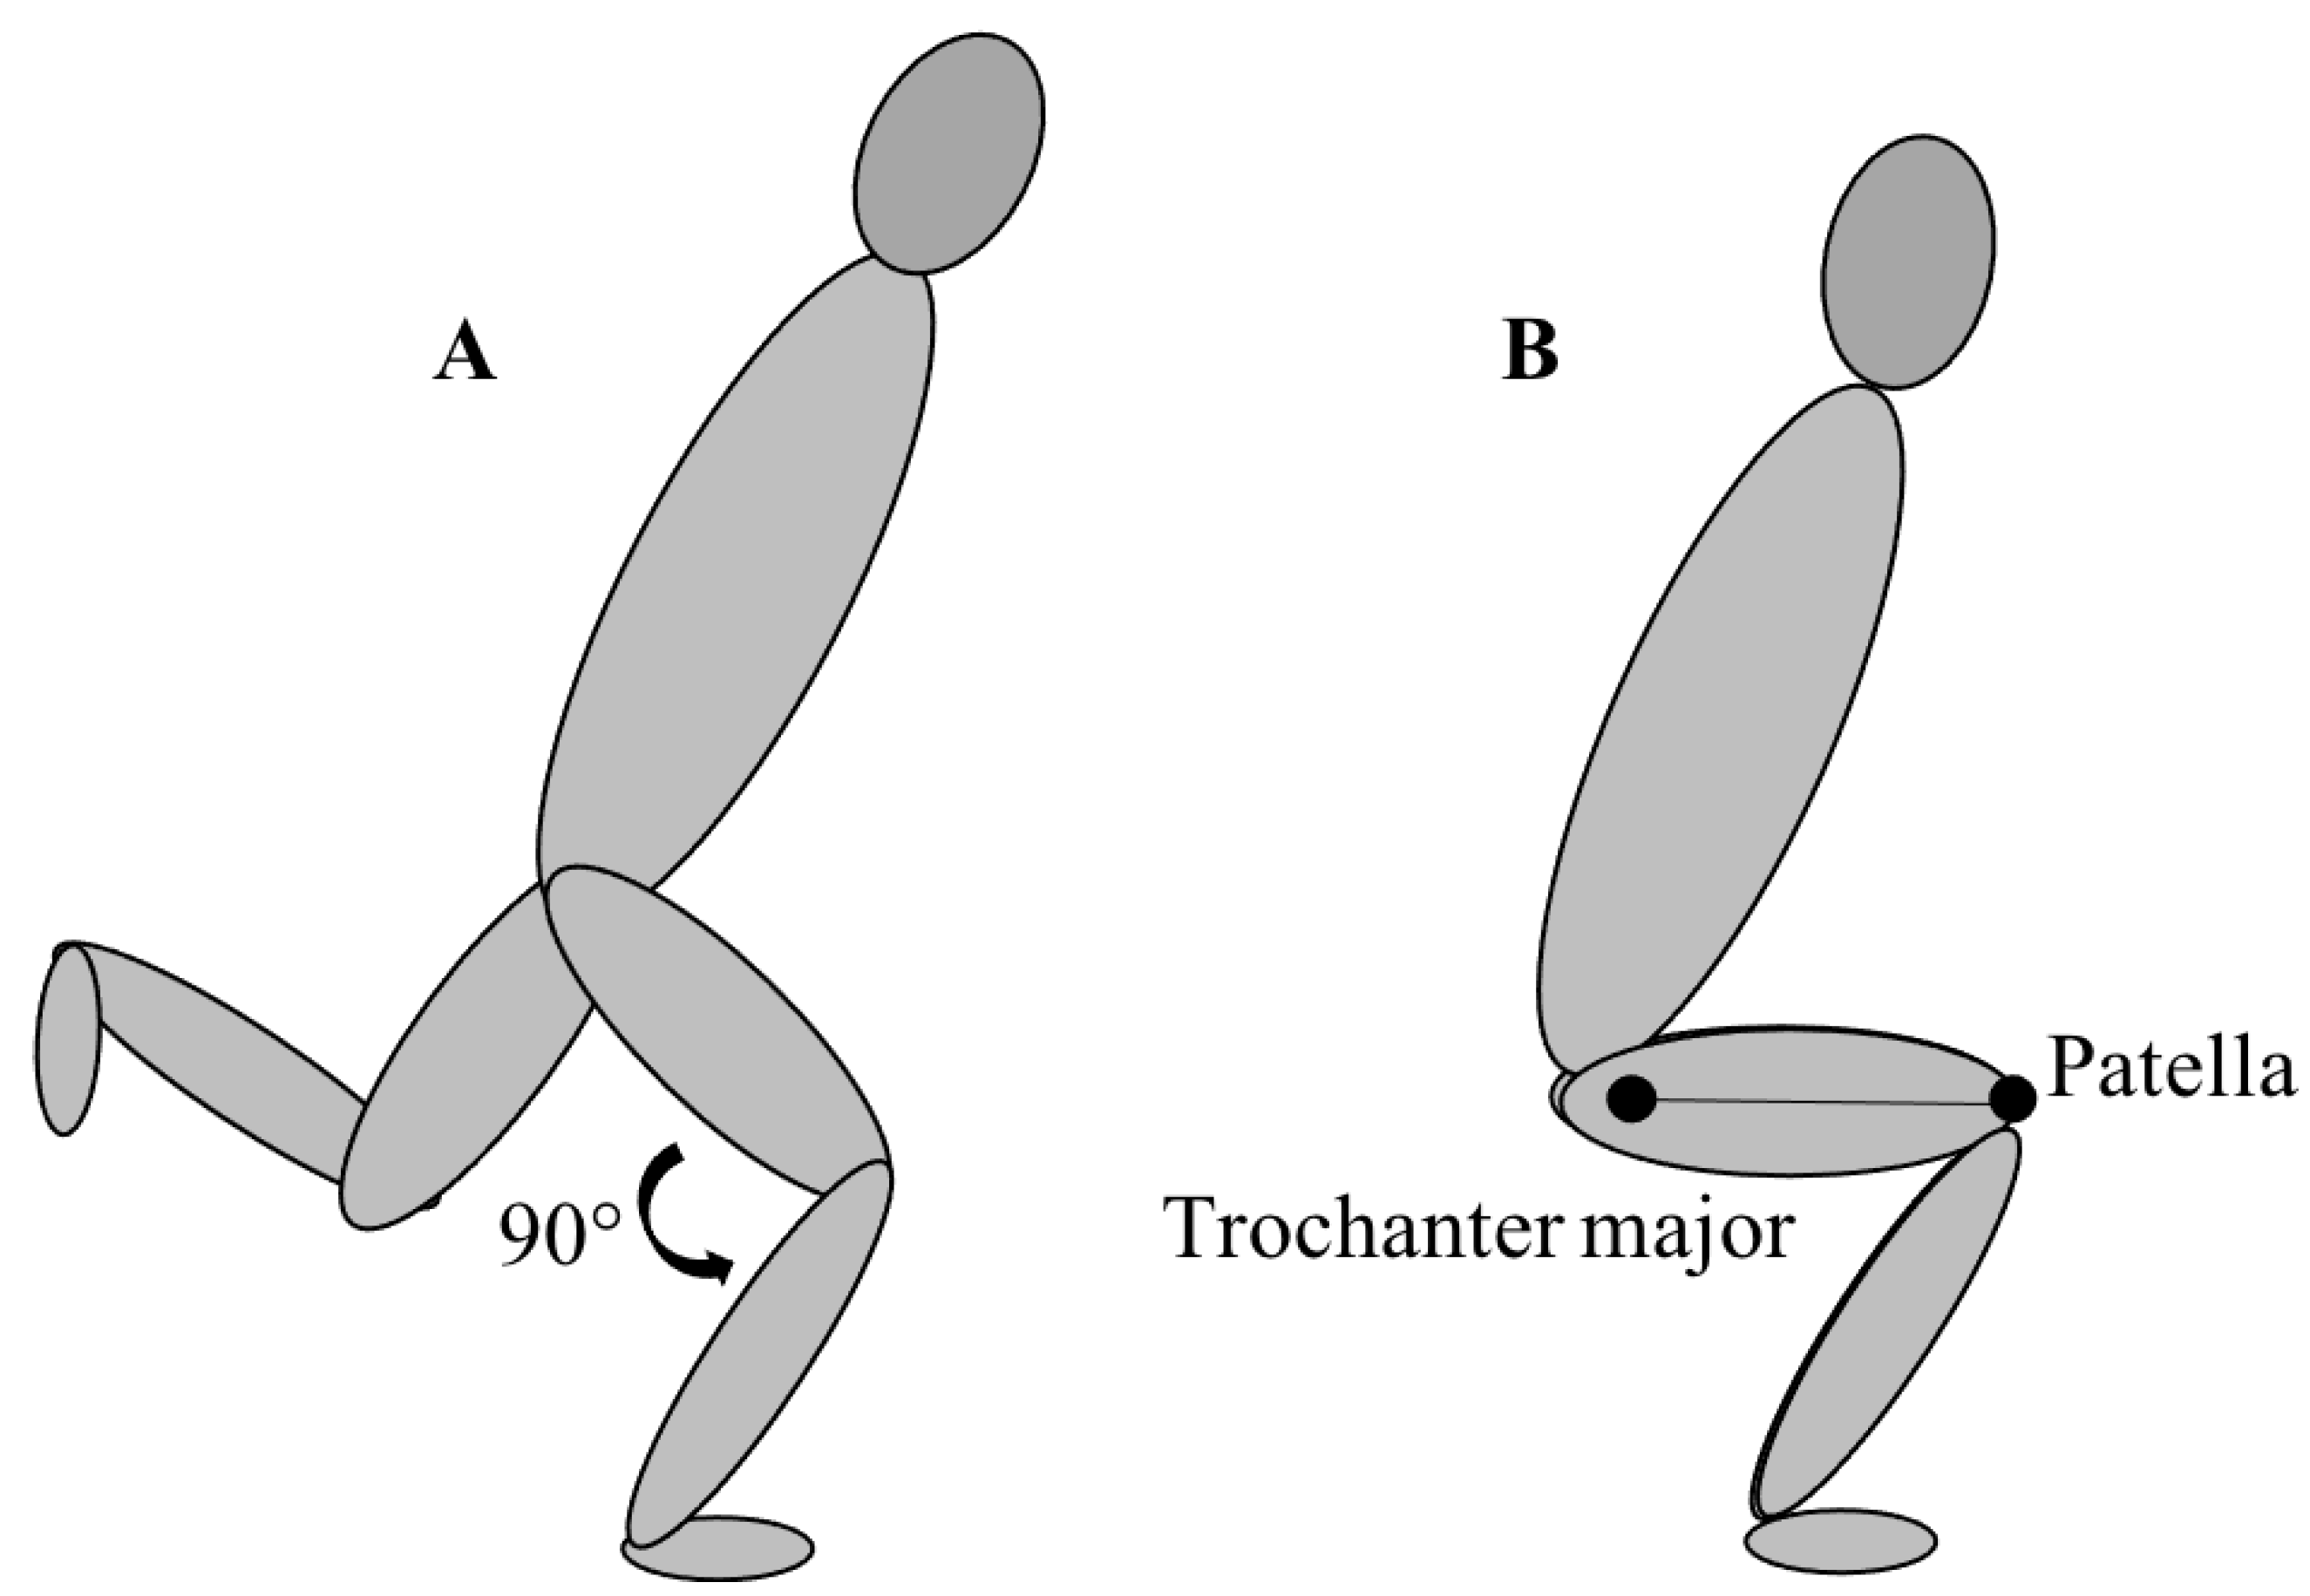
2.6. Strength Tests
2.7. Plyometric Tests
2.8. Statistical Analysis
3. Results
3.1. Correlations
3.2. Fast vs. Slow Performers
3.3. Step Kinematics Differences
4. Discussion
Limitations
5. Conclusions
Practical Applications
Author Contributions
Funding
Institutional Review Board Statement
Informed Consent Statement
Data Availability Statement
Conflicts of Interest
References
- Stølen, T.; Chamari, K.; Castagna, C.; Wisløff, U. Physiology of soccer. Sports Med. 2005, 35, 501–536. [Google Scholar] [CrossRef] [PubMed]
- Carling, C.; Reilly, T.; Williams, A.M. Performance Assessment for Field Sports; Routledge: London, UK, 2008. [Google Scholar]
- Ostojic, S.M.; Mazic, S.; Dikic, N. Profiling in basketball: Physical and physiological characteristics of elite players. J. Strength Cond. Res. 2006, 20, 740. [Google Scholar] [CrossRef]
- Ziv, G.; Lidor, R. Physical characteristics, physiological attributes, and on-court performances of handball players: A review. Eur. J. Sport Sci. 2009, 9, 375–386. [Google Scholar] [CrossRef]
- Tønnessen, E.; Hem, E.; Leirstein, S.; Haugen, T.; Seiler, S. Maximal aerobic power characteristics of male professional soccer players, 1989–2012. Int. J. Sports Physiol. Perf. 2013, 8, 323–329. [Google Scholar] [CrossRef] [PubMed]
- Reilly, T.; Borrie, A. Physiology applied to field hockey. Sports Med. 1992, 14, 10–26. [Google Scholar] [CrossRef] [PubMed]
- Dalen, T.; Ingebrigtsen, J.; Ettema, G.; Hjelde, G.H.; Wisløff, U. Player load, acceleration, and deceleration during forty-five competitive matches of elite soccer. J. Strength Cond. Res. 2016, 30, 351–359. [Google Scholar] [CrossRef]
- Dalen, T.; Lorås, H.; Hjelde, G.H.; Kjøsnes, T.N.; Wisløff, U. Accelerations–a new approach to quantify physical performance decline in male elite soccer? Eur. J. Sport Sci. 2019, 19, 1015–1023. [Google Scholar] [CrossRef]
- Conte, D.; Favero, T.G.; Lupo, C.; Francioni, F.M.; Capranica, L.; Tessitore, A. Time-motion analysis of Italian elite women’s basketball games: Individual and team analyses. J. Strength Cond. Res. 2015, 29, 144–150. [Google Scholar] [CrossRef]
- Faude, O.; Koch, T.; Meyer, T. Straight sprinting is the most frequent action in goal situations in professional football. J. Sports Sci. 2012, 30, 625–631. [Google Scholar] [CrossRef]
- Castagna, C.; D’Ottavio, S.; Abt, G. Activity profile of young soccer players during actual match play. J. Strength Cond. Res. 2003, 17, 775–780. [Google Scholar]
- Bloomfield, J.; Polman, P.; O’Donoghue, P. O-007 Deceleration movements performed during FA Premier League soccer matches. J. Sports Sci. Med. 2007, 10, 6. [Google Scholar]
- Póvoas, S.C.; Seabra, A.F.; Ascensão, A.A.; Magalhães, J.; Soares, J.M.; Rebelo, A.N. Physical and physiological demands of elite team handball. J. Strength Cond. Res. 2012, 26, 3365–3375. [Google Scholar] [CrossRef]
- Duthie, G.M.; Pyne, D.B.; Marsh, D.J.; Hooper, S.L. Sprint patterns in rugby union players during competition. J. Strength Cond. Res. 2006, 20, 208. [Google Scholar]
- Brughelli, M.; Cronin, J.; Levin, G.; Chaouachi, A. Understanding change of direction ability in sport. Sports Med. 2008, 38, 1045–1063. [Google Scholar] [CrossRef]
- Castillo-Rodríguez, A.; Fernández-García, J.C.; Chinchilla-Minguet, J.L.; Carnero, E.Á. Relationship between muscular strength and sprints with changes of direction. J. Strength Cond. Res. 2012, 26, 725–732. [Google Scholar] [CrossRef] [PubMed]
- Sheppard, J.M.; Young, W. Agility literature review: Classifications, training and testing. J. Sports Sci. 2006, 24, 919–932. [Google Scholar] [CrossRef] [PubMed] [Green Version]
- Young, W.; James, R.; Montgomery, I. Is muscle power related to running speed with changes of direction? J. Sports Med. Phys. Fitn 2002, 42, 282–288. [Google Scholar]
- Dos’Santos, T.; Thomas, C.; Comfort, P.; Jones, P.A. The effect of angle and velocity on change of direction biomechanics: An angle-velocity trade-off. Sports Med. 2018, 48, 2235–2253. [Google Scholar] [CrossRef] [Green Version]
- Watts, D. A brief review on the role of maximal strength in change of direction speed. J. Aust Strength Cond. 2015, 23, 100–108. [Google Scholar]
- Falch, H.N.; Rædergård, H.G.; van den Tillaar, R. Effect of different physical training forms on change of direction ability: A systematic review and meta-analysis. Sports Med.Open 2019, 5, 1–37. [Google Scholar]
- Falch, H.N.; Rædergård, H.G.; van den Tillaar, R. Effect of Approach Distance and Change of Direction Angles Upon Step and Joint Kinematics, Peak Muscle Activation, and Change of Direction Performance. Front. Sports Act. Liv. 2020, 2, 173. [Google Scholar] [CrossRef]
- Rædergård, H.G.; Falch, H.N.; van den Tillaar, R. Effects of Strength vs. Plyometric Training on Change of Direction Performance in Experienced Soccer Players. Sports 2020, 8, 144. [Google Scholar] [CrossRef]
- Bourgeois, F.; McGuigan, M.; Gill, N.; Gamble, G. Physical characteristics and performance in change of direction tasks: A brief review and training considerations. J. Aust. Strength Cond. 2017, 25, 104–117. [Google Scholar]
- Havens, K.L.; Sigward, S.M. Whole body mechanics differ among running and cutting maneuvers in skilled athletes. Gait. Post. 2015, 42, 240–245. [Google Scholar] [CrossRef]
- Schot, P.; Dart, J.; Schuh, M. Biomechanical analysis of two change-of-direction maneuvers while running. J. Orthop. Sports Phys. Ther. 1995, 22, 254–258. [Google Scholar] [CrossRef] [PubMed] [Green Version]
- Schreurs, M.J.; Benjaminse, A.; Lemmink, K.A. Sharper angle, higher risk? The effect of cutting angle on knee mechanics in invasion sport athletes. J. Biomech. 2017, 63, 144–150. [Google Scholar] [CrossRef] [PubMed] [Green Version]
- Sigward, S.M.; Cesar, G.M.; Havens, K.L. Predictors of frontal plane knee moments during side-step cutting to 45 and 110 men and women: Implications for ACL injury. Clin. J. Sports Med. 2015, 25, 529. [Google Scholar] [CrossRef] [Green Version]
- Falch, H.N.; Rædergård, H.G.; van den Tillaar, R. Association of strength and plyometric exercises with change of direction performances. PLoS ONE 2020, 15, e0238580. [Google Scholar] [CrossRef] [PubMed]
- Miller, A.E.J.; MacDougall, J.; Tarnopolsky, M.; Sale, D. Gender differences in strength and muscle fiber characteristics. Eur. J. Appl. Physiol. 1993, 66, 254–262. [Google Scholar] [CrossRef]
- Peterson, M.D.; Alvar, B.A.; Rhea, M.R. The contribution of maximal force production to explosive movement among young collegiate athletes. J. Strength Cond. Res. 2006, 20, 867–873. [Google Scholar]
- İnce, İ. Effects of Split Style Olympic Weightlifting Training on Leg Stiffness Vertical Jump Change of Direction and Sprint in Collegiate Volleyball Players. Univ. J. Edu. Res. 2019, 7, 24–31. [Google Scholar] [CrossRef] [Green Version]
- Arazi, H.; Asadi, A.; Roohi, S. Enhancing muscular performance in women: Compound versus complex, traditional resistance and plyometric training alone. J. Musc. Res. 2014, 17, 1450007. [Google Scholar] [CrossRef]
- Murphy, A.J.; Lockie, R.G.; Coutts, A.J. Kinematic determinants of early acceleration in field sport athletes. J. Sports Sci. Med. 2003, 2, 144. [Google Scholar]
- van den Tillaar, R.; Lerberg, E.; von Heimburg, E. Comparison of three types of warm-up upon sprint ability in experienced soccer players. J. Sport Health Sci. 2019, 8, 574–578. [Google Scholar] [CrossRef] [PubMed] [Green Version]
- Hewit, J.; Cronin, J.; Button, C.; Hume, P. Understanding deceleration in sport. Strength Cond. J. 2011, 33, 47–52. [Google Scholar] [CrossRef] [Green Version]
- Harper, D.J.; Morin, J.-B.; Carling, C.; Kiely, J. Measuring maximal horizontal deceleration ability using radar technology: Reliability and sensitivity of kinematic and kinetic variables. Sports Biomech. 2020, 1–17. [Google Scholar] [CrossRef] [PubMed]
- Jovanović, M.; Flanagan, E.P. Researched applications of velocity based strength training. J. Aust. Strength Cond. 2014, 22, 58–69. [Google Scholar]
- Rivière, J.R.; Rossi, J.; Jimenez-Reyes, P.; Morin, J.-B.; Samozino, P. Where does the one-repetition maximum exist on the force-velocity relationship in squat? Int. J. Sports Med. 2017, 38, 1035–1043. [Google Scholar] [CrossRef] [Green Version]
- Bogdanis, G.C.; Donti, O.; Papia, A.; Donti, A.; Apostolidis, N.; Sands, W.A. Effect of plyometric training on jumping, sprinting and change of direction speed in child female athletes. Sports 2019, 7, 116. [Google Scholar] [CrossRef] [Green Version]
- Markovic, G.; Dizdar, D.; Jukic, I.; Cardinale, M. Reliability and factorial validity of squat and countermovement jump tests. J. Strength Cond. Res. 2004, 18, 551–555. [Google Scholar]
- Cohen, J. Statistical Power Analysis for the Behaviour Sciences; Revised Edition; Academic: New York, NY, USA, 1988; Volume 73, pp. 19–74. [Google Scholar]
- Sawilowsky, S.S. New effect size rules of thumb. J. Mod. Appl. Stat. Met. 2009, 8, 26. [Google Scholar] [CrossRef]
- Spiteri, T.; Nimphius, S.; Hart, N.H.; Specos, C.; Sheppard, J.M.; Newton, R.U. Contribution of strength characteristics to change of direction and agility performance in female basketball athletes. J. Strength Cond. Res. 2014, 28, 2415–2423. [Google Scholar] [CrossRef]
- Nimphius, S.; McGuigan, M.R.; Newton, R.U. Relationship between strength, power, speed, and change of direction performance of female softball players. J. Strength Cond. Res. 2010, 24, 885–895. [Google Scholar] [CrossRef]
- Tramel, W.; Lockie, R.G.; Lindsay, K.G.; Dawes, J.J. Associations between absolute and relative lower body strength to measures of power and change of direction speed in Division II female volleyball players. Sports 2019, 7, 160. [Google Scholar] [CrossRef] [Green Version]
- Delaney, J.A.; Scott, T.J.; Ballard, D.A.; Duthie, G.M.; Hickmans, J.A.; Lockie, R.G.; Dascombe, B.J. Contributing factors to change-of-direction ability in professional rugby league players. J. Strength Cond. Res. 2015, 29, 2688–2696. [Google Scholar] [CrossRef] [PubMed]
- Harper, D.J.; Jordan, A.R.; Kiely, J. Relationships between eccentric and concentric knee strength capacities and maximal linear deceleration ability in male academy soccer players. J. Strength Cond. Res. 2021, 35, 465–472. [Google Scholar] [CrossRef]
- Little, T.; Williams, A. Specificity of Acceleration, Maximum Speed and Agility in Professional Soccer Players; Routledge: London, UK, 2003. [Google Scholar]
- Cross, T. SPEED/STRENGTH EXERCISE: The Lateral Squat. Strength Cond. J. 1991, 13, 56–64. [Google Scholar] [CrossRef]
- Sato, K.; Liebenson, C. The lateral squat. J. Body Movem. Ther. 2013, 17, 560–562. [Google Scholar] [CrossRef]
- Saeterbakken, A.H.; Fimland, M.S. Muscle force output and electromyographic activity in squats with various unstable surfaces. J. Strength Cond. Res. 2013, 27, 130–136. [Google Scholar] [CrossRef] [PubMed]
- Nygaard Falch, H.; Guldteig Rædergård, H.; Van den Tillaar, R. Relationship of performance measures and muscle activity between a 180 change of direction task and different countermovement jumps. Sports 2020, 8, 47. [Google Scholar] [CrossRef] [PubMed]
- Lockie, R.G.; Dawes, J.J.; Jones, M.T. Relationships between linear speed and lower-body power with change-of-direction speed in national collegiate athletic association divisions I and II women soccer athletes. Sports 2018, 6, 30. [Google Scholar] [CrossRef] [Green Version]
- Hammami, R.; Chaouachi, A.; Makhlouf, I.; Granacher, U.; Behm, D.G. Associations between balance and muscle strength, power performance in male youth athletes of different maturity status. Pediat. Exerc. Sci. 2016, 28, 521–534. [Google Scholar] [CrossRef]
- Kean, C.O.; Behm, D.G.; Young, W.B. Fixed foot balance training increases rectus femoris activation during landing and jump height in recreationally active women. J. Sports Sci. Med. 2006, 5, 138. [Google Scholar]
- Pérez-Castilla, A.; Rojas, F.J.; Gómez-Martínez, F.; García-Ramos, A. Vertical jump performance is affected by the velocity and depth of the countermovement. Sports Biomech. 2019, 1–16. [Google Scholar] [CrossRef]
- Bobbert, M.F.; Gerritsen, K.G.; Litjens, M.C.; Van Soest, A.J. Why is countermovement jump height greater than squat jump height? Med. Sci. Sports Exerc. 1996, 28, 1402–1412. [Google Scholar] [CrossRef] [PubMed]
- Comfort, P.; Bullock, N.; Pearson, S.J. A comparison of maximal squat strength and 5-, 10-, and 20-meter sprint times, in athletes and recreationally trained men. J. Strength Cond. Res. 2012, 26, 937–940. [Google Scholar] [CrossRef] [PubMed]
- Barr, M.J.; Sheppard, J.M.; Agar-Newman, D.J.; Newton, R.U. Transfer effect of strength and power training to the sprinting kinematics of international rugby players. J. Strength Cond. Res. 2014, 28, 2585–2596. [Google Scholar] [CrossRef] [PubMed]
- Sasaki, S.; Nagano, Y.; Kaneko, S.; Sakurai, T.; Fukubayashi, T. The relationship between performance and trunk movement during change of direction. J. Sports Sci. Med. 2011, 10, 112. [Google Scholar] [PubMed]
- Hewit, J.K.; Cronin, J.B.; Hume, P.A. Kinematic factors affecting fast and slow straight and change-of-direction acceleration times. J. Strength Cond. Res. 2013, 27, 69–75. [Google Scholar] [CrossRef] [PubMed] [Green Version]
- Dos’ Santos, T.; Thomas, C.; Jones, P.A.; Comfort, P. Mechanical determinants of faster change of direction speed performance in male athletes. J. Strength Cond. Res. 2017, 31, 696–705. [Google Scholar] [CrossRef] [PubMed] [Green Version]
- Banyard, H.G.; Nosaka, K.; Haff, G.G. Reliability and validity of the load–velocity relationship to predict the 1RM back squat. J. Strength Cond. Res. 2017, 31, 1897–1904. [Google Scholar] [CrossRef] [PubMed]


| Strength Tests | Mean ± STD |
|---|---|
| Bilateral squat (1-RM/body mass) | 1.28 ± 0.32 |
| Unilateral quarter squat (1-RM/body mass) | 0.88 ± 0.28 |
| Lateral squat (1-RM/body mass) | 0.57 ± 0.2 |
| Plyometric tests | |
| Drop jump (reactive strength index) | 117 ± 30.8 |
| Unilateral countermovement jump (cm) | 11.6 ± 2.5 |
| Skate-jump (cm) | 169.1 ± 9.7 |
| CODs (s) | |
| First 10 m 45° | 2.20 ± 0.11 |
| Last 10 m 45° | 1.68 ± 0.11 |
| 20 m 45° | 3.88 ± 0.2 |
| First 10 m 180° | 2.40 ± 0.12 |
| Last 10 m 180° | 2.77 ± 0.17 |
| 20 m 180° | 5.17 ± 0.24 |
| Peak velocities in the straight-line sprint (m/s) | |
| 5 m | 5.36 ± 0.25 |
| 10 m | 6.30 ± 0.32 |
| 20 m | 6.89 ± 0.38 |
| 30 m | 7.06 ± 0.48 |
| Braking test | |
| Horizontal acceleration power (W/kg) | 8.39 ± 1.22 |
| Horizontal braking power (W/kg) | −10.51 ± 1.48 |
| Horizontal braking force (N/kg) | −3.11 ± 0.47 |
| Bilateral Squat | Quarter Squat | Lateral Squat | RSI | CMJ | Skate-Jump | |
|---|---|---|---|---|---|---|
| COD first 10 m 180° | −0.46 * | −0.49 * | 0.28 | −0.44 * | −0.25 | −0.13 |
| COD last 10 m 180° | −0.35 | −0.21 | 0.22 | 0.03 | −0.3 | 0.15 |
| COD 20 m 180° | −0.48 * | −0.39 | 0.28 | −0.19 | −0.28 | 0.05 |
| COD first 10 m 45° | −0.64 * | −0.62 * | 0.19 | −0.2 | −0.29 | −0.01 |
| COD last 10 m 45° | −0.29 | −0.17 | 0.07 | −0.02 | −0.31 | 0.02 |
| COD 20 m 45° | −0.5 * | −0.43 * | 0.14 | −0.13 | −0.22 | −0.05 |
| Force-Oriented CODs | Velocity-Oriented CODs | |||
|---|---|---|---|---|
| Fast Performers | Slow Performers | Fast Performers | Slow Performers | |
| Strength (load/BM) | ||||
| Bilateral squat | 1.52 ± 0.31 * | 1.05 ± 0.28 | 1.52 ± 0.23 * | 1.1 ± 0.28 |
| Quarter squat | 1.06 ± 0.18 * | 0.71 ± 0.16 | 1 ± 0.24 * | 0.72 ± 0.17 |
| Lateral squat | 0.56 ± 0.17 | 0.61 ± 0.24 | 0.61 ± 0.28 | 0.56 ± 0.17 |
| Plyometric exercises | ||||
| Drop jump (RSI) | 123.8 ± 28.4 | 123.3 ± 40.8 | 112.9 ± 22.8 | 111 ± 35.9 |
| CMJ (cm) | 13.4 ± 1.4 * | 10.1 ± 2.4 | 12.6 ± 1.4 * | 10.3 ± 2.2 |
| Skate-jump (cm) | 165.5 ± 9.5 | 169.1 ± 8.3 | 167.8 ± 9.4 | 168.3 ± 8 |
| Force-Oriented CODs | ||||||
|---|---|---|---|---|---|---|
| Fast COD Performers | Slow COD Performers | F | ES | ES | CI (95%) | |
| Mean ± STD | Mean ± STD | (d) | Description | |||
| Peak velocities (m/s) | ||||||
| First 5 m (of 30 m sprint) | 5.61 ± 0.13 | 5.08 ± 0.16 | 0.22 | 3.61 * | Huge | −0.69, −0.37 |
| First 10 m (of 30 m sprint) | 6.62 ± 0.15 | 5.95 ± 0.2 | 0.85 | 3.76 * | Huge | −0.85, −0.47 |
| First 20 m (of 30 m sprint) | 7.26 ± 0.17 | 6.48 ± 0.24 | 0.7 | 3.78 * | Huge | −1.00, −0.56 |
| 30 m sprint | 7.49 ± 0.23 | 6.56 ± 0.27 | 1.67 | 4.14 * | Huge | −1.19, −0.67 |
| 180° COD | 5.77 ± 0.12 | 5.21 ± 0.18 | 2.72 | 3.78 * | Huge | −0.73, −0.39 |
| Ground contact times (ms) | ||||||
| 30 m sprint, average | 154.3 ± 17.9 | 175.3 ± 12.6 | 2.02 | 1.38 * | Very large | 4.43, 37.65 |
| 180° COD, plant step | 1239.7 ± 192.11 | 1058.7 ± 167.8 | 0.09 | 1.01 | Large | −37.45, 12.37 |
| 180° COD, average | 177.4 ± 14.6 | 202.4 ± 13.3 | 0.05 | 1.79 * | Very large | 1.00, 39.87 |
| Flight time (ms) | ||||||
| 30 m sprint, average | 88.3 ± 5.4 | 103 ± 10.6 | # | 1.84 * | Very large | 5.11, 24.26 |
| 180° COD, average | 54.4 ± 9.5 | 67.6 ± 14.7 | 0.51 | 1.09 | Large | −0.08, 26.42 |
| Step lengths (m) | ||||||
| 30 m sprint | 1.53 ± 0.1 | 1.52 ± 0.13 | 0.62 | 0.11 | Very small | −0.14, 0.11 |
| 180° COD | 1.19 ± 0.08 | 1.19 ± 0.07 | 0.64 | 0.1 | Very small | −0.09, 0.08 |
| Step frequencies (n/s) | ||||||
| 30 m sprint | 4.22 ± 0.37 | 3.67 ± 0.14 | # | 2.18 * | Huge | −0.86, −0.24 |
| 180° COD | 4.35 ± 0.34 | 3.74 ± 0.16 | # | 2.44 * | Huge | −0.91, −0.32 |
| Horizontal braking test | ||||||
| Acceleration power (W/kg) | 9.26 ± 1.03 | 7.19 ± 0.89 | 0.15 | 2.15 * | Huge | −3.90, −1.35 |
| Braking power (W/kg) | −11.58 ± 1.01 | −9.73 ± 1.77 | 0.84 | 1.34 * | Very large | 0.29, 3.38 |
| Braking force (N/kg) | −2.88 ± 0.66 | −3.34 ± 0.32 | 3.86 | 0.09 | Very small | −0.09, 1.01 |
| Velocity-Oriented CODs | ||||||
|---|---|---|---|---|---|---|
| Fast COD Performers | Slow COD Performers | F | ES | ES | CI (95%) | |
| Mean ± STD | Mean ± STD | (d) | Description | |||
| Peak velocities (m/s) | ||||||
| First 5 m (of 30 m sprint) | 5.58 ± 10 | 5.08 ± 0.16 | 2.96 | 3.79 * | Huge | −0.64, −0.35 |
| First 10 m (of 30 m sprint) | 6.59 ± 0.1 | 5.94 ± 0.18 | 3.34 | 4.69 * | Huge | −0.81, −0.50 |
| First 20 m (of 30 m sprint) | 7.25 ± 0.11 | 6.44 ± 0.18 | 3.86 | 5.48 * | Huge | −0.97, −0.65 |
| 30 m sprint | 7.53 ± 0.14 | 6.55 ± 0.25 | 2.85 | 6.75 * | Huge | −1.13, −0.43 |
| 45° COD | 6.01 ± 0.12 | 5.48 ± 0.2 | 3.7 | 3.31 * | Huge | −0.73, −0.36 |
| Ground contact times (ms) | ||||||
| 30 m sprint, averages | 156 ± 16.5 | 176.8 ± 10.1 | 2.5 | 1.49 * | Huge | 5.20, 34.55 |
| 45° COD, plant step | 168.2 ± 20.6 | 186.7 ± 12.3 | 1.55 | 1.12 | Large | −0.07, 38.78 |
| 45° COD, averages | 178.9 ± 14.5 | 195.9 ± 12.4 | 0.17 | 1.26 * | Very large | 3.34, 35.46 |
| Flight time (ms) | ||||||
| 30 m sprint, average | 89.4 ± 8.9 | 102.3 ± 9.9 | 0.1 | 1.38 * | Very large | 3.13, 26.5 |
| 45° COD, average | 56.5 ± 12.4 | 97.1 ± 36.2 | 0.01 | 1.71 * | Very large | 1.66, 39.97 |
| Step lengths (m) | ||||||
| 30 m sprint | 1.56 ± 0.1 | 1.54 ± 0.14 | 0.59 | 0.15 | Very small | −0.15, 0.11 |
| 45° COD | 1.18 ± 0.15 | 1.3 ± 0.14 | 0.55 | 0.9 | Large | −0.04, 0.3 |
| Step frequencies (n/s) | ||||||
| 30 m sprint | 4.2 ± 0.35 | 3.66 ± 0.15 | # | 2.16 * | Huge | −0.85, −0.24 |
| 45° COD | 4.33 ± 0.39 | 3.66 ± 0.26 | 0.63 | 2.04 * | Huge | −1.08, −0.25 |
| Horizontal braking test | ||||||
| Acceleration power (W/kg) | 9.25 ± 1 | 7.21 ± 0.91 | 0.06 | 2.15 * | Huge | −3.07, −1.02 |
| Braking power (W/kg) | –11.33 ± 0.91 | –9.49 ± 1.65 | 1.06 | 1.44 * | Very large | 0.42, 3.27 |
| Braking force (N/kg) | –3.27 ± 0.25 | –2.81 ± 0.61 | 4.59 | 1.07 | Large | −0.04, 0.96 |
Publisher’s Note: MDPI stays neutral with regard to jurisdictional claims in published maps and institutional affiliations. |
© 2021 by the authors. Licensee MDPI, Basel, Switzerland. This article is an open access article distributed under the terms and conditions of the Creative Commons Attribution (CC BY) license (https://creativecommons.org/licenses/by/4.0/).
Share and Cite
Falch, H.N.; Kristiansen, E.L.; Haugen, M.E.; van den Tillaar, R. Association of Performance in Strength and Plyometric Tests with Change of Direction Performance in Young Female Team-Sport Athletes. J. Funct. Morphol. Kinesiol. 2021, 6, 83. https://0-doi-org.brum.beds.ac.uk/10.3390/jfmk6040083
Falch HN, Kristiansen EL, Haugen ME, van den Tillaar R. Association of Performance in Strength and Plyometric Tests with Change of Direction Performance in Young Female Team-Sport Athletes. Journal of Functional Morphology and Kinesiology. 2021; 6(4):83. https://0-doi-org.brum.beds.ac.uk/10.3390/jfmk6040083
Chicago/Turabian StyleFalch, Hallvard Nygaard, Eirik Lindset Kristiansen, Markus Estifanos Haugen, and Roland van den Tillaar. 2021. "Association of Performance in Strength and Plyometric Tests with Change of Direction Performance in Young Female Team-Sport Athletes" Journal of Functional Morphology and Kinesiology 6, no. 4: 83. https://0-doi-org.brum.beds.ac.uk/10.3390/jfmk6040083