Article

Use of Random Forest Model to Identify the Relationships among Vegetative Species, Salt Marsh Soil Properties, and Interstitial Water along the Atlantic Coast of Georgia

1
Appalachian Laboratory, University of Maryland Center for Environmental Science, Frostburg, MD 21532, USA
2
Jacobs Engineering Group, Dallas, TX 75201, USA
3
College of Engineering, University of Georgia, Athens, GA 30605, USA
4
Warnell School of Forestry and Natural Resources, University of Georgia, Athens, GA 30605, USA
5
School of Geosciences, University of South Florida, Tampa, FL 33620, USA
*
Author to whom correspondence should be addressed.
Submission received: 14 April 2021 / Revised: 27 April 2021 / Accepted: 29 April 2021 / Published: 3 May 2021
(This article belongs to the Special Issue Urban Geotechnical Engineering)

Abstract

:
Saltmarshes, known to be ecologically sensitive areas, face disturbances such as vegetation dieback due to anthropogenic activities such as construction. The current construction specifications recommended by state highway agencies do not specifically require documenting or restoring any prior saltmarsh soil/interstitial water properties, nor do they require re-establishing saltmarsh vegetation; restoring the abiotic properties and appropriate vegetation would enhance the long-term functionality and ecology of a disturbed area. In order to have a successful restoration of disturbed saltmarshes with healthy vegetation, the relationship between vegetative species and the properties of saltmarsh soils and interstitial water must be fully understood. In this study, field and laboratory tests were conducted for the soil samples from eight different saltmarsh sites in the Southeastern US Atlantic coastal region, followed by the development of a random forest model; the aim is to identify correlation among saltmarsh predominant vegetation types, redox potential, and salinity. The results reveal that moisture content and sand content are two main drivers for the bulk density of saltmarsh soils, which directly affect plant growth and likely root development. Moreover, it is concluded that deploying modern machine learning algorithms, such as random forest, can help to identify desirable saltmarsh soil/water properties for re-establishing vegetative cover with the reduced time after construction activities.

1. Introduction

Saltmarshes provide a healthy environment for wildlife and plants, stabilize the coastline, protect structures from flooding, and improve water quality [1,2,3]. These areas have high net primary productivity and accommodate salt-tolerant vegetative species (halophytes), which play a vital role in coastal protection including soil erosion control [4,5].
The construction, reconstruction, and maintenance of transportation infrastructure cause disturbances in saltmarshes by altering storm-water runoff patterns [6,7], increasing soil bulk density [8], and changing the hydrology [9]. Utilizing heavy equipment, staging construction materials, and constructing access/egress roads in these environmentally sensitive areas alters surface elevation [10] and surface soil properties, including bulk density [4], redox potential [11], alkalinity [12], soil water content [13], and hydraulic conductivity [14], all of which affect vegetation health and result in the loss of ecological functionality in the impacted areas [8,15,16].
Saltmarsh dieback is identified by vegetation loss, yielding large expanses of bare mud [17], and is considered as a geographically independent event [18]; some examples include Spartina alterniflora (syn. Sporobolus alterniflorus) dieback throughout the Mississippi River deltaic plain [19], Spartina alterniflora and Juncus roemerianus dieback in Georgia [18], Spartina alterniflora dieback in Louisiana [20] and Spartina townsendii dieback in Great Britain [21]. The causes of such vegetation diebacks are likely different and remained unknown in most cases [22], but construction activity and the accumulation of vegetation wrack are believed to be the potential cause of vegetative dieback in saltmarshes [17,23]. Re-establishing the proper physicochemical environment after construction leads to an increase in the likelihood of vegetative success [24]. Although the soil property changes due to the construction in saltmarshes consequently expedite a dieback process, the relationship between soil properties and vegetation health is not fully understood [18,25].
A key restoration practice in an impacted saltmarsh is to re-establish native halophytes [26]. To ensure successful vegetation re-establishment, the structure and the composition of the underlying hydric soil should be returned to baseline or improved conditions once postconstruction restoration practice is carried out [27], but these data are often unavailable. Establishing the baseline based on reliable data improves the likelihood of returning hydrologic and ecological functionality if sites were restored to the pre-existing conditions after construction activity [28,29]. To improve the efficacy of restoration efforts in impacted saltmarshes, the research presented herein investigates in situ saltmarsh soil physical and chemical properties to provide a baseline for the re-establishment of soil properties with the expectation to re-establish vegetative success and ecological function after construction impacts.

1.1. Soil Properties and Vegetation

Because fundamental soil properties such as organic matter content, texture, and bulk density influence the physicochemical environment in saltmarshes, the roles of each factor should be considered in the re-establishment success of target species. Soils low in organic matter tend not to be capable of supporting vegetation due to poor nutrient cycling in restored wetlands [30]. Soil organic matter is the key source of the essential nutrients for vegetative species growth [31].
Soil texture influences both soil organic matter retention and moisture content; finer textured soils with high clay content or silt have a greater capability of holding water and organic matter compared to coarse soils with high sand content [11,32]. Soil texture contributes to bulk density, which reflects soils’ structural stability to support vegetation growth against erosive impacts of tidal flooding; however, a bulk density greater than 1.6 g/cm3 generally is not suitable for root and plant growth in saltmarshes [33]. Because highly compacted soils restrict plant growth and root development, the following maximum bulk density values (bulk density thresholds for root penetration) are recommended based upon soil texture as follows [34,35,36]:
  • 1.1 ( g cm 3 ) for clay, sandy clay, silty clay and clay loam;
  • 1.4 ( g cm 3 ) for silt loam, silty clay loam, silt, silt loam, sandy clay loam, clay loam, sandy loam and loam;
  • 1.6 ( g cm 3 ) for sand and loamy sand.
An increase of soil bulk density from 1.1 to 1.4 g/cm3 yielded a 42% reduction in oxygen diffusion rate through waterlogged saltmarsh soil, while the induced changes in soil bulk density from 1.1 to 1.7 g/cm3 resulted in a 75% reduction in the rate of oxygen diffusion [37]. Further, as soil organic matter decreases, bulk density increases, which can inhibit vegetation growth in restored saltmarshes [38,39]. Therefore, low organic matter content and high bulk density impact biogeochemical processing and restrict the root growth of some hydrophytes [40].
Statistical regression models successfully use organic matter content as a predictor for soil bulk density prediction [41,42]. Linear and exponential models for bulk density prediction are based on organic matter content, but such statistical models have a high variability in the bulk density response.

1.2. Interstitial Water Properties and Saltmarsh Vegetation

Re-establishing a native halophyte in a disturbed saltmarsh can be expedited by mimicking the relationship among interstitial water parameters, such as salinity, redox potential (Eh), and hydrogen ion concentration index of solution (pH), and vegetation health. In other words, successful restoration is accomplished by considering the ideal range of salinity, pH, and Eh for halophyte re-establishment [25]. Some typical saltmarsh species such as S. alterniflora are water-tolerant and ideal for colonization and proliferation in low-Eh environments through anatomical adaptations such as aerenchyma formation, which allows the plant to transport oxygen from its shoots to roots [43]. Such water-tolerant species take advantage of the anatomical adaptation strategies to combat the intensity of soil reduction by transferring oxygen from the shoots to roots and restricting the buildup of ethanol to toxic levels [43].
S. alterniflora and J. roemerianus, two predominant halophytes along the Southeastern Atlantic coast, tend to establish and develop in higher-salinity and lower-Eh saltmarshes than Schoenoplectus tabernaemontani [44]. The root system and some sophisticated metabolic adaptations such as ion exclusion in roots and ion secretion in shoots by salt glands are two important strategies helping S. alterniflora adapt to high salinity (more than 45 PSU) environments [45,46]. On the other hand, Borrichia frutescens is a ubiquitous plant in saltmarshes along the Atlantic coastline in the United States where they are not exposed to daily tidal inundations [27,47]. This species is able to grow in high salinity soils ranging from 20 to 50 PSU [48].
To date, the use of modern machine learning methods, such as random forest (RF), for estimating saltmarsh soil properties and classifying vegetation type has not been investigated or published. In this study, the RF algorithm as a versatile method is used to characterize soil attributes at rooting depth and classify vegetation canopy at the sampling sites. Moreover, we use RF to determine the most important parameters that affect the establishment and development of saltmarsh vegetation. The outcome of this study helps to guide engineers to conduct successful restoration practices in disturbed tidal saltmarshes. Knowing the relationship between halophytes and soil parameters optimizes restoration design and provides target species with ideal growth conditions. Further, findings from this study are beneficial for monitoring saltmarshes and detecting the changes in soil conditions due to both anthropogenic and naturogenic disturbances.

2. Material and Methods
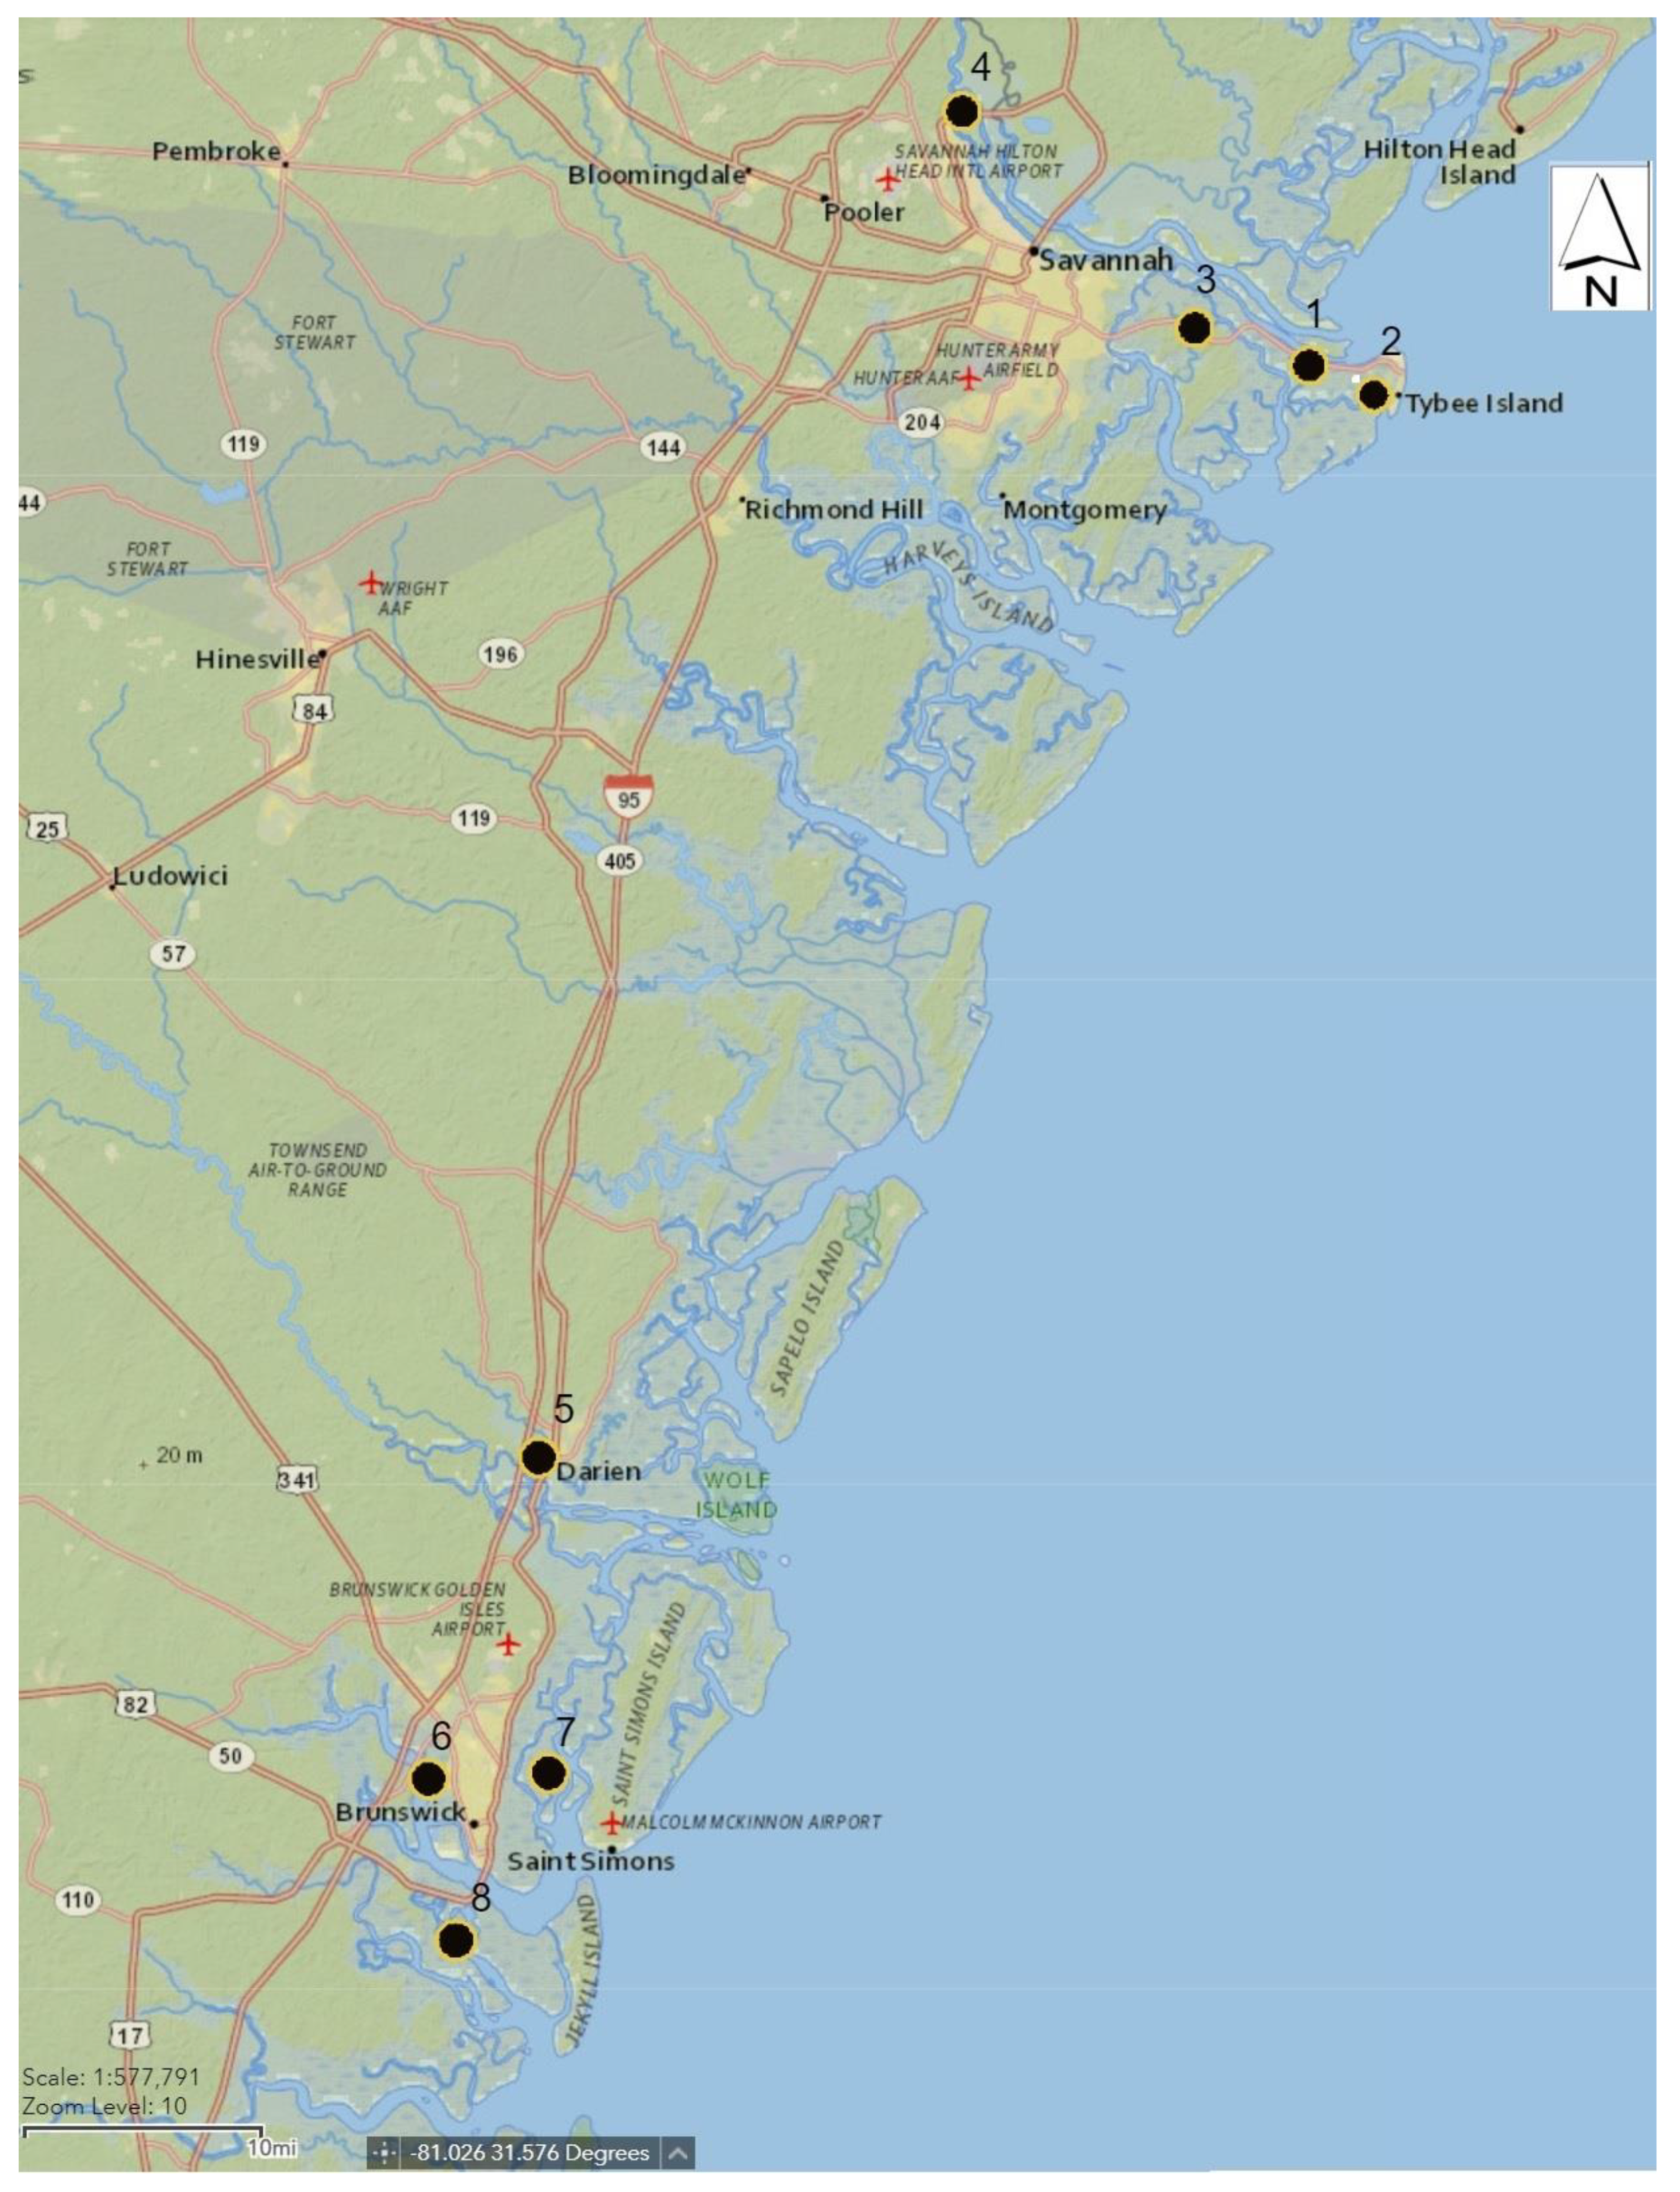
2.1. Study Sites

Eight saltmarsh sites along Georgia’s Atlantic coast were selected based on their proximity to infrastructure improvement projects (Figure 1). Each selected site was divided into three different zones (A, B, C) depending on the dominant vegetative species for soil sampling. The dominant vegetative species were determined based on which species represented more than 50% coverage in each selected site.

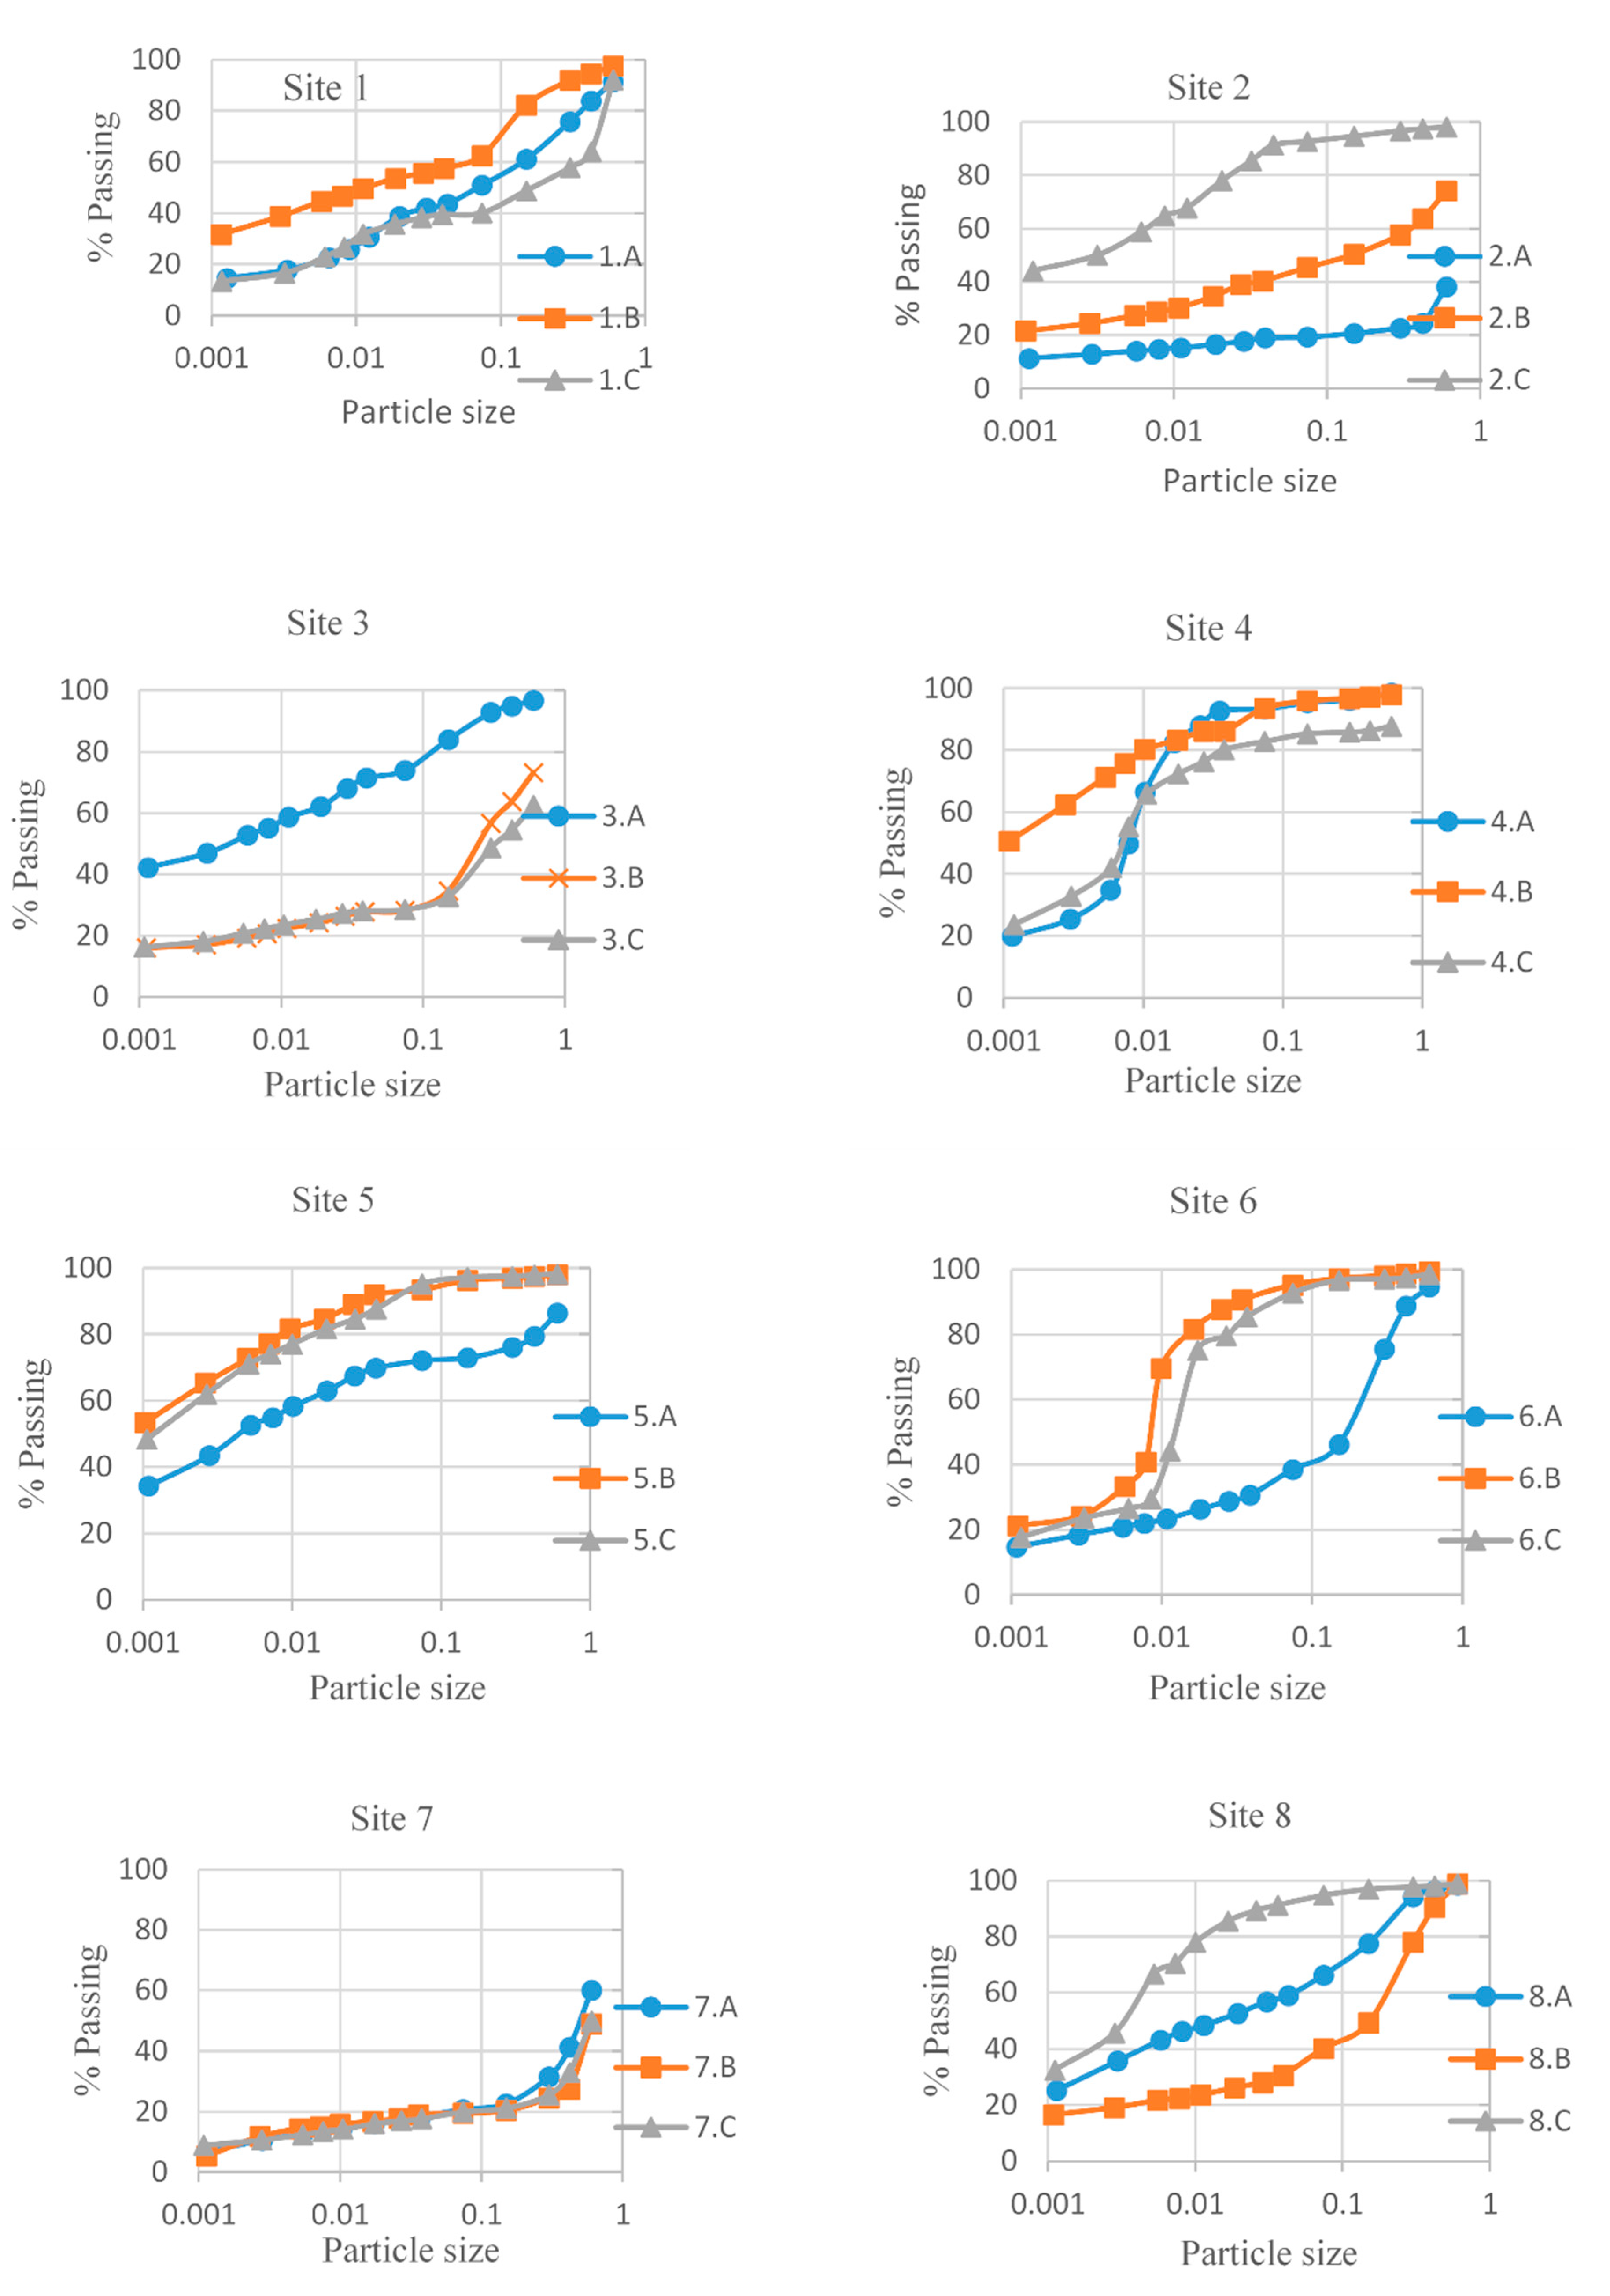
2.2. Sample Collection and Soil Physical Characteristics
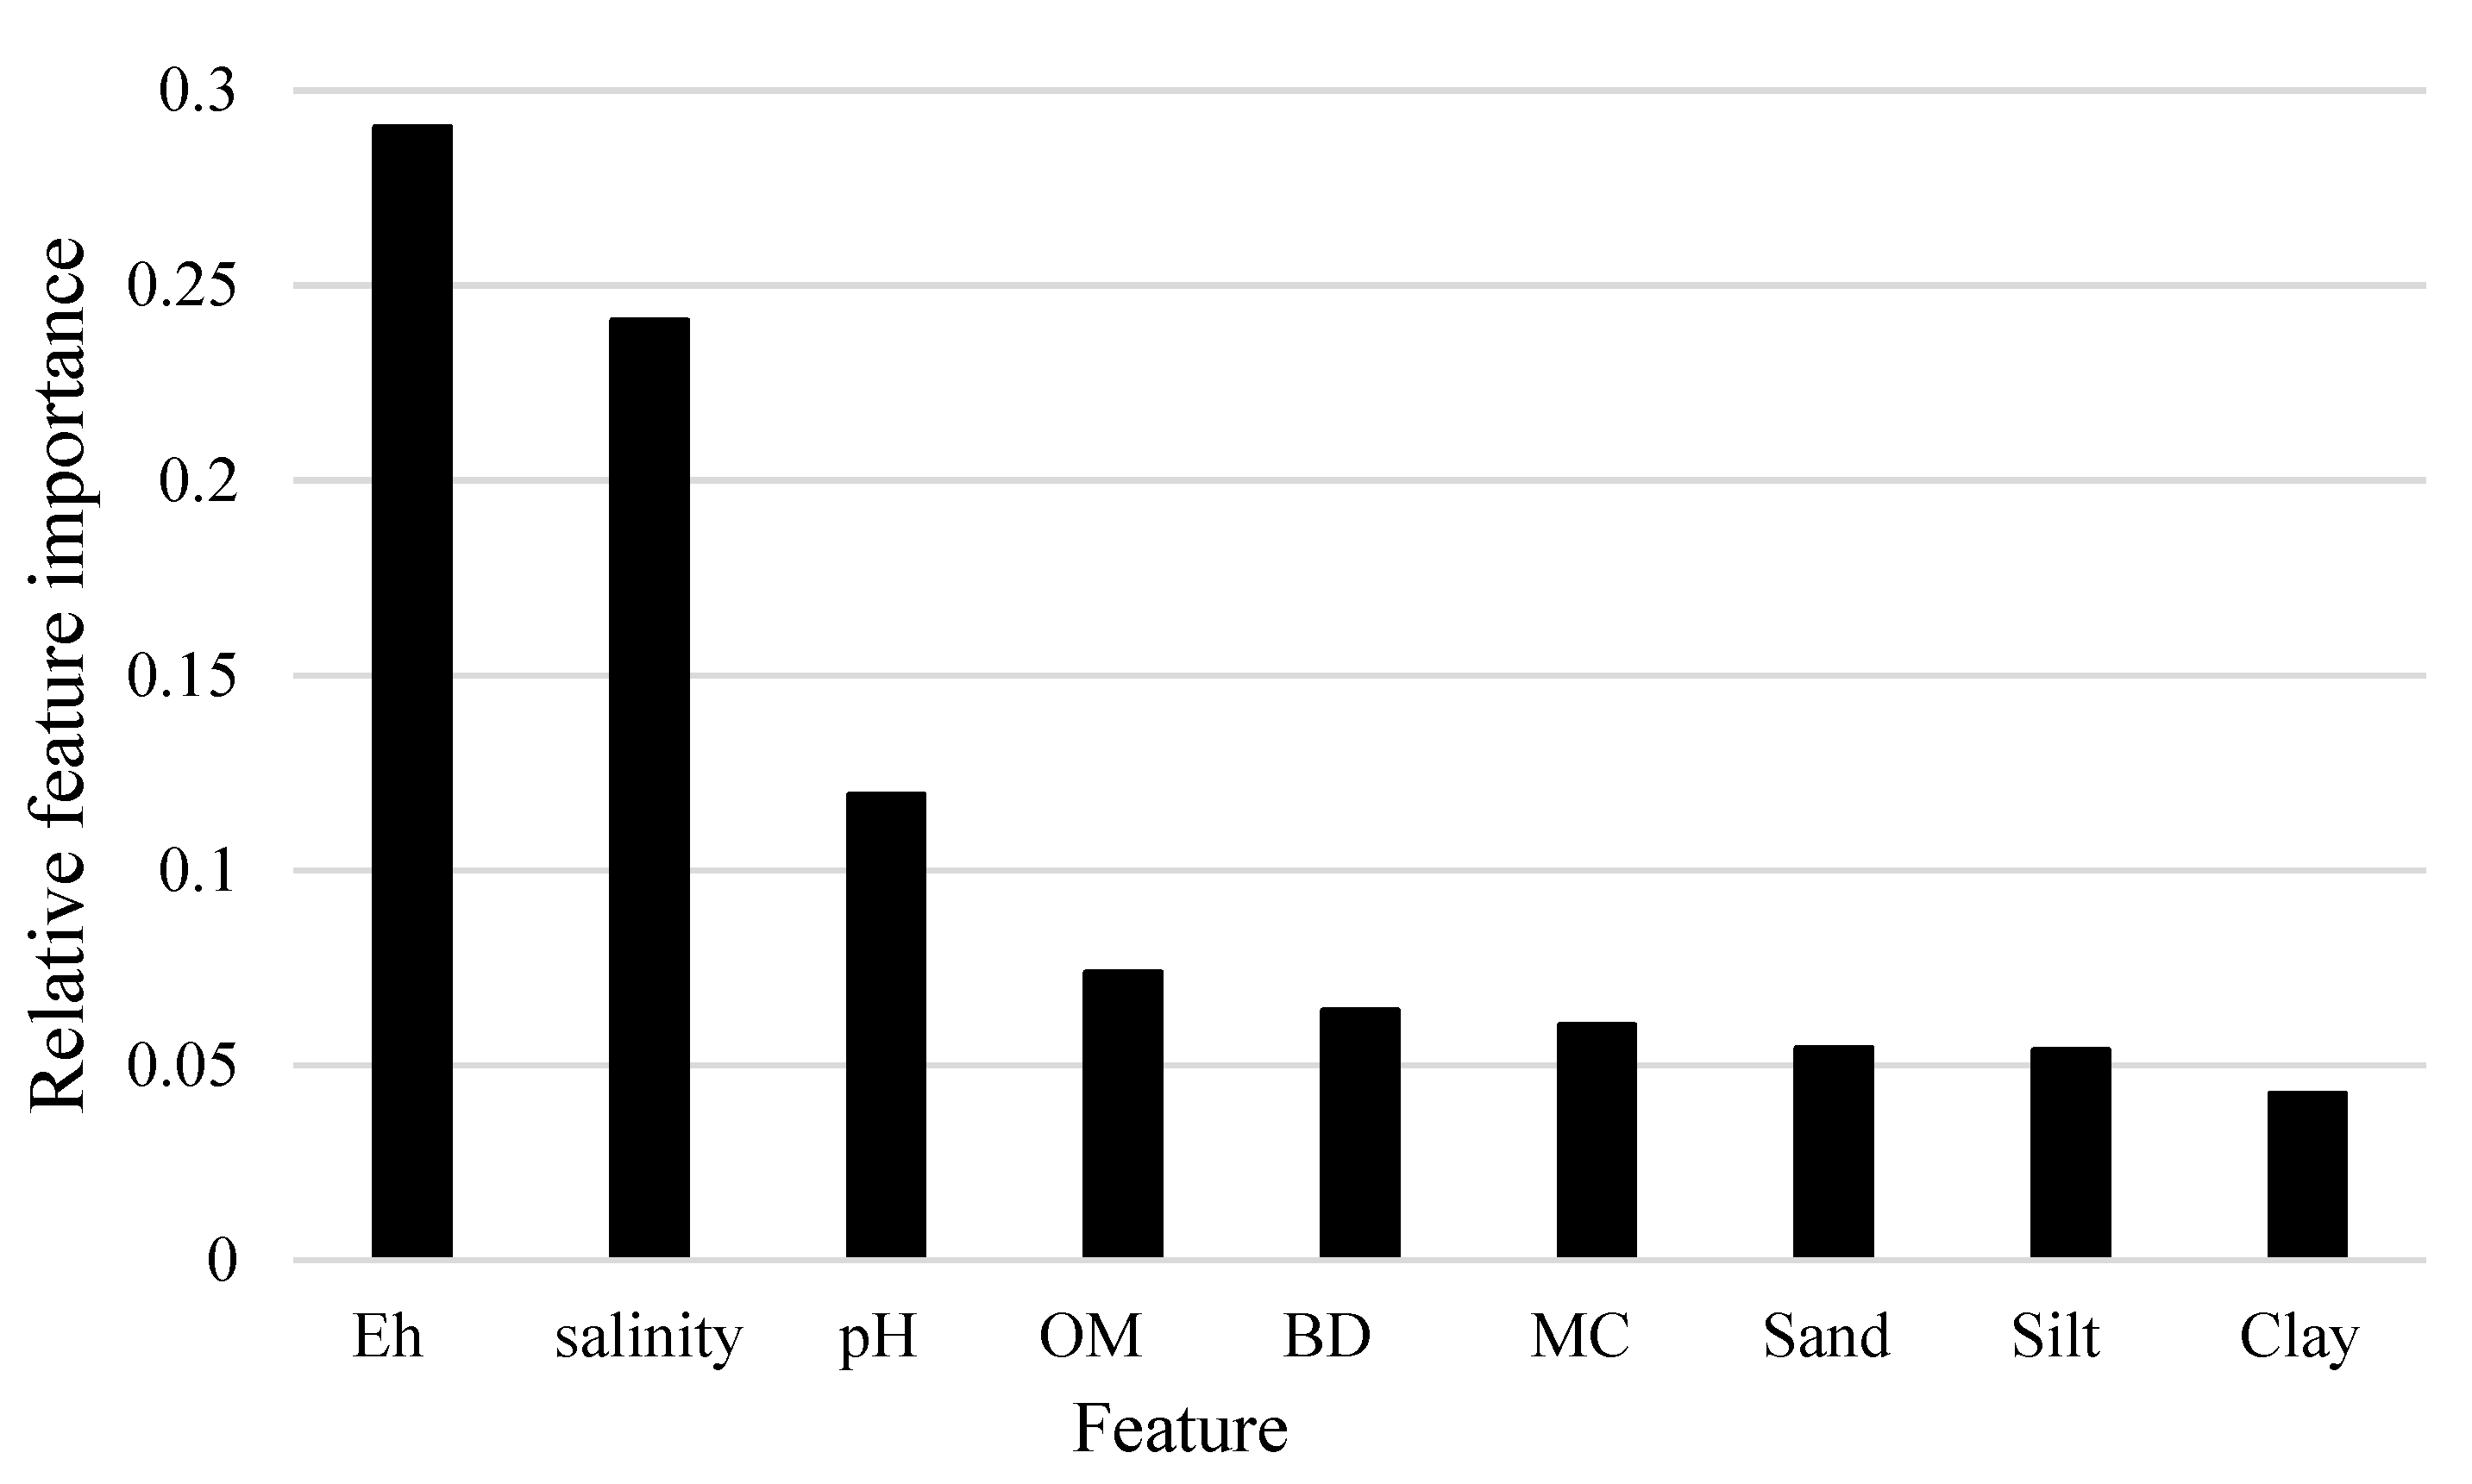
Triplicate soil samples from each site were obtained to quantify the variability within and between locations. A total of 24 soil samples were collected in the rooting zone at the sites and kept intact in sealed waterproof containers to avoid moisture loss. All samples were transported to a laboratory within four hours and stored at 4 °C for the measurement of moisture content, organic matter content, and particle size distribution. The bulk density of an undisturbed soil sample from the root zone was measured in accordance with the core method [49]. Porewater was withdrawn from the root zone using a pushpoint sampler and 60 mL syringes [50]; the salinity, pH, and Eh of the pore water were measured using a calibrated HI98194 portable meter (Hanna Instruments—Woonsocket, RI, USA) in the field.
Particle size distribution using methods employing a sieve (American Society for Testing and Materials (ASTM) D1140-17) and a hydrometer (ASTM D422) were used to determine classification following the USDA soil classification system. Moisture and organic matter content were also measured based on ASTM D2216-10 and ASTM D2974-87, respectively.

2.3. Random Forest

Tree-based models are nonlinear and extremely flexible for data fitting. However, single tree models suffer from high variance. To overcome this issue, tree-based ensemble methods have been widely adopted. Random forest (RF) is one of the popular ensemble methods that has been widely applied across different fields; it leverages a collection of trees that are constructed from bootstrapped samples of a training data set. Besides bootstrapping, RF considers the split candidates from a randomly chosen subset of the original feature set, which results in decorrelated trees and reduces prediction variance. RF has been used in soil science for characterizing and modeling soil organic matter distribution [51,52,53,54]. This study aims to explore the utility of RF for classifying halophyte types based on soil and interstitial properties and identifies the most important parameters that influence the halophyte type and community at saltmarshes found along Georgia’s coast.

3. Results

3.1. Saltmarsh Soils Physical Properties

The soil properties information obtained from the selected sites are summarized in Figure 2 and Table 1. The soil particle size fraction shows considerable variability in soil composition within a relatively small area at a saltmarsh site (Figure 2). For example, site 3.A is near site 3.B, but they are determined to be clay and sandy loam, respectively. Site 3.A has 44.57% clay and 26.15% sand content, while 3.B contains 17.07% clay and 71.80% sand. Site 7 (classified as loamy sand) has the highest average bulk density (1.56 g/cm3) and the lowest average organic matter content (1.38%), with 80% sand on average (Figure 2). On the other hand, site 4 has the lowest average bulk density (0.24 g/cm3) as well as the highest organic matter and moisture content (Table 1). Fine-textured soil and high organic matter content result in the low bulk density of soils at site 4. Soil texture has a high spatial variability in saltmarshes and is expected to change when disturbed by construction, and so spatial variability should be considered for restoration practice as it influences soil bulk density, organic matter retention, water retention, Eh, and salinity—all factors that contribute to native vegetation re-establishment.
Organic matter content ranged from a minimum of 0.24% at site 7.A to a maximum of 28.8% at site 4.C (Table 1). Soil at site 4.C has the highest organic matter content as well as the finest texture (clay and silt) among the study sites. Sites 3 and 7 have relatively higher sand content and bulk density, which expedite water drainage and particulate organic matter loss due to daily inundations. The high sand content at these sites facilitates rapid drainage and contains little organic matter, thus little nutrients; because of this, these sites are not likely to support a diverse vegetation community. Moreover, high sand soils in close proximity to seawater tend to have high salinity due to a high rate of moisture loss occurring through drainage and evaporation, which make a less favorable environment for vegetation growth. It is believed that the vegetative species that can survive in lower pH level would be the dominant vegetative species in this soil environment [11].

3.2. Relationship among Vegetative Species, pH, Organic Matter, and Elevation Gradient

S. alterniflora is the dominant halophyte at sites 1, 2, 6, and 8 and S. tabernaemontani is dominant at sites 4 and 5. Sites 3 and 7 support both J. roemerianus and B. frutescens, respectively.
During the site visit in June 2018, anaerobic conditions and circumneutral pH were observed at all sampling sites. Table 2 summarizes the measurements of salinity, pH, and Eh at all sampling sites along with the dominant vegetative species. The pH level for all the sites exceeds 4 (Table 2), which increases the saltmarsh capability to support halophytes because acidic soils tend to be low in necessary nutrients such as nitrogen and phosphorous for vegetation growth [55]. S. tabernaemontani and J. roemerianus can grow in lower pH while B. frutescens and S. alterniflora can grow at sites that have a higher pH with respect to other halophytes (Table 2). To confirm this observation, a Tukey HSD determined that the mean pH significantly influences halophyte growth at saltmarsh sites (Table 3). As shown in Table 3, a significant difference in mean pH was found between B. frutescens and J. roemerianus, B. frutescens and S. tabernaemontani, S. alterniflora and J. roemerianus, and S. alterniflora and S. tabernaemontani.

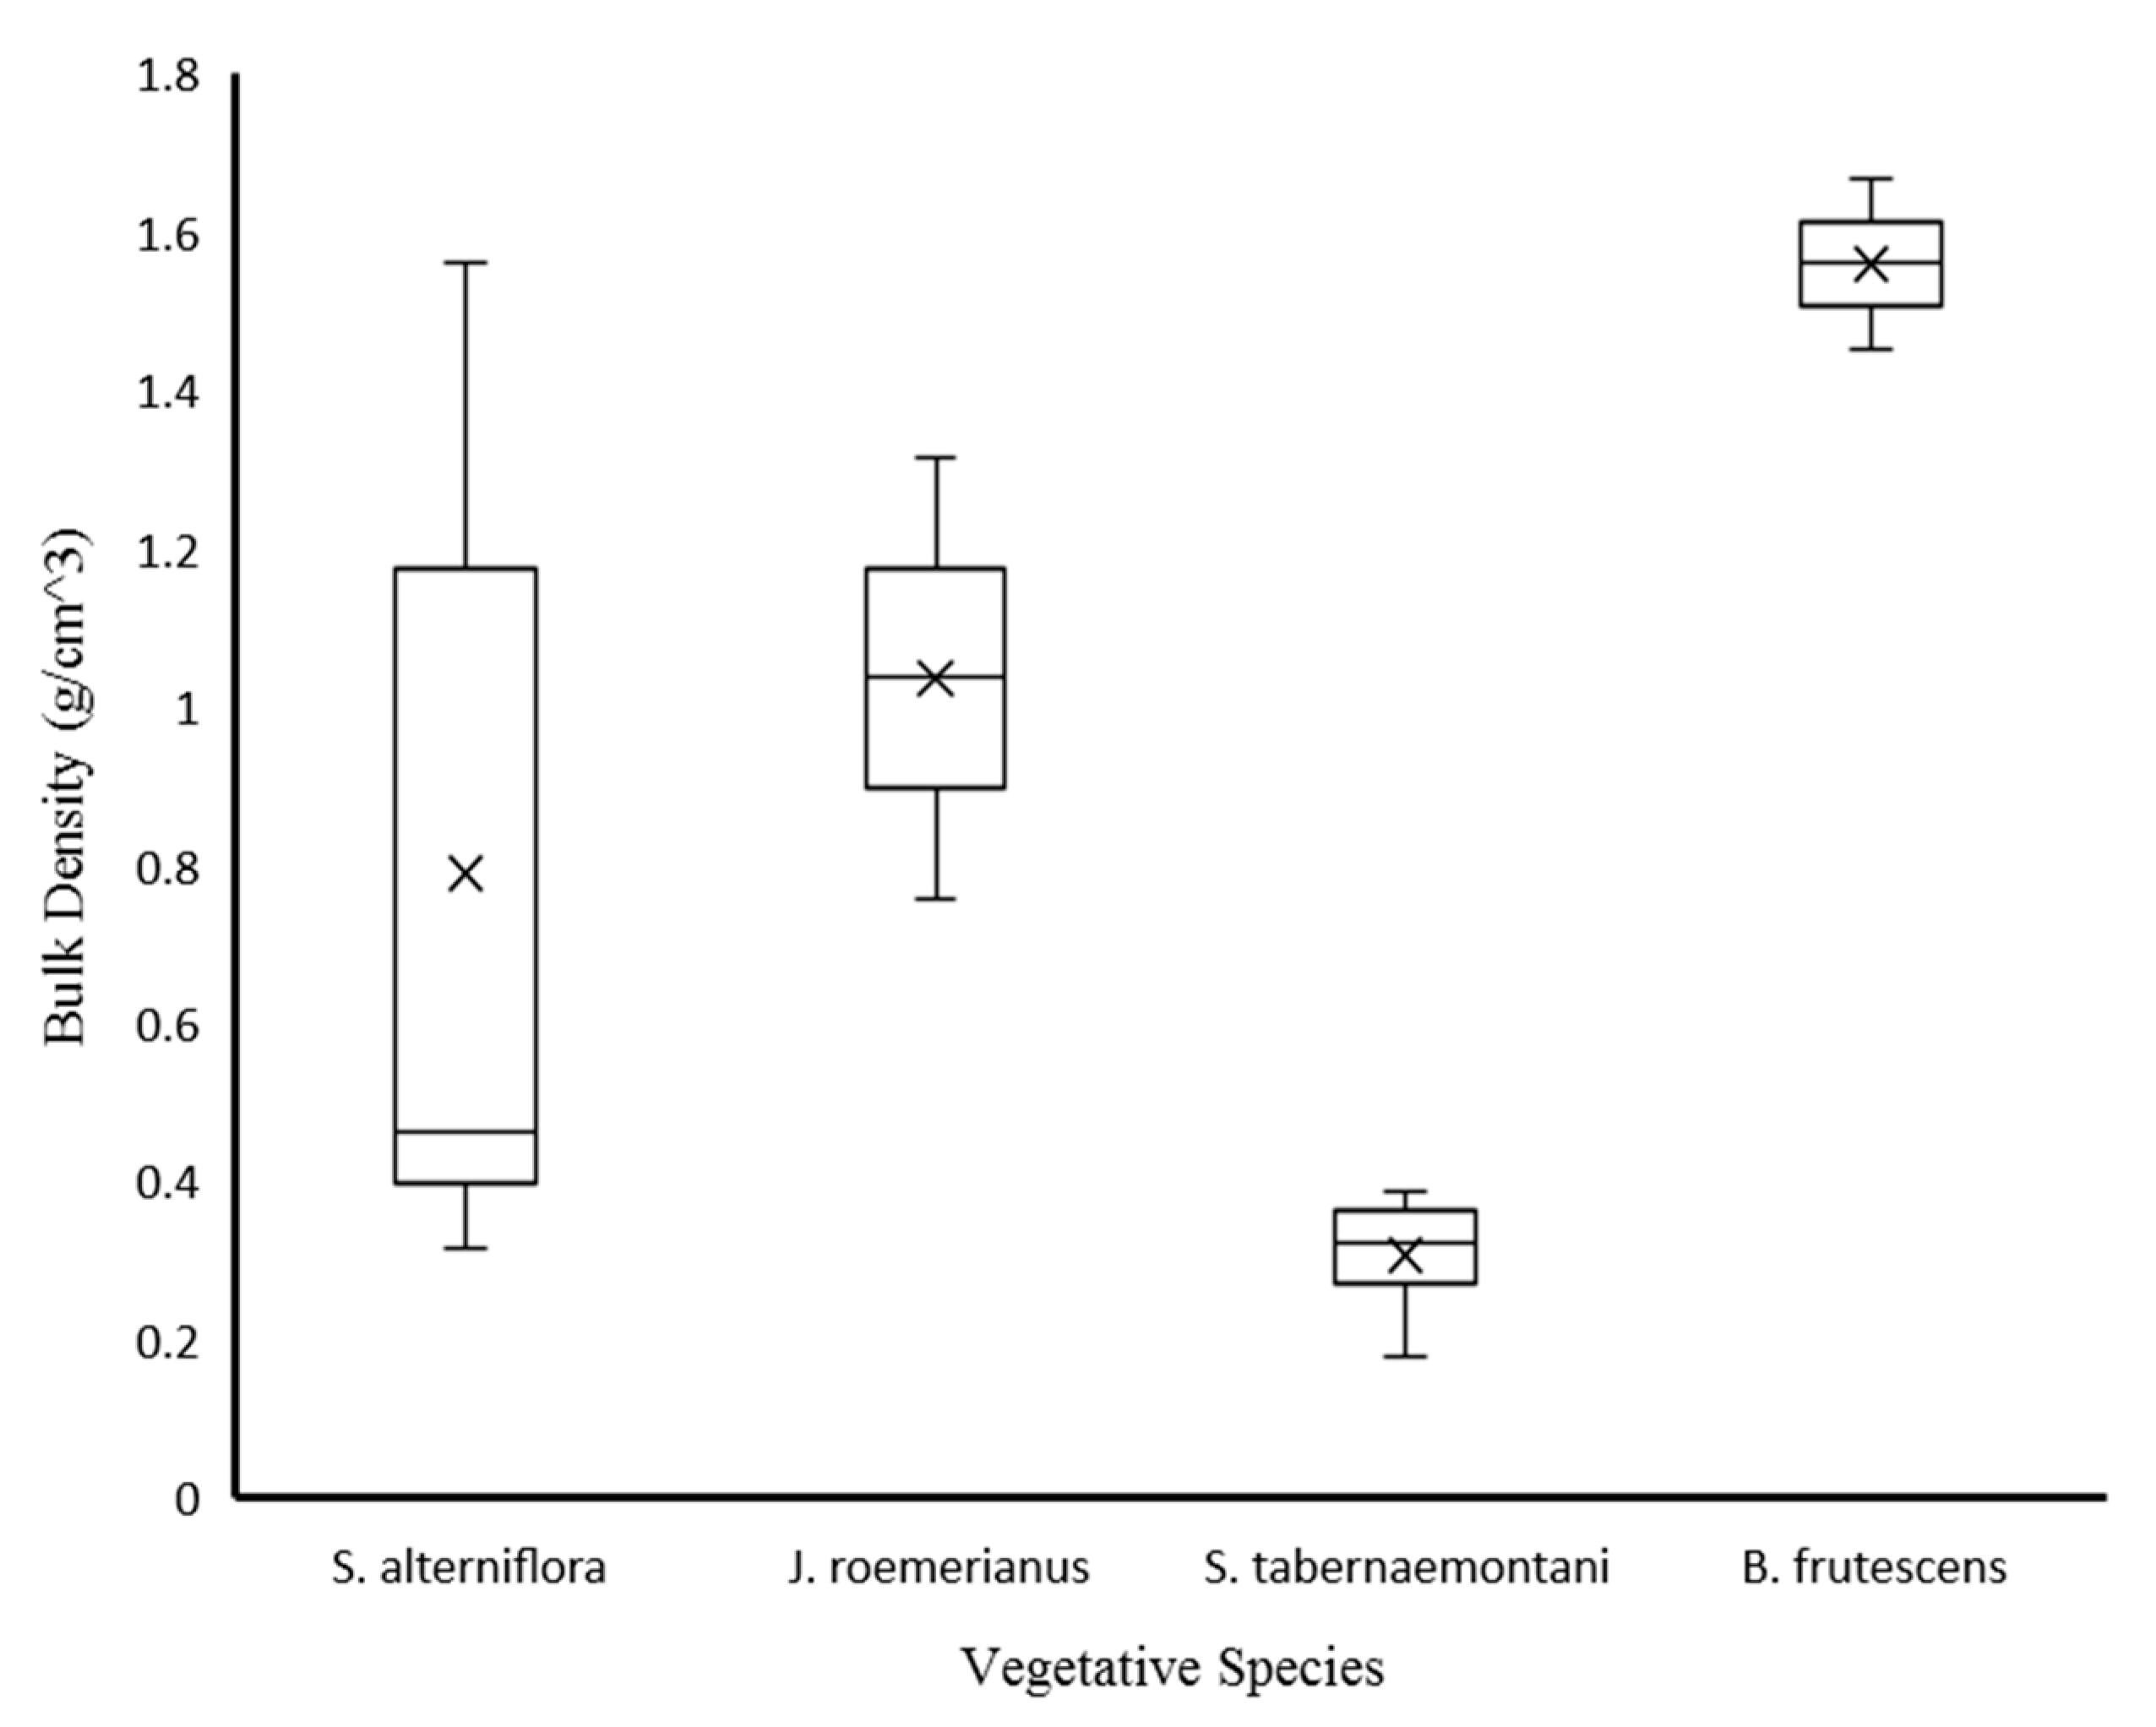
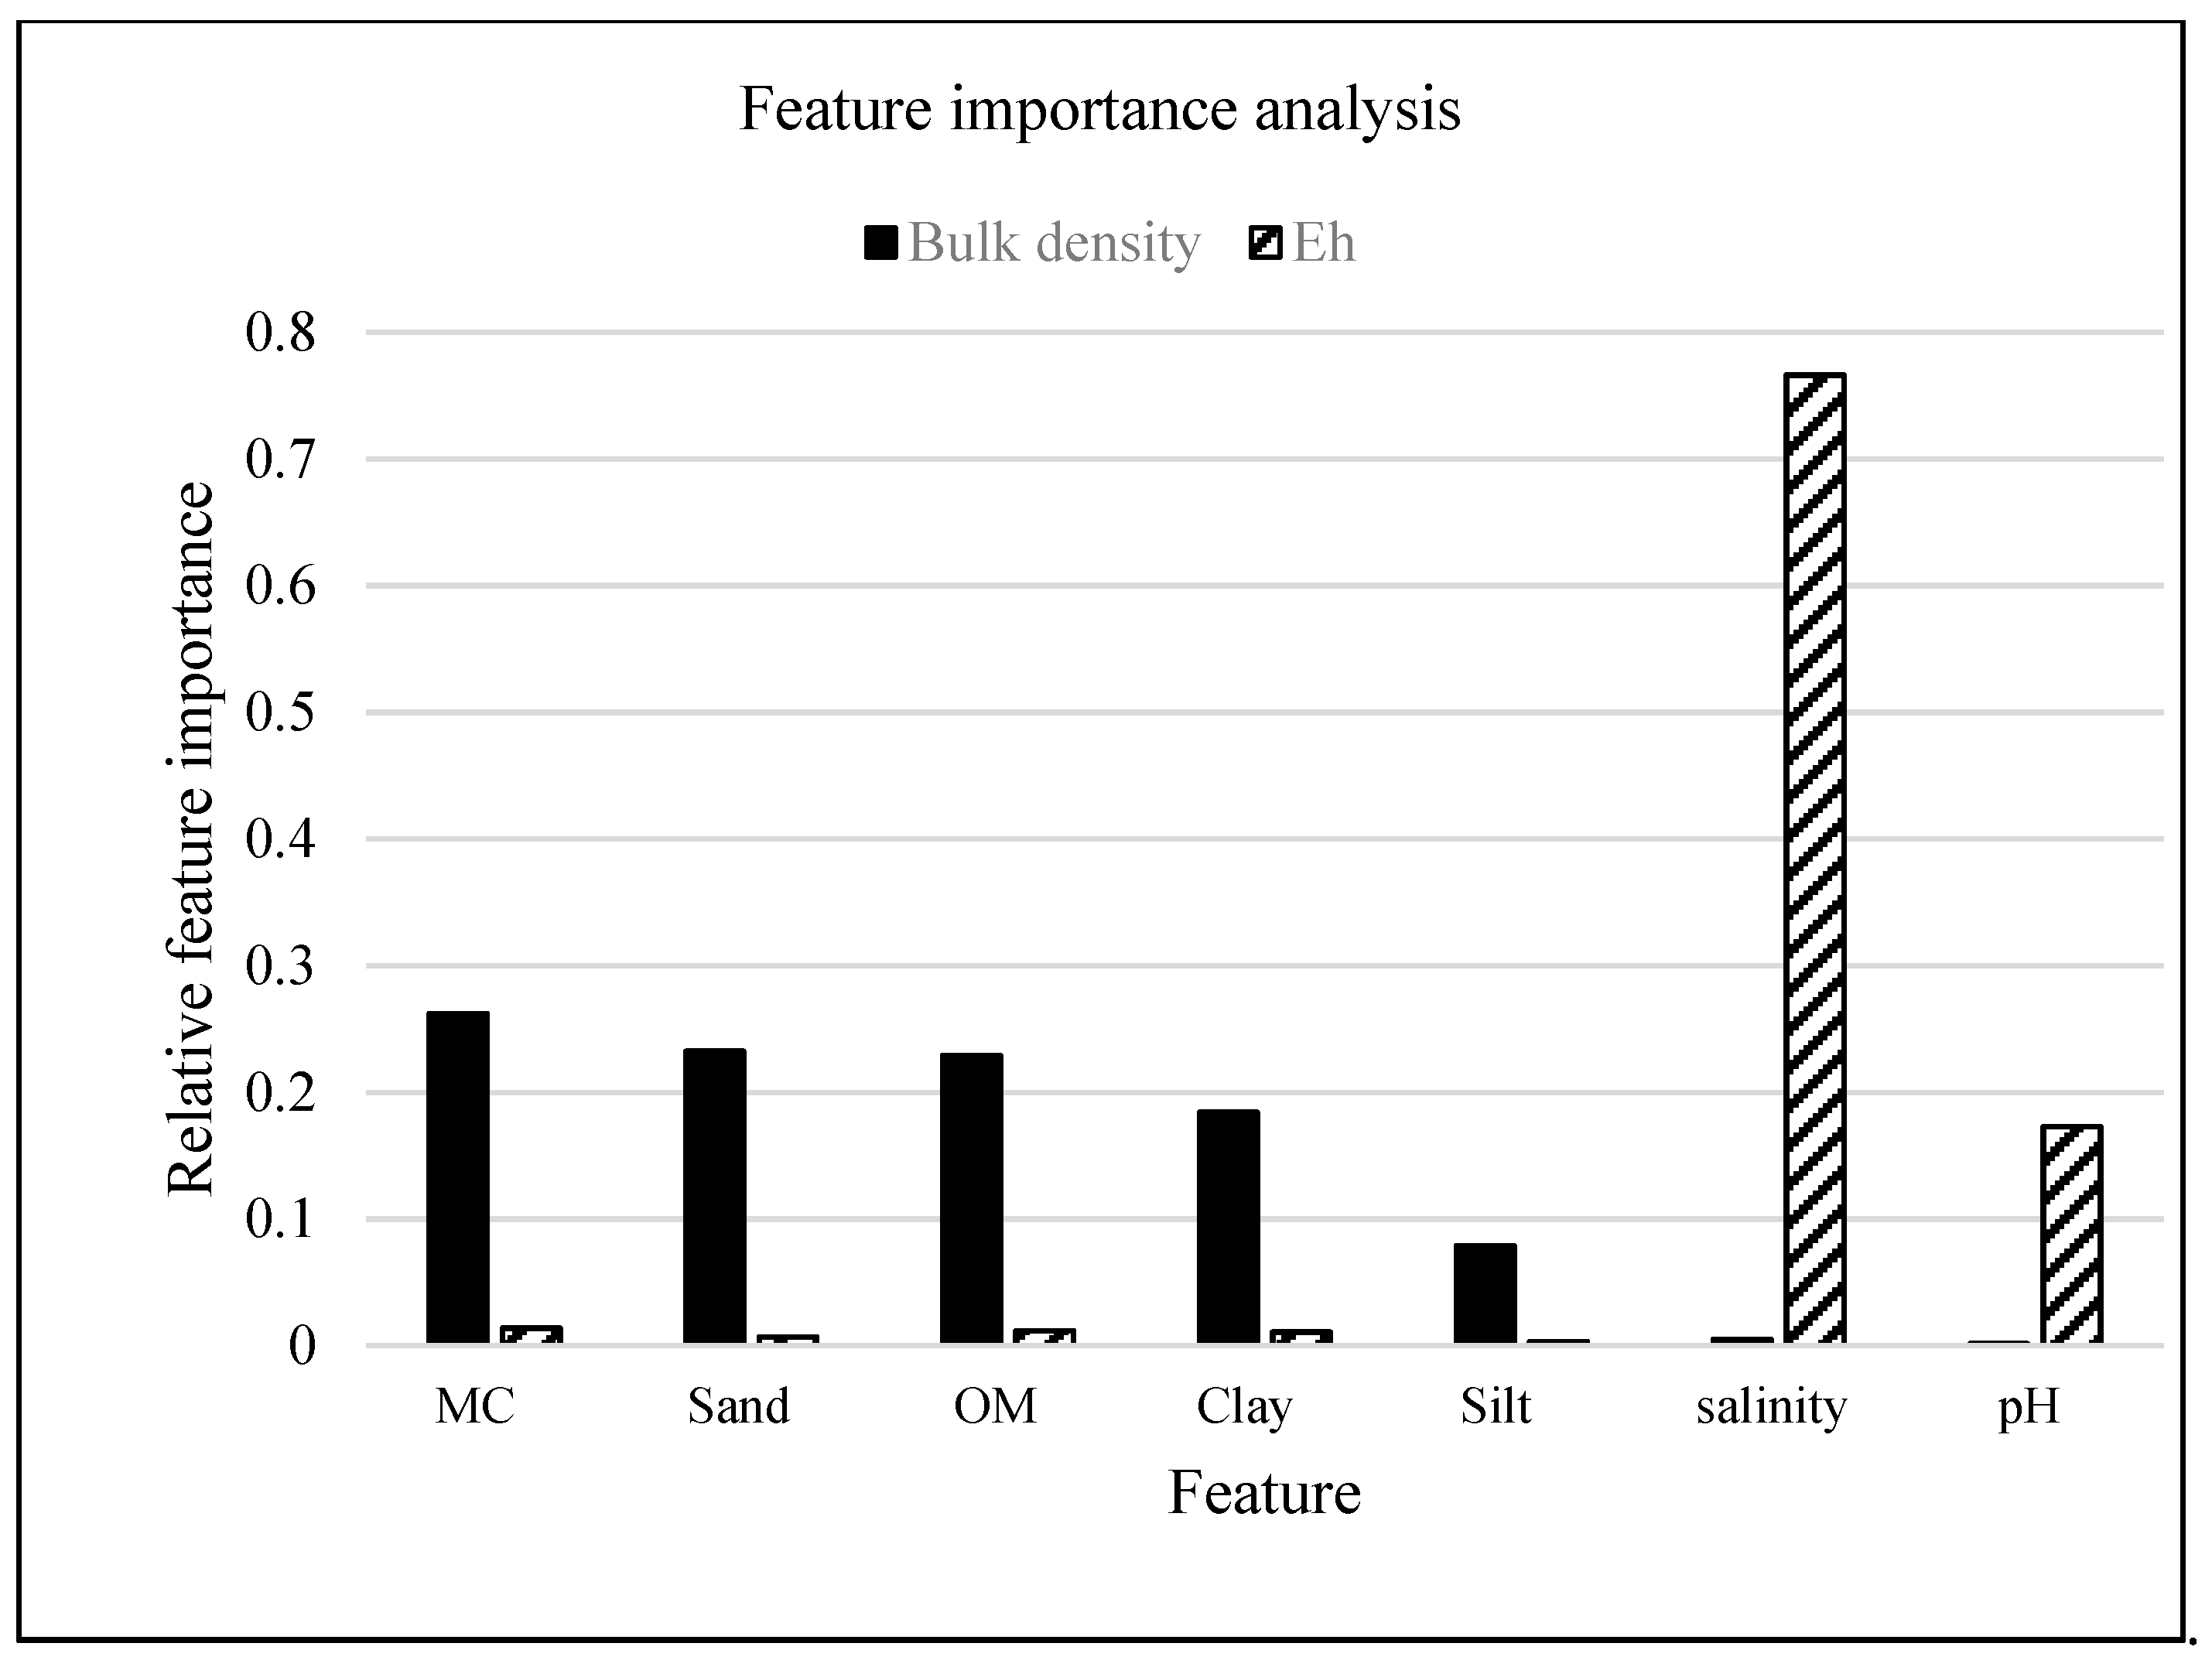
3.3. Relationship of Bulk Density and Organic Matter to Vegetation

Vegetation has clear differences in bulk density (BD) at each location, suggesting that the BD can influence vegetation patterns in saltmarshes (Figure 3). S. tabernaemontani grows in soils with a BD of 0.478 g cm−3, which is significantly lower than that of B. frutescens (p-value = 0.0001), J. roemerianus (p-value = 0.017), and S. alterniflora (p-value = 0.033) (Figure 3). Sites 3 and 7 show the highest average bulk density among all study sites and are dominated by J. roemerianus and B. frutescens, respectively (Figure 3). These two species appear to be capable of dominating high bulk density soils.
Bulk density influences water and gas movement within the soil [4], and because of this, saltmarsh plant productivity and growth rate are affected by this parameter. Bulk density at sites 3.B and 7.B surpass the bulk density thresholds for root penetration. Site 3.B (sandy loam) and 7.B (loamy sand) have bulk densities as 1.504 g/cm3 and 1.667 g/cm3, respectively, which restricts the vegetation growth at these two sites. Organic matter is an important factor influencing soil bulk density in tidal marshes. Of course, as organic matter decreases or as sand content increases, bulk density increases. Site 7 has the least average organic matter content, the highest bulk density, and the highest sand content. Therefore, it is inferred that bulk density is a function of percentage of mineral and organic matter in the soil substrate.

4. Discussion

The RF model indicates that Eh and salinity are the two most important parameters for halophyte classification (Figure 4). In other words, Eh and salinity are two contributing factors dictating the vegetation type and structure at a saltmarsh site. The RF classification model had accuracy (the number of correctly classified data instances over the total number of data instances) of 100%.
Further, the RF model suggests that moisture content and salinity are the most important parameters for predicting bulk density and Eh, respectively (Figure 5). The MSE and R2 for bulk density model are 0.037 and 0.849, respectively. Eh model has an MSE of 3339.231 and an R2 of 0.321.
The measured versus predicted values of bulk density and Eh models based on moisture content and salinity have strong correlations of 0.964 and 0.872, respectively (Figure 6 and Figure 7). The measured Eh of the samples varied from −12.1 to −373.5 mV with a tendency of underprediction (i.e., more negative) at the higher measured Eh (i.e., less negative) (Figure 6). The measured soil bulk density varied from 0.314 to 1.501 g/cm3, and the prediction of bulk density does not show a clear tendency of underprediction or overprediction (Figure 7). The slope from both regression analyses are nearly 1 (Figure 6 and Figure 7), suggesting that the prediction of the models is close to what was observed, and the p-values of both models are less than 0.05.
Knowing the relationship between vegetation and hydric soil attributes improves a saltmarsh restoration practice and leads to successful vegetation re-establishment. Saltmarshes adjacent to a construction site or exposed to future disturbances should be characterized in terms of the soil, interstitial water, and vegetative species prior to disturbance. When the targeted soil and interstitial water properties such as Eh, bulk density, and salinity are returned, the time required for re-establishing the vegetative cover after construction activity is likely to be reduced, and the density and vigor of natural vegetation in disturbed areas are likely to improve, thus leading restoration practitioners toward a stronger chance of favorable outcomes. Therefore, the results from this study can help to guide scientists and engineers toward successful restoration in disturbed tidal saltmarshes.

5. Conclusions

Understanding the relationship among halophytes, soil, and interstitial water parameters can optimize restoration designs and provide the target species with ideal growth conditions.
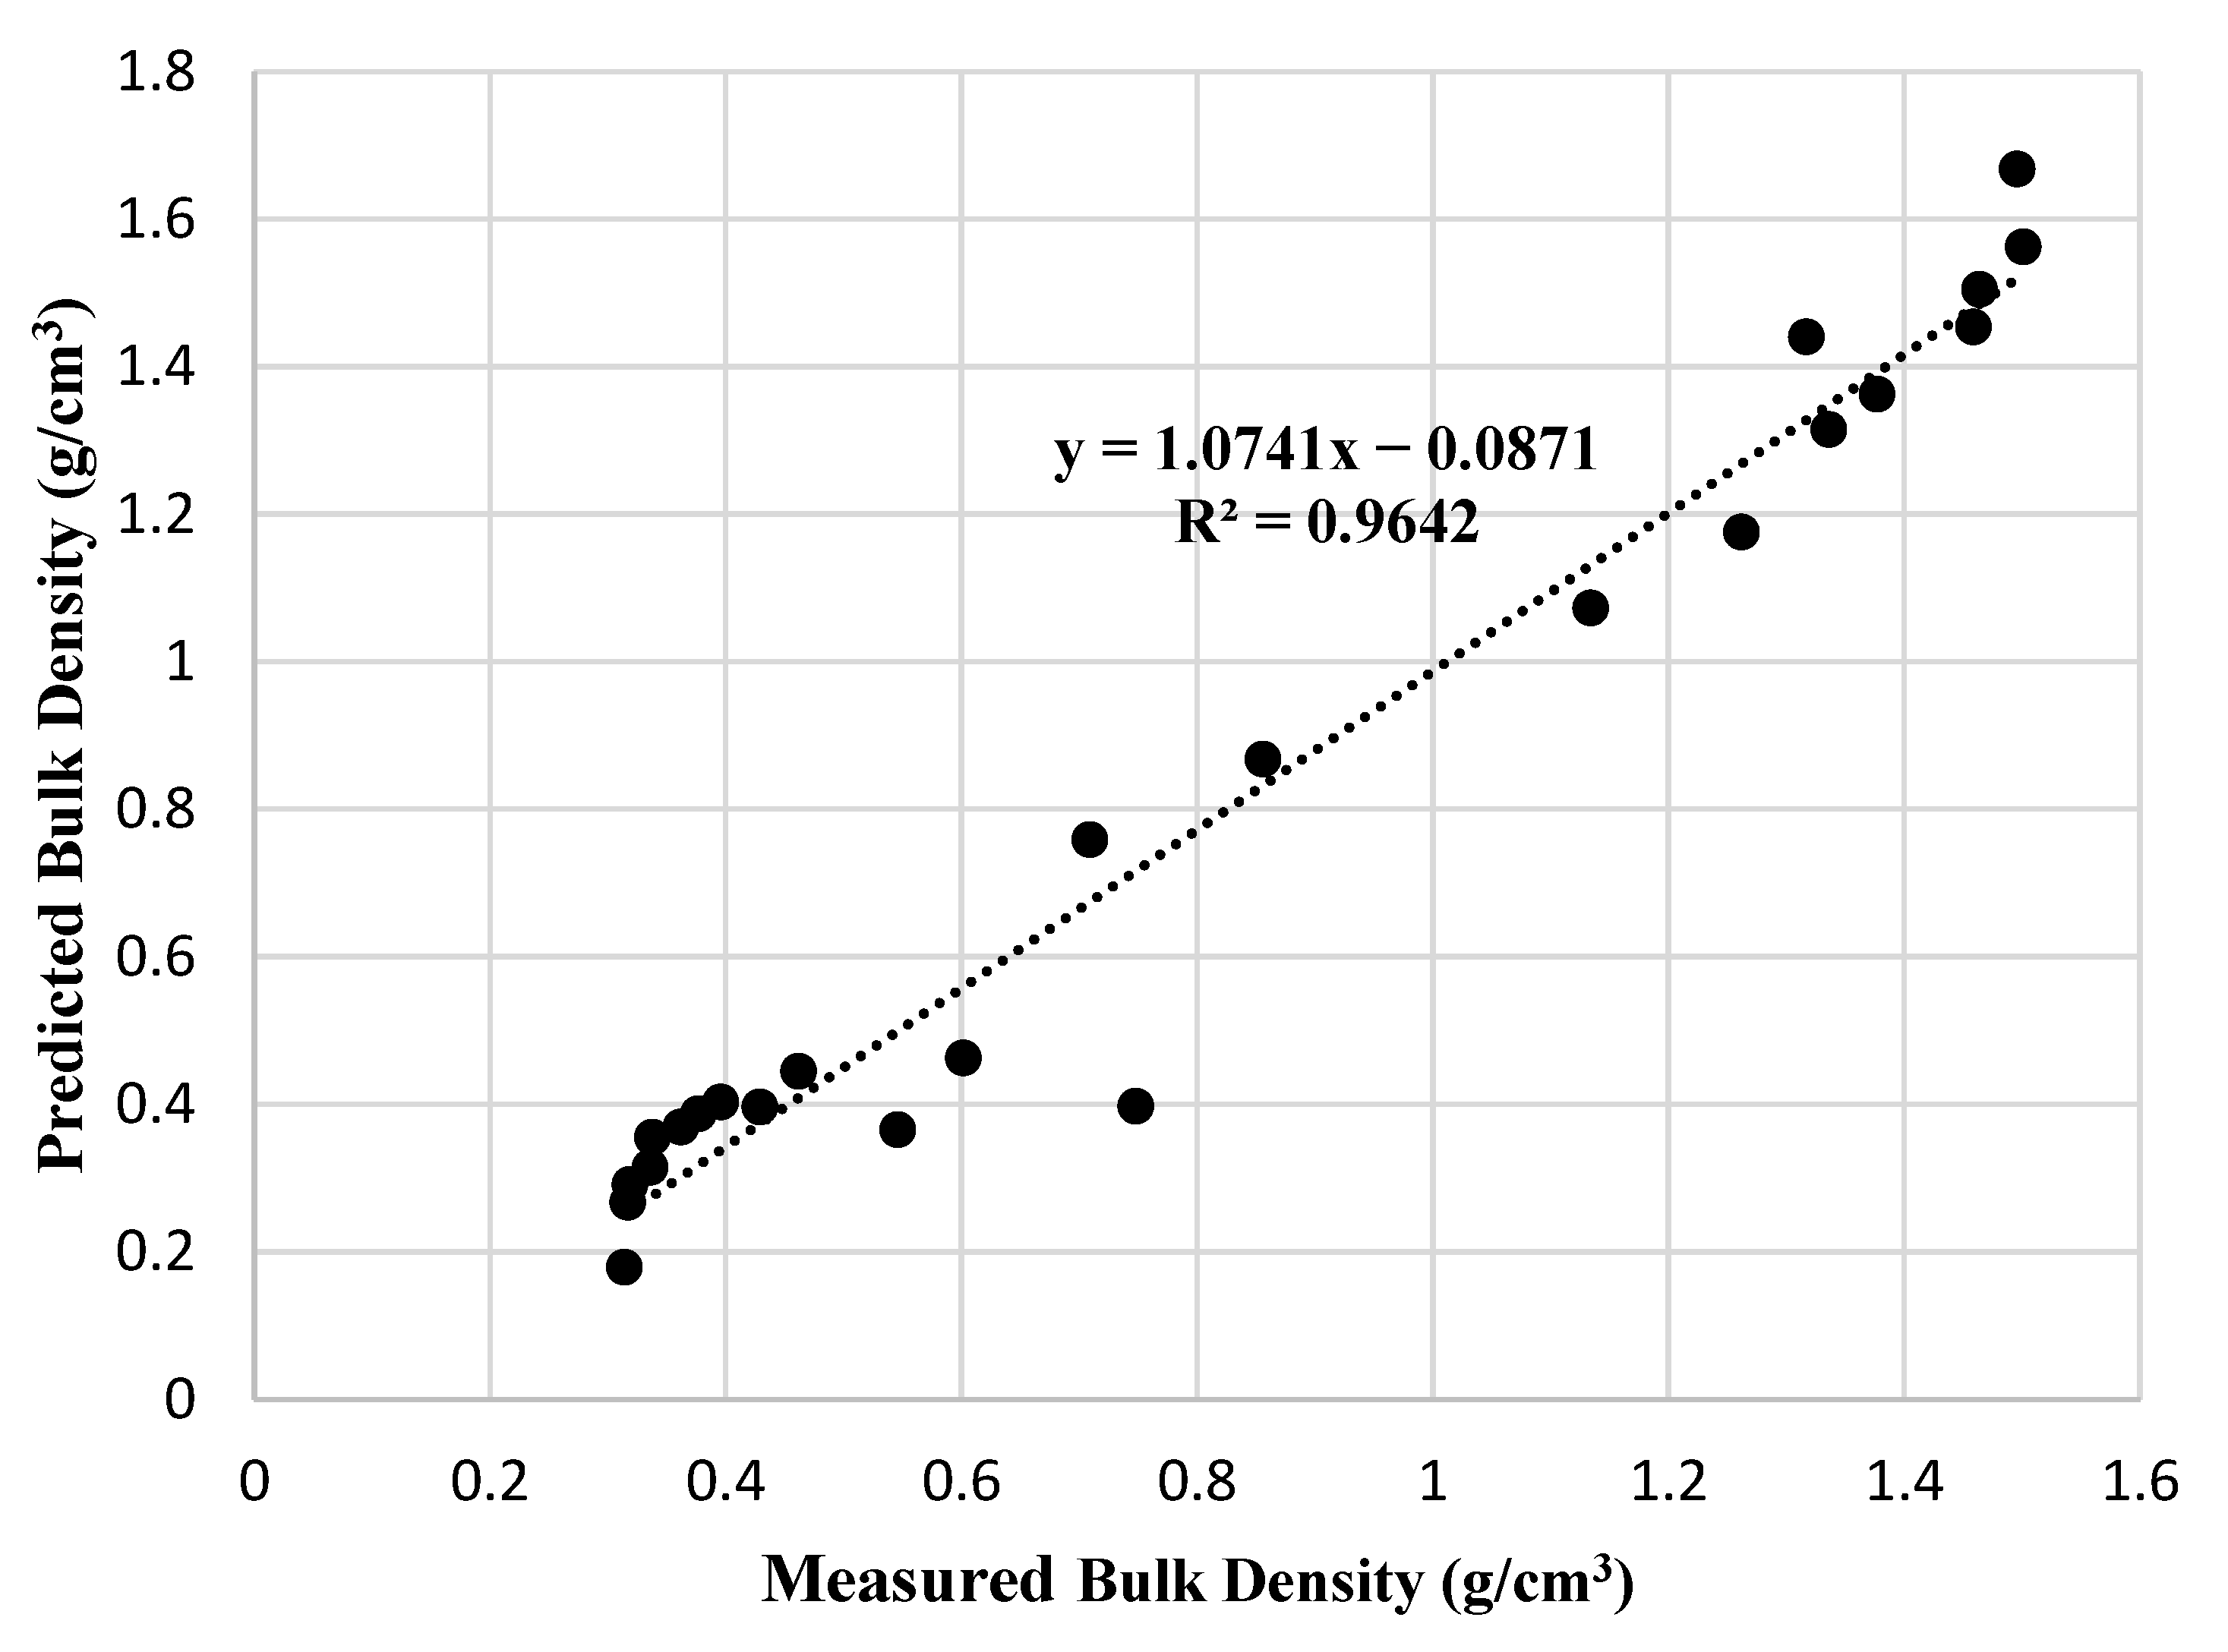
  • Mean bulk densities for sites supporting S. tabernaemontani and B. frutescens are 0.323 g/cm3 and 1.560 g/cm3, respectively. B. frutescens was able to establish and develop in soils that have a relatively high bulk density, up to 1.670 g/cm3, in comparison to the other vegetation, which is a result of high sand content or low organic matter content. B. frutescens was found in the highest average bulk density (around 1.560 g/cm3) and the lowest average organic matter content (i.e., 1.383 percent). We found that S. tabernaemontani grows in the soil with the lowest average bulk density (0.478 g/cm3) and the highest average organic matter content (13.83 percent) in comparison to the other vegetative species observed in this study.
  • With a 95% confidence, the salinity level of S. tabernaemontani is significantly different from that of B. frutescens and S. alterniflora. S. tabernaemontani has the lowest and S. alterniflora has the highest average salinities, which are 3.783 PSU and 27.873 PSU, respectively. High salinity inhibits S. tabernaemontani growth in coastal marshes, while the other studied species tend to be more salt tolerant. Vegetative species in costal marshes have different tolerances to salinity, and because of this, this tolerance is recommended to be considered for any restoration practice of disturbed salt marshes.
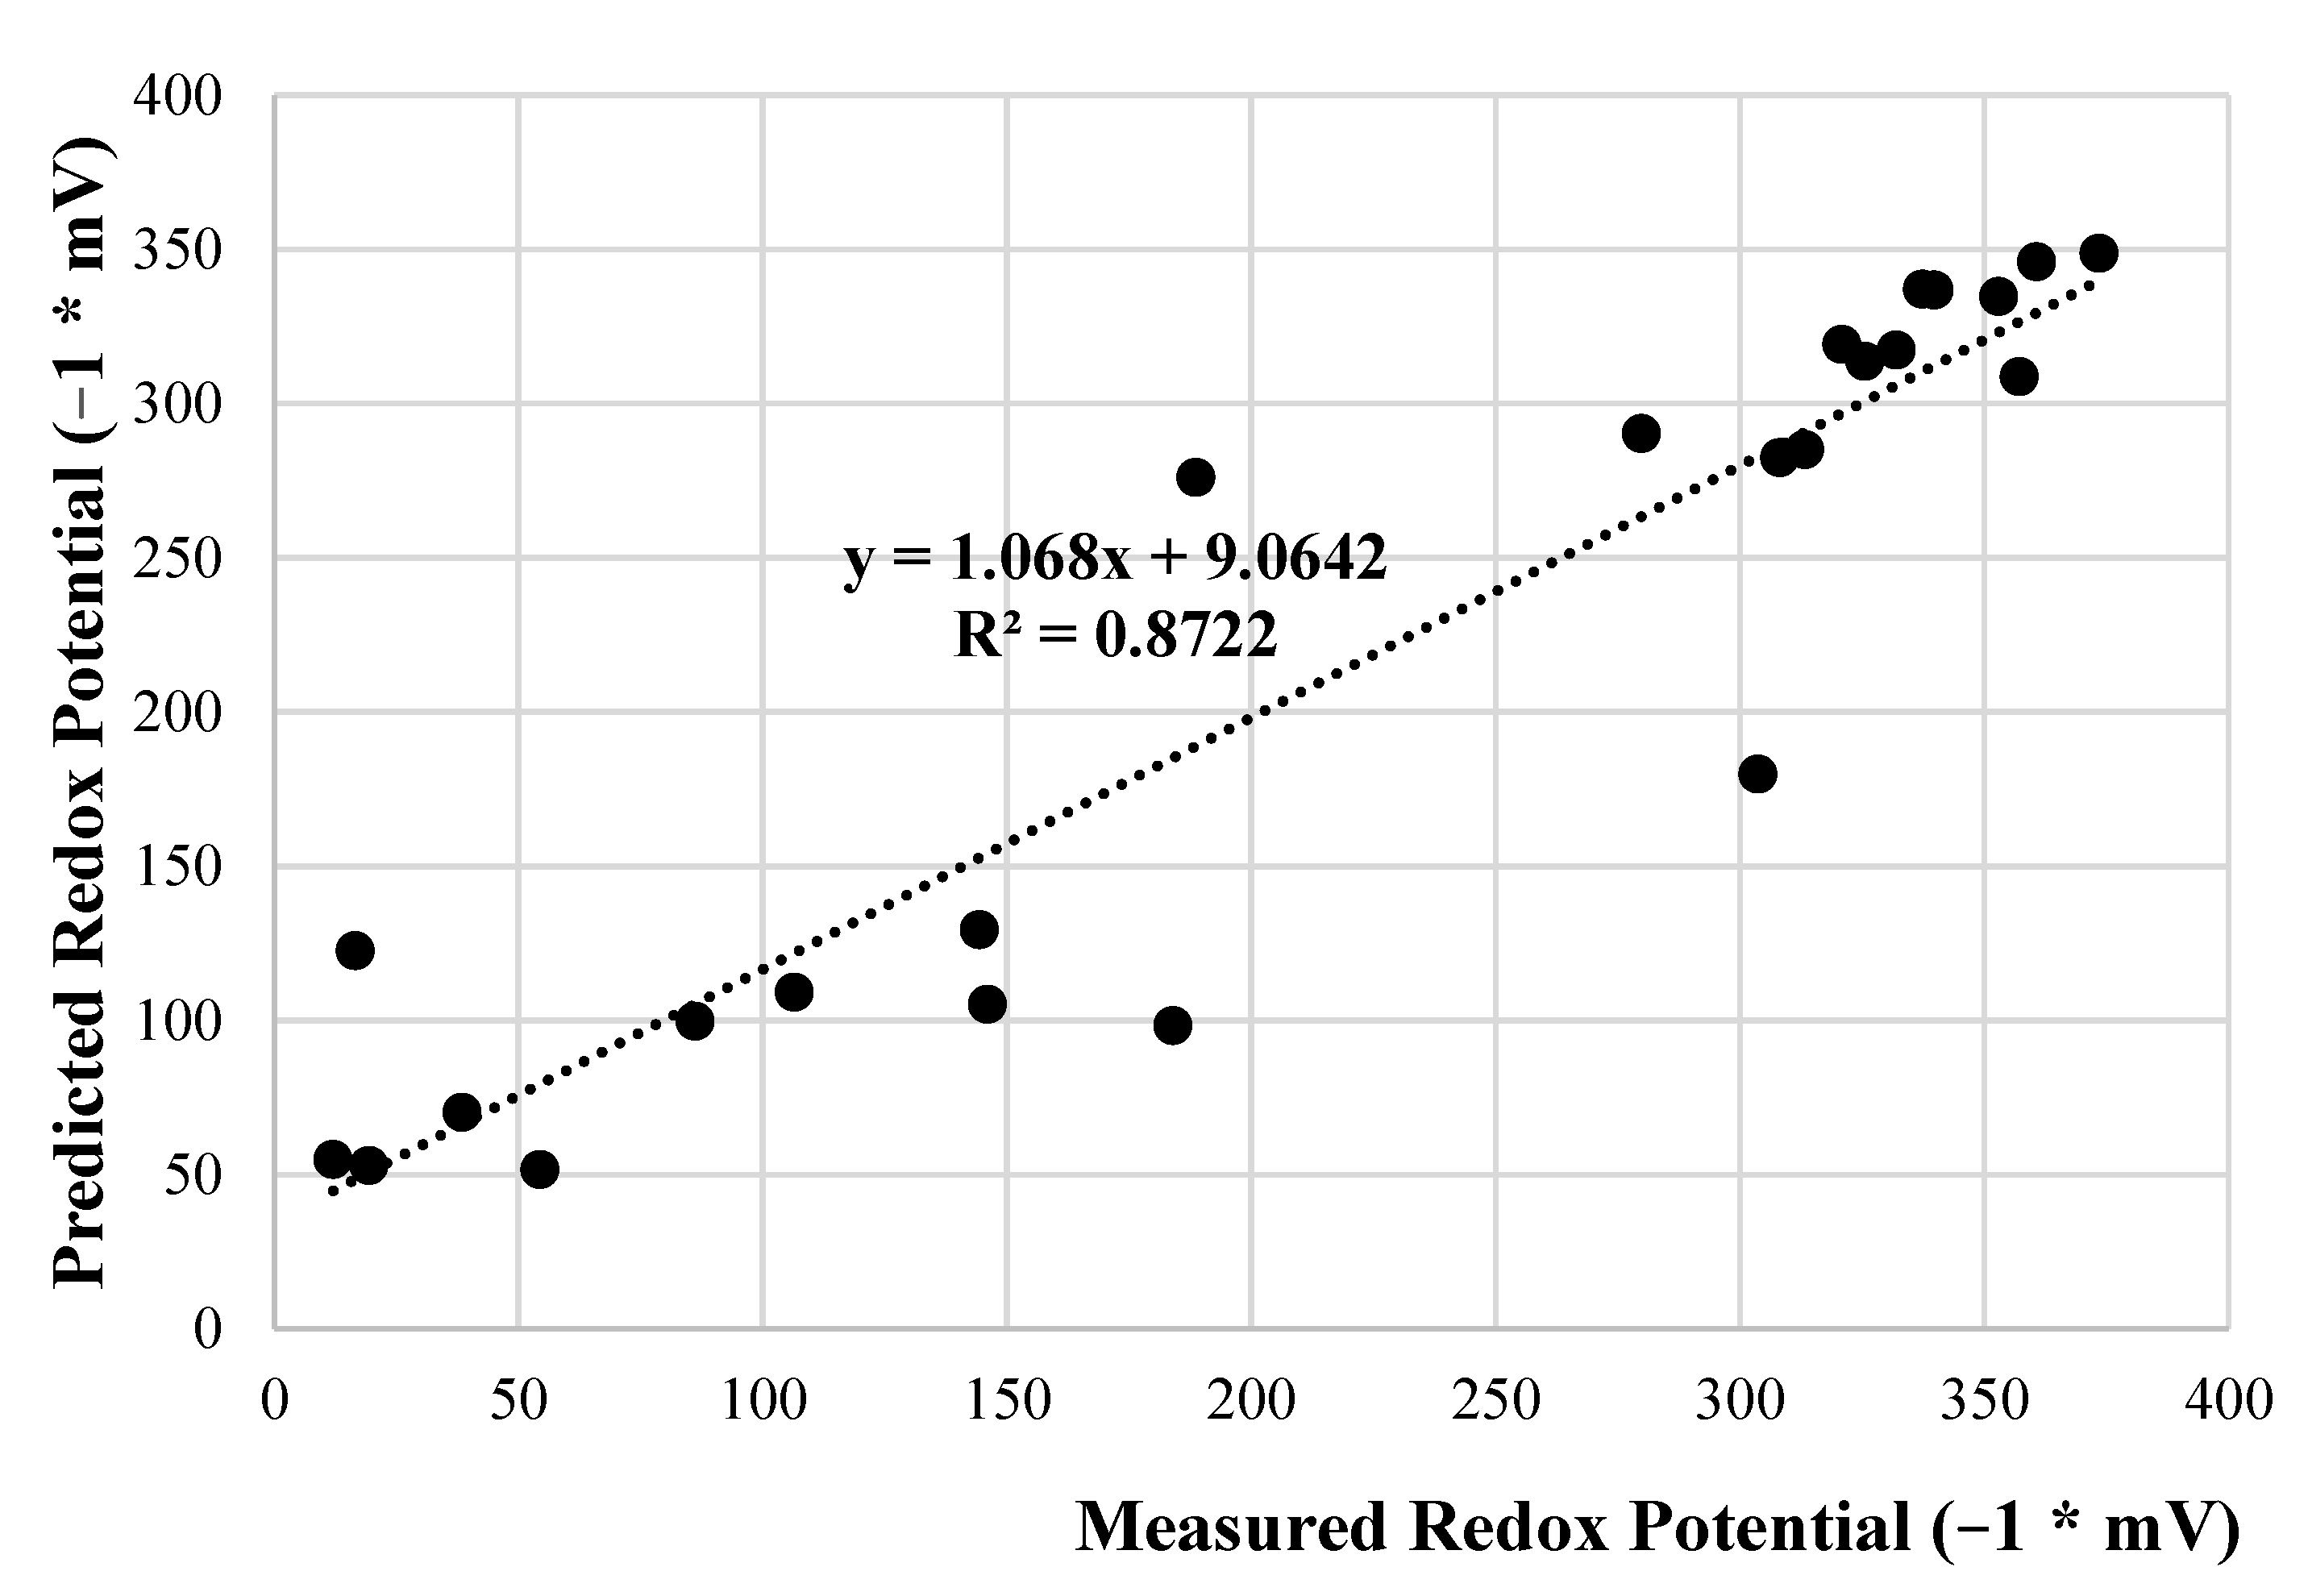
  • The results of random forest models indicate that the soil properties of saltmarshes are interrelated and influenced by interstitial water, and vegetative species. With the random forest models, the targeted soils/interstitial water properties such as redox potential (Eh), bulk density (BD), and salinity can be predicted with the estimated time required for re-establishing the vegetative cover after construction activity, which can be beneficial for the saltmarsh restoration.

Author Contributions

Conceptualization, J.C., S.A.D., and S.S.K.; methodology, J.C., S.A.D., J.J.Y., and S.S.K.; software, I.S.H.; investigation, I.S.H., J.C., S.A.D., J.J.Y., L.A.S., C.G.V., and S.S.K.; writing—original draft preparation, I.S.H., J.C., S.A.D., J.J.Y., L.A.S., C.G.V., and S.S.K.; writing—review and editing, I.S.H., J.C., S.A.D., J.J.Y., L.A.S., C.G.V., and S.S.K.; project administration, J.C. and S.S.K.; funding acquisition, J.C., S.A.D. and S.S.K. All authors have read and agreed to the published version of the manuscript.

Funding

The work presented in this paper is part of a research project (RP 17–11) sponsored by the Georgia Department of Transportation. The contents of this paper reflect the views of the authors, who are solely responsible for the facts and accuracy of the data, opinions, and conclusions presented herein. The contents may not reflect the views of the funding agency or other individuals.

Institutional Review Board Statement

Not applicable.

Informed Consent Statement

Not applicable.

Data Availability Statement

Not applicable.

Conflicts of Interest

The authors declare no conflict of interest.

References

  1. Nyman, J.A.; Walters, R.J.; Delaune, R.D.; Patrick, W.H. Marsh vertical accretion via vegetative growth. Estuar. Coast. Shelf Sci. 2006, 69, 370–380. [Google Scholar] [CrossRef]
  2. Roychoudhury, A.N. Spatial and seasonal variations in depth profile of trace metals in saltmarsh sediments from Sapelo Island, Georgia, USA. Estuarine Coast. Shelf Sci. 2007, 72, 675–689. [Google Scholar] [CrossRef]
  3. Craft, C. Freshwater input structures soil properties, vertical accretion, and nutrient accumulation of Georgia and U.S tidal marshes. Limnol. Oceanogr. 2007, 52, 1220–1230. [Google Scholar] [CrossRef]
  4. Bradley, P.; Morris, J. Physical characteristics of salt marsh sediments: Ecological implications. Mar. Ecol. Prog. Ser. 1990, 61, 245–252. [Google Scholar] [CrossRef]
  5. Sun, C.; Fagherazzi, S.; Liu, Y. Classification mapping of salt marsh vegetation by flexible monthly NDVI time-series using Landsat imagery. Estuar. Coast. Shelf Sci. 2018, 213, 61–80. [Google Scholar] [CrossRef]
  6. Cintrón-Molero, G.; Schaeffer-Novelli, Y. Ecology and management of New World mangroves. In Coastal Plant Communities of Latin America; Elsevier: Amsterdam, The Netherlands, 1992; pp. 233–258. [Google Scholar]
  7. Callaway, J.C.; Zedler, J.B. Restoration of urban salt marshes: Lessons from southern California. Urban Ecosyst. 2004, 7, 107–124. [Google Scholar] [CrossRef]
  8. Ballantine, K.; Schneider, R.; Groffman, P.; Lehmann, J. Soil properties and vegetative development in four restored freshwater depressional wetlands. Soil Sci. Soc. Am. J. 2012, 76, 1482–1495. [Google Scholar] [CrossRef] [Green Version]
  9. Huff, T.P.; Feagin, R.A. Hydrological Barrier as a Cause of Salt Marsh Loss. J. Coast. Res. 2017, 77, 88–96. [Google Scholar] [CrossRef]
  10. Rogers, K.; Wilton, K.; Saintilan, N. Vegetation change and surface elevation dynamics in estuarine wetlands of southeast Australia. Estuar. Coast. Shelf Sci. 2006, 66, 559–569. [Google Scholar] [CrossRef]
  11. DeLaune, R.D.; Reddy, K.R. Biogeochemistry of Wetlands: Science and Applications; CRC Press: Boca Raton, FL, USA, 2008. [Google Scholar]
  12. Portnoy, J.; Giblin, A. Effects of historic tidal restrictions on salt marsh sediment chemistry. Biogeochemistry 1997, 36, 275–303. [Google Scholar] [CrossRef]
  13. Rogel, J.A.; Ariza, F.A.; Silla, R.O. Soil salinity and moisture gradients and plant zonation in Mediterranean salt marshes of Southeast Spain. Wetlands 2000, 20, 357–372. [Google Scholar] [CrossRef]
  14. Tempest, J.A.; Harvey, G.L.; Spencer, K.L. Modified sediments and subsurface hydrology in natural and recreated salt marshes and implications for delivery of ecosystem services. Hydrol. Process. 2015, 29, 2346–2357. [Google Scholar] [CrossRef]
  15. Roman, C.T.; Niering, W.A.; Warren, R.S. Salt marsh vegetation change in response to tidal restriction. Environ. Manag. 1984, 8, 141–149. [Google Scholar] [CrossRef]
  16. Christian, J.; Kim, S.; Durham, S.A.; Sutter, L.; Hikouei, I.S.; House, K. Best Management Practices for Post-Construction Restoration of Rights-of-Way in Saltwater Marshes, Estuaries, and Other Tidally Influenced Areas; Georgia Department of Transportation: Atlanta, GA, USA, 2020.
  17. Alber, M.; Swenson, E.M.; Adamowicz, S.C.; Mendelssohn, I.A. Salt Marsh Dieback: An overview of recent events in the US. Estuarine, Coast. Shelf Sci. 2008, 80, 1–11. [Google Scholar] [CrossRef]
  18. Ogburn, M.B.; Alber, M. An investigation of salt marsh dieback in Georgia using field transplants. Chesap. Sci. 2006, 29, 54–62. [Google Scholar] [CrossRef]
  19. Lindstedt, D.M.; Swenson, E.M. The Case of the Dying Marsh Grass; Louisiana Department of Natural Resources: Baton Rouge, LA, USA, 2006.
  20. Mendelssohn, I.A.; McKee, K.L. Spartina alterniflora die-back in Louisiana: Time-course investigation of soil waterlogging effects. J. Ecol. 1988, 76, 509–521. [Google Scholar] [CrossRef]
  21. Goodman, P.; Braybrooks, E.; Lambert, J.M. Investigations intoDie-Back in Spartina Townsendii AGG.: I. The Present Status of Spartina Townsendii in Britain. J. Ecol. 1959, 47, 651–677. [Google Scholar] [CrossRef]
  22. Crawford, J.T.; Stone, A.G. Relationships between soil composition and Spartina alterniflora dieback in an Atlantic salt marsh. Wetlands 2015, 35, 13–20. [Google Scholar] [CrossRef]
  23. Edwards, J.; Frey, R. Substrate characteristics within a Holocene salt marsh, Sapelo Island, Georgia. Senckenbergiana Marit. 1977, 9, 215–259. [Google Scholar]
  24. Hinkle, R.L.; Mitsch, W.J. Salt marsh vegetation recovery at salt hay farm wetland restoration sites on Delaware Bay. Ecol. Eng. 2005, 25, 240–251. [Google Scholar] [CrossRef]
  25. Anastasiou, C.J.; Brooks, J.R. Effects of soil PH, redox potential, and elevation on survival of Spartina patens planted at a west Central Florida salt marsh restoration site. Wetlands 2003, 23, 845–859. [Google Scholar] [CrossRef]
  26. Warren, R.S.; Fell, P.E.; Rozsa, R.; Brawley, A.H.; Orsted, A.C.; Olson, E.T.; Swamy, V.; Niering, W.A. Salt Marsh Restoration in Connecticut: 20 Years of Science and Management. Restor. Ecol. 2002, 10, 497–513. [Google Scholar] [CrossRef] [Green Version]
  27. Gu, J.; Luo, M.; Zhang, X.; Christakos, G.; Agusti, S.; Duarte, C.M.; Wu, J. Losses of salt marsh in China: Trends, threats and management. Estuarine, Coast. Shelf Sci. 2018, 214, 98–109. [Google Scholar] [CrossRef] [Green Version]
  28. Broome, S.W.; Seneca, E.D.; Woodhouse, W.W. Tidal salt marsh restoration. Aquat. Bot. 1988, 32, 1–22. [Google Scholar] [CrossRef]
  29. Adam, P. Salt marsh restoration. Coastal Wetlands: An Integrated Ecosystem Approach, 2nd ed.; Elsevier: Amsterdam, The Netherlands, 2019; pp. 817–861. [Google Scholar]
  30. Sutton-Grier, A.E.; Ho, M.; Richardson, C.J. Organic amendments improve soil conditions and denitrification in a restored riparian wetland. Wetlands 2009, 29, 343–352. [Google Scholar] [CrossRef]
  31. Flaig, W. Soil Organic Matter as a Source of Nutrients; IRRI: Los Baños, Philippines, 1984; pp. 73–92. [Google Scholar]
  32. Rabenhorst, M. Soils of Tidal and Fringing Wetlands. In Wetland Soils; Apple Academic Press: Palm Bay, FL, USA, 2000; pp. 301–315. [Google Scholar]
  33. McKenzie, N.; Jacquier, D.; Isbell, R.; Brown, K. Australian Soils and Landscapes; CSIRO Publishing: Clayton, Australia, 2004. [Google Scholar]
  34. Daddow, R.L.; Warrington, G.E. Growth-Limiting Soil Bulk Densities as Influenced by Soil Texture; U.S. Department of Agriculture, Forest Service: Fort Collins, CO, USA, 1983.
  35. Arshad, M.; Lowery, B.; Grossman, B. Physical tests for monitoring soil quality. Methods Assess. Soil Qual. 1997, 49, 123–141. [Google Scholar]
  36. Barbosa, L.C.; de Souza, Z.M.; Franco, H.C.J.; Otto, R.; Rossi Neto, J.; Garside, A.L.; Nunes Carvalho, J.L. Soil texture affects root penetration in Oxisols under sugarcane in Brazil. Geoderma Reg. 2018, 13, 15–25. [Google Scholar] [CrossRef]
  37. Asady, G.; Smucker, A. Compaction and root modifications of soil aeration. Soil Sci. Soc. Am. J. 1989, 53, 251–254. [Google Scholar] [CrossRef]
  38. Nyman, J.; Delaune, R.; Roberts, H.; Patrick, W. Relationship between vegetation and soil formation in a rapidly submerging coastal marsh. Mar. Ecol. Prog. Ser. 1993, 96, 269–279. [Google Scholar] [CrossRef]
  39. O’Brien, E.L.; Zedler, J.B. Accelerating the Restoration of Vegetation in a Southern California Salt Marsh. Wetl. Ecol. Manag. 2006, 14, 269–286. [Google Scholar] [CrossRef]
  40. Stirzaker, R.J.; Passioura, J.B.; Wilms, Y. Soil structure and plant growth: Impact of bulk density and biopores. Plant Soil 1996, 185, 151–162. [Google Scholar] [CrossRef]
  41. Périé, C.; Ouimet, R. Organic carbon, organic matter and bulk density relationships in boreal forest soils. Can. J. Soil Sci. 2008, 88, 315–325. [Google Scholar] [CrossRef]
  42. Morris, J.T.; Barber, D.C.; Callaway, J.C.; Chambers, R.; Hagen, S.C.; Hopkinson, C.S.; Johnson, B.J.; Megonigal, P.; Neubauer, S.C.; Troxler, T.; et al. Contributions of organic and inorganic matter to sediment volume and accretion in tidal wetlands at steady state. Earth’s Futur. 2016, 4, 110–121. [Google Scholar] [CrossRef] [PubMed] [Green Version]
  43. Mendelssohn, I.A.; McKee, K.L.; Patrick, W.H., Jr. Oxygen deficiency in Spartina alterniflora roots: Metabolic adaptation to anoxia. Science 1981, 214, 439–441. [Google Scholar] [CrossRef] [PubMed]
  44. White, S.N. Spartina Species Zonation along an Estuarine Gradient in Georgia: Exploring Mechanisms Controlling Distribution. Ph.D. Thesis, University of Georgia, Athens, GA, USA, 2004. [Google Scholar]
  45. Maricle, B.R.; Lee, R.W. Aerenchyma development and oxygen transport in the estuarine cordgrasses Spartina alterniflora and S. anglica. Aquat. Bot. 2002, 74, 109–120. [Google Scholar] [CrossRef]
  46. Waisel, Y. Biology of Halophytes; Elsevier: Amsterdam, The Netherlands, 2012. [Google Scholar]
  47. Adams, D.A. Factors influencing vascular plant zonation in North Carolina salt marshes. Ecology 1963, 44, 445–456. [Google Scholar] [CrossRef]
  48. Antlfinger, A.E.; Dunn, E. Seasonal patterns of CO2 and water vapor exchange of three salt marsh succulents. Oecologia 1979, 43, 249–260. [Google Scholar] [CrossRef] [PubMed]
  49. Blake, G. Bulk density. In Methods of Soil Analysis: Part 1 Physical and Mineralogical Properties, Including Statistics of Measurement and Sampling 9; American Society of Agronomy, Inc.: Madison, WI, USA, 1965; pp. 374–390. [Google Scholar]
  50. Cleveland, D.; Brumbaugh, W.G.; Macdonald, D.D. A comparison of four porewater sampling methods for metal mixtures and dissolved organic carbon and the implications for sediment toxicity evaluations. Environ. Toxicol. Chem. 2017, 36, 2906–2915. [Google Scholar] [CrossRef] [PubMed]
  51. Hobley, E.; Wilson, B.; Wilkie, A.; Gray, J.; Koen, T. Drivers of soil organic carbon storage and vertical distribution in Eastern Australia. Plant Soil 2015, 390, 111–127. [Google Scholar] [CrossRef]
  52. Hobley, E.U.; Wilson, B. The depth distribution of organic carbon in the soils of eastern Australia. Ecosphere 2016, 7, e01214. [Google Scholar] [CrossRef] [Green Version]
  53. Taghizadeh-Mehrjardi, R.; Neupane, R.; Sood, K.; Kumar, S. Artificial bee colony feature selection algorithm combined with machine learning algorithms to predict vertical and lateral distribution of soil organic matter in South Dakota, USA. Carbon Manag. 2017, 8, 277–291. [Google Scholar] [CrossRef]
  54. Salehi Hikouei, I.; Kin, S.S.; Sutter, L.; Christian, J.; Durham, S.; Yang, J. Machine Learning Approach to Identify the Relationship Between Heavy Metals and Soil Parameters in Salt Marshes. Int. J. Environ. Sci. Nat. Resour. 2021, 27. [Google Scholar] [CrossRef]
  55. Craft, C.B.; Broome, S.W.; Seneca, E.D. Nitrogen, Phosphorus and Organic Carbon Pools in Natural and Transplanted Marsh Soils. Estuaries 1988, 11, 272–280. [Google Scholar] [CrossRef]
Figure 1. Salt marshes along the coast by Georgia (USA), selected to evaluate vegetation and interstitial soil properties.
Infrastructures 06 00070 g001
Figure 2. Grain-size analysis of salt marsh soils across eight Georgia sites using sieve and hydrometer methods.
Infrastructures 06 00070 g002
Figure 3. Bulk density values of four dominant in saltmarshes along the coast of Georgia (USA).
Infrastructures 06 00070 g003
Figure 4. The parameters importance in halophyte classification by random forest.
Infrastructures 06 00070 g004
Figure 5. The parameter importance for predicting bulk density and redox potential (Eh) by random forest.
Infrastructures 06 00070 g005
Figure 6. Predicted vs. measured redox potential.
Infrastructures 06 00070 g006
Figure 7. Predicted vs. measured bulk density.
Infrastructures 06 00070 g007
Table 1. Soil properties found at each of 8 sites (in 3 vegetation zones at each site) adjacent to construction projects along the Georgia coast.
SiteLatitudeLongitudeOMMCBDClaySiltSandTexture
%%g/cm3%%%
1.A32.03−80.932.4435.971.4416.1734.7549.08Loam
1.B32.03−80.937.22201.720.4035.2527.2837.47Clay loam
1.C32.03−80.9310.57225.000.4014.9625.1359.91Sandy loam
2.A32.01−80.891.4648.141.1812.107.1980.72Sandy loam
2.B32.01−80.893.5977.950.8723.0622.3254.62Sandy clay loam
2.C32.01−80.895.99181.320.4447.0945.567.35Silty clay
3.A32.06−81.023.7390.650.7644.5729.2826.15Clay
3.B32.06−81.020.2425.111.5017.0211.1871.80Sandy loam
3.C32.06−81.020.5438.201.3117.2211.3271.46Sandy loam
4.A32.17−81.1623.85428.170.1822.6870.656.67Silt loam
4.B32.17−81.1619.54278.870.2756.4637.106.44Clay
4.C32.17−81.1628.88309.000.2928.2754.5217.21Silty clay loam
5.A31.36−81.448.02227.010.3938.9033.1527.95Clay loam
5.B31.36−81.447.76215.310.3759.3534.086.57Clay
5.C31.36−81.448.54254.170.3555.1539.994.86Clay
6.A31.16−81.450.8963.821.0716.5222.0161.47Sandy loam
6.B31.16−81.457.80338.300.3122.6872.524.80Silty loam
6.C31.16−81.455.66261.390.3719.6173.117.28Silt loam
7.A31.17−81.421.4724.601.567.5213.1279.36Loamy sand
7.B31.17−81.421.5923.081.678.5511.0280.43Loamy sand
7.C31.17−81.421.0934.871.459.7010.1980.11Loamy sand
8.A31.07−81.473.81185.540.4630.4835.7133.81Clay loam
8.B31.07−81.471.0535.641.3617.8722.3159.82Sandy loam
8.C31.07−81.475.98213.950.4039.1155.595.30Silty clay loam
OM: organic matter, MC: moisture content, and BD: bulk density.
Table 2. Test of 95% confidence interval for salinity, pH, and redox of four species found in salt marshes of coastal Georgia (USA).
Vegetation SalinitypHRedox
B. frutescens(5.44, 32.57)(6.75, 6.93)(−209.95, −123.14)
J. roemerianus(12.28, 22.88)(6.33, 6.56)(−18.75, −9.94)
S. alterniflora(23.6, 32.14)(6.70, 6.81)(−380.56, −171.86)
S. tabernaemontani(2.83, 4.73)(6.40, 6.55)(−134.70, −46.72)
Table 3. Results from Tukey HSD for mean pH of species couplets.
VegetationDifference in Mean pHp-Value
B. frutescens vs. J. roemerianus0.39510.0012 *
B. frutescens vs. S. tabernaemontani0.36520.0002 *
S. alterniflora vs. J. roemerianus0.31620.0007 *
S. alterniflora vs. S. tabernaemontani0.2863<0.0001 *
Note: * means a significant difference in mean pH.
Publisher’s Note: MDPI stays neutral with regard to jurisdictional claims in published maps and institutional affiliations.

