Article

Experimental Aerodynamic and Aeroelastic Investigation of a Transonic Compressor Rotor with Reduced Blade Count †

1
Institute of Gas Turbines and Aerospace Propulsion, Technical University of Darmstadt, Otto-Berndt-Straße 2, 64287 Darmstadt, Germany
2
Rolls-Royce Deutschland Ltd. & Co. KG, Eschenweg 11, Dahlewitz, 15827 Blankenfelde-Mahlow, Germany
*
Author to whom correspondence should be addressed.
This paper is an extended version of our paper published in the Proceedings of the 14th European Turbomachinery Conference, Gdansk, Poland, 12–16 April 2021.
Int. J. Turbomach. Propuls. Power 2021, 6(2), 19; https://0-doi-org.brum.beds.ac.uk/10.3390/ijtpp6020019
Submission received: 27 May 2021 / Revised: 7 June 2021 / Accepted: 7 June 2021 / Published: 11 June 2021

Abstract

:
This study investigates the aerodynamic and aeroelastic characteristics of a transonic axial compressor, focusing on blade count reduced rotor behavior. The analysis is based on experiments, conducted at the Transonic Compressor Darmstadt test rig at Technical University of Darmstadt and compulsory simulations. In order to obtain measurement data for the detailed aerodynamic and aeroelastic investigation, extensive steady and unsteady instrumentation was applied. Besides transient measurements at the stability limit to determine the operating range and limiting phenomena, performance measurements were performed, presenting promising results with respect to the capabilities of blade count reduced rotors. Close to the stability limit, aerodynamic disturbances like radial vortices were detected for both rotors, varying in size, count, speed and trajectory. Comparing the rotor configurations results in different stability limits along the compressor map as well as varying aeromechanical behavior. Those effects can partially be traced to the variation in blade pitch and associated aerodynamics.

1. Introduction

Design trends for future aero engines aim for increased efficiency with reduced exhaust gas and noise emissions. For the compressor, as one of the major components of an aero engine, this requires smaller and lighter designs with maintained or even increased performance. This can for example be achieved by a minimum number of compressor stages and reduced blade counts, resulting in increased aerodynamic stage and blade loading, thus higher susceptibility to secondary flow phenomena. In conjunction with negligible structural damping of modern BLISK rotors, this leads to a severe vulnerability to blade vibration. Particularly during transient operation at part speed, some compressor stages approach both the aerodynamic as well as aeromechanical operating limit. Within the last decades, several studies (e.g., [1]) highlighted the problem of unwanted vibration in front stages. The aerodynamic effects leading to the operation limits are based on aerodynamic disturbances and can be characterized as radial vortices (RV), as presented in literature [2,3,4]. Numerical studies by Kielb et al. [5] and Besem et al. [6] identify vortices as a source of non-synchronous blade vibration (NSV). Measurements by Brandstetter et al. [7] describe the origin of those aerodynamic disturbances, particularly radial vortices, and the interaction with blade vibration, stating that RVs can trigger NSV. Stapelfeldt and Brandstetter [8] present the lock-in and coupling mechanism of fluid and structure during NSV. The link between aerodynamic wave pattern and vibration pattern of a BLISK can also be shown in numerical investigations [9,10].
Varying rotor blade counts may affect the aerodynamic and aeroelastic behavior of BLISK rotors. On the one hand, the aerodynamic loading of single blades is increased for reduced blade counts at similar operating conditions within the compressor characteristic. This leads to an amplified susceptibility to secondary flow phenomena as well as varying interaction with the shock and related blockage. On the other hand, BLISK vibration and corresponding traveling wave modes depend on the inter-blade phase angle, and thus the relative movement of adjacent blades. Therefore, the rotor blade count constrains the nodal diameter (ND) range of the BLISK and hence the aeroelastic coupling conditions. For example, studies by Franke et al. [11] showed that a variation in rotor blade count has no significant effect on count and speed of convective propagating aerodynamic disturbances. Based on that, the structural nodal diameter adjusts with respect to the rotor blade count, resulting in shifts along the entire operating range as well as varying directions of traveling BLISK modes. Additionally, varying stability limiting mechanisms have been identified and are the subject of this study.
Multiple experiments and simulations are performed, to analyze the mechanisms leading to unsteady aerodynamic and aeroelastic effects close to the compressor operating limit, focusing on the phenomena due to a reduced rotor blade count. From an aerodynamic point of view, the reduced blade count rotor shows promising results with respect to performance capabilities, whereas distinct influences can be derived for the aeroelastic behavior, especially during stall inception.

2. Methodology

The experimental investigations were conducted at the Transonic Compressor Darmstadt (TCD) test facility at Technical University of Darmstadt, as shown in Figure 1a. The compressor is a modern 1.5-stage high-pressure front stage compressor with variable inlet guide vanes (VIGV) and a BLISK rotor, designed by Rolls-Royce Deutschland Ltd. & Co. KG. The rig is electrically driven by an 800 kW DC drive, enabling shaft speeds up to 20,000 rpm.
The compressor stage, used for this study, is successively equipped with two different BLISK rotors. Both have a forward swept blade design, are tip critical and suffer blade vibrations at the stability limit. The reference rotor (R-Ref) was analyzed within several prior investigations, for example [7,8,9,10,11,12]. The second rotor has a similar aerodynamic design with a reduced blade count (R-Red), indicating distinct effects on the aeromechanical behavior [11]. For better comparability, the remaining stage, i.e., VIGV, stator and tip clearance, as well as the instrumentation setup are kept constant.
To monitor the compressor operation and determine its performance, the rig is equipped with different measurement systems within several measurement sections, as illustrated in Figure 1b. For example, this includes combined total pressure and total temperature rakes at the stage inlet and exit, in order to determine the compressors characteristics, as well as radially distributed stator leading edge instrumentation.
Besides conventional performance instrumentation, the compressor is equipped with extensive unsteady instrumentation, including sensors for aerodynamic and blade vibration measurements. In the rotating frame of reference, the blade vibrations are measured via strain gauges (SG) on the rotor, optimized to resolve different blade modes. The vibration monitoring is supplemented by a tip timing system, installed in the stationary frame of reference. The unsteady flow phenomena at the blade tip region are resolved by a variety of unsteady wall pressure transducers (WPT) in the casing. The miniaturized sensors are flush-mounted in axial arrays as well as several circumferential positions. The axial array with up to 23 sensors covers the whole axial blade chord length and an extension upstream the blade leading edge, in order to resolve secondary flow structures as well as shock interaction. The circumferentially distributed sensors are located at the blade leading edge, enabling spectral analysis of aerodynamics and structural vibration. Furthermore, the circumferential sensors are used to evaluate the propagation speed of aerodynamic disturbances. Measurement and analysis procedures are for example described in [7,12].
The computational approach is based on the compressible RANS flow solver AU3D, developed at Imperial College London [13,14]. Turbulence is simulated using the one-equation model by Spalart and Allmaras and boundary conditions based on Riemann invariants are applied to avoid spurious wave reflections. For all blade rows, semi-structured meshes are generated. A steady compressor characteristic is computed at nominal speed, using single-passage simulations with mixing planes. In the simulation, the compressor is throttled by a variable-area nozzle located downstream the stage. A validation of the simulated steady nominal characteristic with measurements shows a very close agreement (see [9]). Based on the results from the steady computations, unsteady simulations for the investigation of stall inception are performed. For the stall simulation, unsteady full-annulus simulations of the entire 1.5-stage compressor including the nozzle are carried out. The simulation is started at the last stable operating point before the stall limit and the nozzle is closed by a small amount (about 1%) to initiate stall. For further details refer to [10].

3. Results and Discussion

Based on the comprehensive measurements and compulsory simulations, global trends can be derived, considering steady and unsteady aerodynamics as well as the aeroelastic behavior.

3.1. Steady Aerodynamics

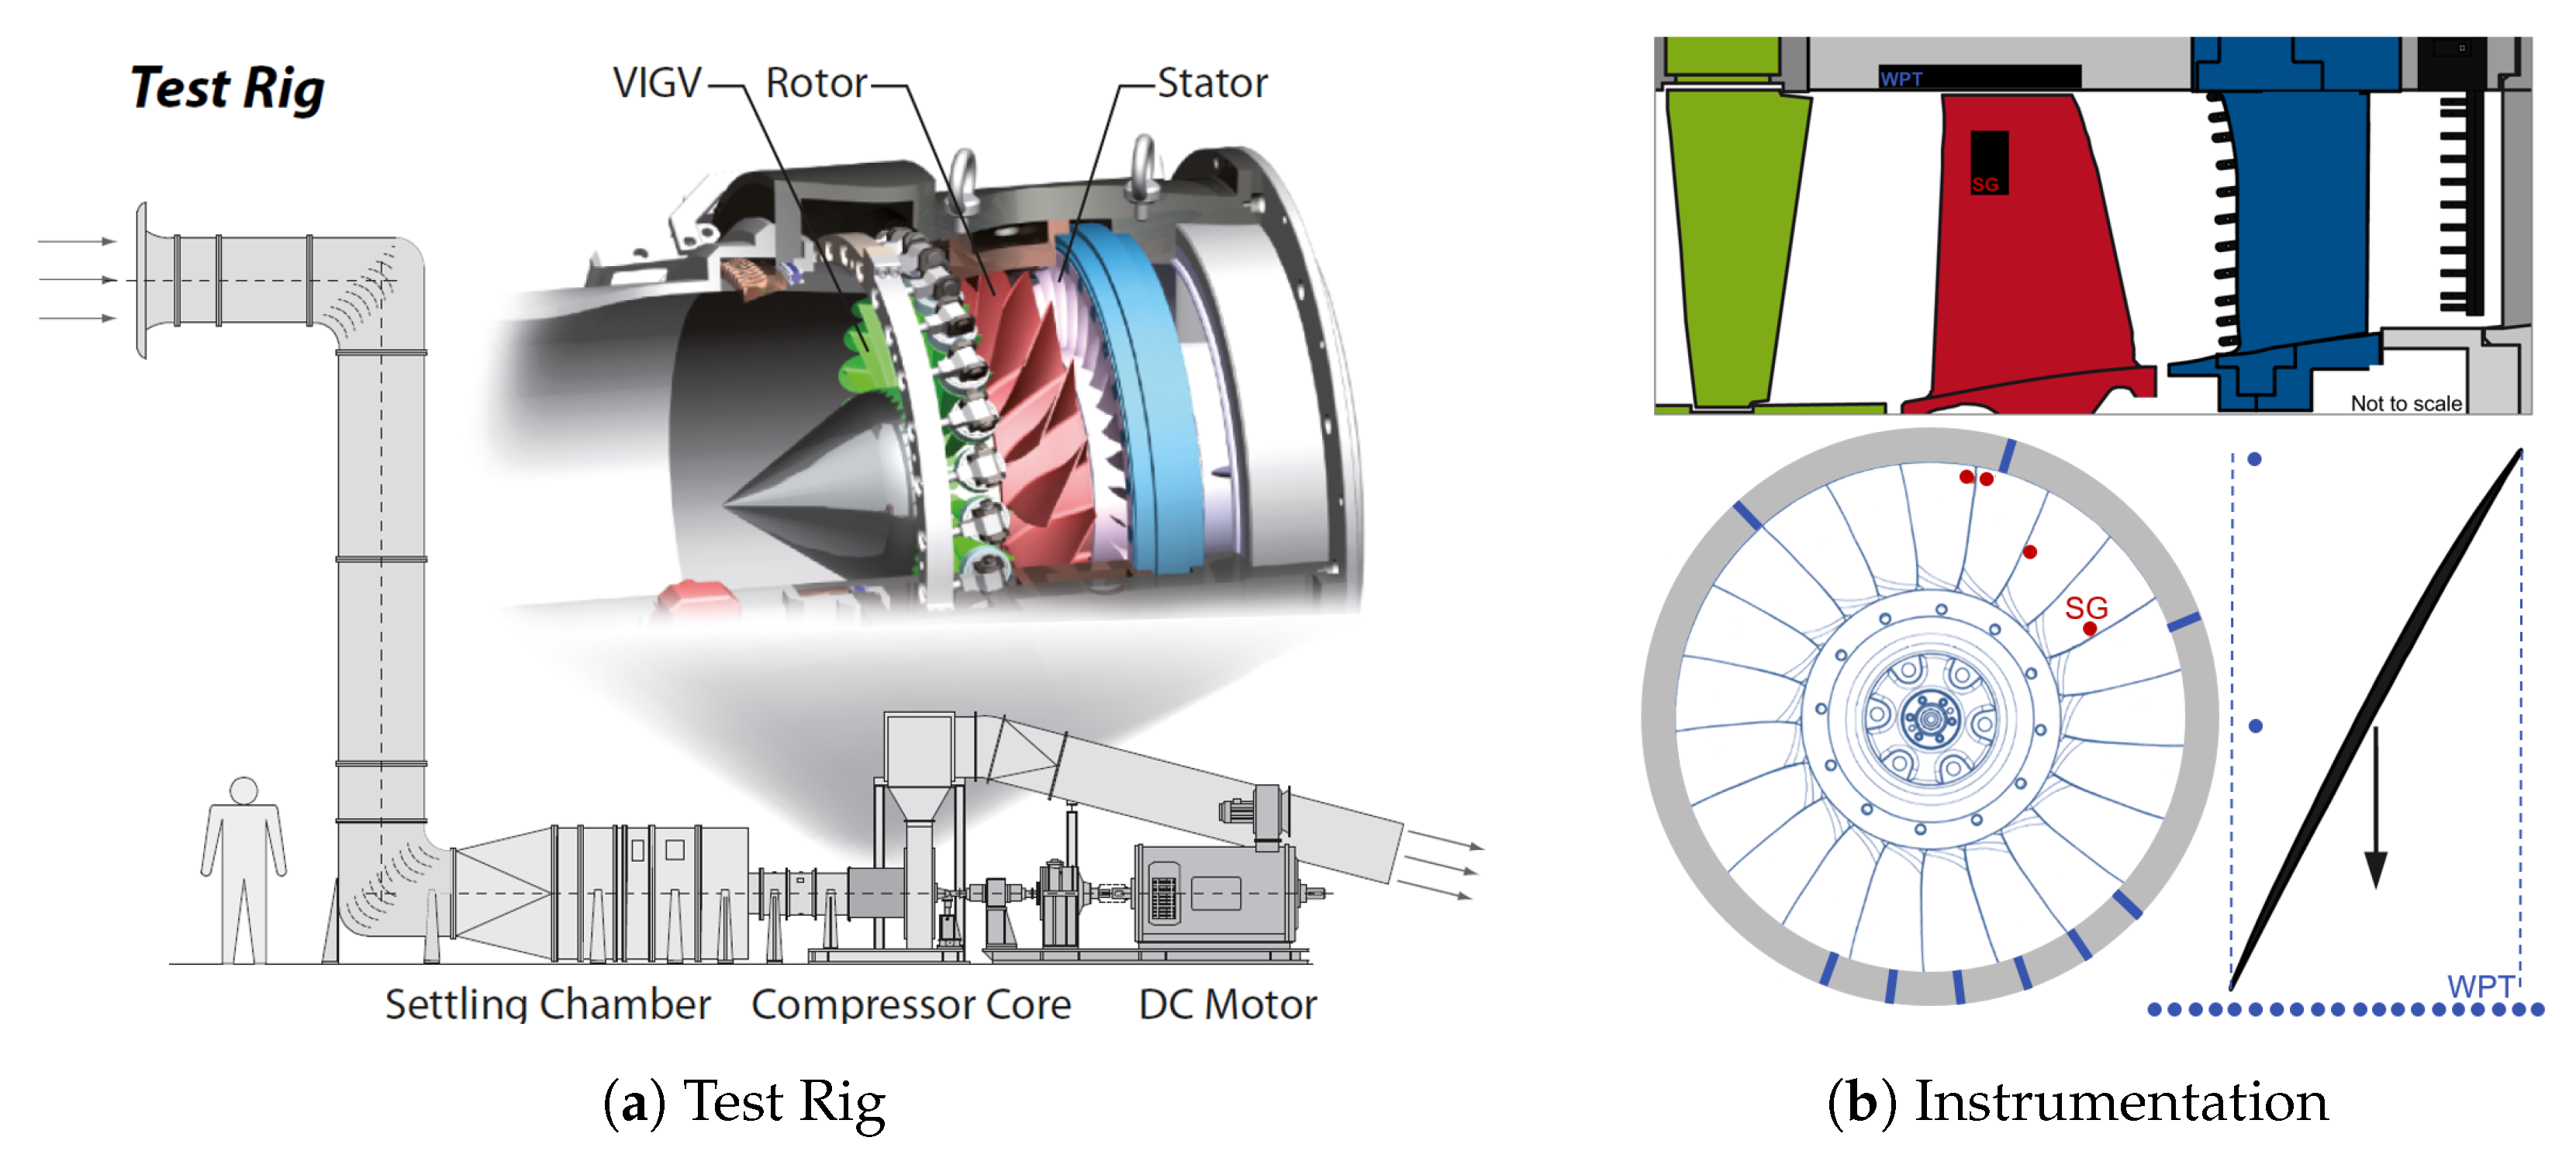
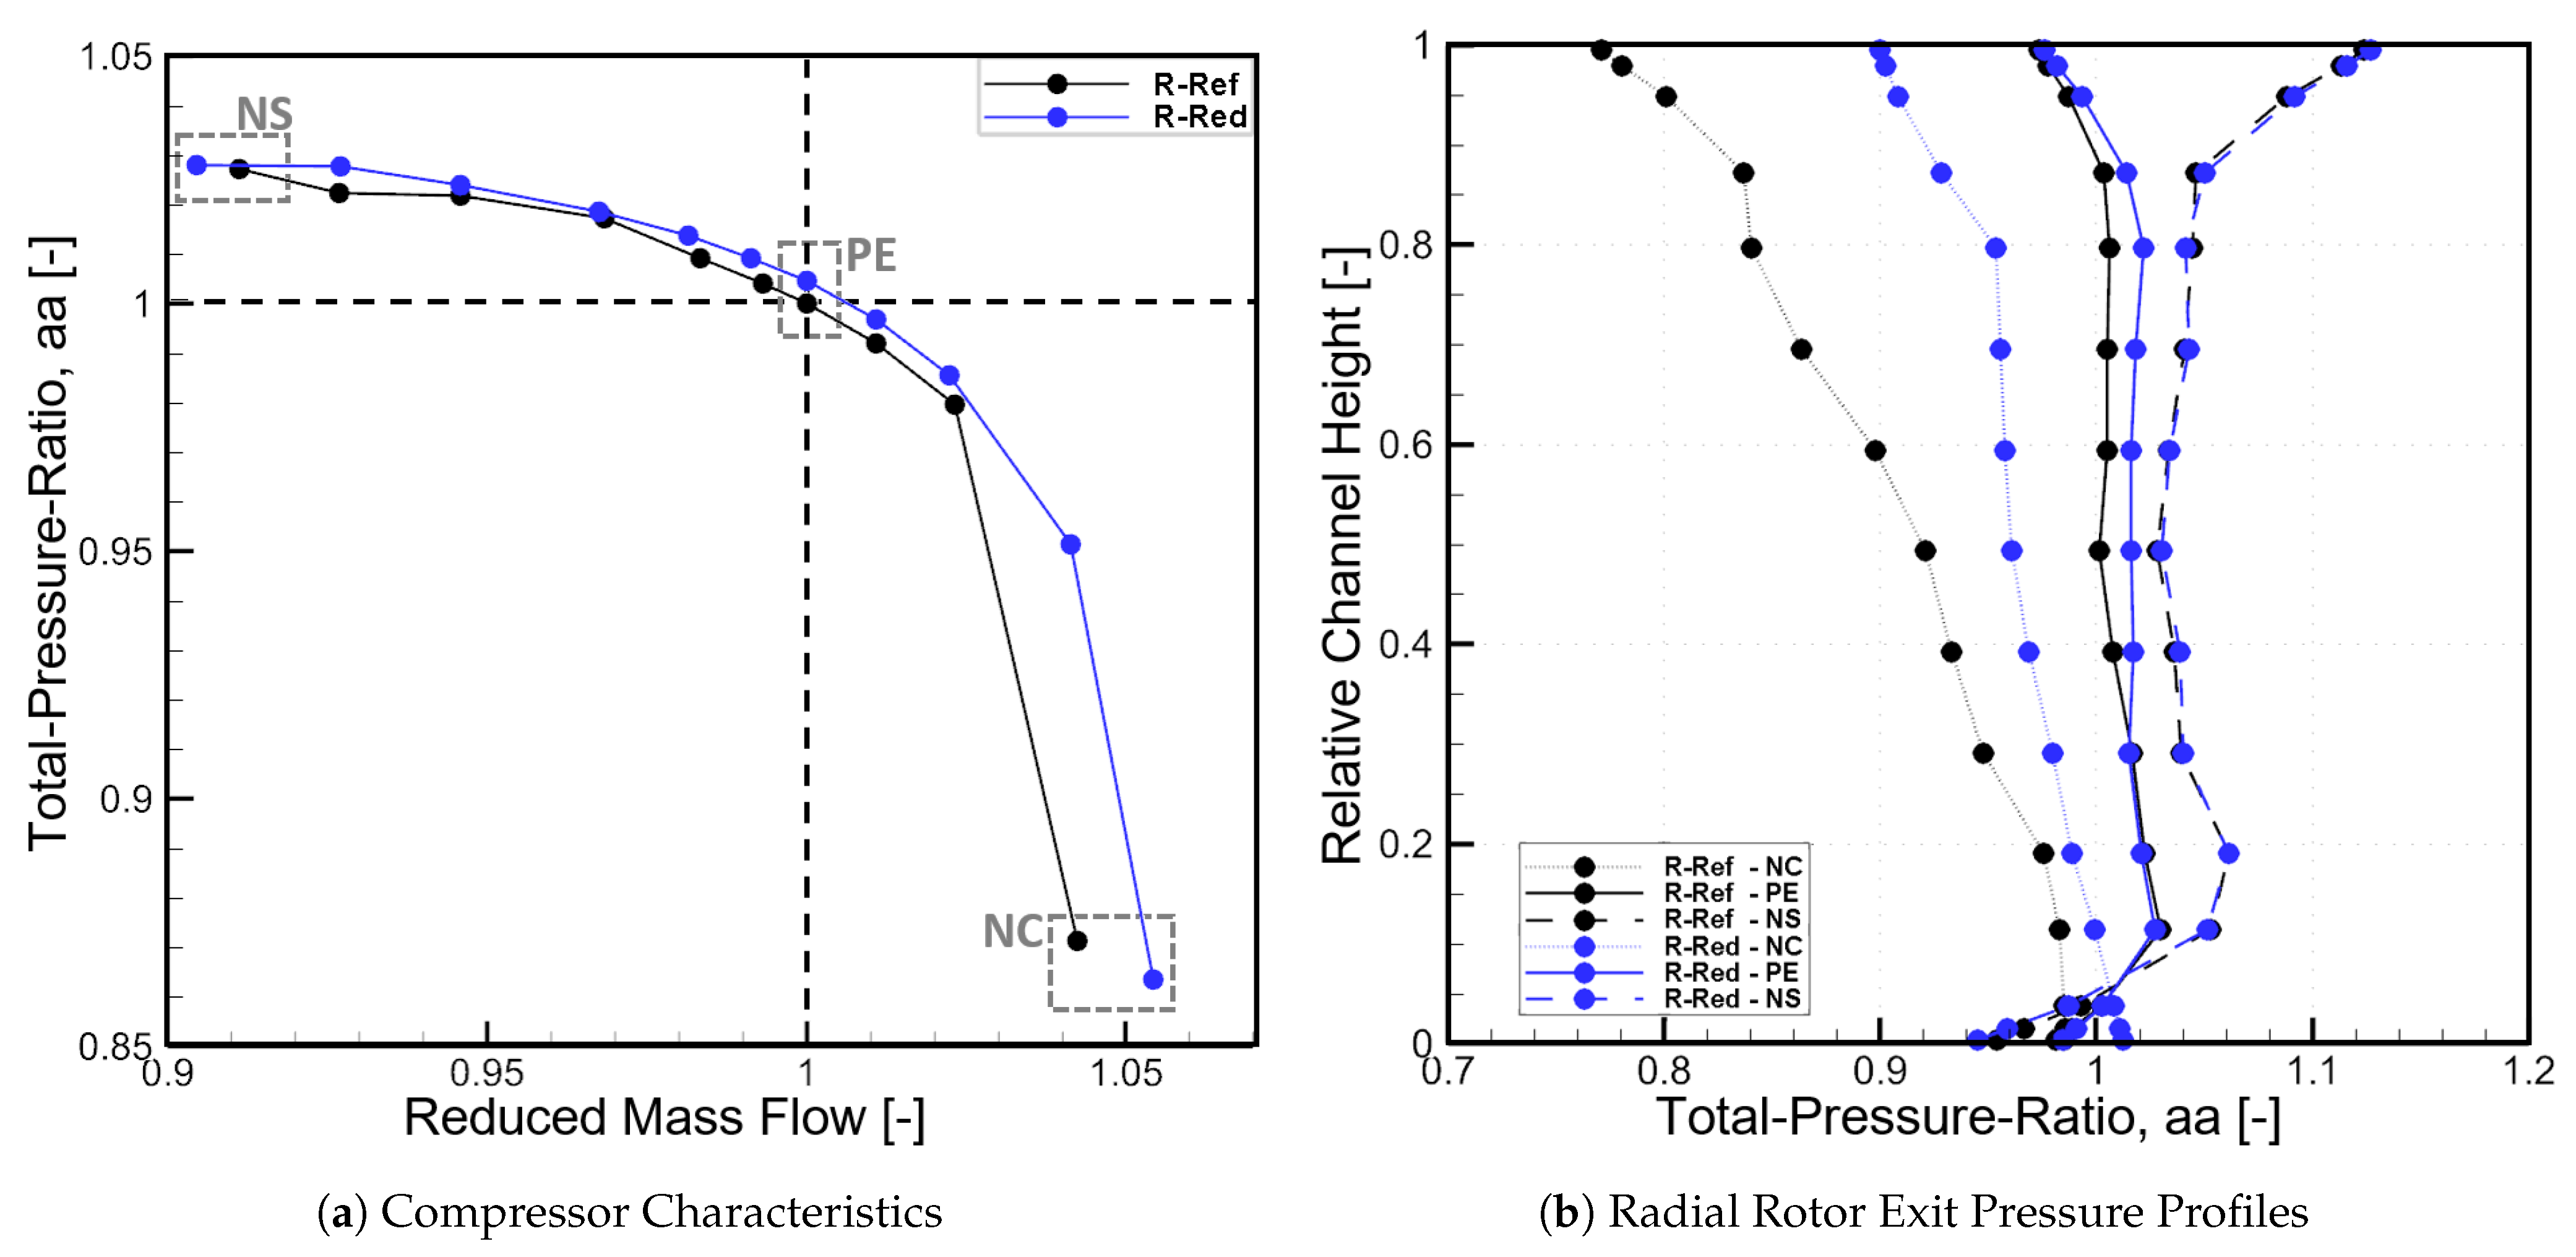
In order to characterize the steady aerodynamics and performance of the compressor stage configuration, the compressor map for design speed (N100) and nominal VIGV setting is shown in Figure 2a. Compared to rotor R-Ref, the compressor stage with R-Red shows a similar characteristic with small variations. At near choke (NC), higher mass flows can be achieved for R-Red. As a result of the reduced blade count, mass flow can be further increased until blockage of the cross section is evoked by sonic flow within the narrowest section of the rotor. Additionally, R-Red shows a sightly increased total pressure ratio for the entire speed line as well as comparable mass flow and total pressure ratio at the last stable steady operating point (NS). To evaluate the rotor-only aerodynamics, measurements within the rotor exit plane were carried out. Based on the stator leading edge instrumentation, the radial profile of the total pressure ratio with respect to the relative channel height was derived and is shown in Figure 2b for near choke, peak efficiency (PE) and near stall operating conditions at design speed (compare Figure 2a). The total pressure ratio of R-Red is increased for near choke and peak efficiency, compared to R-Ref. This proves that the pressure rise is performed by the rotor itself and not due to a better interaction with the stator. Furthermore, the pressure profile at the last stable steady operating conditions (NS) shows a uniform overlap with R-Ref, hence similar radially distributed loading.
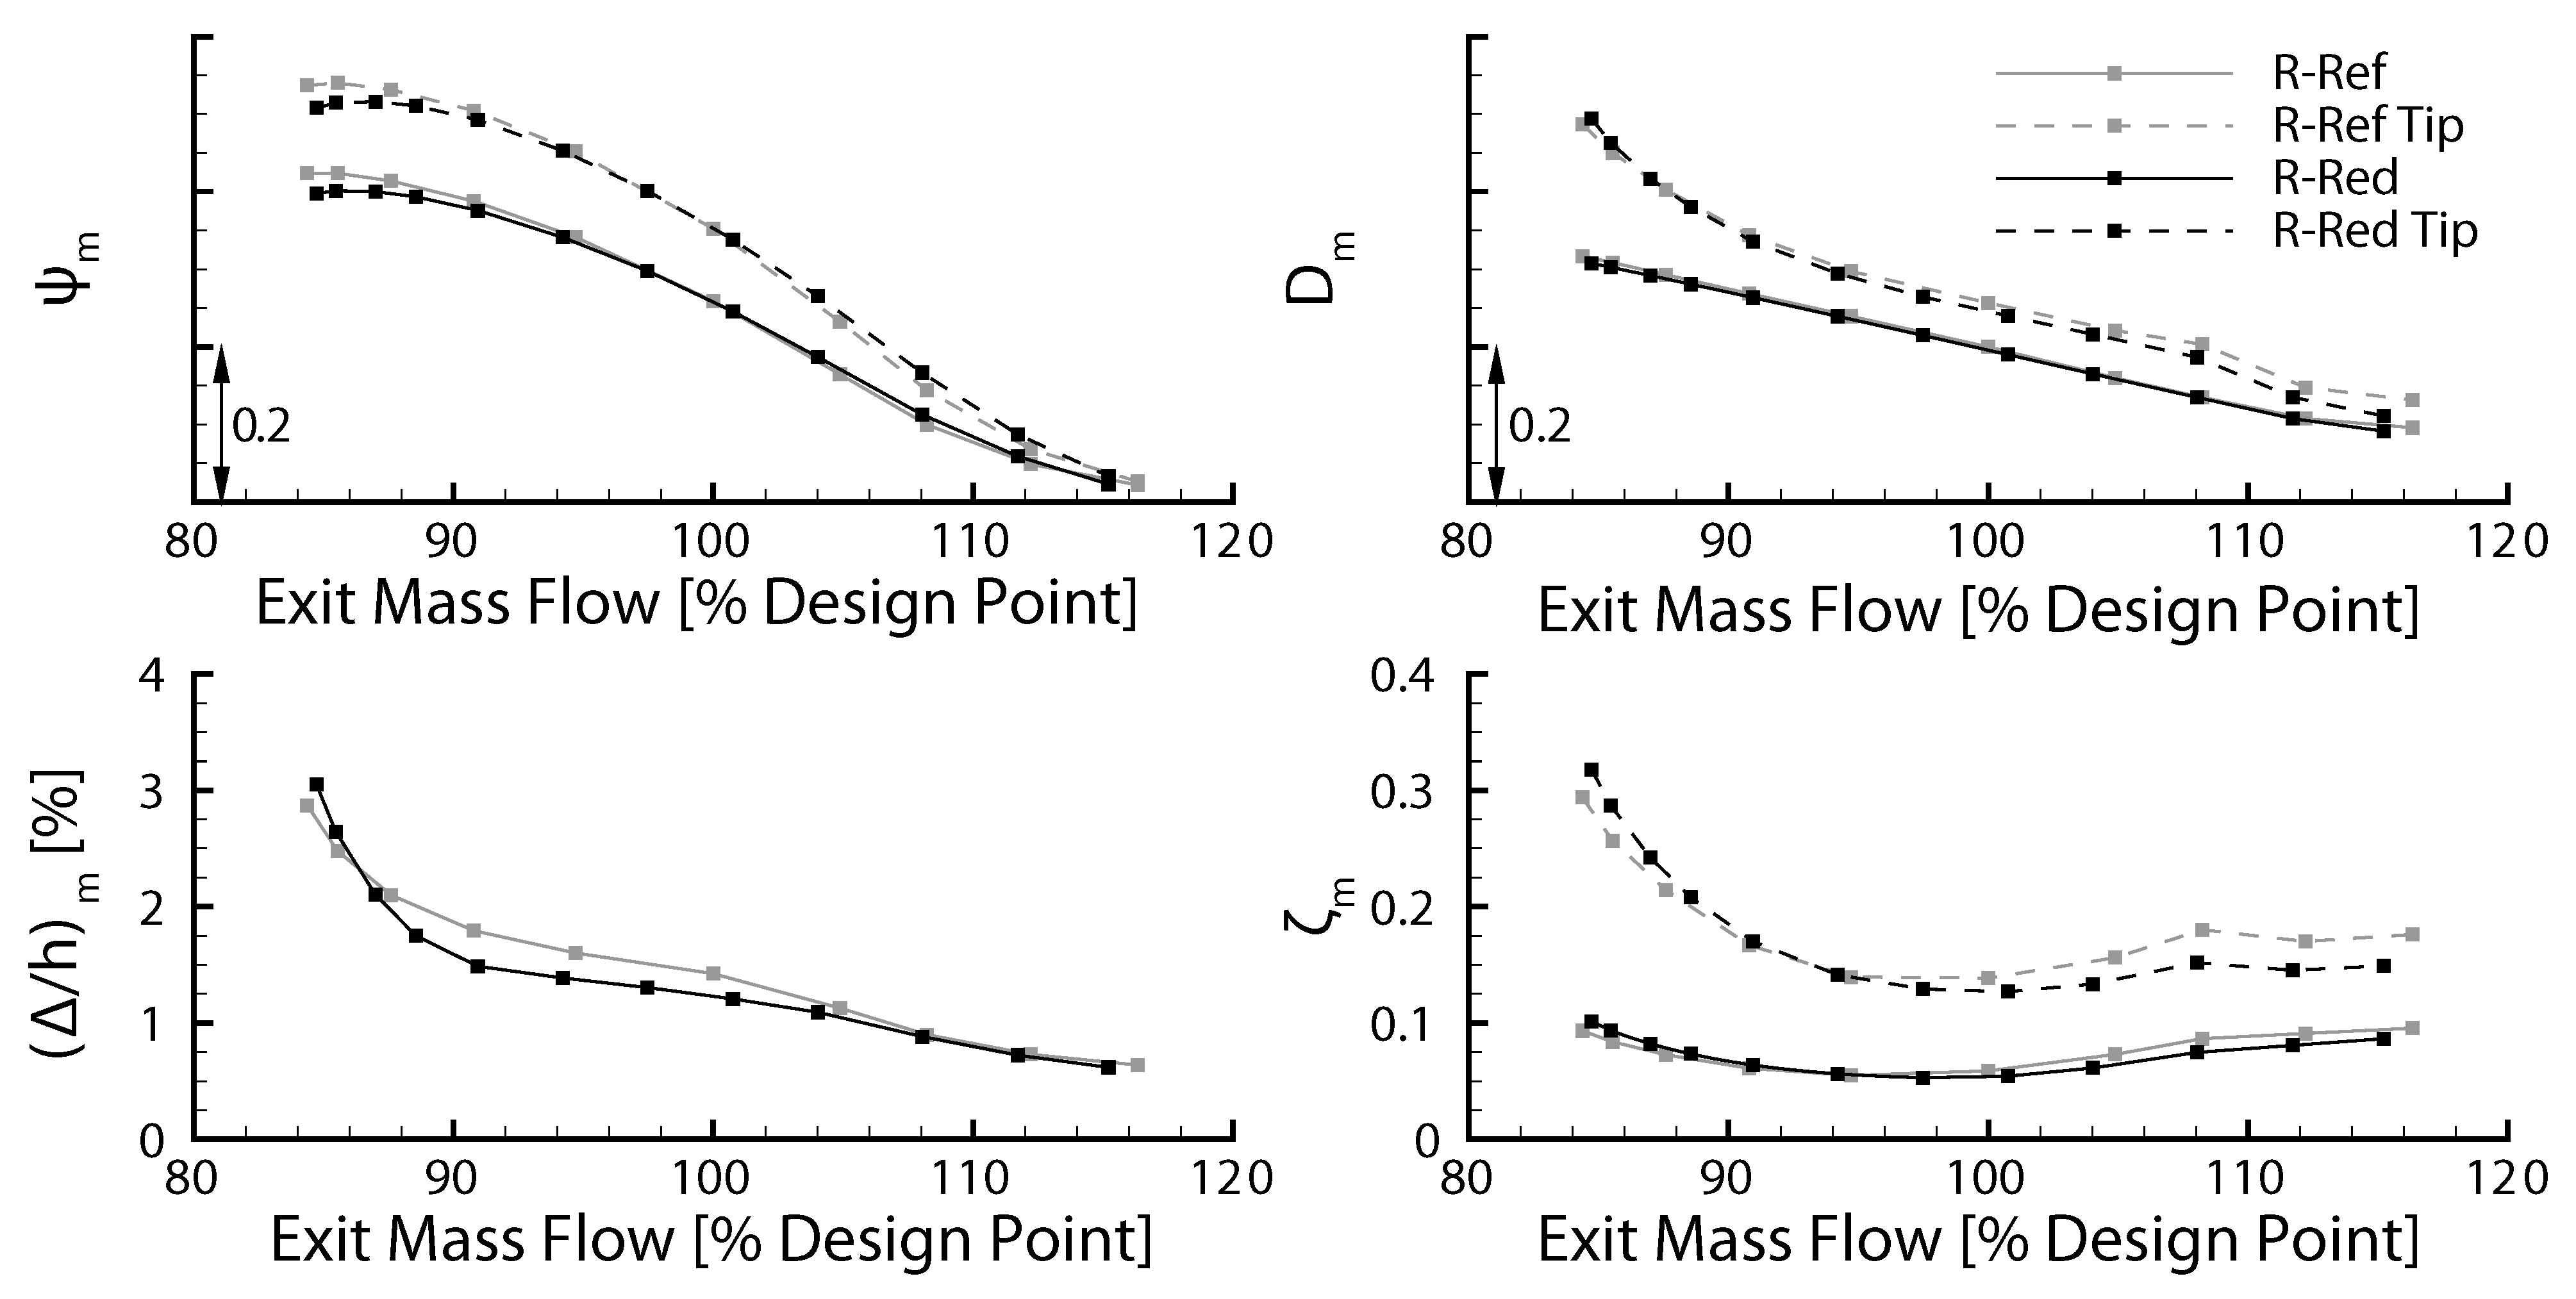
In order to compare the aerodynamics of the rotors in more detail, specific evaluation parameters are derived from the simulations, as shown in Figure 3. Solid lines illustrate mean values of the rotor and dashed lines the mean at blade tip (upper 20% channel height) for different throttling conditions at design speed. In general, a strong similarity of the rotors is visible. The pressure rise coefficient ψ is plotted in the upper left graph, showing an almost equal behavior for both rotors with small difference in the vicinity to stall. The increased pressure rise at the blade tip is evident as well (compare Figure 2). Throttling the compressor leads to higher diffusion within the rotor. As shown in the upper right graph, the diffusion is similar for both rotors and increases almost linearly, with over-proportional increase at the tip in the vicinity to stall. This can be traced to the rising blockage at blade tip, as shown in the lower left graph. For R-Red with its larger rotor passage, the slope is steeper in the vicinity to stall, even though the overall blockage is similar. The blockage causes high losses in the blade tip region, especially close to stall, as illustrated in the lower right graph. Due to radial flow redistribution lower channel heights are less loaded, resulting in lower averaged losses for the entire blade. Overall, the aerodynamic behavior is very similar along the stable operating range. Despite the varying blade count, similar flow effects as well as resulting blockage and losses in the blade tip region occur.

3.2. Unsteady Aerodynamics

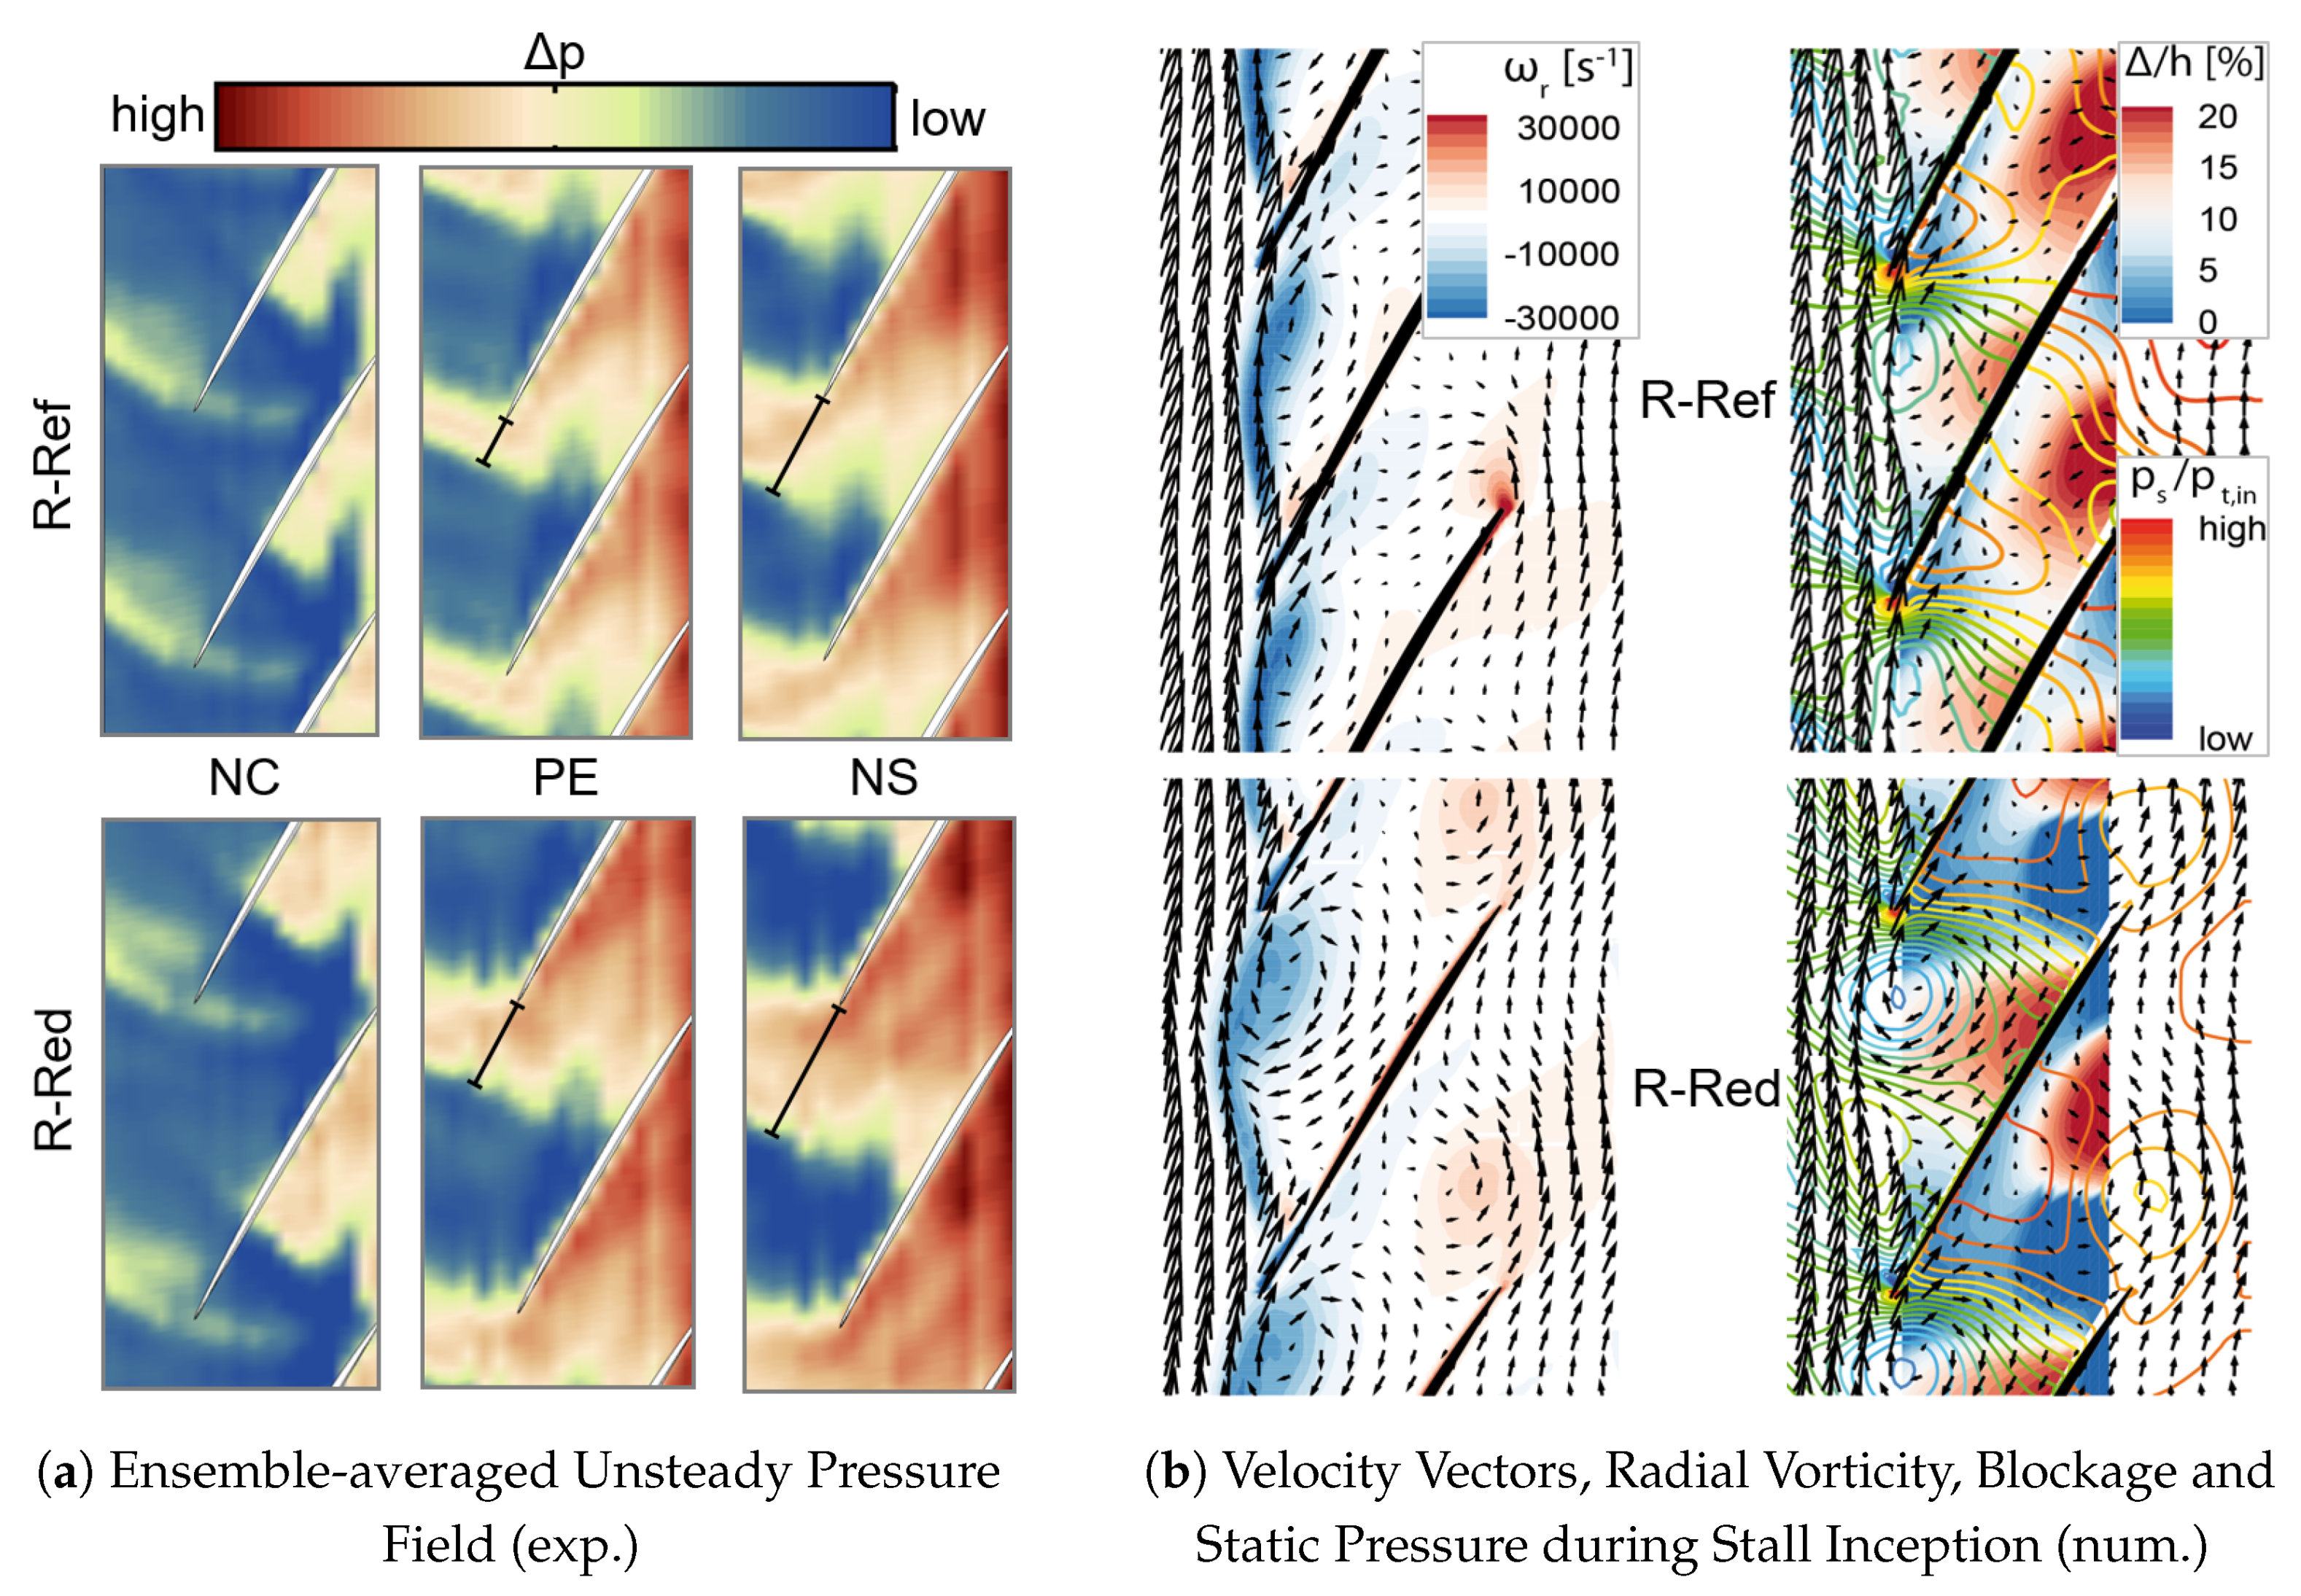
The unsteady wall pressure at blade tip is used to analyze aerodynamic loading, secondary flow phenomena and shock position. Therefore, different operation points along the design speed characteristic are shown for both rotor configurations in Figure 4a. As expected, the blade loading increases and thus the shock detaches further from the blade leading edge during throttling at constant speed. This behavior can be seen for both configurations, even though it differs between the two rotors. Already at peak efficiency operation, the shock is further detached for R-Red. This can be explained by the larger blade pitch due to the reduced blade count and operating conditions with similar pressure rise, hence increased aerodynamic loading of the individual blades. This results in increased static pressure gradients within the passage and potentially in higher suction side peaks in isentropic Mach number.
The rotor tip flow during the initial phase of stall inception is numerically investigated in Figure 4b. The velocity vectors and radial vorticity show the shear layer between the incoming main flow and blockage within the passage. The periodically fluctuating shear layer results in a formation of radial vortices, which coincide with regions of high negative radial vorticity. This phenomena is evident for both rotors. The fluctuations are associated with the formation of regions with high blockage within the passage, causing propagating high and low pressure spots due to local flow stagnation and acceleration. For further details refer to [10].
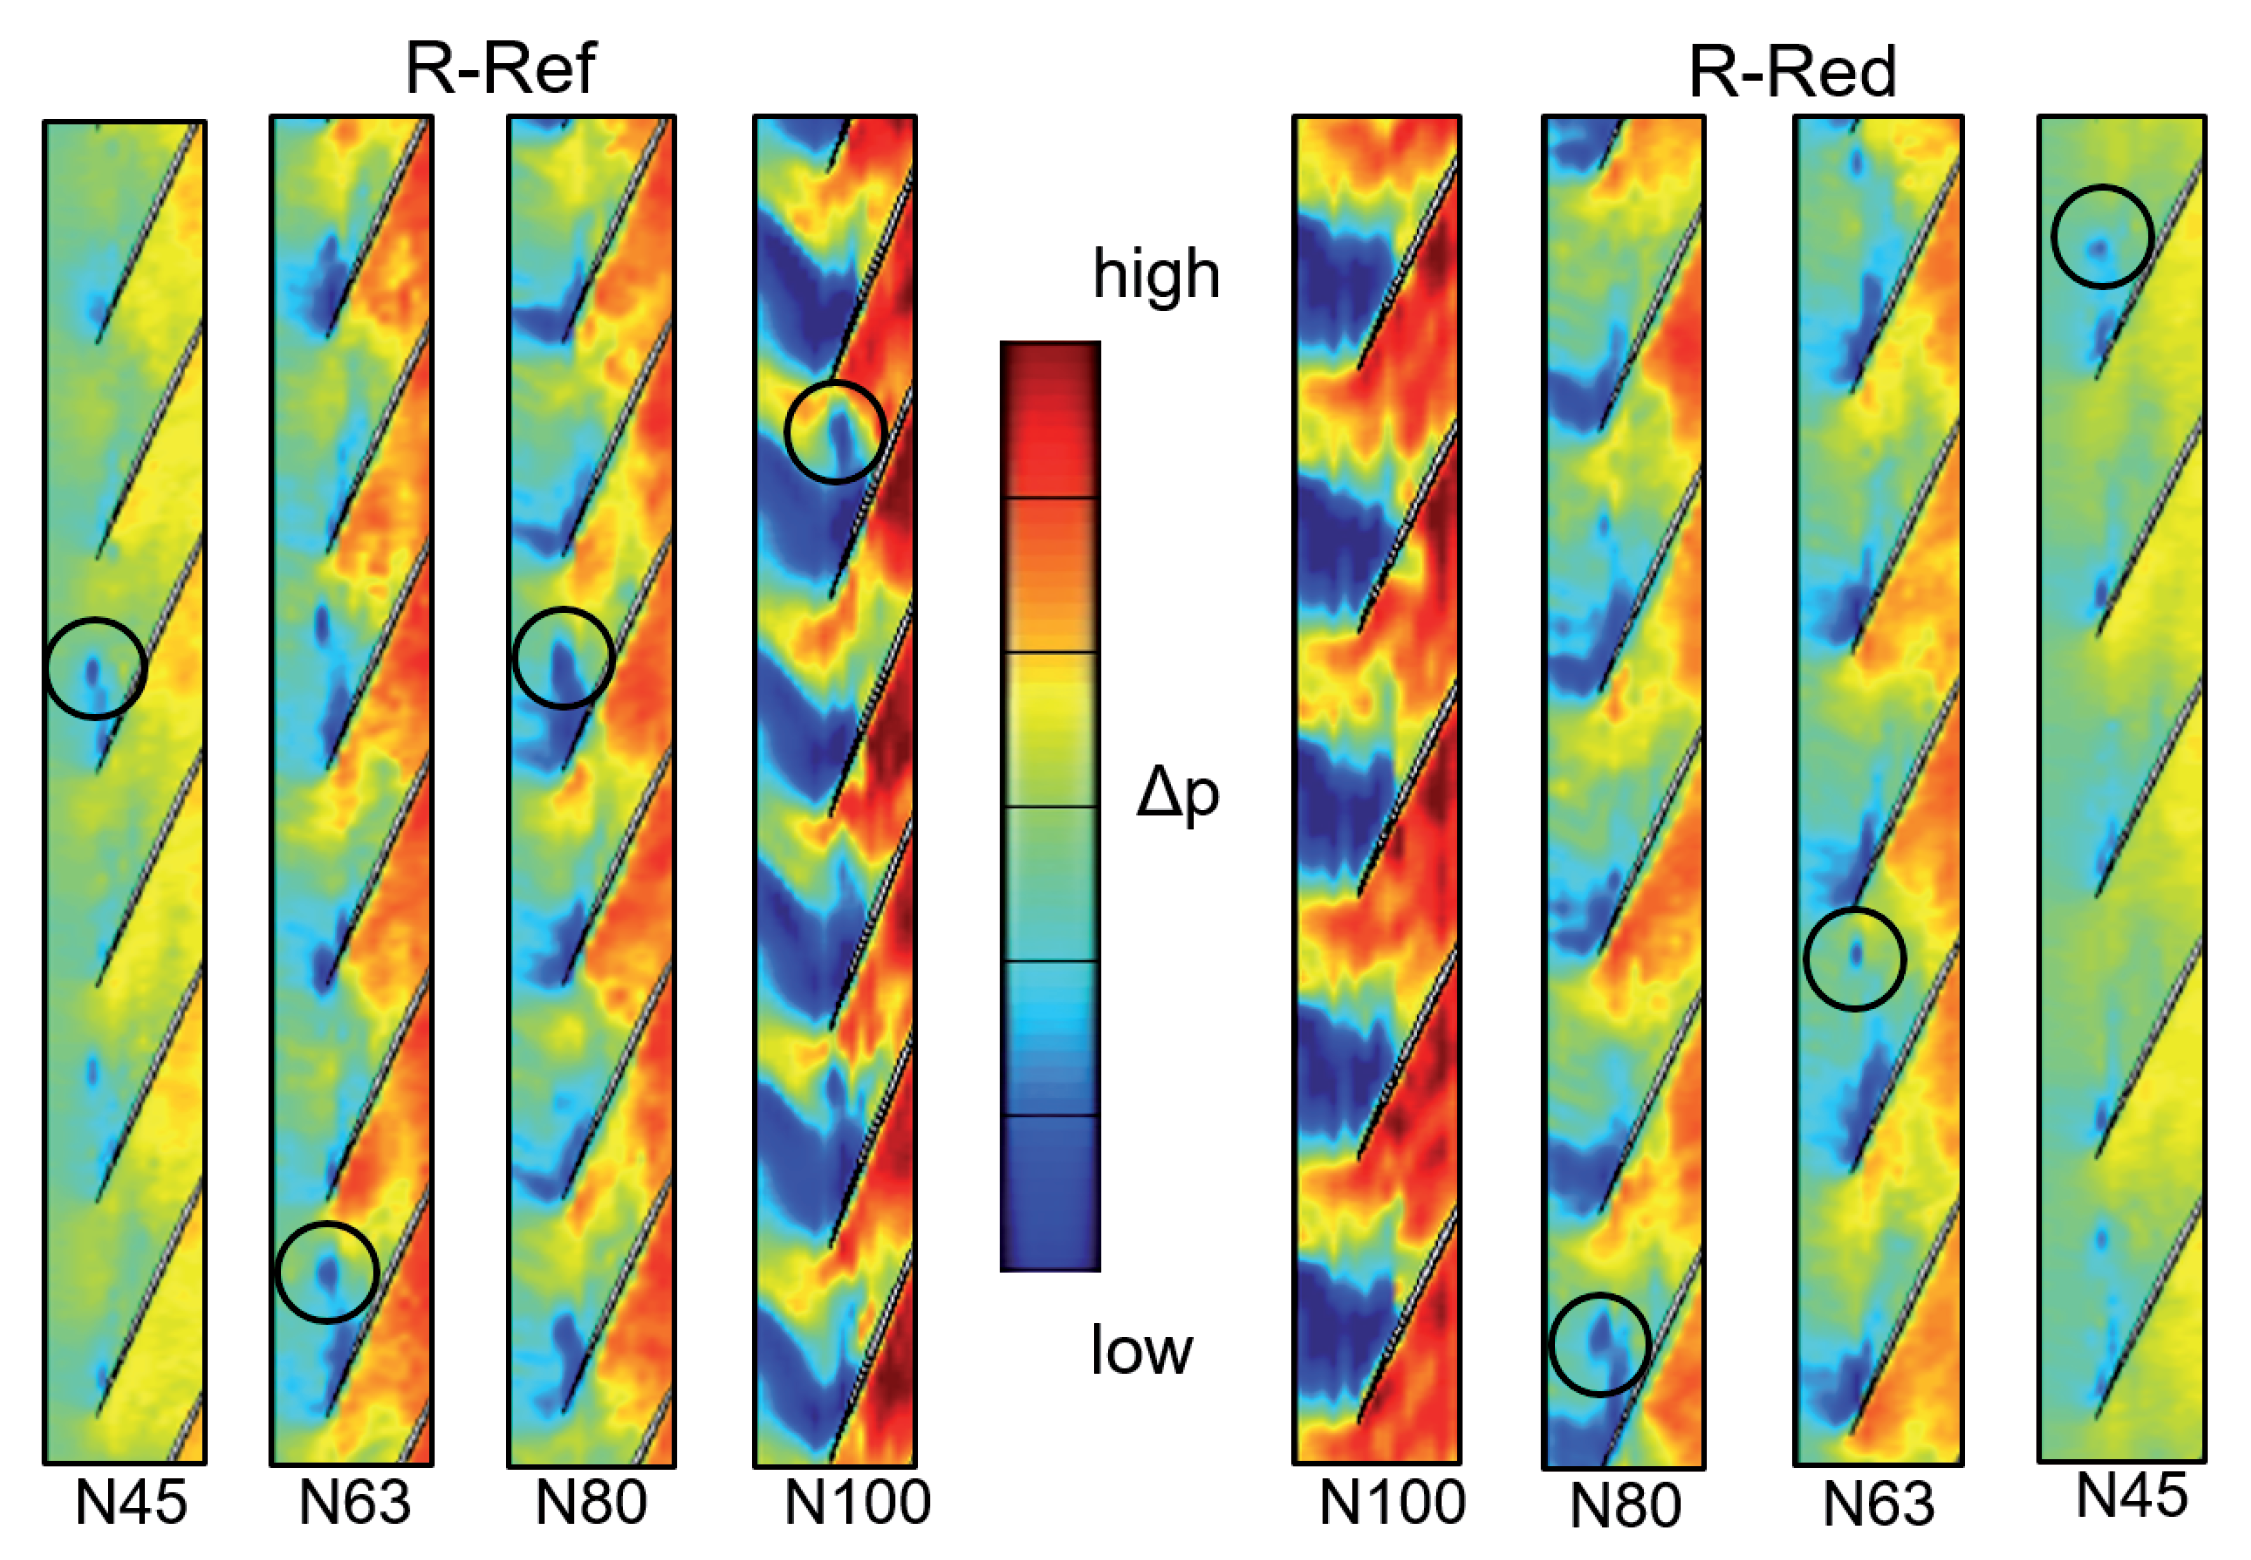
The time-resolved pressure field at blade tip for the last stable steady-state operation point (NS) at different rotational speeds is shown in Figure 5 for both rotor configurations. As expected, the pressure level rises for increasing rotational speed and the influence of the shock is visible for transonic operation (N100). Furthermore, all speed lines show low-pressure level spots (see circular markers), indicating disturbances like radial vortices (compare [15]). Those spots vary in count, size, propagation speed and trajectory (compare [7]), which might also affect the corresponding stability limits.
Comparing rotor R-Ref and R-Red shows differences in the unsteady aerodynamics at the blade tip. For rotor R-Ref, the disturbances, indicated by low-pressure regions, are already larger for steady conditions near the stability limit. In addition, these low pressure regions seem to occur less for rotor R-Red (detailed analysis not shown for brevity).
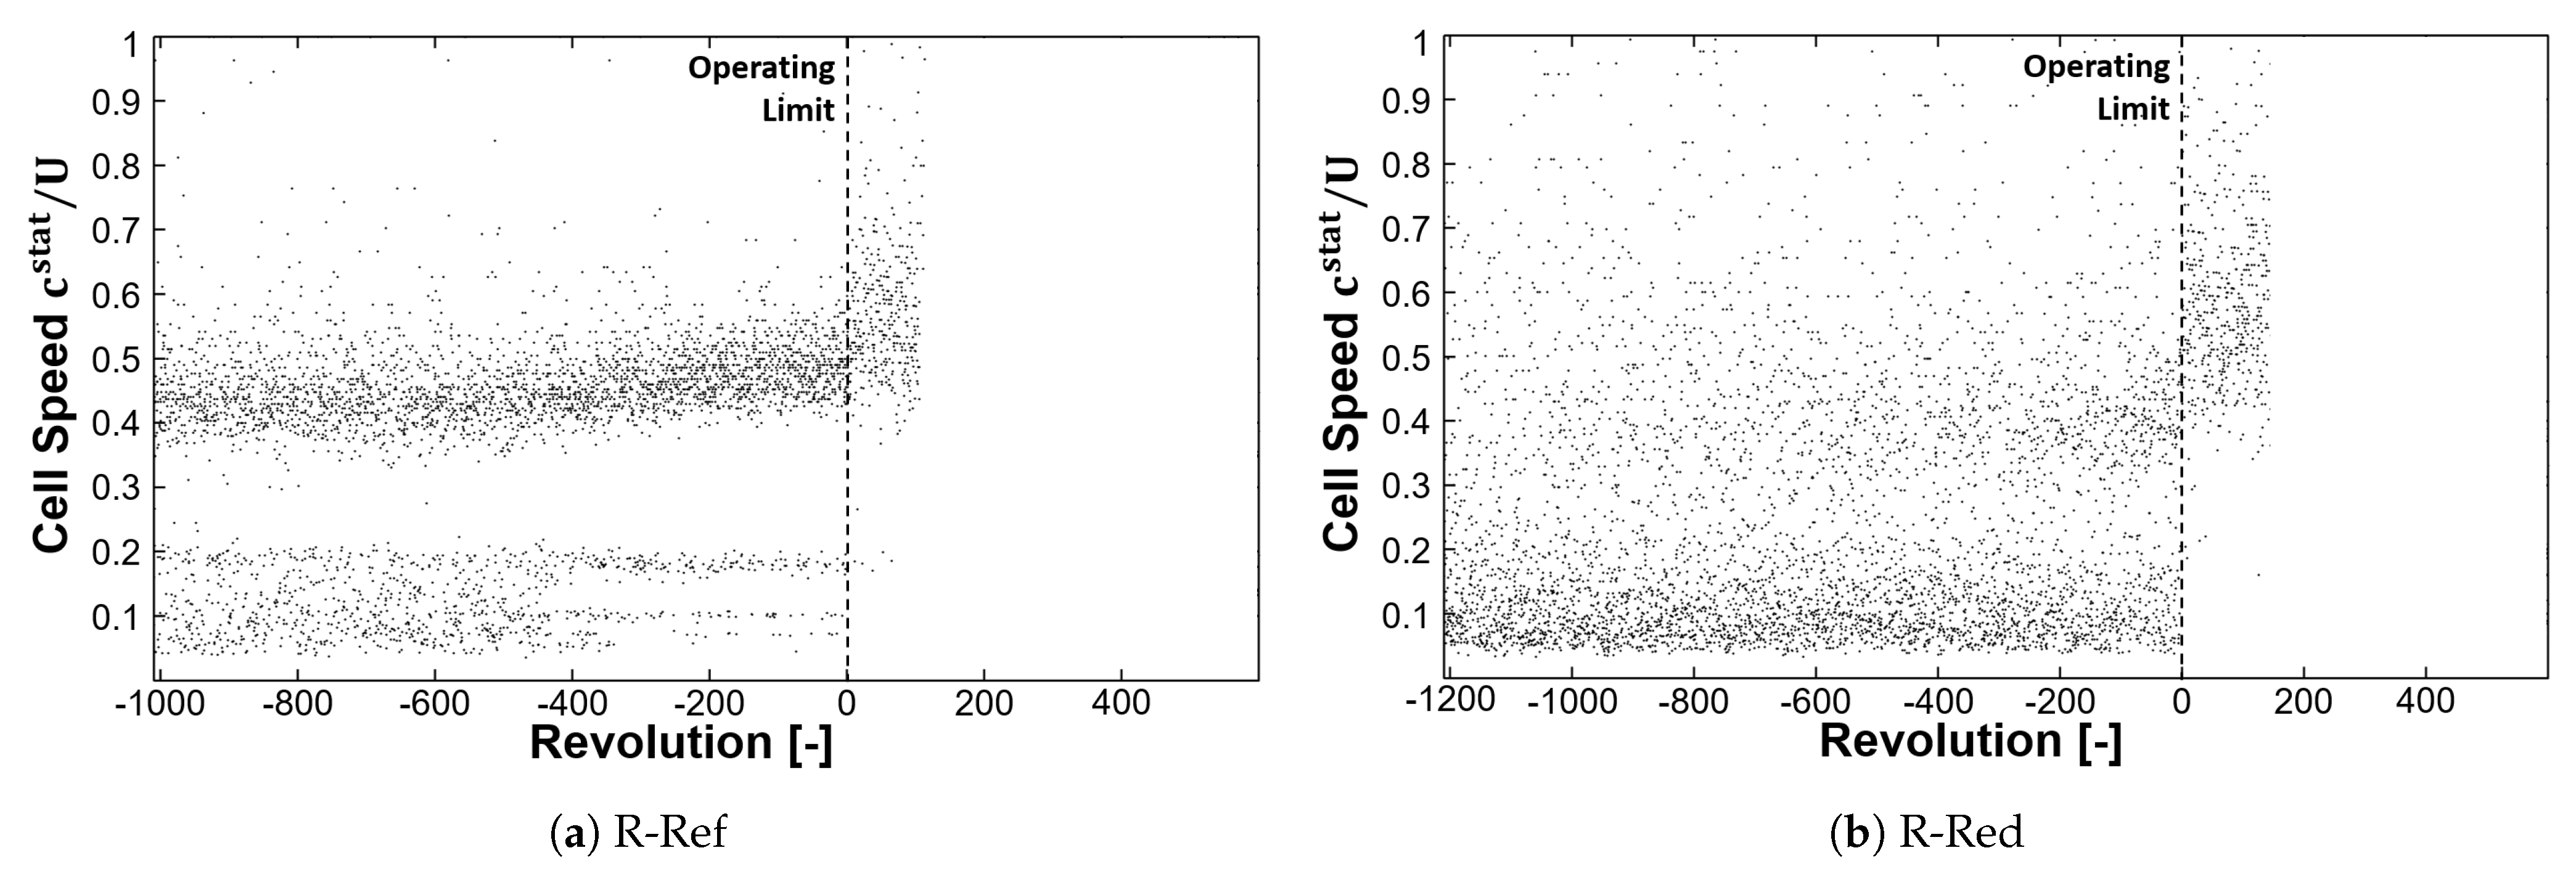
The aerodynamic disturbances propagate around the annulus at a particular propagation speed. Figure 6 illustrates the propagation speed of aerodynamic disturbances with respect to the rotor tip speed during stall inception at design speed, as determined by the circumferentially distributed WPT sensors close to the blade leading edge (compare Figure 1). For rotor R-Ref, the cell speed increases from about 42% to almost 50% rotor tip speed. Considering about six disturbances per revolution, an aerodynamic wave number of 13 is established, traveling in opposite direction to rotor speed. For more details refer to [
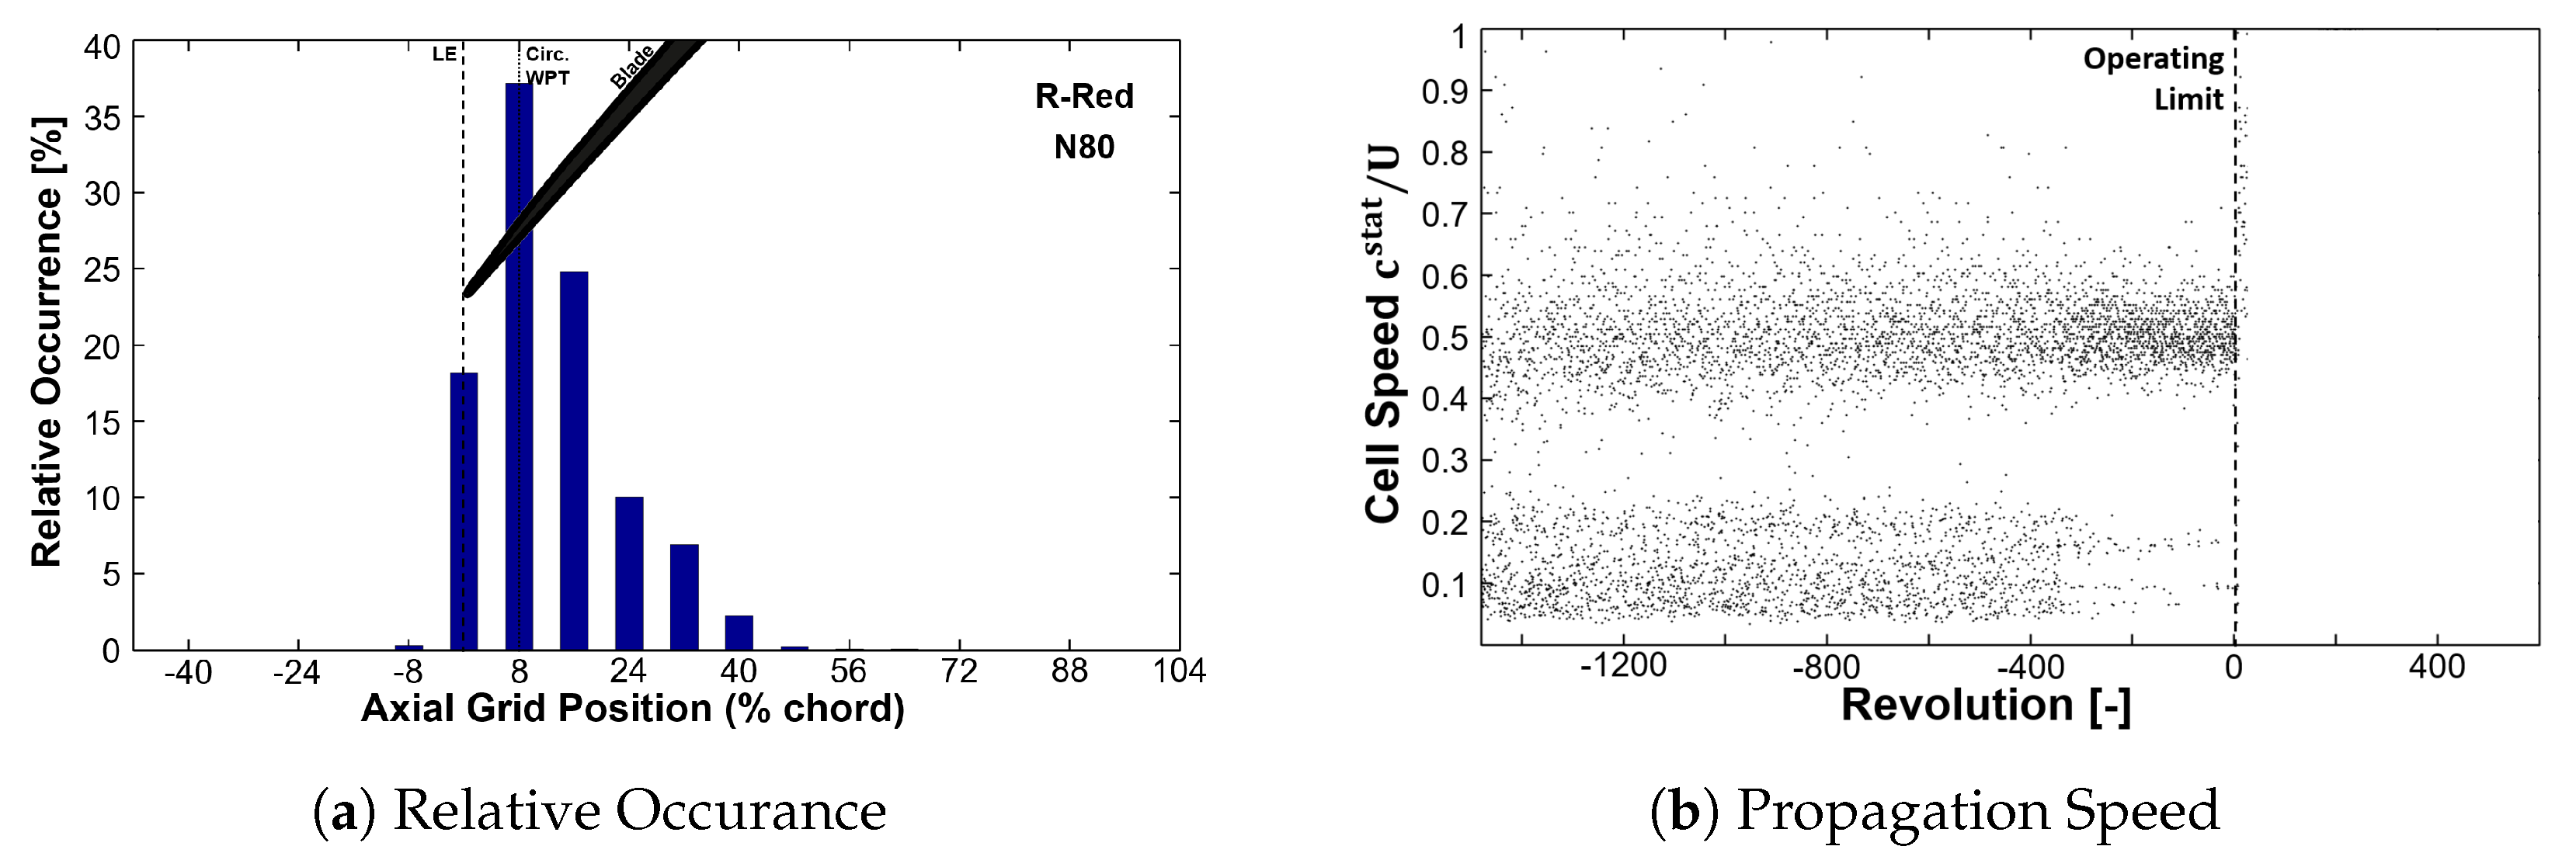
7]. For R-Red, no distinctive cell speed can be calculated with the circumferential distributed sensors at the leading edge. One reason could be the comparable small cells and another the trajectory within the rotor passages.
Figure 7 illustrates the axial occurrence of the detected aerodynamic disturbances, thus their one-dimensional trajectory while propagating through the rotor during stall inception at design speed. The dashed line indicates the blade leading edge and the dotted line the axial position of WPT sensors, used for spectral analysis and propagation speed calculations. Comparing the two rotor configurations, a further downstream shifted trajectory of the disturbances is distinctive for R-Red. Thus, less low-pressure regions are present within the particular WPT analysis section, exacerbating reliable cell speed calculations (compare Figure 6). Due to the increased blade pitch, the aerodynamic disturbances have a longer propagation period through the passage (compare [11]), and hence are carried further downstream by the axial momentum of the main flow. With respect to aeroelastic mechanisms at the stability limit, it is reasonable to assume that the shifted trajectories are a lower risk to excite 1T blade vibrations. This is in agreement with the vibration analysis. Further findings regarding the influence of trajectory and propagation speed of aerodynamic cells with respect to the compressor aeroelastics is presented in later sections. R-Ref shows similar behavior as presented by Brandstetter et al. [
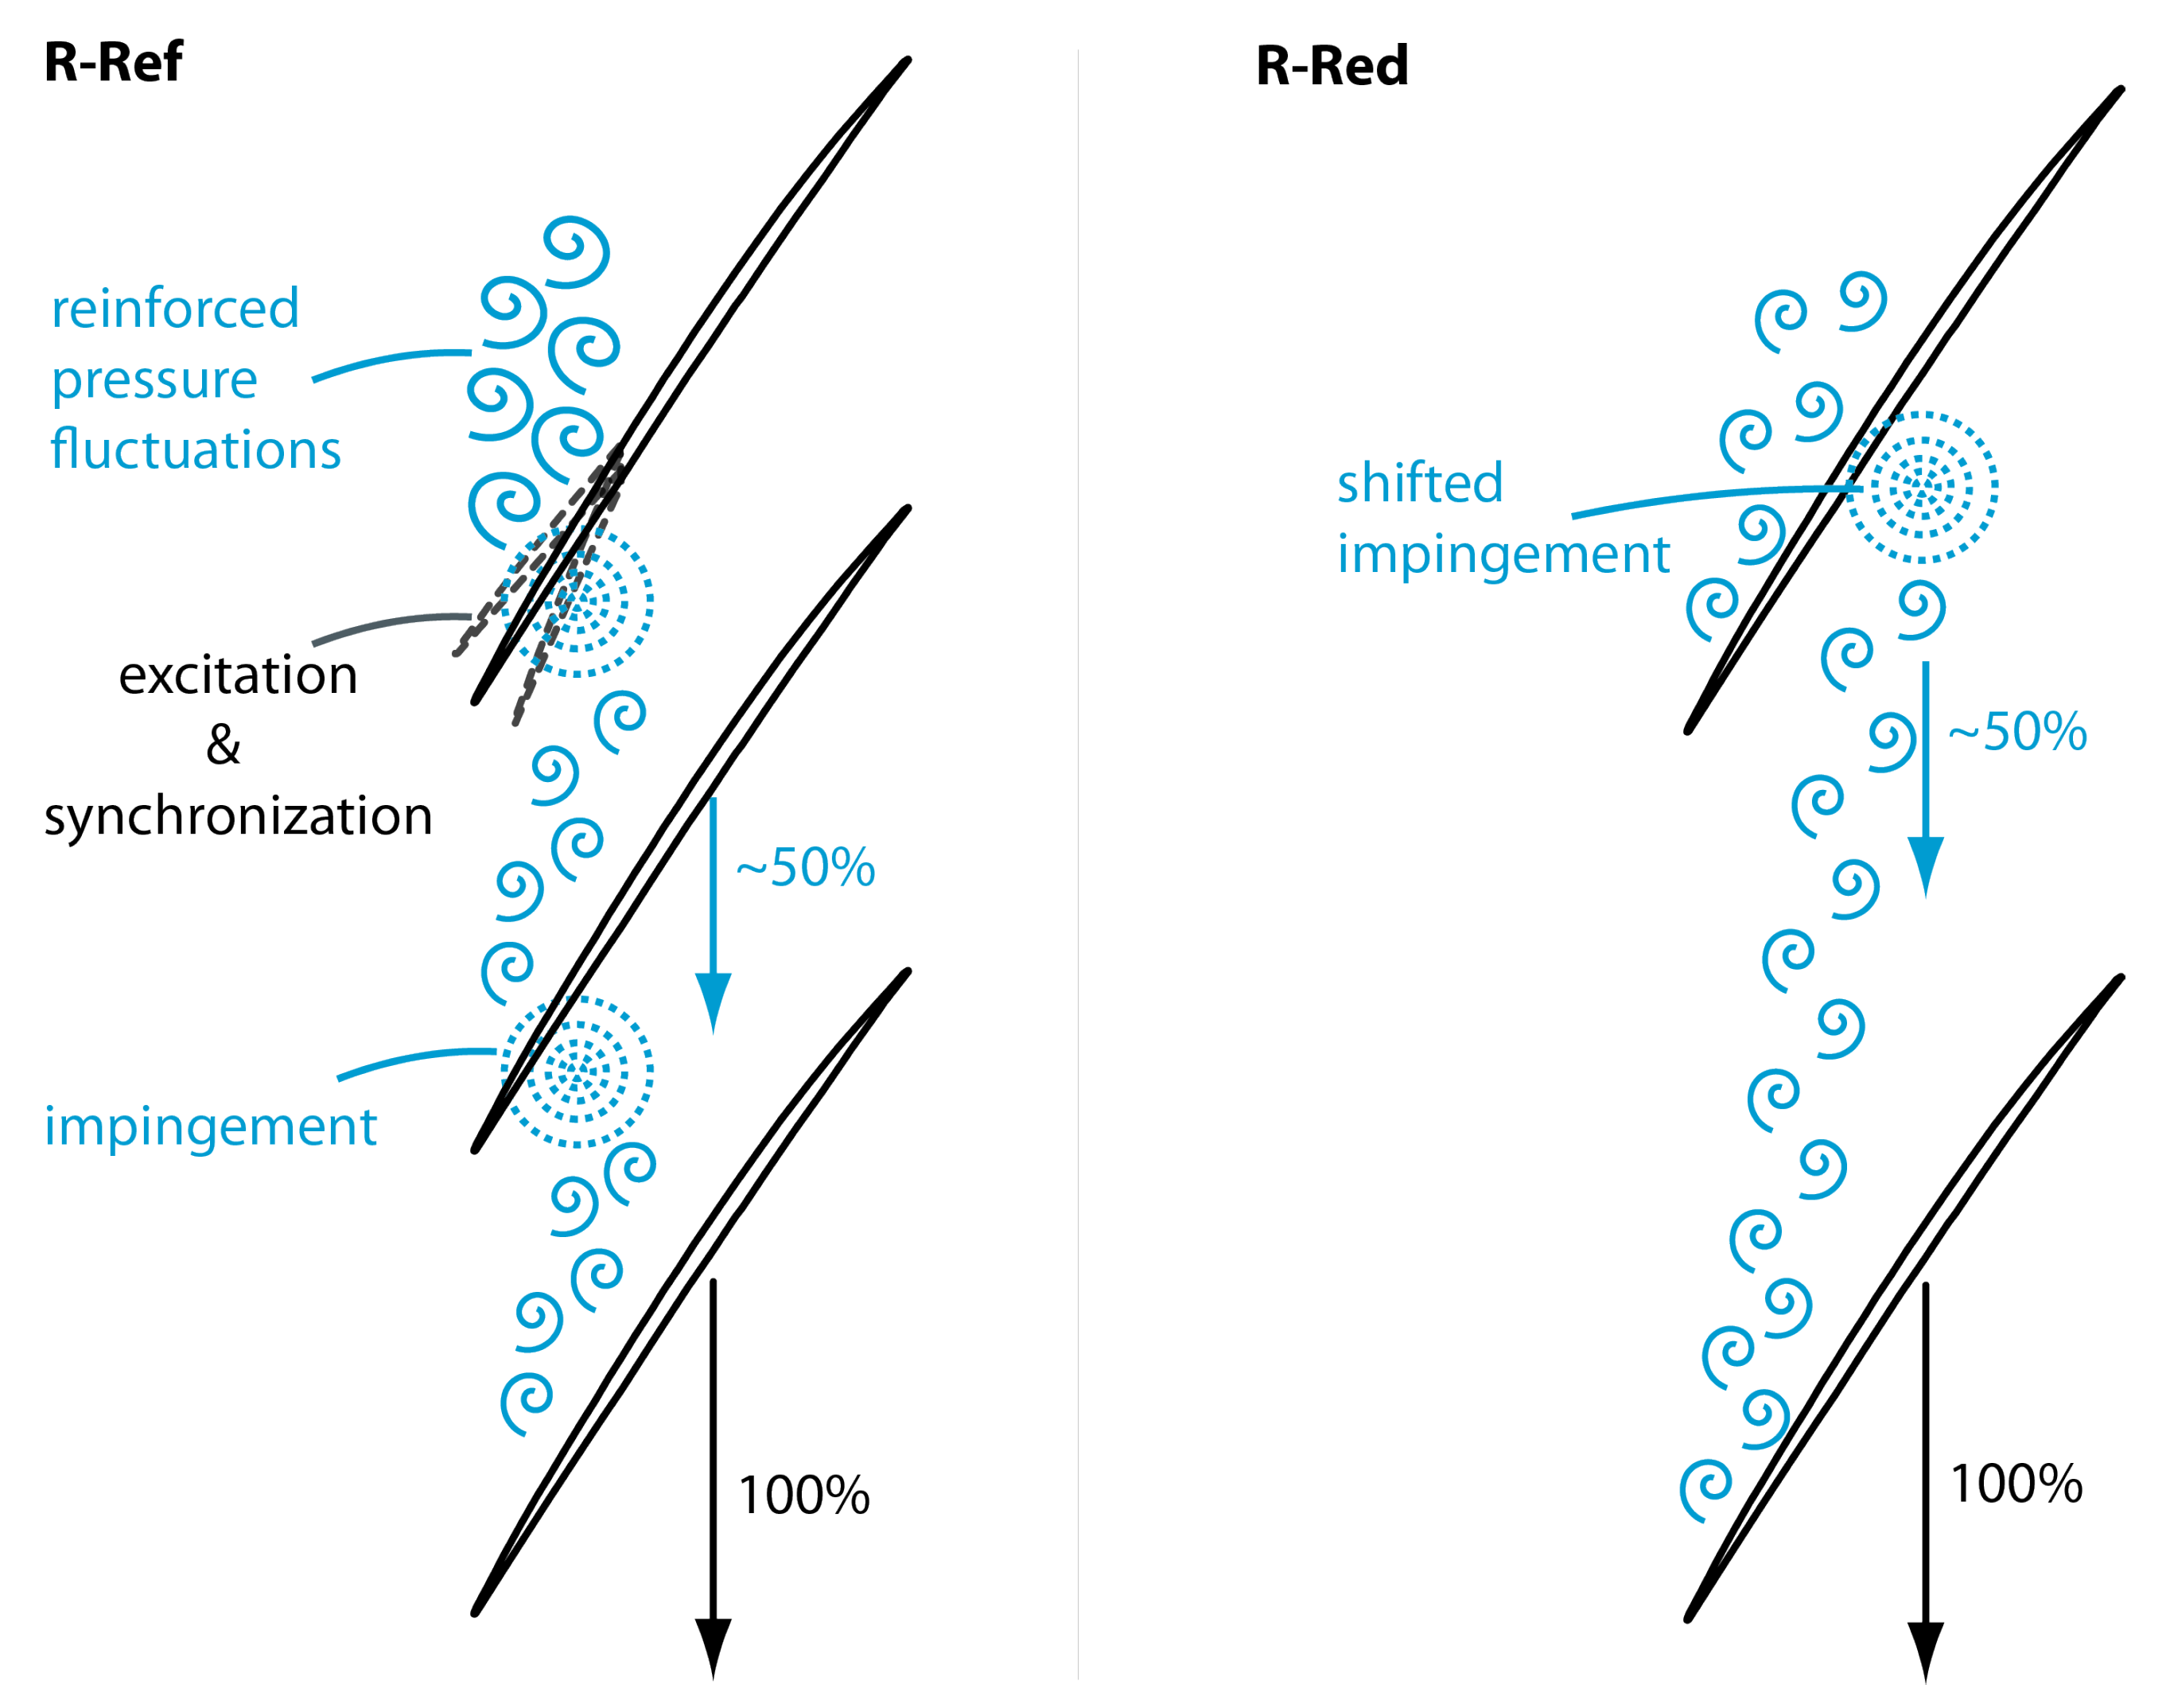
7]. The disturbances primarily occur and propagate within a sector at about 25% axial chord length downstream of the leading edge. Hence, impinging the adjacent blade can result in forward spillage, triggering fluctuations in the adjacent passage, leading to radial vortices respectively, as well as amplified excitation of blade vibration.

3.3. Aeromechanics

In many cases, the operating limit along the entire operating range is set by a combination of stall and blade vibration. Those blade vibrations are almost always excited during transient operation and partially exceed the defined limits for safe operation. In addition, a change in nodal diameter for different speed lines and VIGV schedules, as well as a shift due to the blade count is evident (see [11]). Based on the above-noted global trends and variation in aeroelastic behavior at the stability limits, it is reasonable to determine the unsteady aerodynamics at blade tip and its interaction with the blade vibration in more detail.
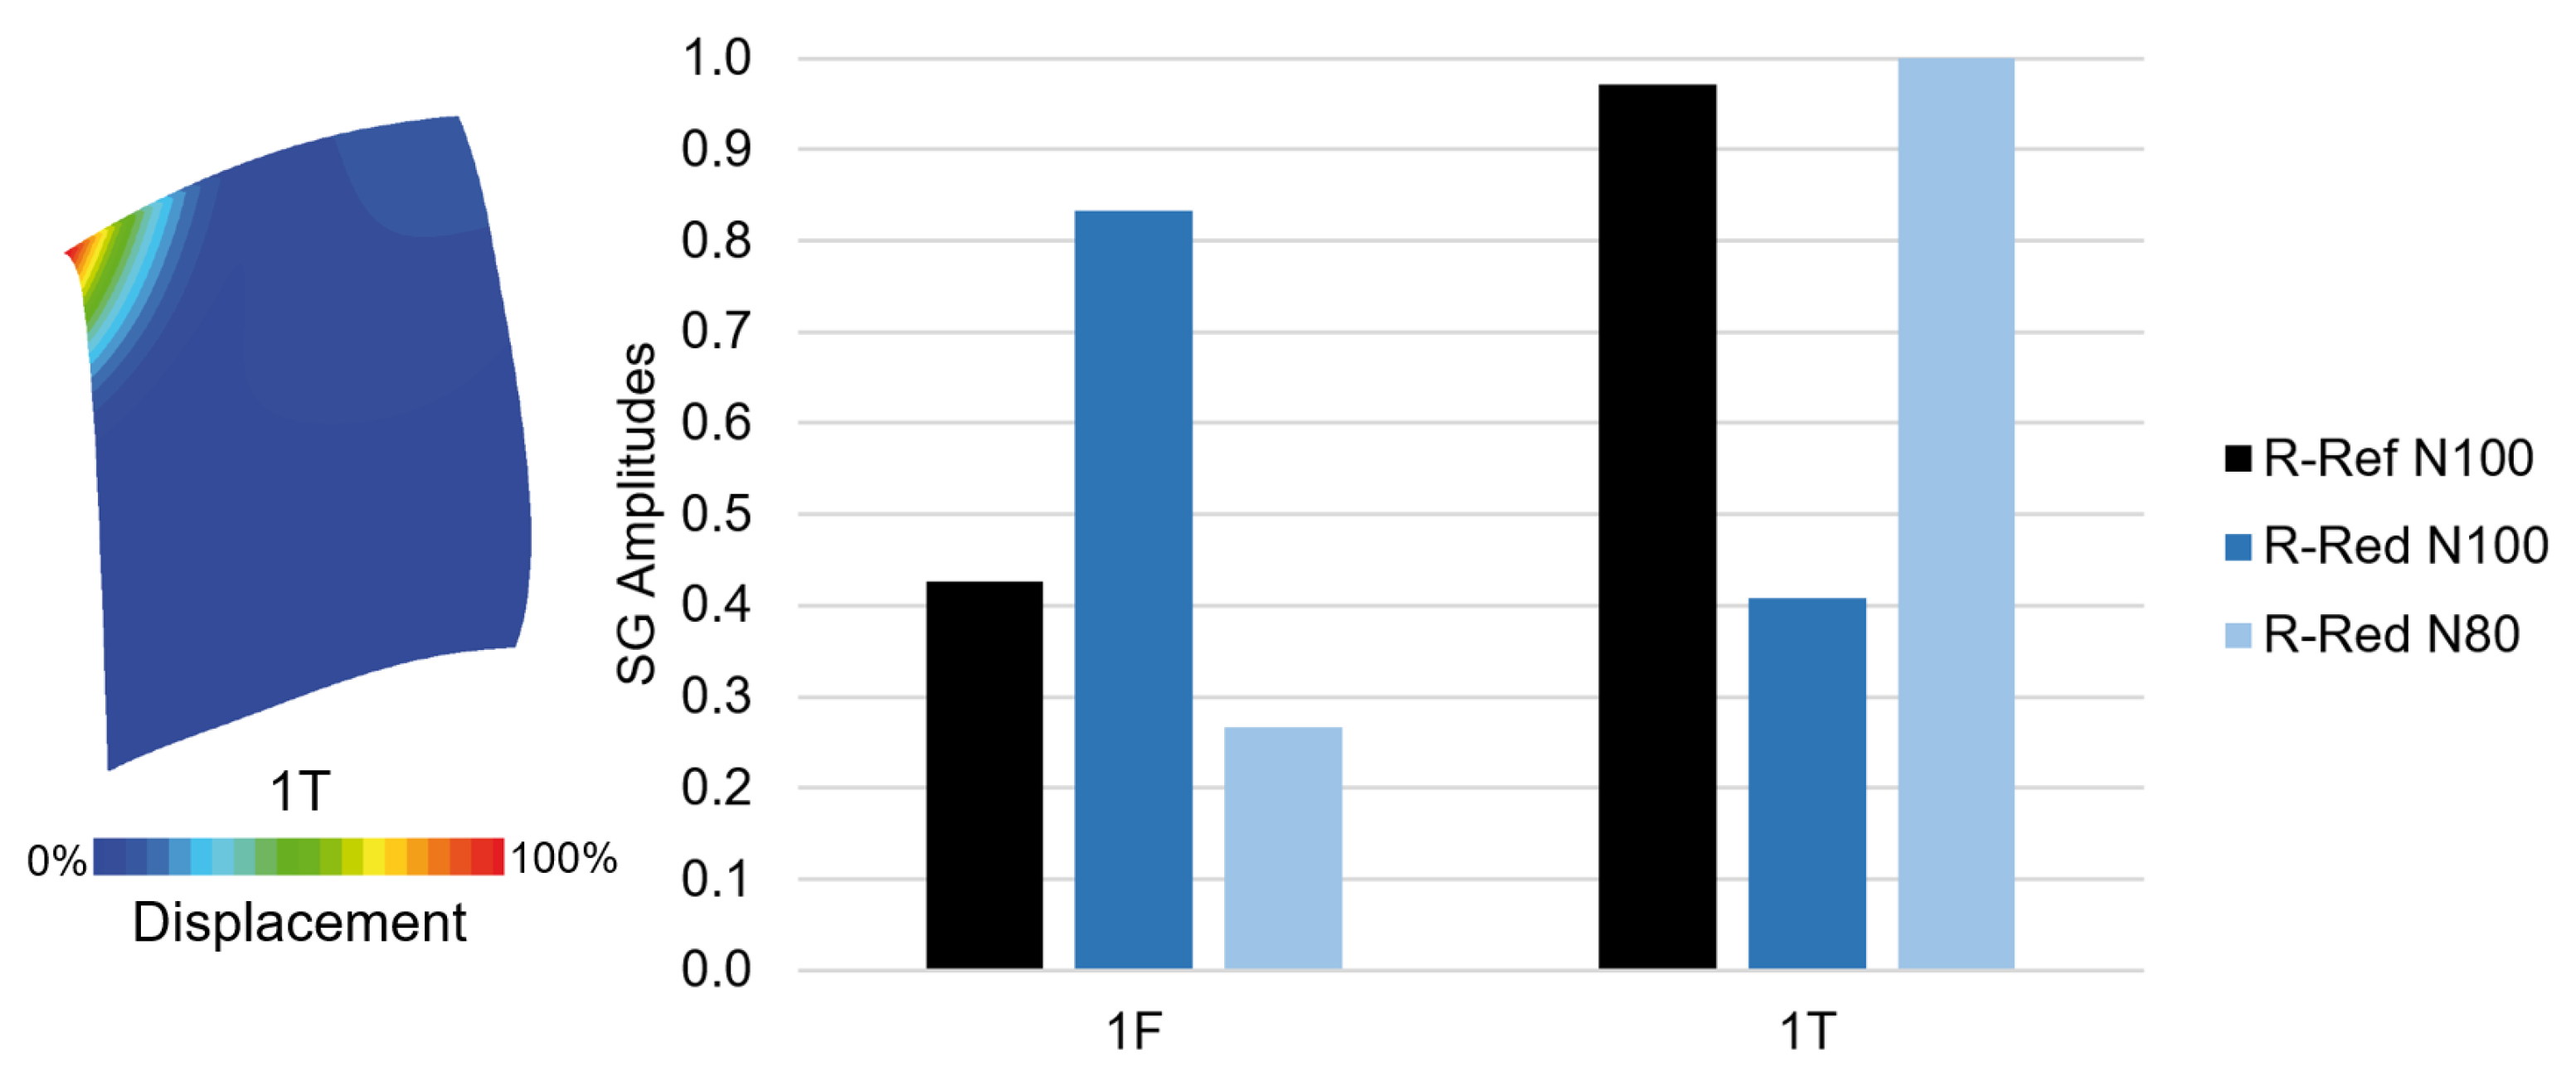
Figure 8 illustrates the normalized strain gauge amplitudes during stall inception, both at transonic and subsonic operating conditions as well as for both rotor configurations. It is based on the maximum amplitudes of the first flap (1F) and first torsional (1T) blade eigenmode prior to and during rotating stall. The chart shows significant differences, comparing the rotor configurations and operating conditions. R-Ref shows a vulnerability to non-synchronous 1T blade vibration in the vicinity to the stability limit with slightly increased 1F amplitudes during rotating stall. The 1T blade vibration can be traced to a fluid-structure-interaction, excitation and synchronization with circumferentially traveling aerodynamic disturbances, as shown before. For detailed experimental and numerical analysis refer to [10,12].
For R-Red at design speed, a different behavior is apparent and the strain gauge amplitudes verify the aforementioned observations considering the shifted trajectory of aerodynamic disturbances within the rotor and its effect on fluid-structure-interaction. Taking the mode shape of a torsional blade mode (compare Figure 8) and especially its particular deflections at the blade tip into account, the shifted aerodynamic disturbances seem to reduce the potential to excite blade vibrations. Furthermore, the first flap vibrations during rotating stall are amplified. For part speed, the stability limiting mechanism seems to change and is comparable to R-Ref.
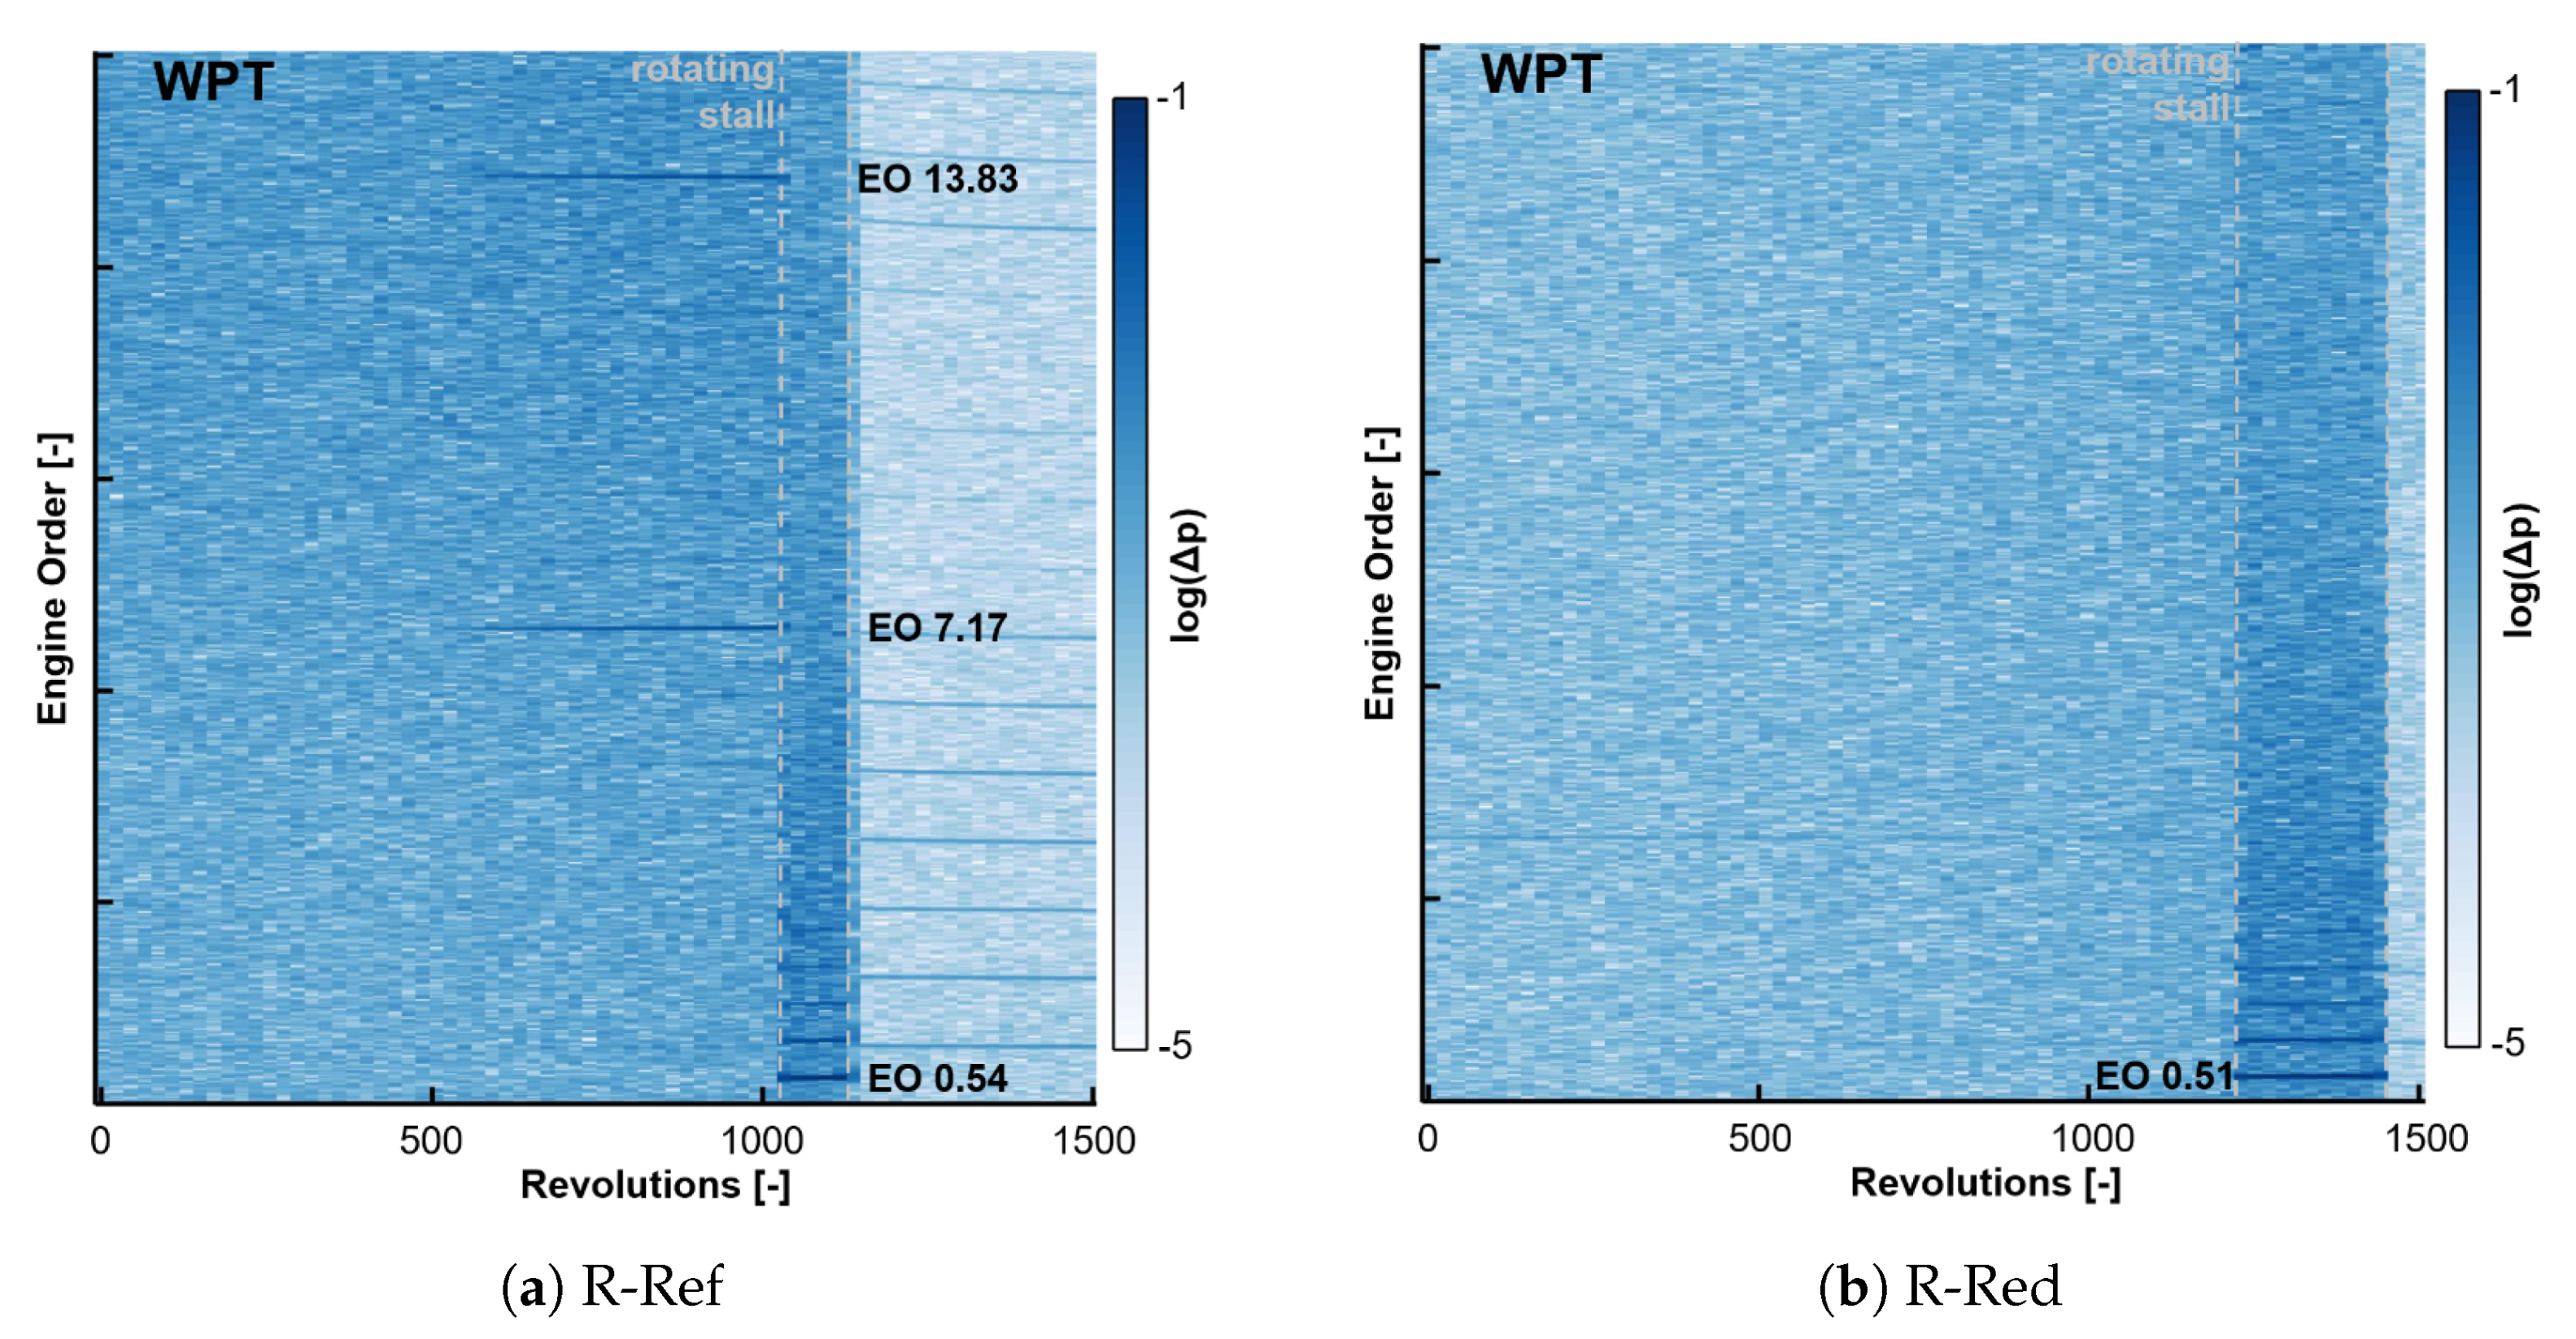
The spectra of the WPT signal support the discussed findings, as shown in Figure 9 for both rotors during stall inception at design speed. For R-Ref two distinct peaks prior to stall (rotating stall is marked by a dashed line) can be referred to fluid-structure-coupling, as typically postulated by literature. EO 13.83 can be assigned to a ND+8 BLISK vibration (considering SG data, not shown for brevity) interacting with 13 aerodynamic cells propagating in circumferential pattern at distinct speeds. Additionally, the cell speed during rotating stall can be depicted as 54% rotor speed. Considering R-Red, no distinct peaks, indicating fluid-structure-interaction are visible prior to the aerodynamic stability limit, rotating stall (at EO 0.51) respectively. Again, this proves the aforementioned aeromechanical behavior of the blade count reduced rotor.
At part speed operating conditions with a particularly adjusted VIGV schedule, R-Red shows an increased vulnerability to 1T blade vibration in the vicinity to the stability limit (compare Figure 8). This behavior can again be explained by the unsteady wall pressure data and related analysis. Considering the axial distribution within the rotor passage (Figure 10a), the detected disturbances are located further upstream compared to design speed, basically within the leading edge plane. Thus, on the one hand it is possible to determine cell speeds with the circumferential distributed WPT sensors, resulting in about half the rotor speed, as plotted in Figure 10b. On the other hand, as for R-Ref, those disturbances enable a fluid-structure-interaction, hence excitation of 1T blade vibration and coupling with a particular BLISK mode (compare Figure 8).

4. Conclusions

The conducted experimental study with compulsory simulations, focusing on the aerodynamic and aeroelastic effects due to a reduced rotor blade count, presents promising results with respect to steady aerodynamics and performance capabilities as well as distinct influences affecting the fluid-structure-interaction in the vicinity of the stability limits.
Summarizing the above-described analysis, an aeroelastic characterization of the blade count reduced rotor can be presented. Therefore, results for subsonic and transonic operating conditions are taken into account, indicating a change in mechanism. At design speed rotating stall limits the stable operating range, whereas part speed operation with adjusted pre-swirl results in amplified non-synchronous 1T blade vibration, hence an aeromechanical stability limit. For both rotors low-pressure spots, indicating aerodynamic disturbances, can be detected for steady state and transient operation close to the stability limits, varying in count, size, speed and trajectory. Outstanding differences are apparent for the determined axial distribution of the aerodynamic disturbances within the rotor. For transonic operation with the reduced blade count, the trajectory of aerodynamic cells is located further downstream within the rotor passage, compared to the reference case. Only a few percent are detected within the leading edge plane. Due to the reduced blade count, and thus increased blade pitch, the aerodynamic disturbances have a longer propagation period through the passage, hence are carried further downstream by the axial momentum of the main flow. In the case of subsonic operating conditions with adjusted VIGV schedule, disturbances predominantly propagate within about 25% downstream of the leading edge. Furthermore, aerodynamic disturbances are also affected by pre-swirl variations due to particular VIGV settings (not shown for brevity).
As schematically shown in Figure 11, the shifted trajectory affects the aeroelastic behavior and corresponding fluid-structure-coupling. Since the propagating aerodynamic disturbances impinge the adjacent rotor blades within a region close to the leading edge, excitation and interaction with particular BLISK modes, e.g., first torsional, can occur. This results in reinforced aerodynamic fluctuations, propagating in certain circumferential pattern and speeds, enabling a synchronization with the BLISK and therefore amplified blade vibration. The shifted trajectory seems to degrade potential excitation and synchronization, hence blade vibration prior to the aerodynamic stability limit.
Ultimately, this study contributes to a better understanding of the aeroelastic effects and related fluid-structure-coupling as well as potential influencing parameters of axial compressors.

Author Contributions

Conceptualization, D.F., D.M. and M.J.; funding acquisition, H.-P.S. and B.B.; investigation, D.F., D.M., M.J. and T.G.; methodology, D.F., D.M. and M.J.; project administration, H.-P.S. and B.B.; supervision, H.-P.S.; visualization, D.F., D.M. and M.J.; writing—original draft, D.F.; writing—review & editing, D.F., D.M., M.J., T.G. and B.B. All authors have read and agreed to the published version of the manuscript.

Funding

This work was funded in the frame of LUFO IV Aeroblisk (20T0901A) and EU FP7 E-Break (314366) as well as by Rolls-Royce Deutschland Ltd. & Co. KG. The authors gratefully acknowledge the financial support and thank Rolls-Royce Deutschland Ltd. & Co. KG for the permission to publish this paper.

Data Availability Statement

The data presented in this study are intellectual property of the industry partner Rolls-Royce Deutschland Ltd. & Co. KG and therefore restricted to share publicly.

Acknowledgments

The support and helpful discussions with the TU Darmstadt compressor team is very much appreciated. The authors would also like to acknowledge the continuous support of the compressor aerodynamics and aeroelasticity group at Rolls-Royce Deutschland Ltd. & Co. KG.

Conflicts of Interest

The authors declare no conflict of interest.

Nomenclature

The following nomenclature is used in this manuscript:
1FFirst Flap Blade ModeRVRadial Vortex
1TFirst Torsional Blade ModeSGStrain Gauge
BLISKBlade Integrated DiskTCDTransonic Compressor Darmstadt
EOEngine OrderVIGVVariable Inlet Guide Vane
N100Design SpeedWPTWall Pressure Transducers
NCNear Choke OperationDDiffusion Factor
NDNodal DiameterhChannel Height
NSNear Stall ψ Pressure Rise Coefficient
NSVNon-Synchronous Vibration ω Radial Vorticity
PEPeak Efficiency Operation ζ Loss Coefficient
R-RedReduced Blade Count Rotor Δ Rotor Tip Blockage
R-RefReference Rotor Δ p Pressure Difference

References

  1. Dodds, J.; Vahdati, M. Rotating Stall Observations in a High Speed Compressor Part 1: Experimental Study. ASME J. Turbomach. 2015, 137, 051002. [Google Scholar] [CrossRef]
  2. Inoue, M.; Kuroumaru, M.; Tanino, T.; Furukawa, M. Propagation of Multiple Short-Length-Scale Stall Cells in an Axial Compressor Rotor. ASME J. Turbomach. 2000, 122, 45–54. [Google Scholar] [CrossRef]
  3. Yamada, K.; Kikuta, H.; Iwakiri, K.-I.; Furukawa, M.; Gunjishima, S. An Explanation for Flow Features of Spike-Type Stall Inception in an Axial Compressor Rotor. ASME J. Turbomach. 2013, 135, 021023. [Google Scholar] [CrossRef]
  4. Pullan, G.; Young, A.M.; Day, I.J.; Greitzer, E.M.; Spakovszky, Z.S. Origins and Structure of Spike-Type Rotating Stall. ASME J. Turbomach. 2015, 137, 051007. [Google Scholar] [CrossRef]
  5. Kielb, R.E.; Barter, J.W.; Thomas, J.P.; Hall, K.C. Blade Excitation by Aerodynamic Instabilities—A Compressor Blade Study. In Proceedings of the ASME Turbo Expo 2003, Power for Land, Sea, and Air, Atlanta, GE, USA, 16–19 June 2003. GT2003-38634. [Google Scholar]
  6. Besem, F.M.; Kamrass, J.D.; Thomas, J.P.; Tang, D.; Kielb, R.E. Vortex-induced vibration and frequency lock-in of an airfoil at high angles of attack. J. Fluids Eng. 2016, 138, 011204. [Google Scholar] [CrossRef]
  7. Brandstetter, C.; Jüngst, M.; Schiffer, H.-P. Measurements of Radial Vortices, Spill Forward, and Vortex Breakdown in a Transonic Compressor. ASME J. Turbomach. 2018, 140, 061004. [Google Scholar] [CrossRef]
  8. Stapelfeldt, S.; Brandstetter, C. Non-synchronous vibration in axial compressors: Lock-in mechanism and semi-analytical model. J. Sound Vib. 2020, 488, 115649. [Google Scholar] [CrossRef]
  9. Möller, D.; Jüngst, M.; Holzinger, F.; Brandstetter, C.; Schiffer, H.-P.; Leichtfuß, S. Mechanism of Nonsynchronous Blade Vibration in a Transonic Compressor Rig. ASME J. Turbomach. 2017, 139, 011002. [Google Scholar] [CrossRef]
  10. Möller, D.; Schiffer, H.-P. On the Mechanism of Spike Stall Inception and Near Stall Non-Synchronous Vibration in an Axial Compressor. In Proceedings of the ASME Turbo Expo 2020: Turbomachinery Technical Conference and Exposition, Virtual Conference, London, UK, 22–26 June 2020. GT2020-14711. [Google Scholar]
  11. Franke, D.; Jüngst, M.; Möller, D.; Schiffer, H.-P.; Giersch, T. Influence of pre-swirl, rotor speed and blade count on aeroelastic coupling mechanisms during stall inception of a transonic compressor. In Proceedings of the ASME Turbo Expo 2020: Turbomachinery Technical Conference and Exposition, Virtual Conference, London, UK, 22–26 June 2020. GT2020-15255. [Google Scholar]
  12. Jüngst, M. The Transonic Compressor with Non-Uniform Tip Clearance: Effects on Aerodynamics and Aeroelasticity. Ph.D. Thesis, Technical University of Darmstadt, Darmstadt, Germany, 2019. [Google Scholar]
  13. Sayma, A.I.; Vahdati, M.; Imregun, M. An Integrated Nonlinear Approach for Turbomachinery Forced Response Prediction. Part I: Formulation. J. Fluids Struct. 2000, 14, 87–101. [Google Scholar] [CrossRef] [Green Version]
  14. Vahdati, M.; Sayma, A.I.; Imregun, M. An Integrated Nonlinear Approach for Turbomachinery Forced Response Prediction. Part II: Case Studies. J. Fluids Struct. 2000, 14, 103–125. [Google Scholar] [CrossRef] [Green Version]
  15. Young, A.M.; Day, I.J.; Pullan, G. Stall warning by blade pressure signature analysis. ASME J. Turbomach. 2013, 135, 011033. [Google Scholar] [CrossRef]
Figure 1. Transonic Compressor Darmstadt and Instrumentation.
Ijtpp 06 00019 g001
Figure 2. Steady Aerodynamics and Compressor Performance at Design Speed (exp.).
Ijtpp 06 00019 g002
Figure 3. Aerodynamic Behavior of R-Ref and R-Red (num.).
Ijtpp 06 00019 g003
Figure 4. Unsteady Aerodynamics at Rotor Blade Tip for Design Speed Operating Conditions.
Ijtpp 06 00019 g004
Figure 5. Unsteady Pressure Field at Blade Tip for Near Stall Operation (exp.).
Ijtpp 06 00019 g005
Figure 6. Propagation Speed of Aerodynamic Disturbances at Design Speed.
Ijtpp 06 00019 g006
Figure 7. Relative Occurance of Aerodynamic Disturbances at Design Speed.
Ijtpp 06 00019 g007
Figure 8. Normalized SG Amplitudes during Stall Inception.
Ijtpp 06 00019 g008
Figure 9. WPT Spectra for Stall Inception at Design Speed.
Ijtpp 06 00019 g009
Figure 10. Characterization of Aerodynamic Disturbances for R-Ref at Part Speed Conditions.
Ijtpp 06 00019 g010
Figure 11. Schematic Sketch of Blade Count Influence on Fluid-Structure-Interaction.
Ijtpp 06 00019 g011
Publisher’s Note: MDPI stays neutral with regard to jurisdictional claims in published maps and institutional affiliations.

