Impact Performance and Bending Behavior of Carbon-Fiber Foam-Core Sandwich Composite Structures in Cold Arctic Temperature


Abstract
:1. Introduction
2. Materials and Methods
2.1. Materials
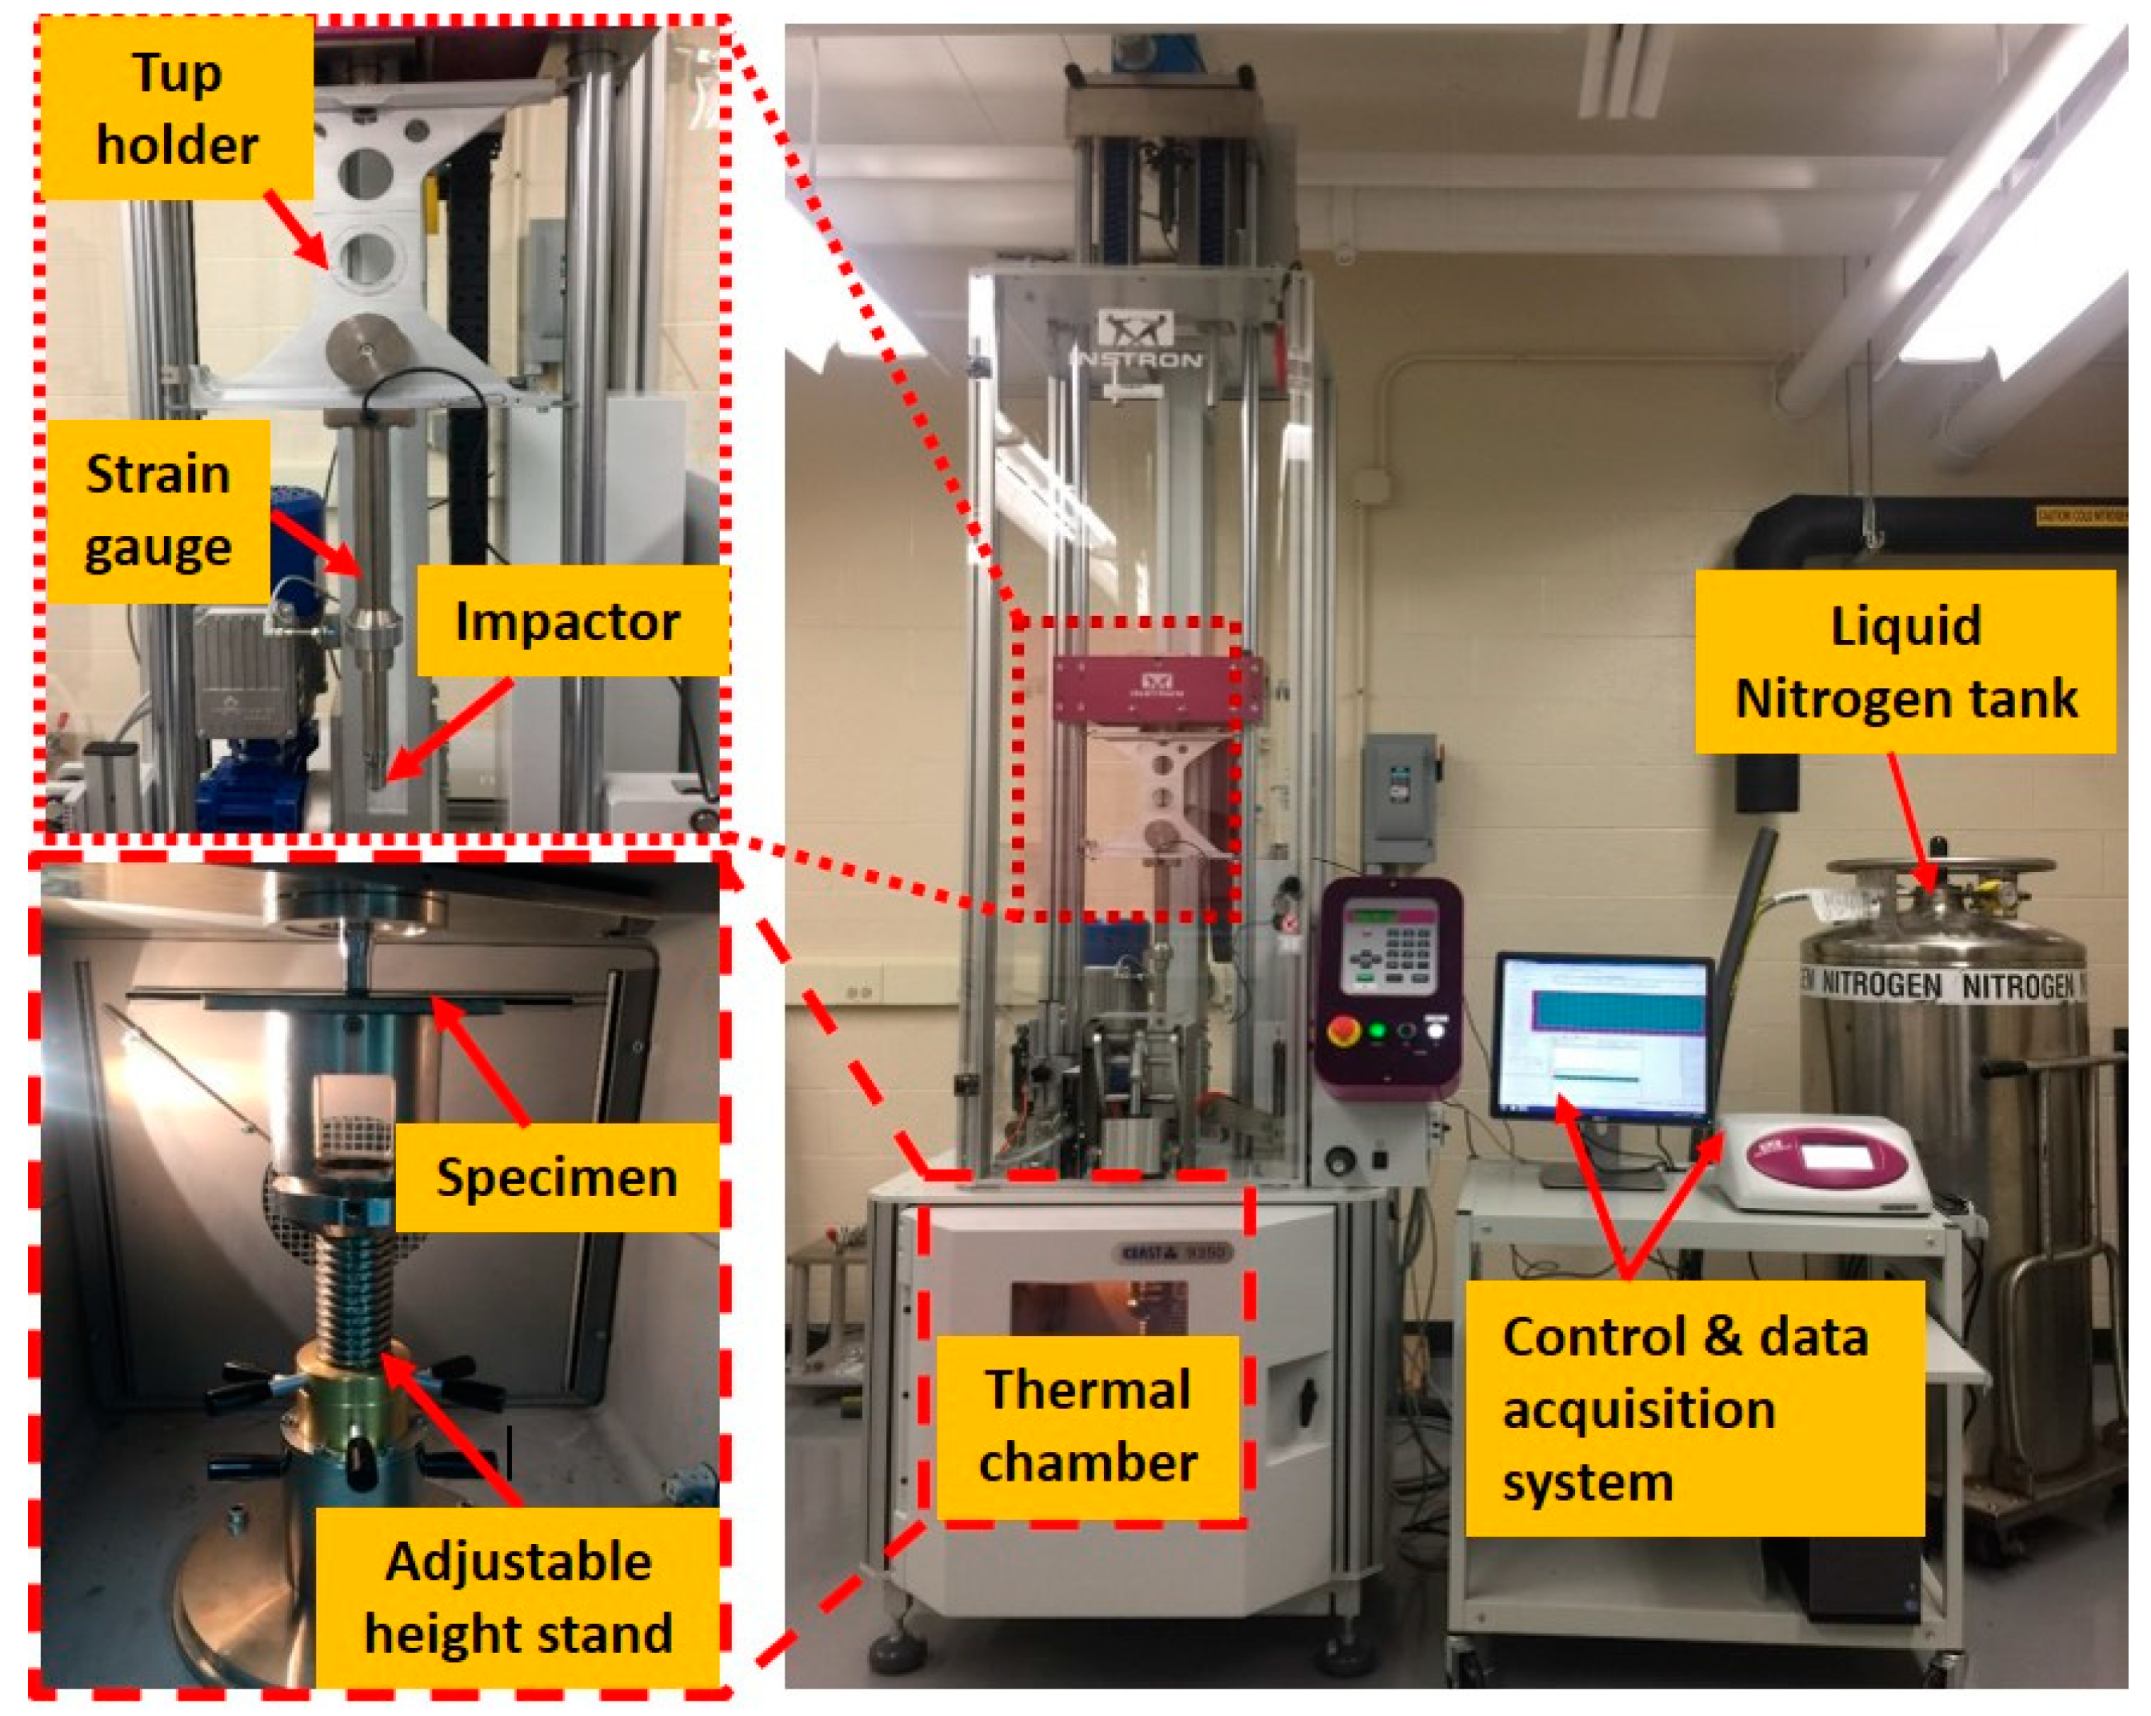
2.2. Impact Test
2.3. X-ray Tomography for Damage Inspection
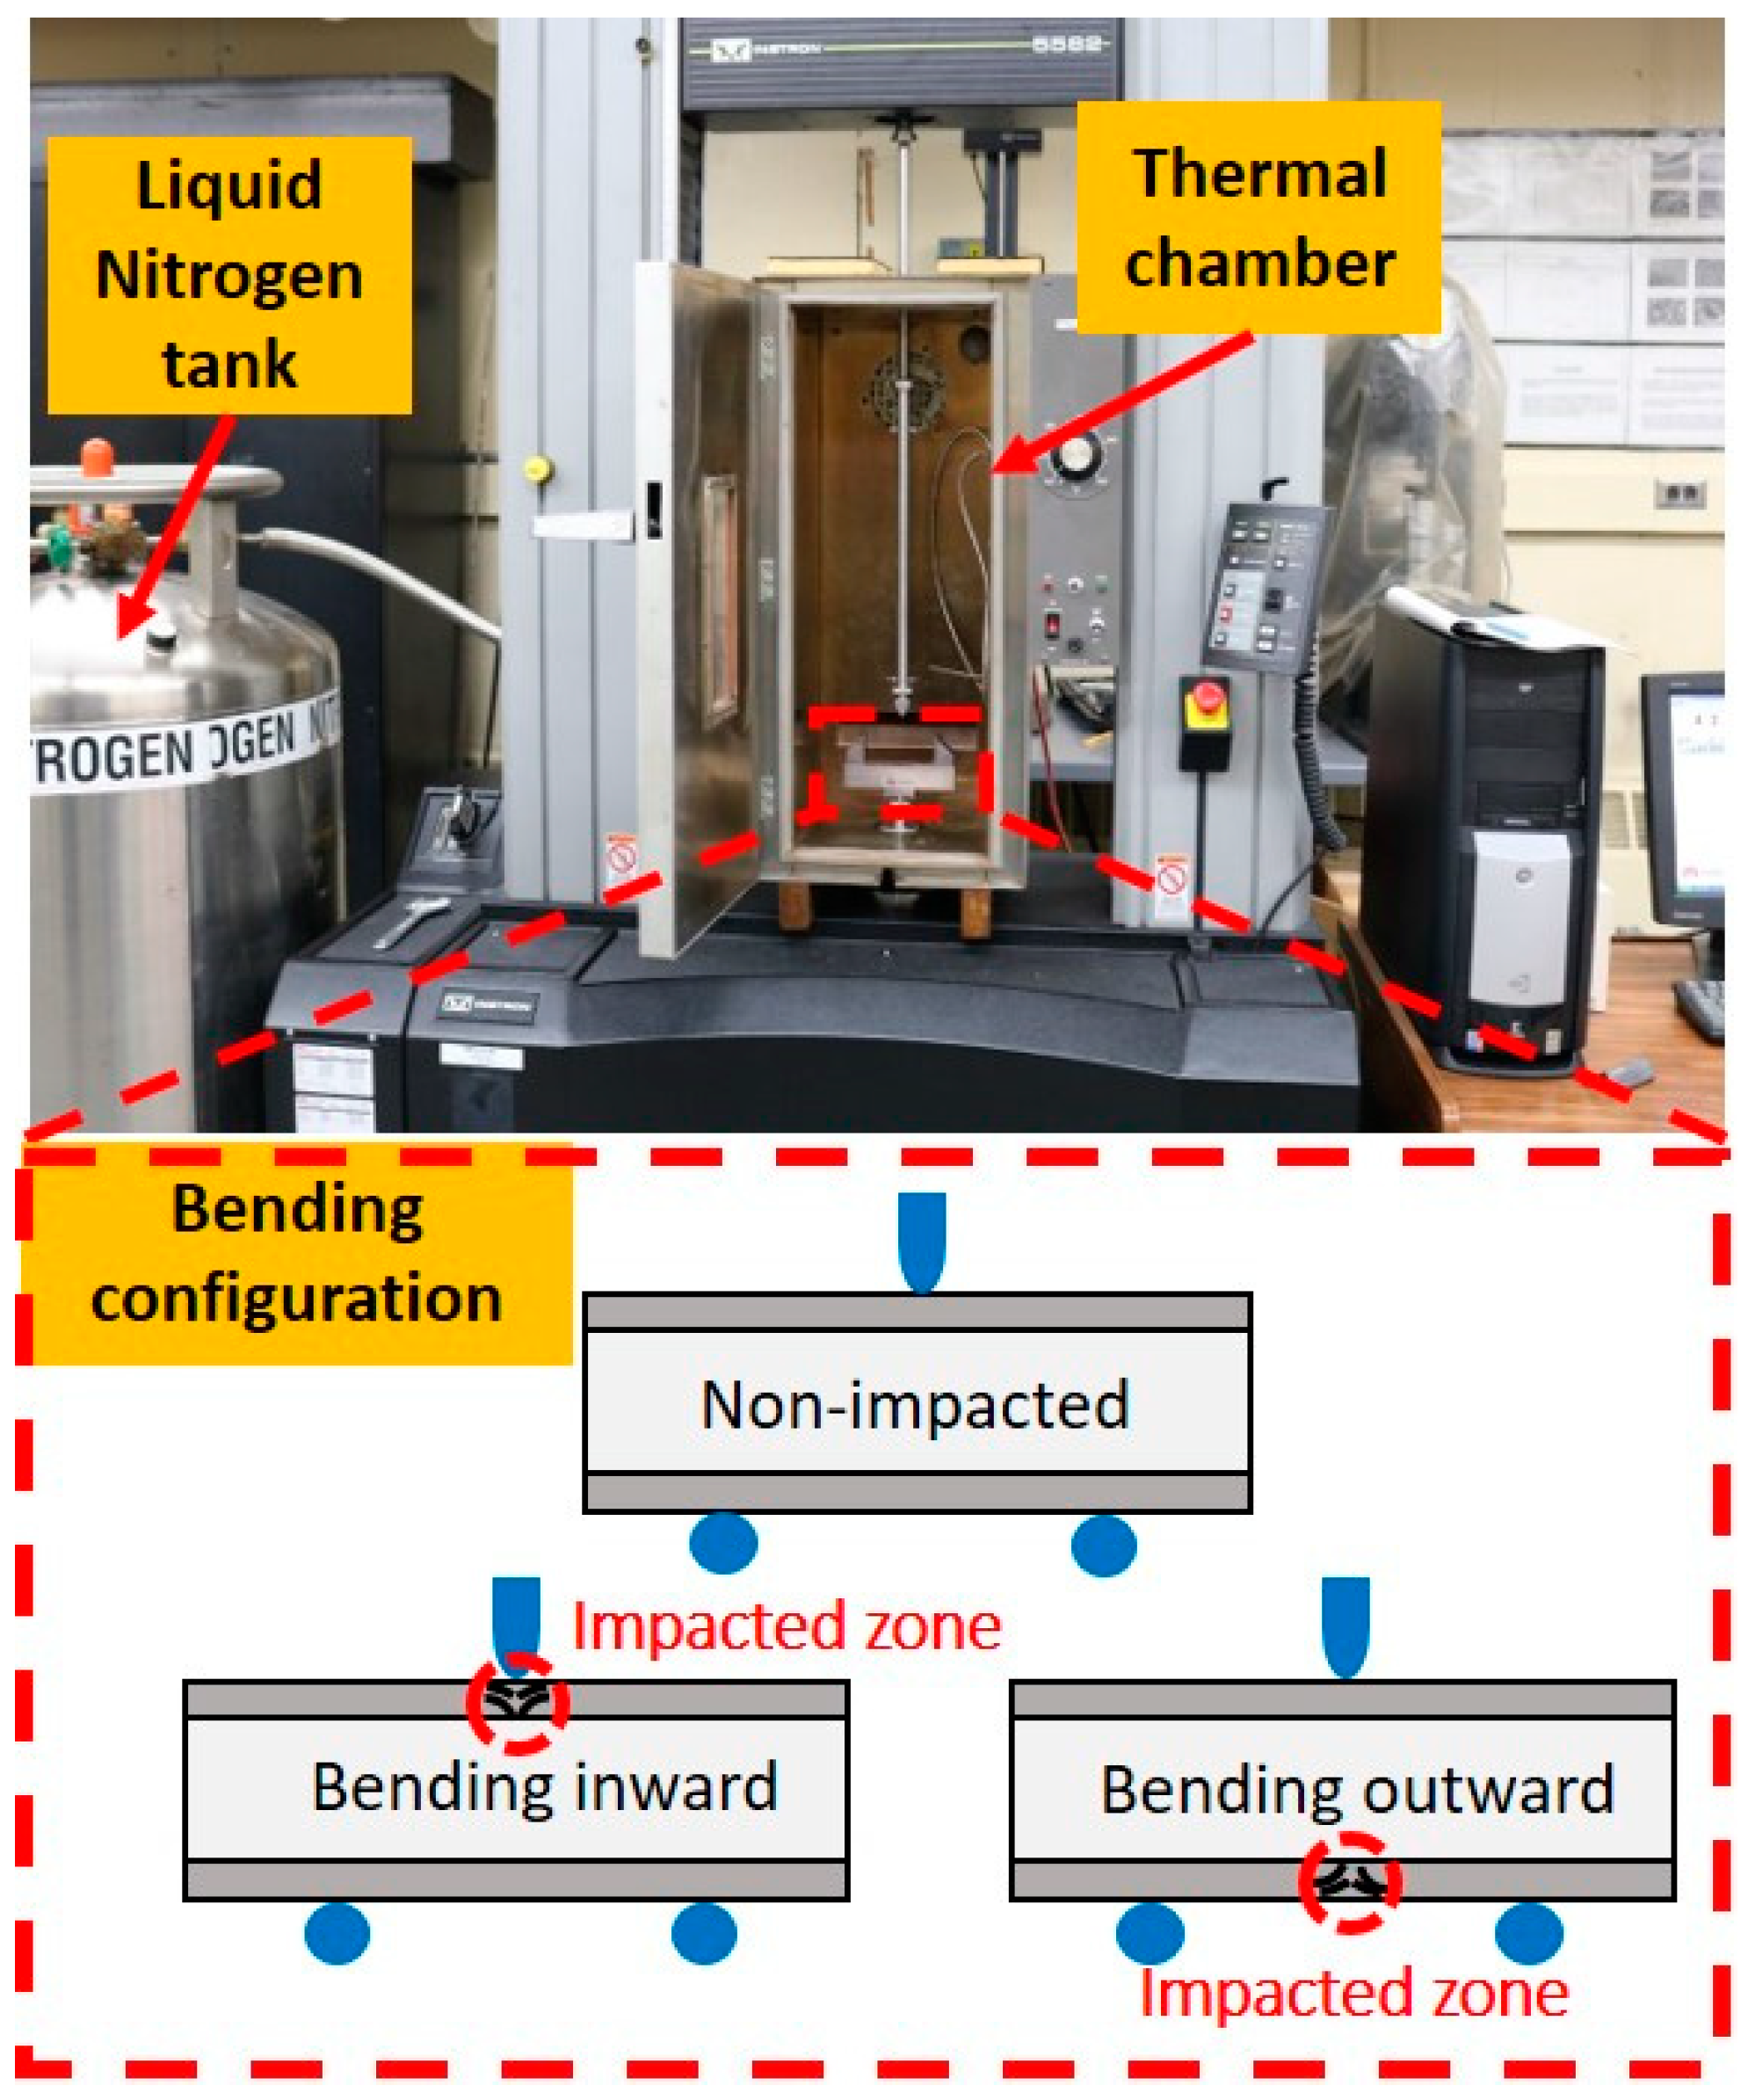
2.4. Post-Impact Three-Point Bending Test
2.5. Statistical Design of Experiment
3. Results and Discussion
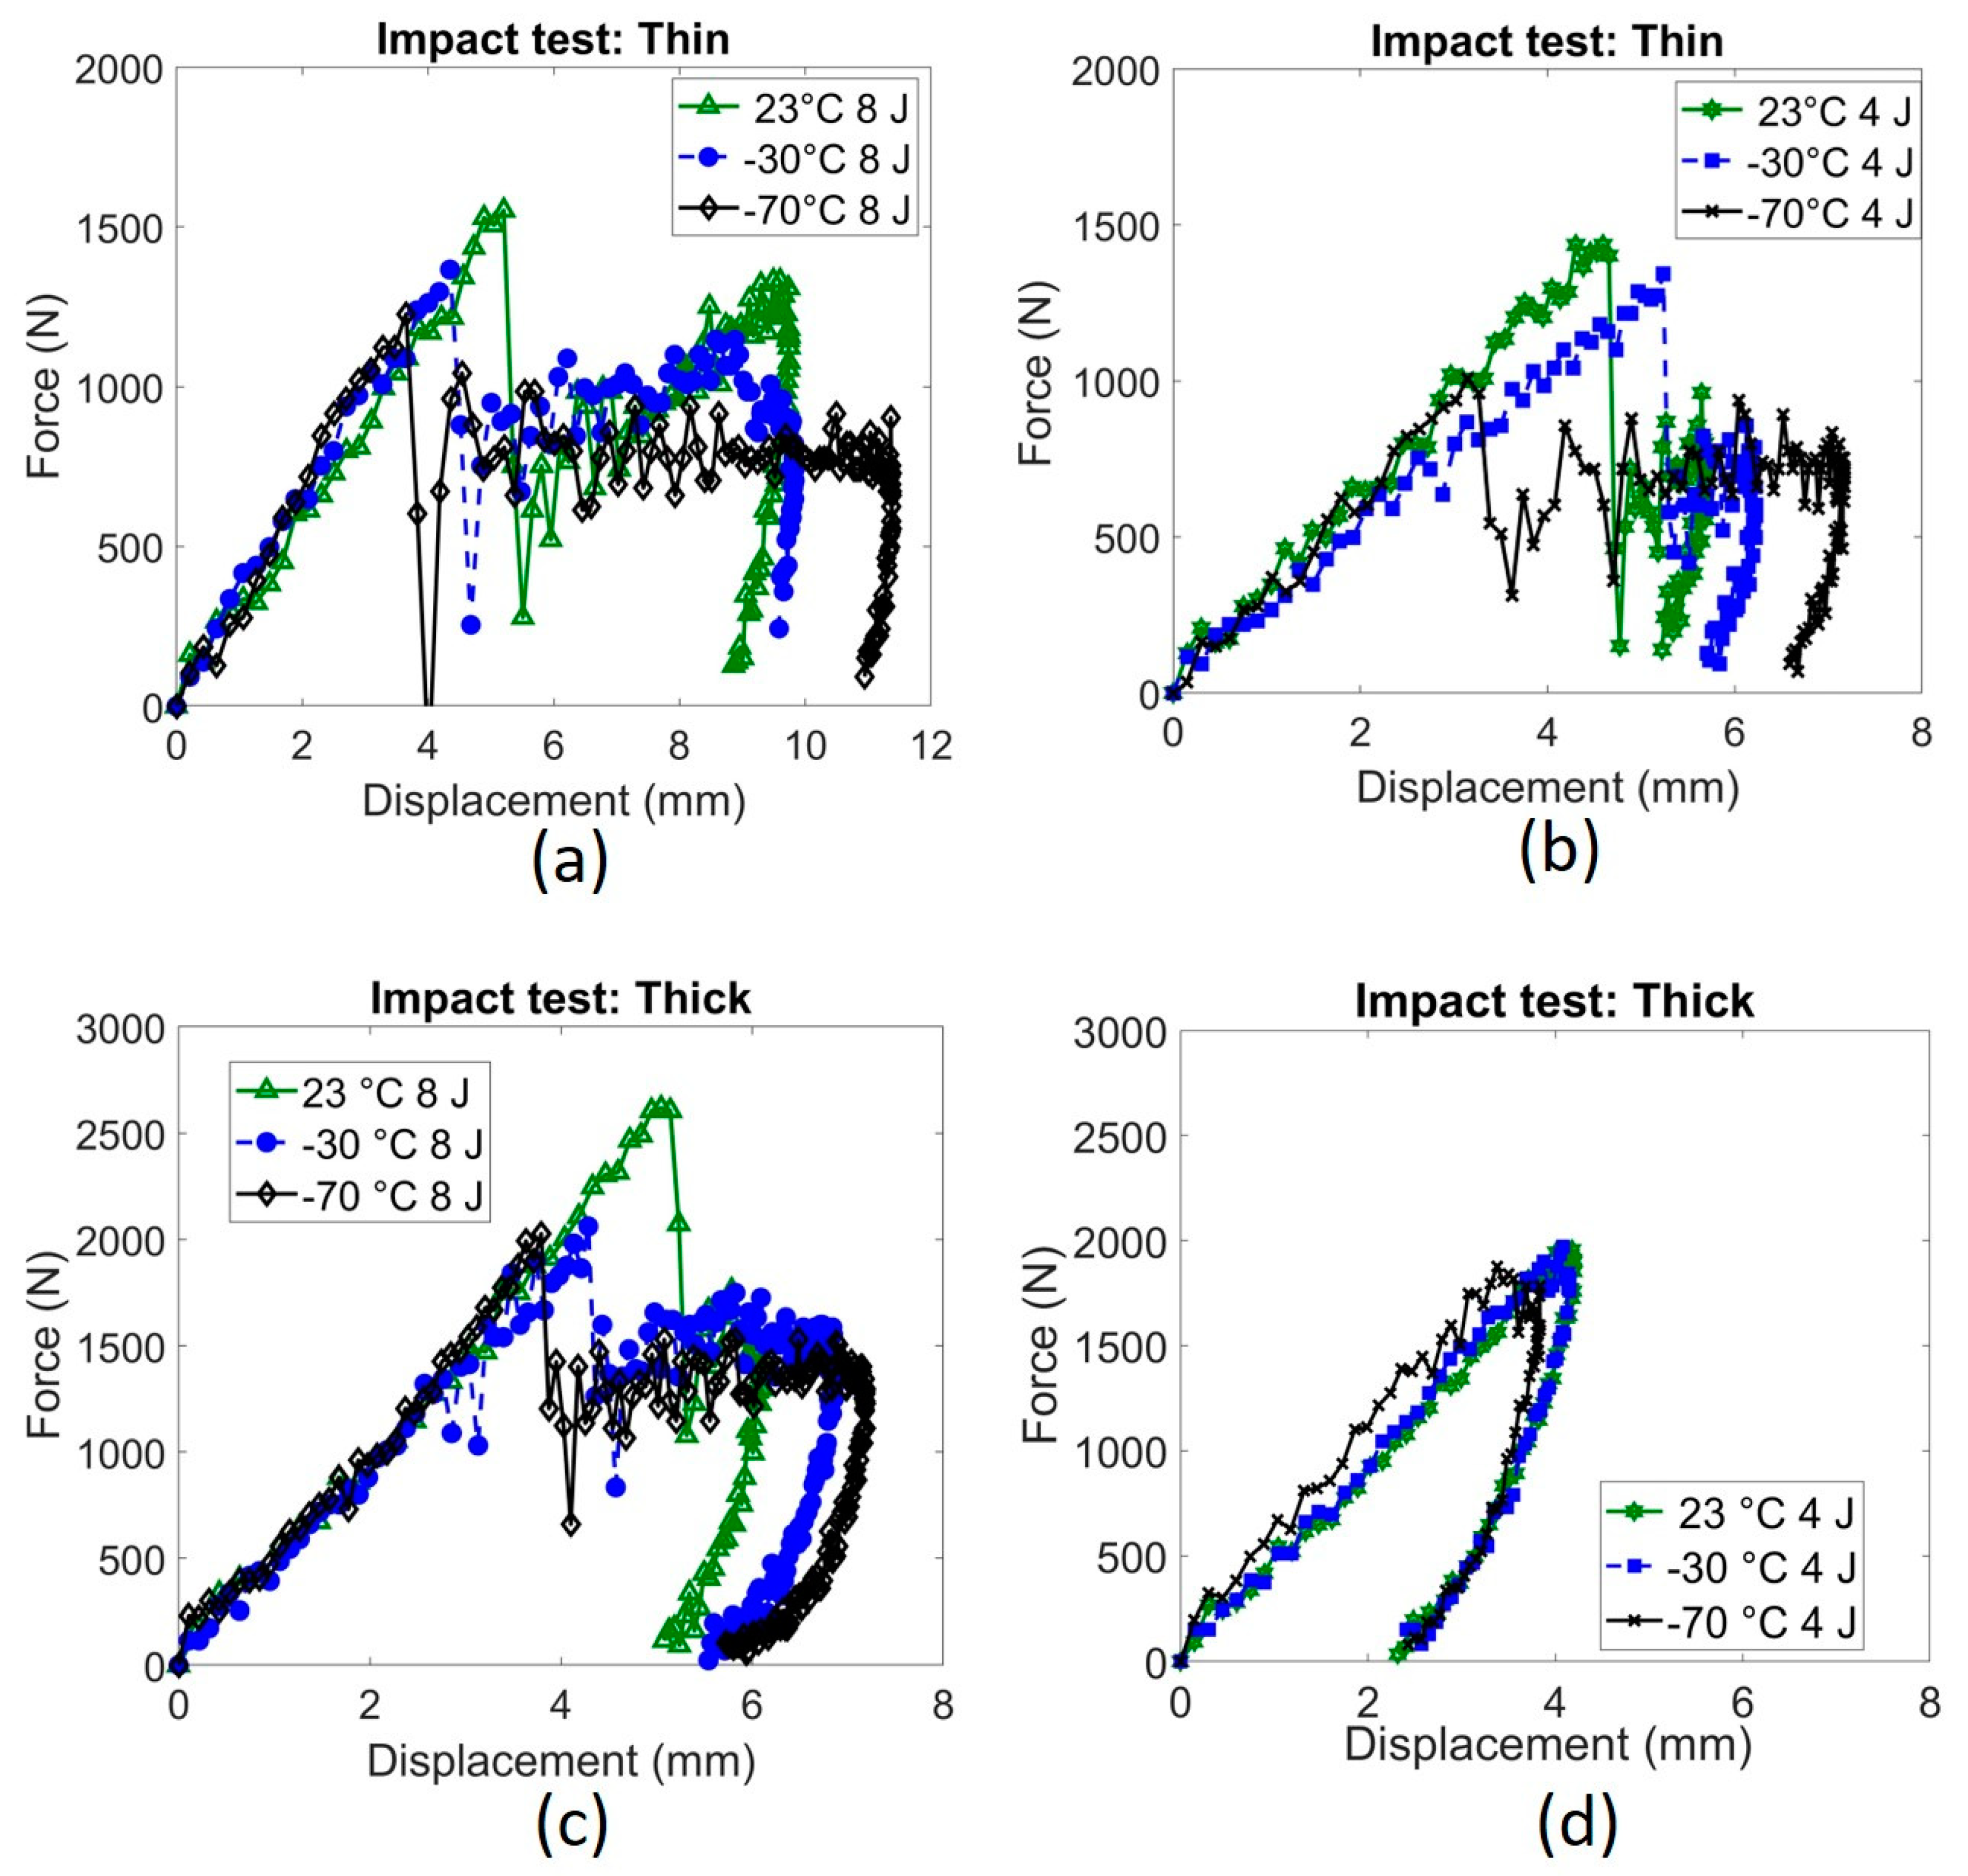
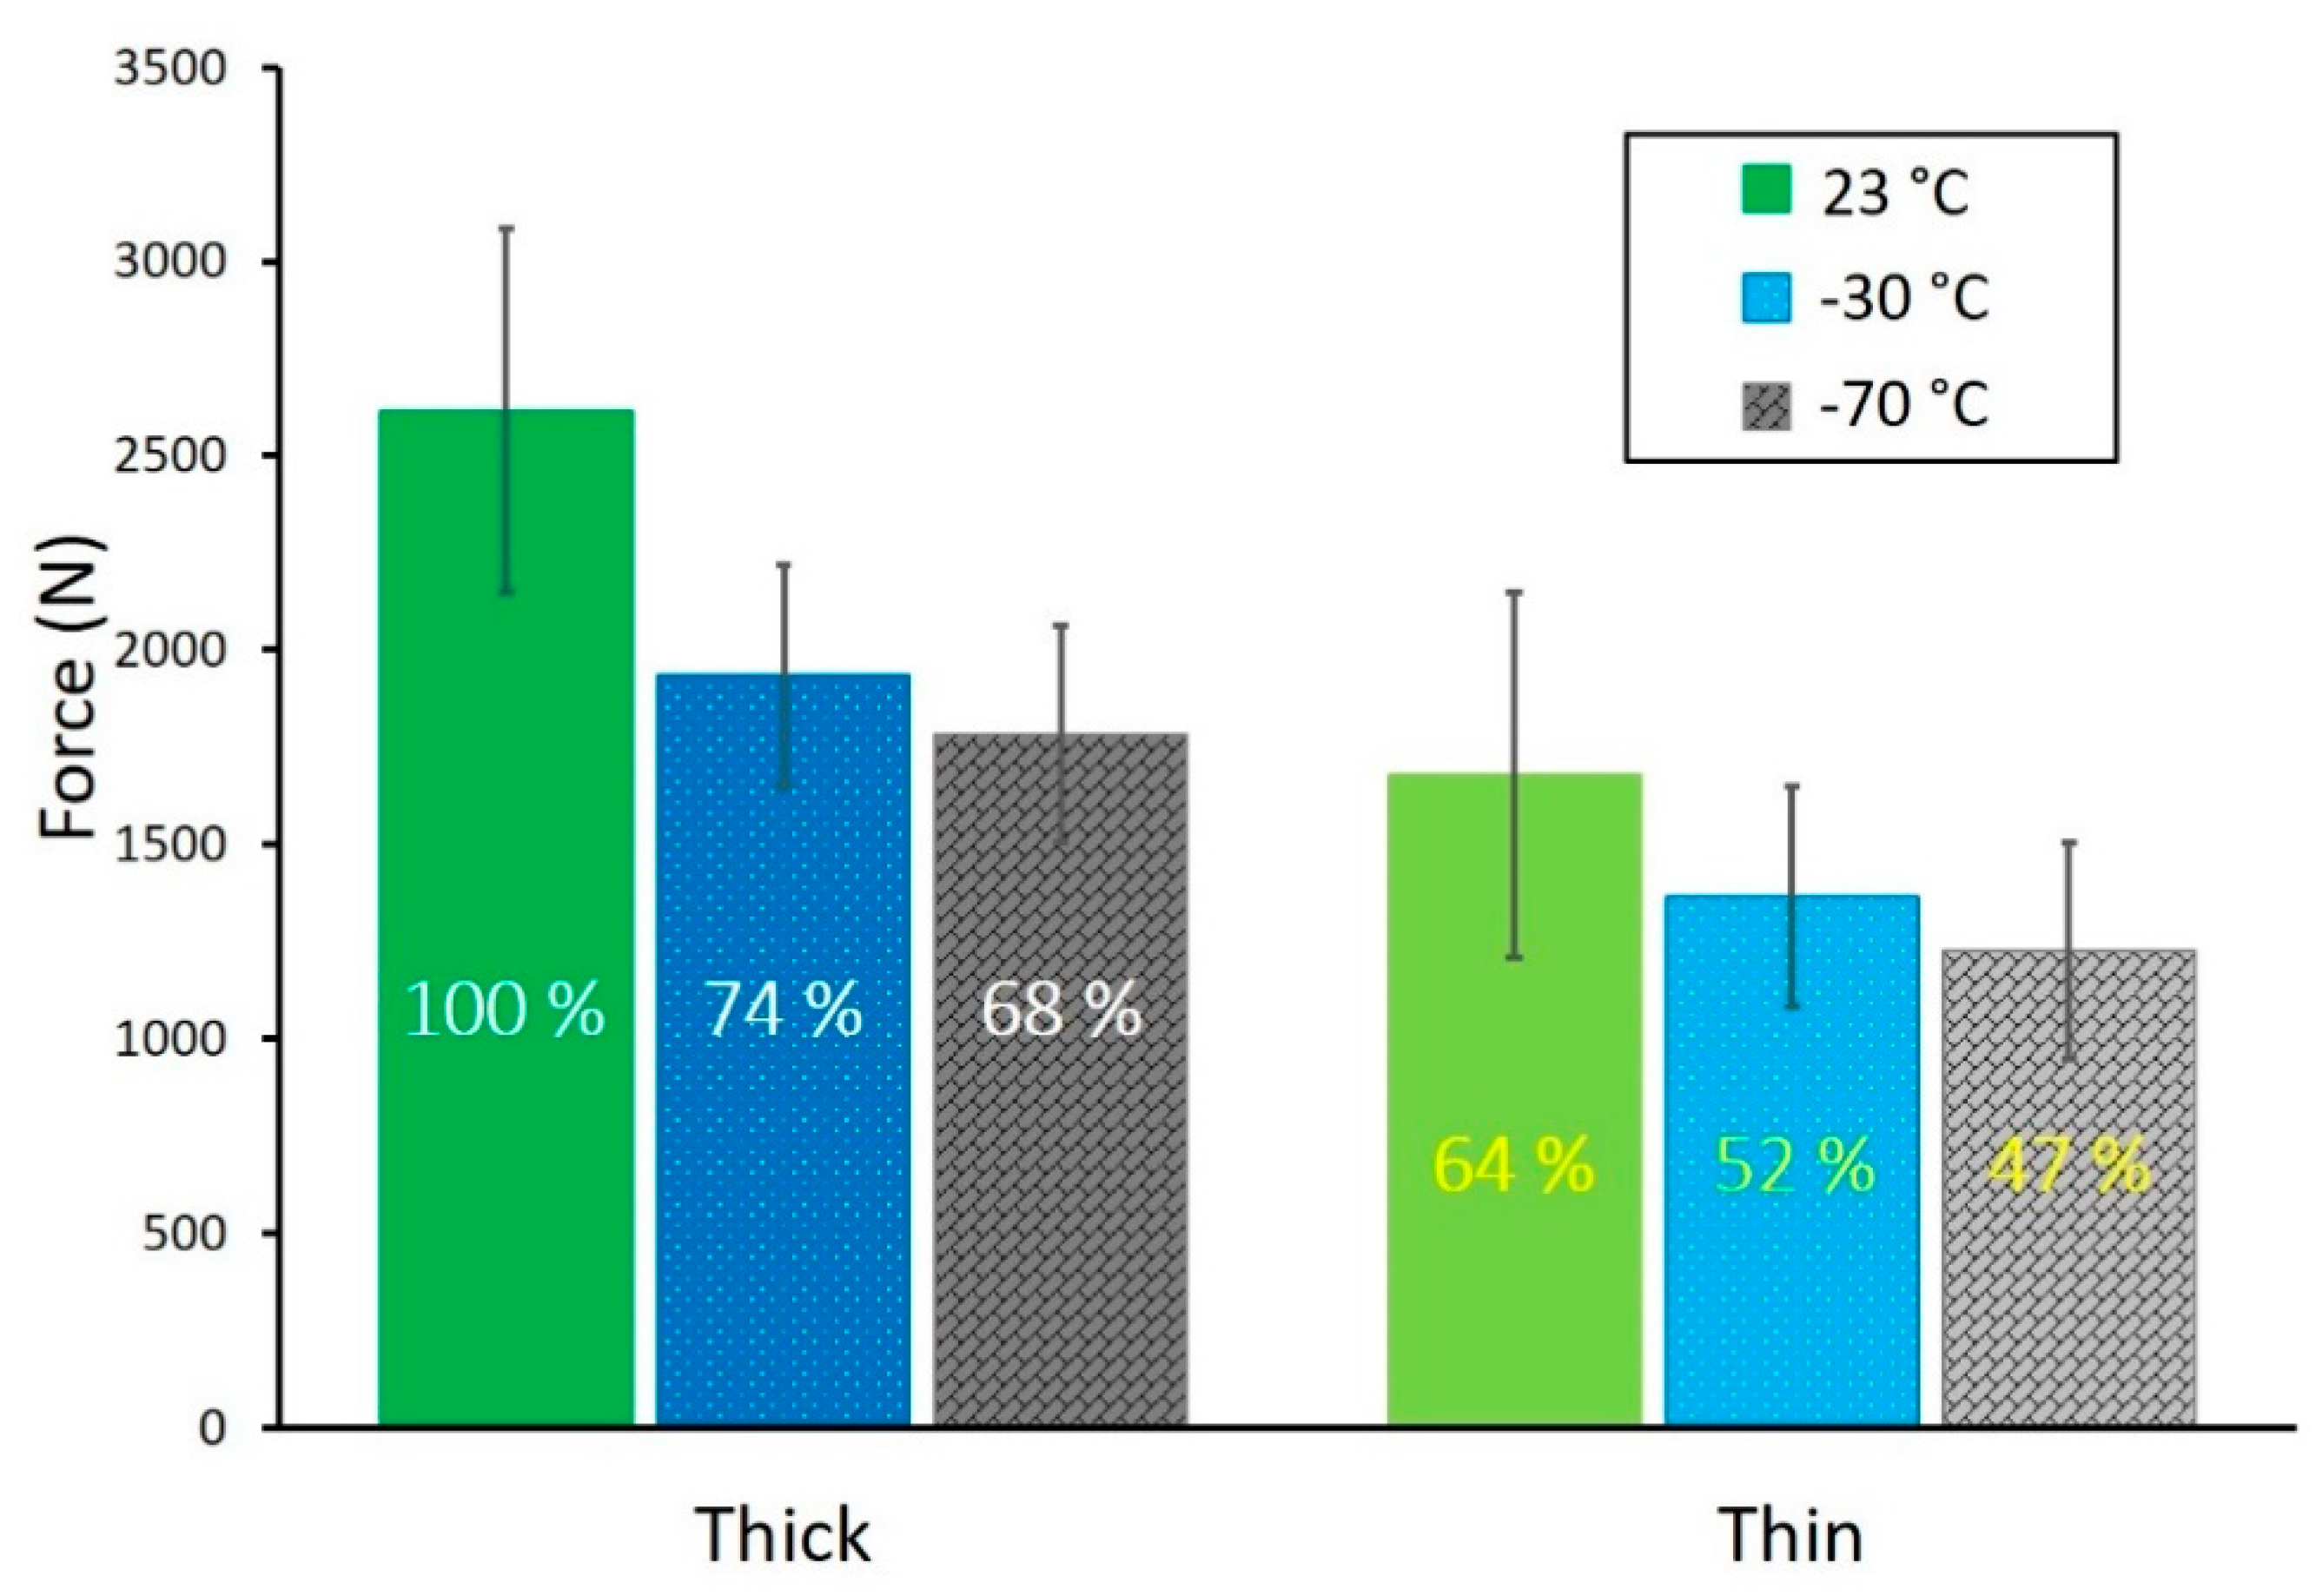
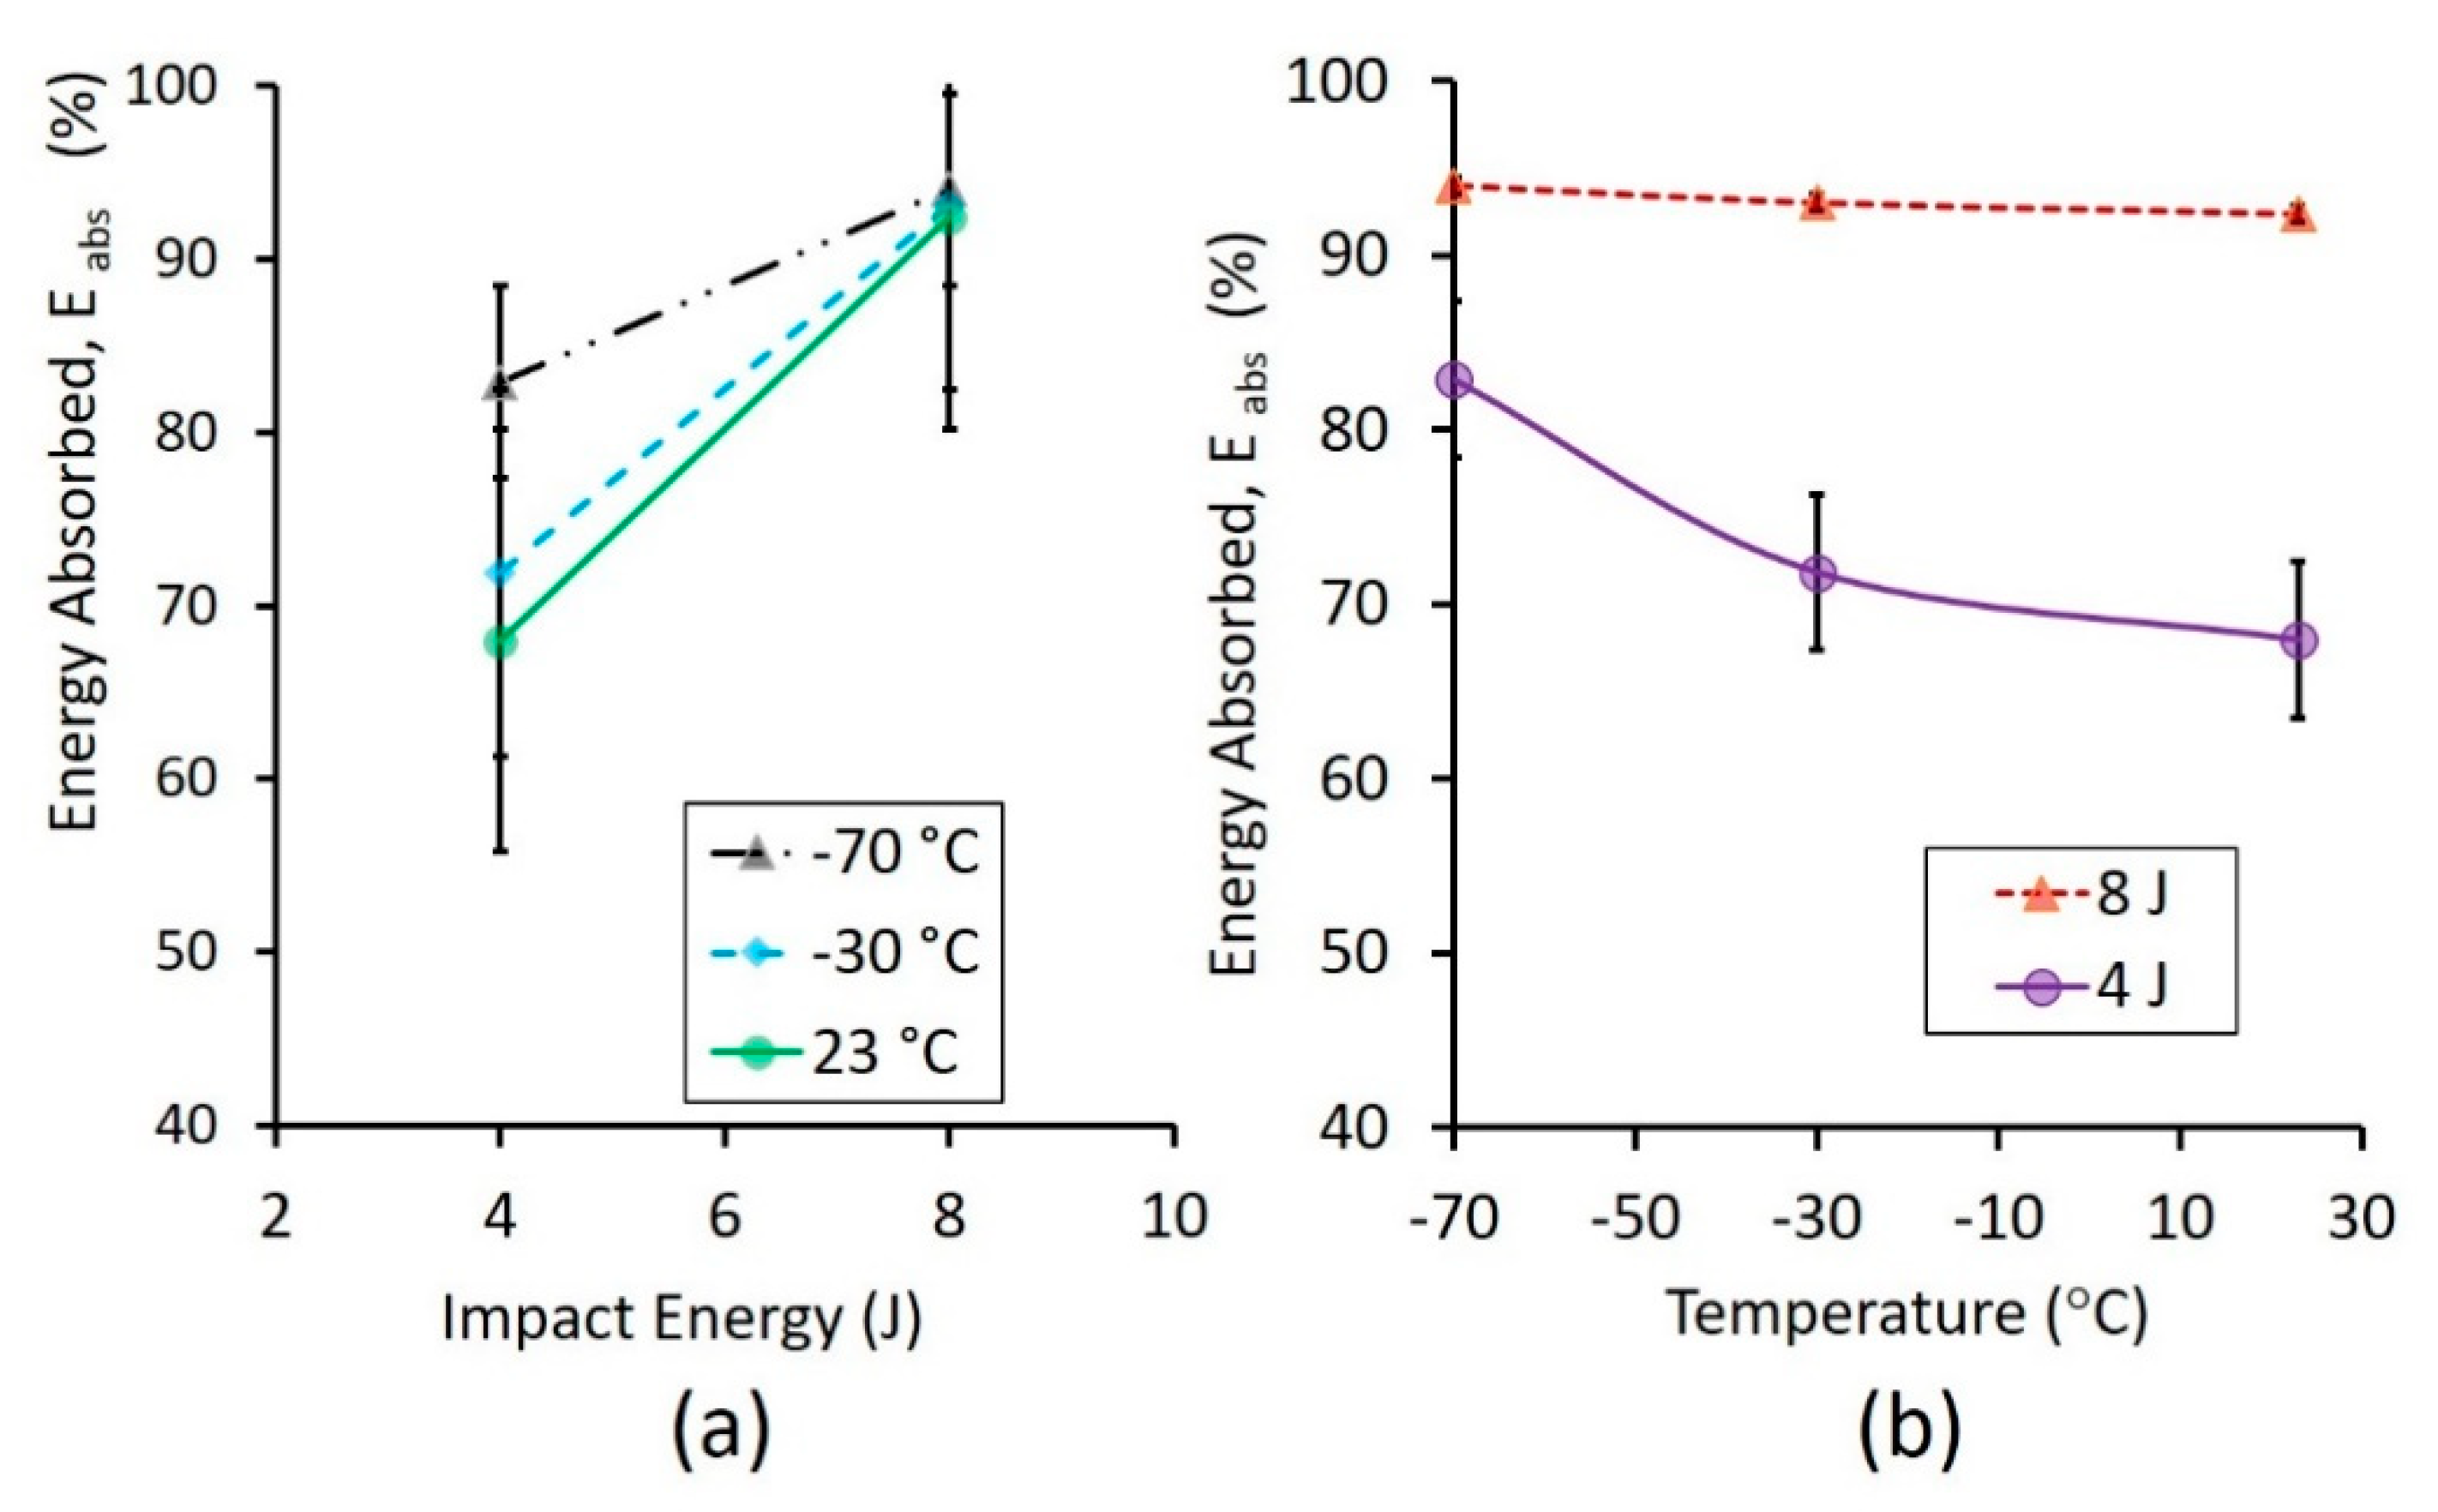
3.1. Impact Performance
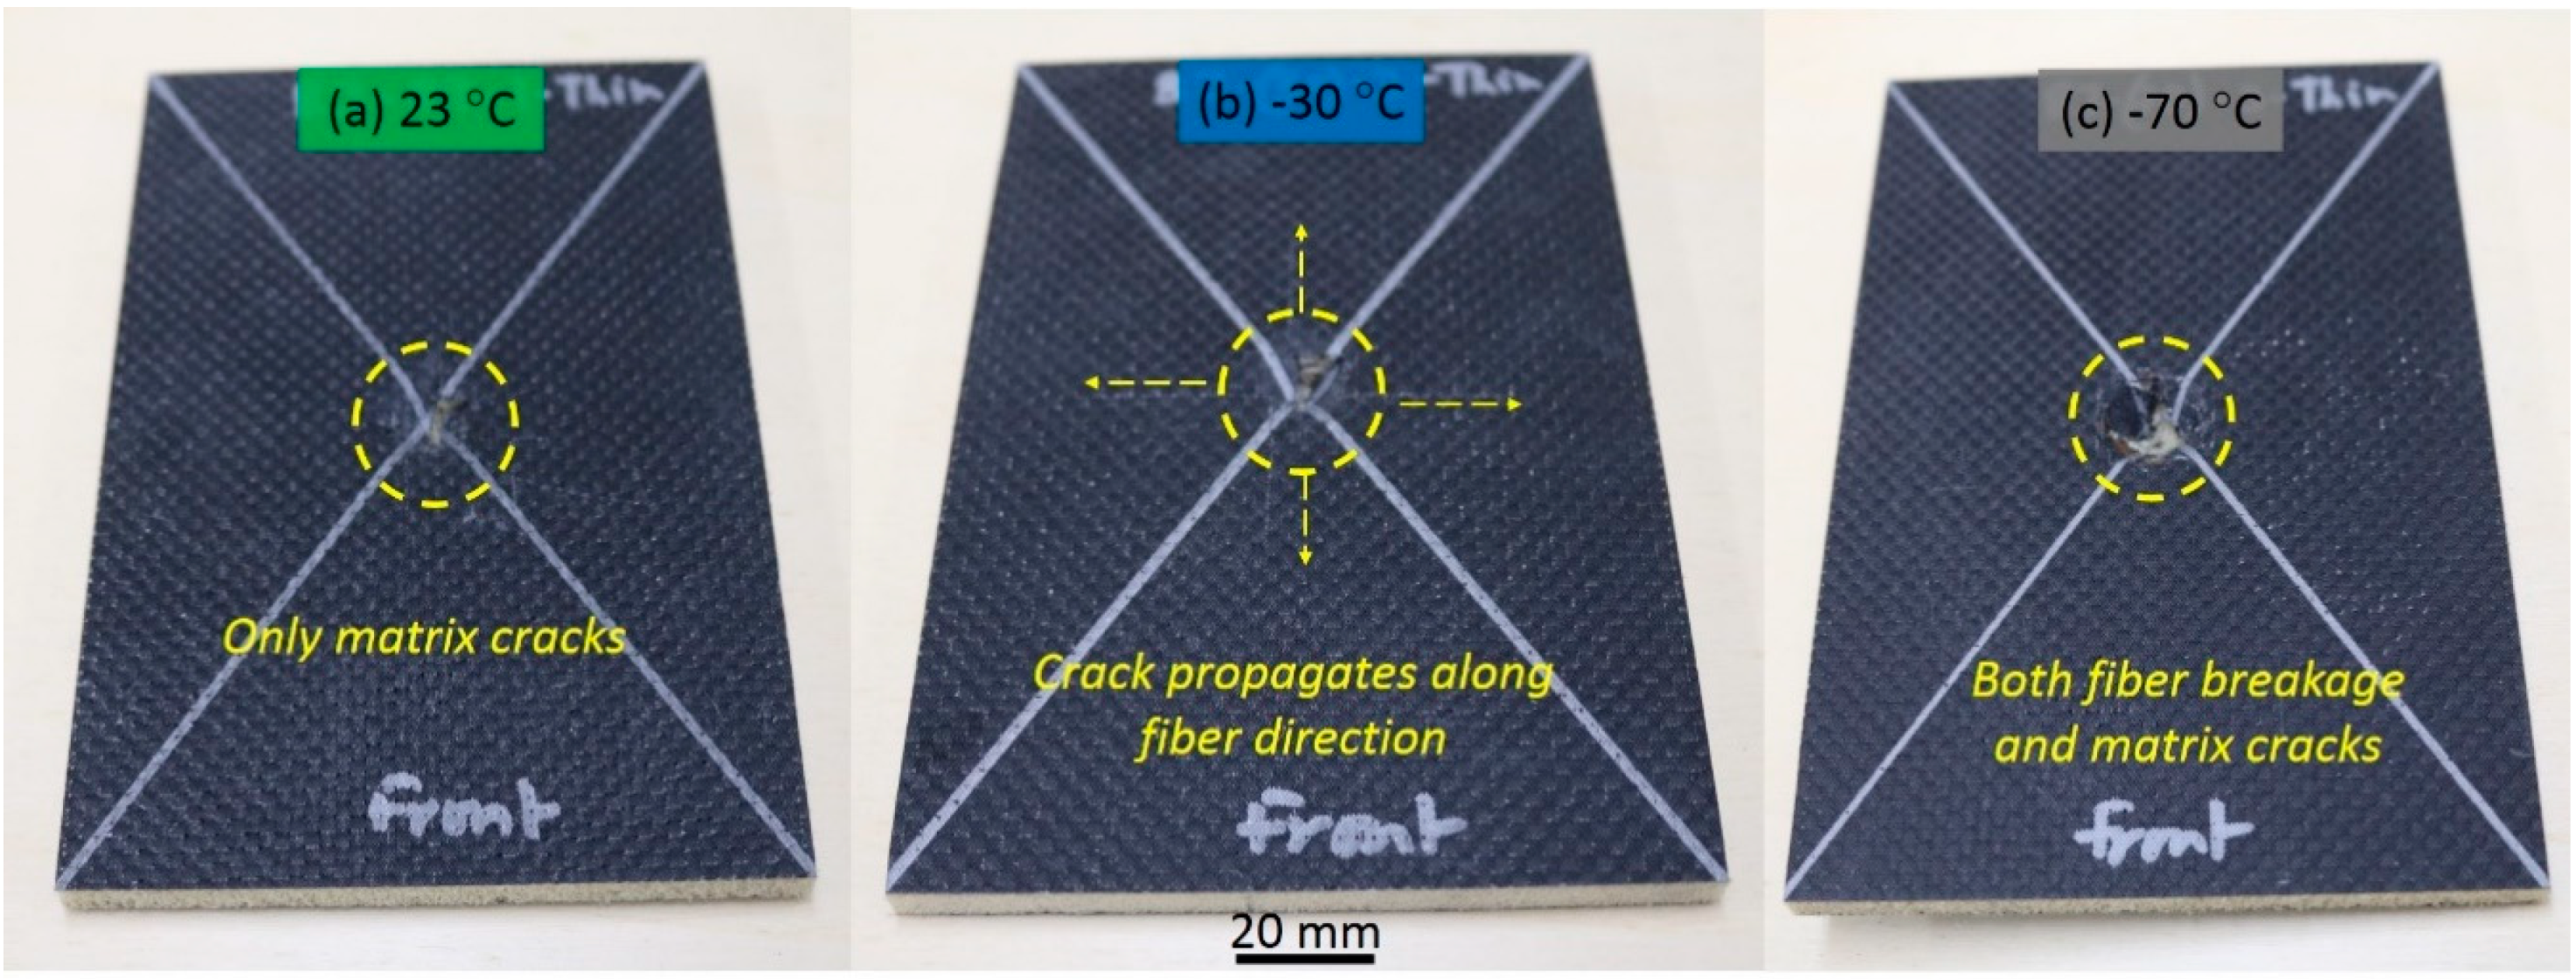
3.2. Impact Damage Mechanisms
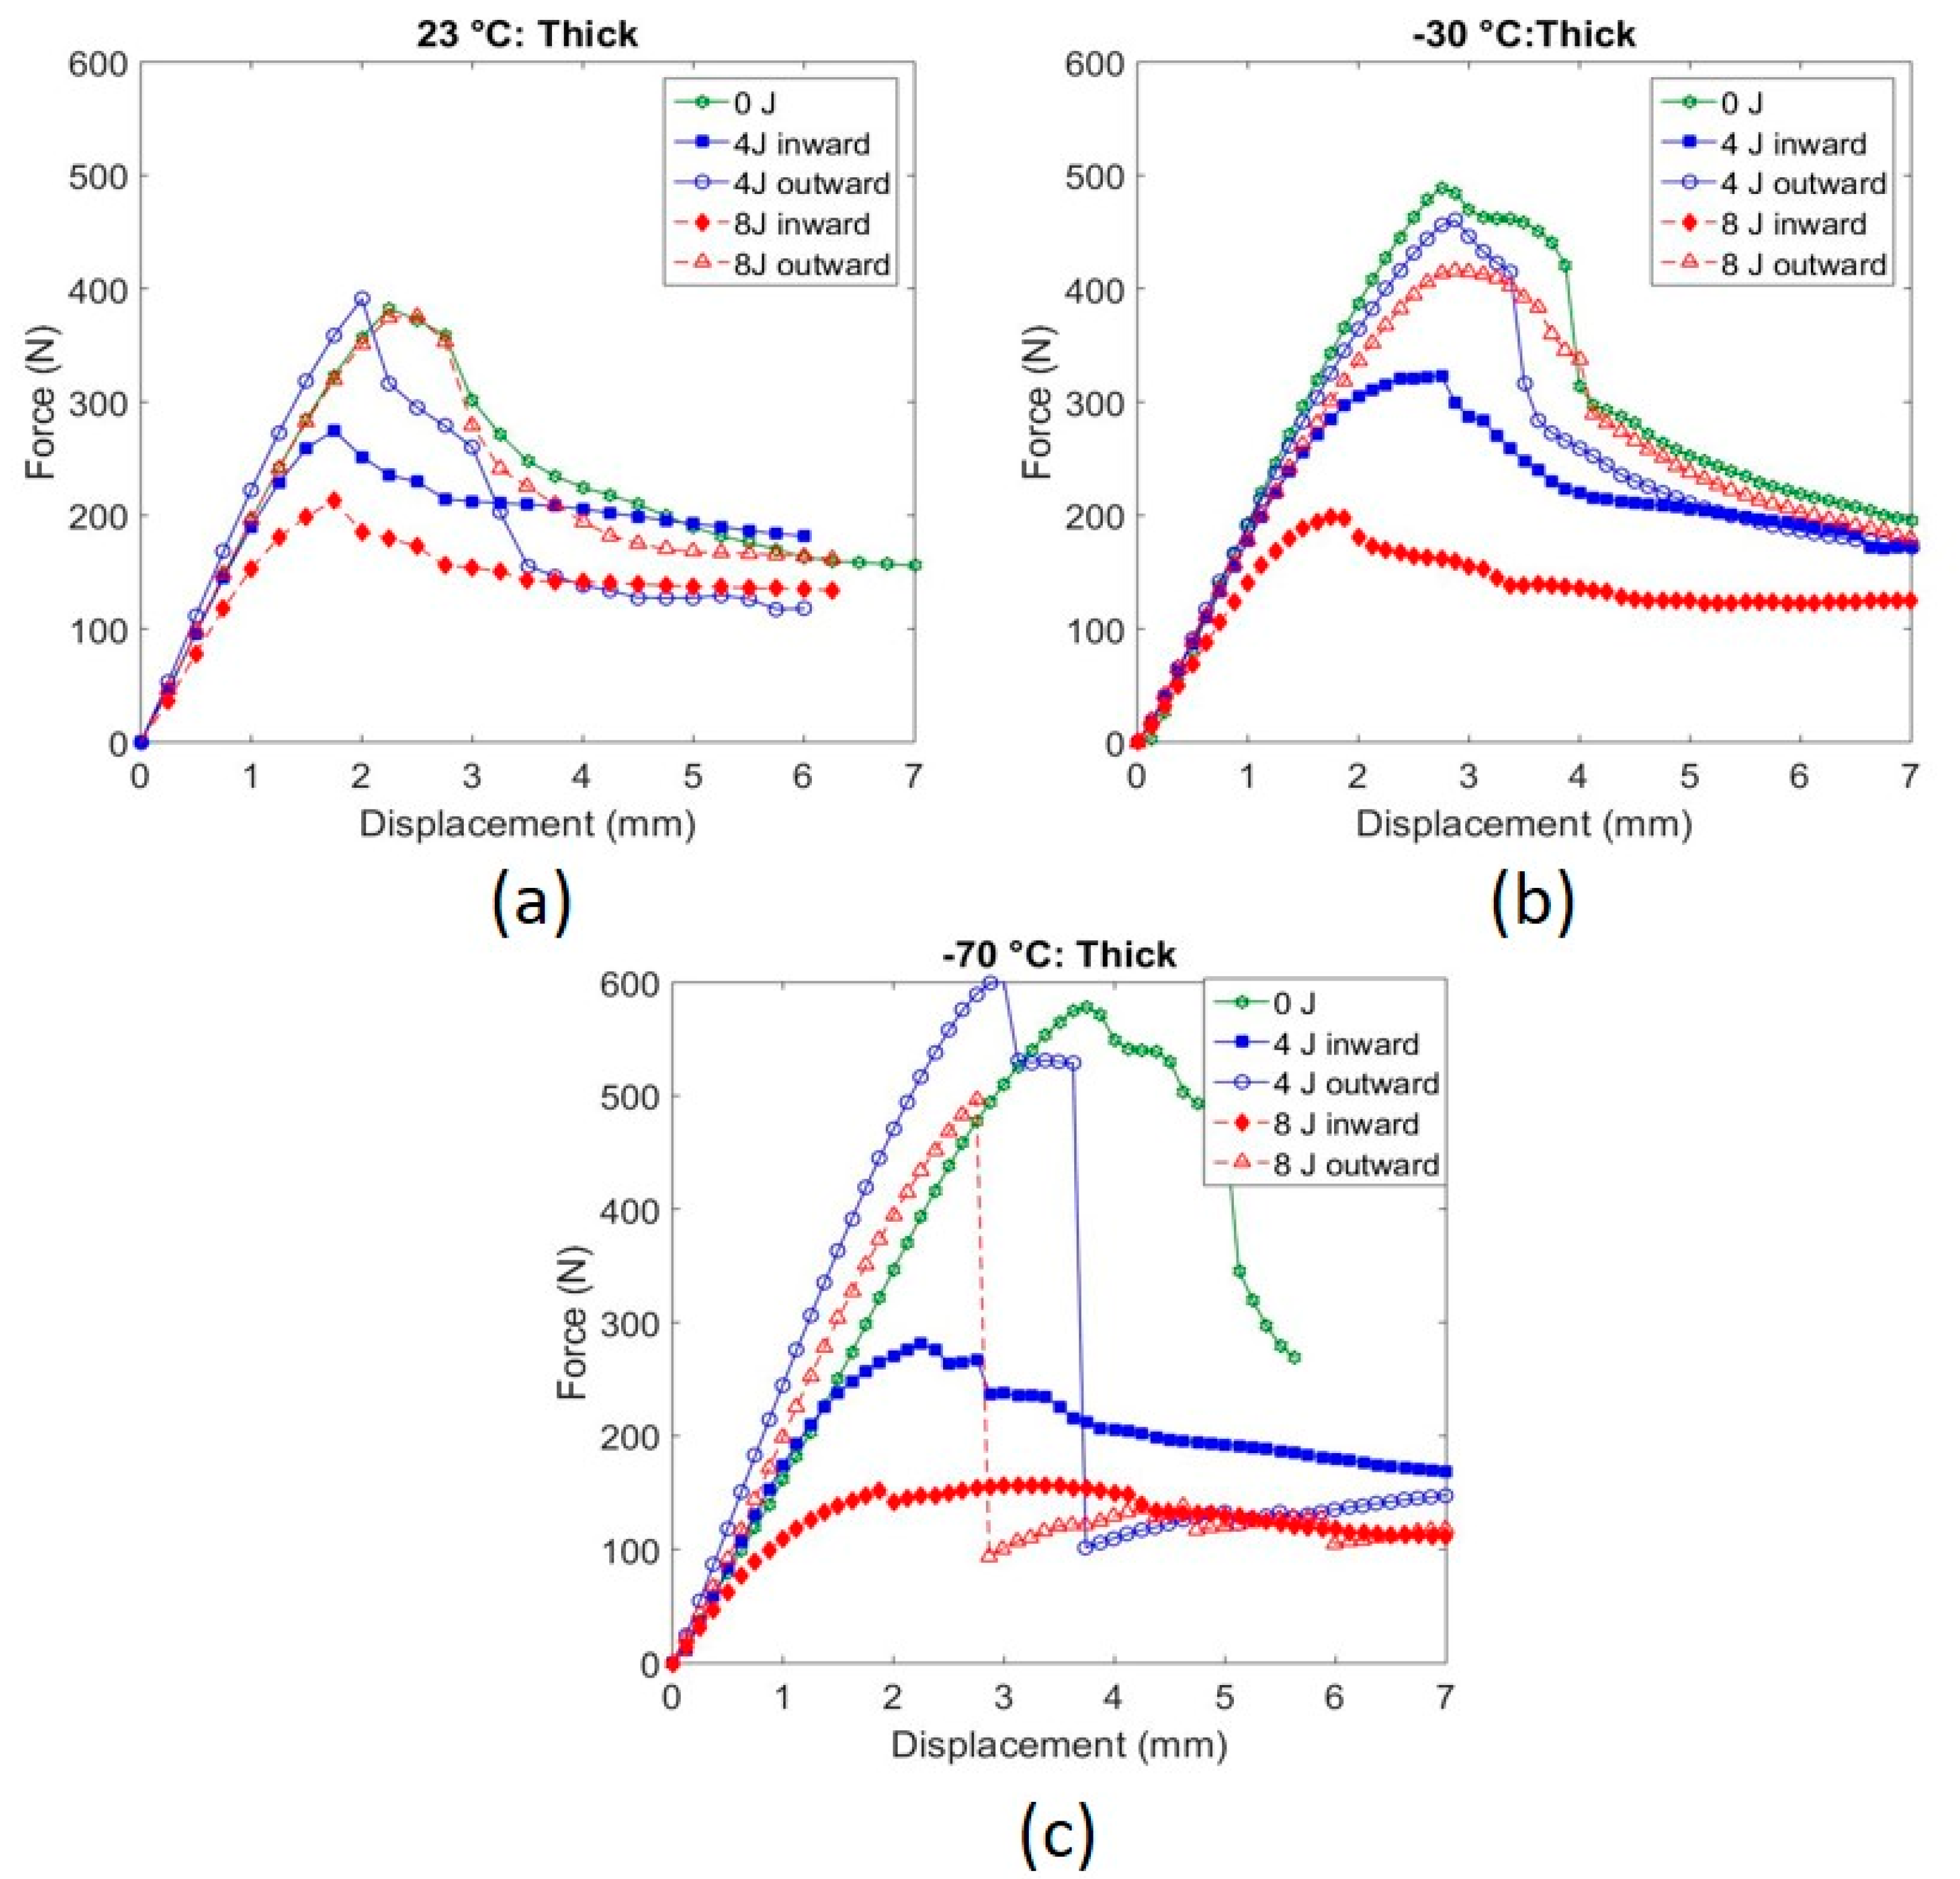
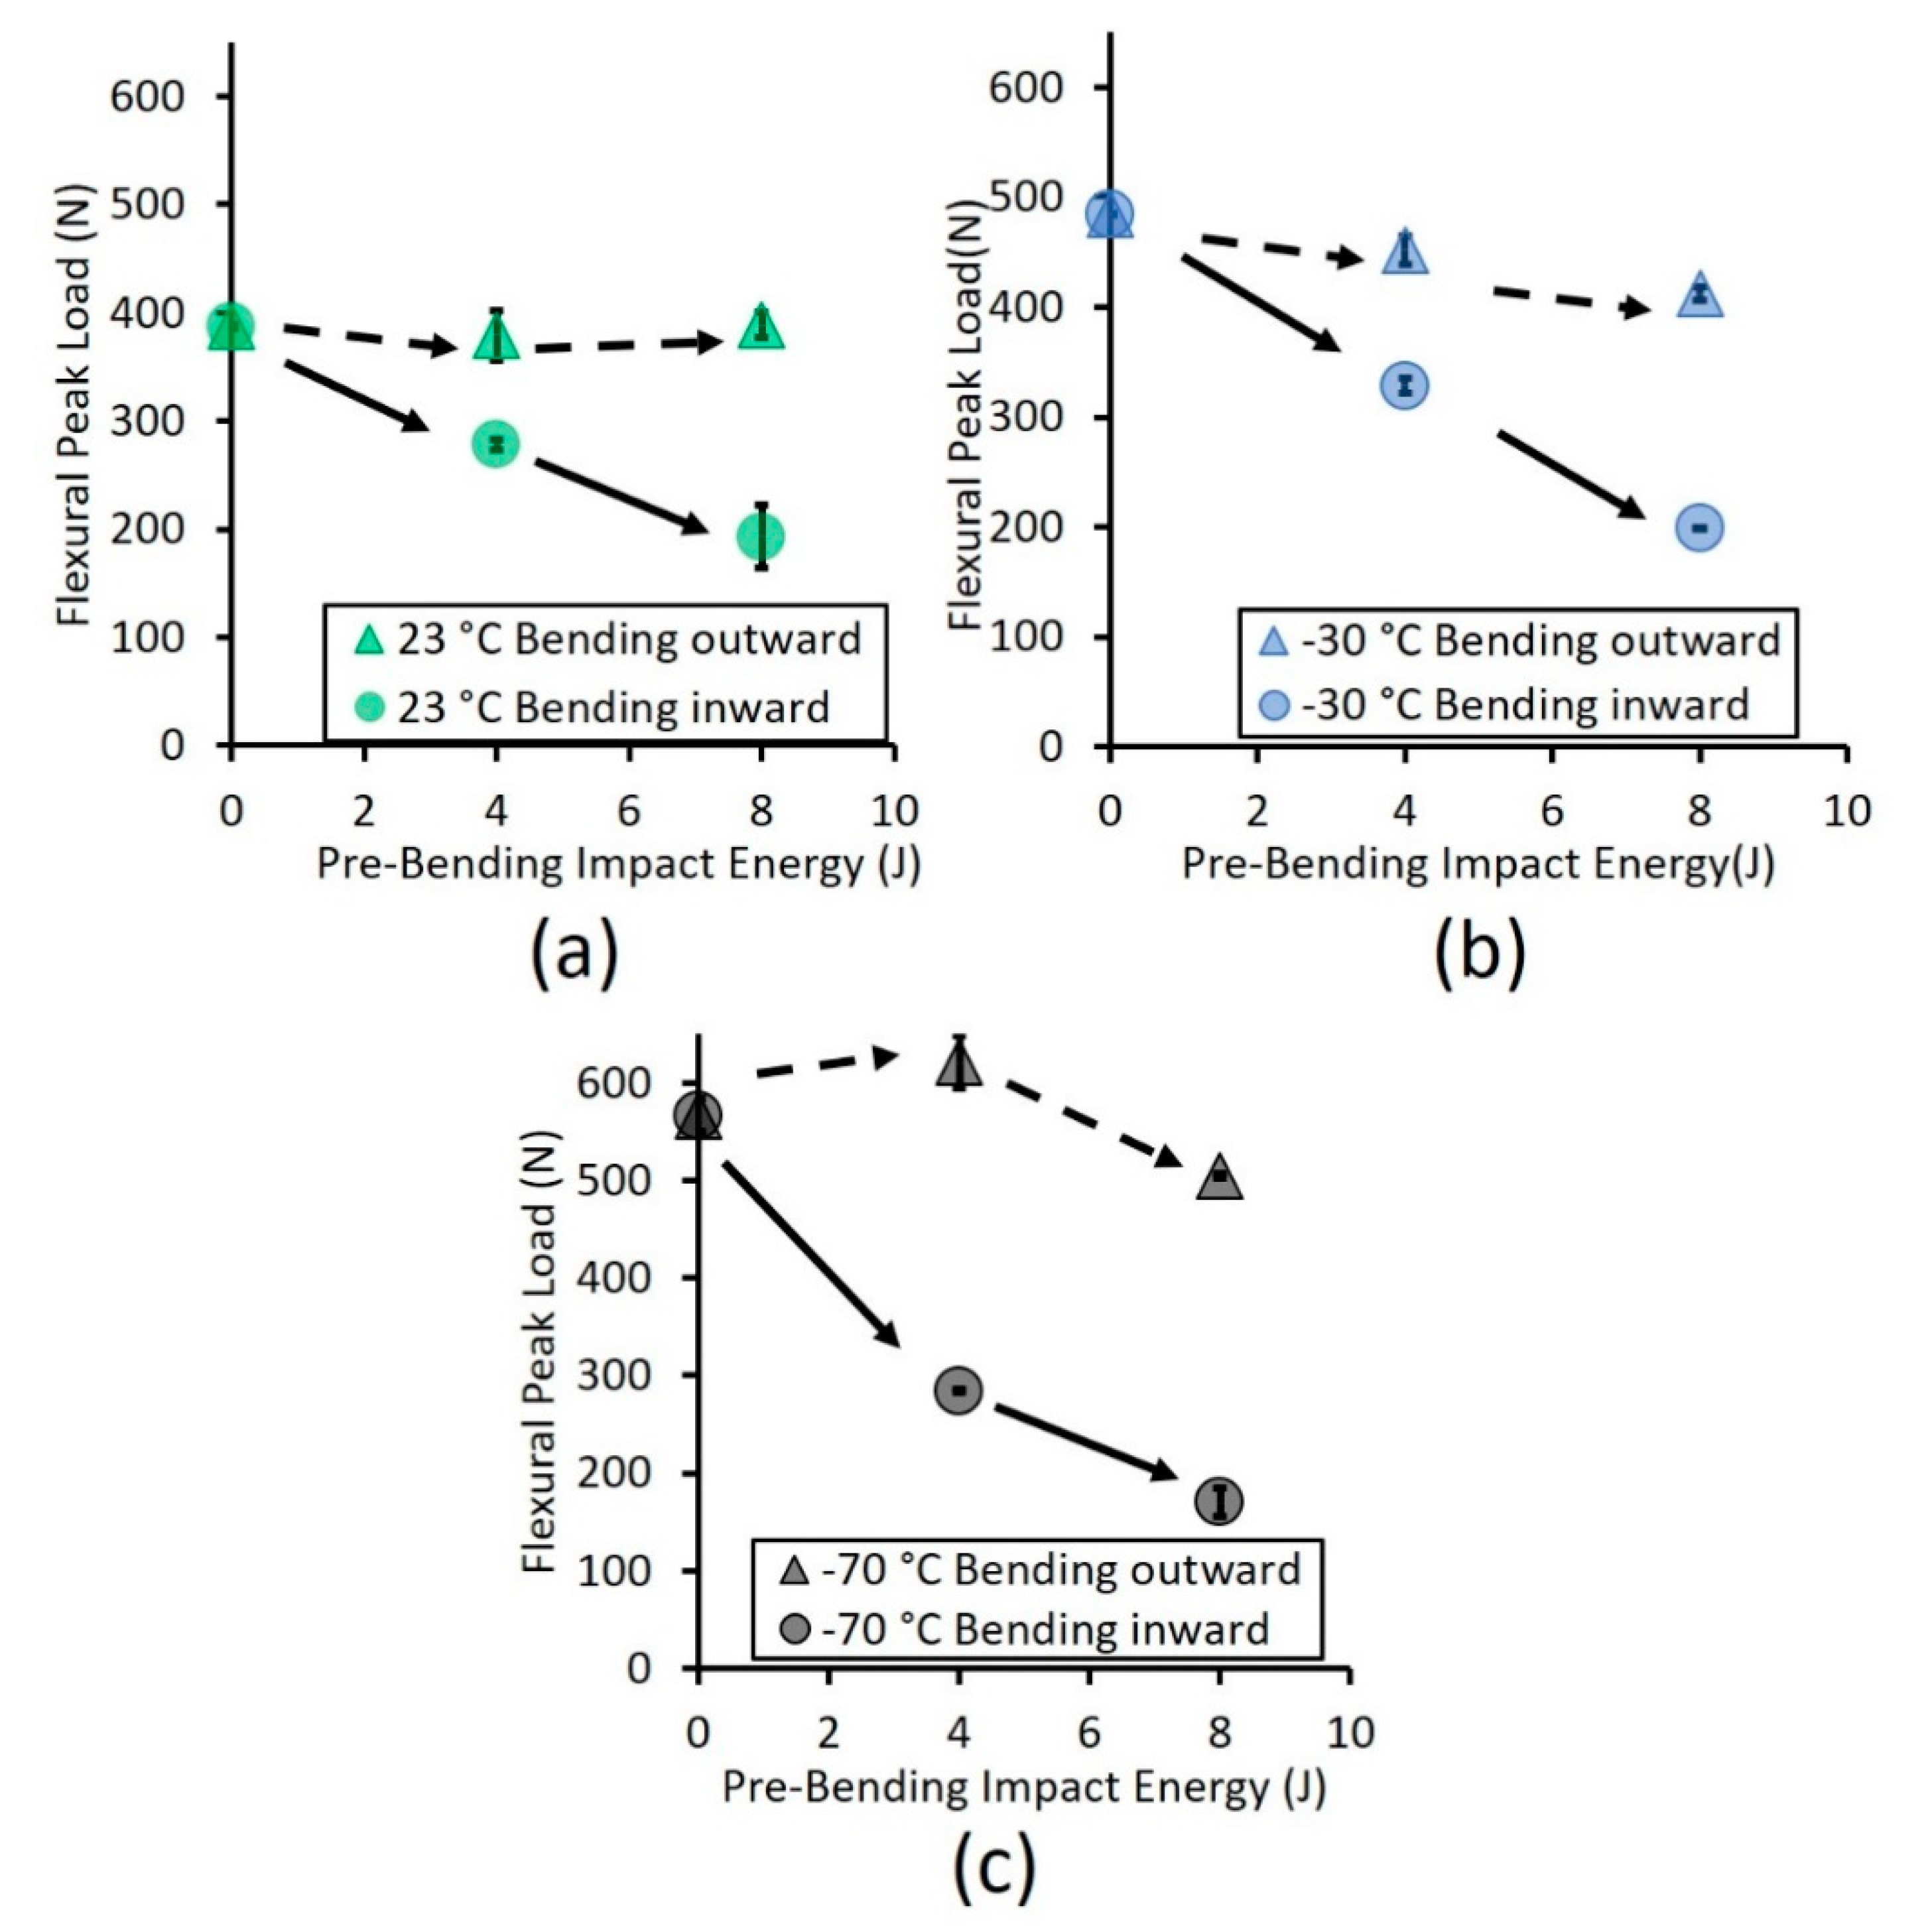
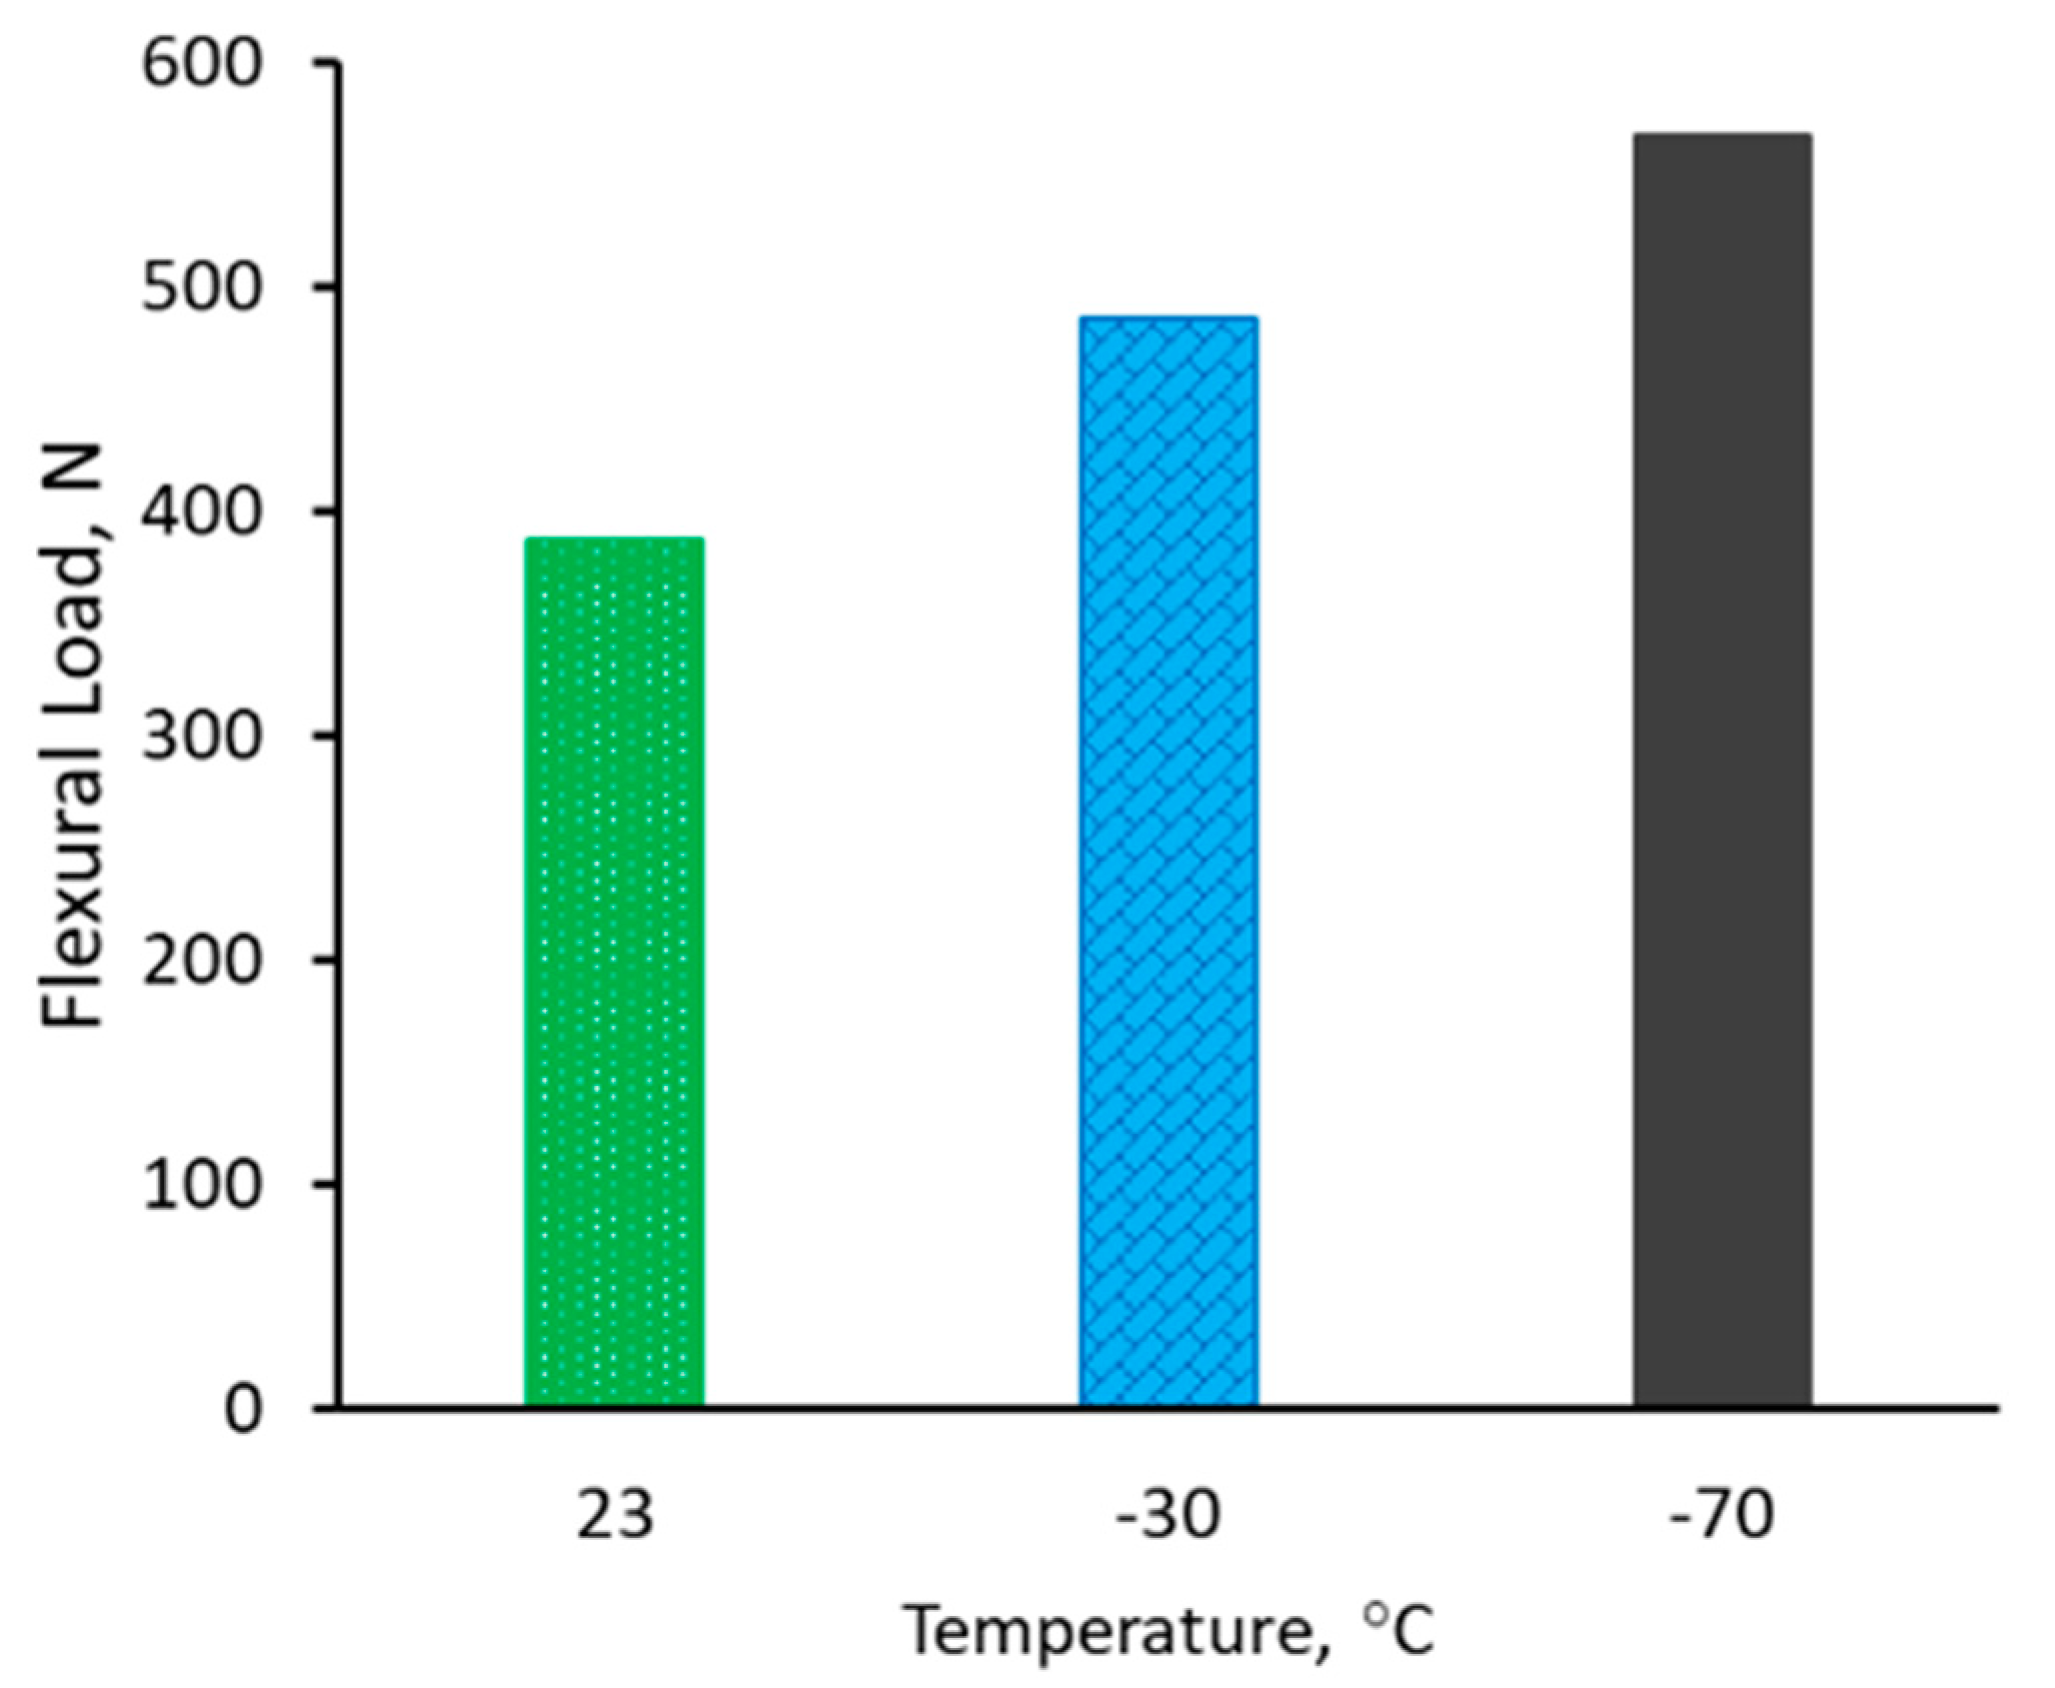
3.3. Residual Flexural Strength after Impact
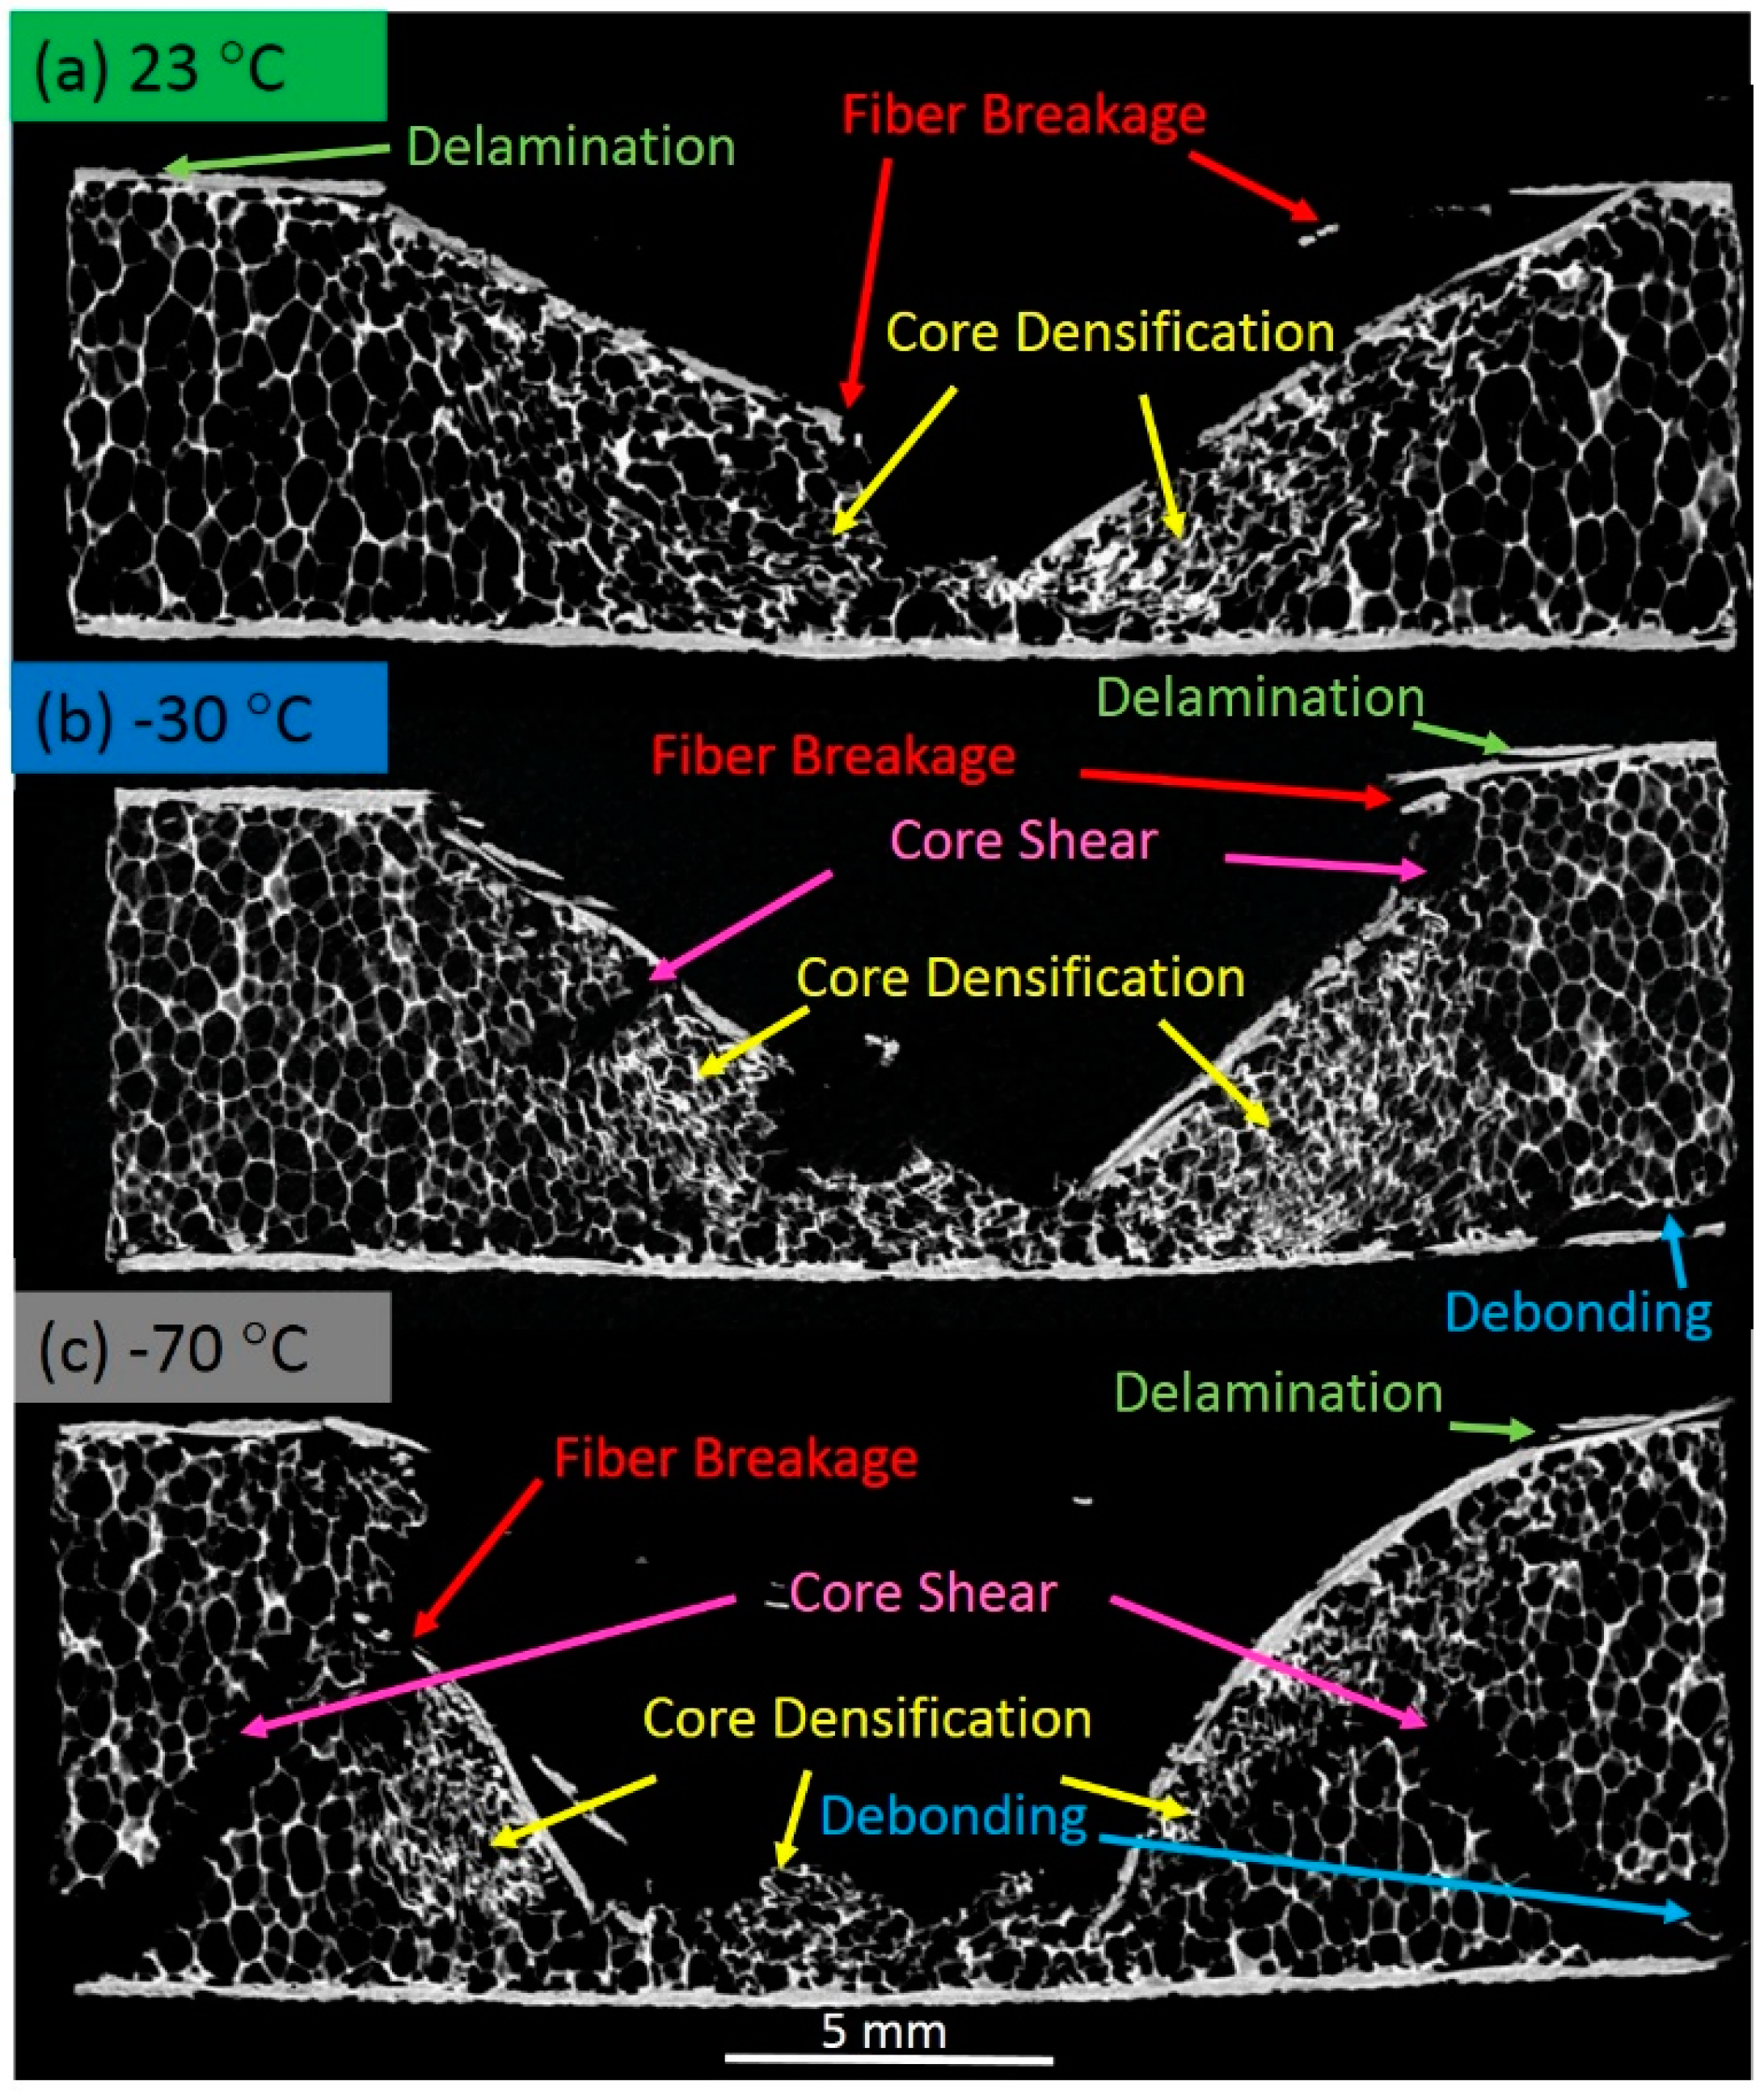
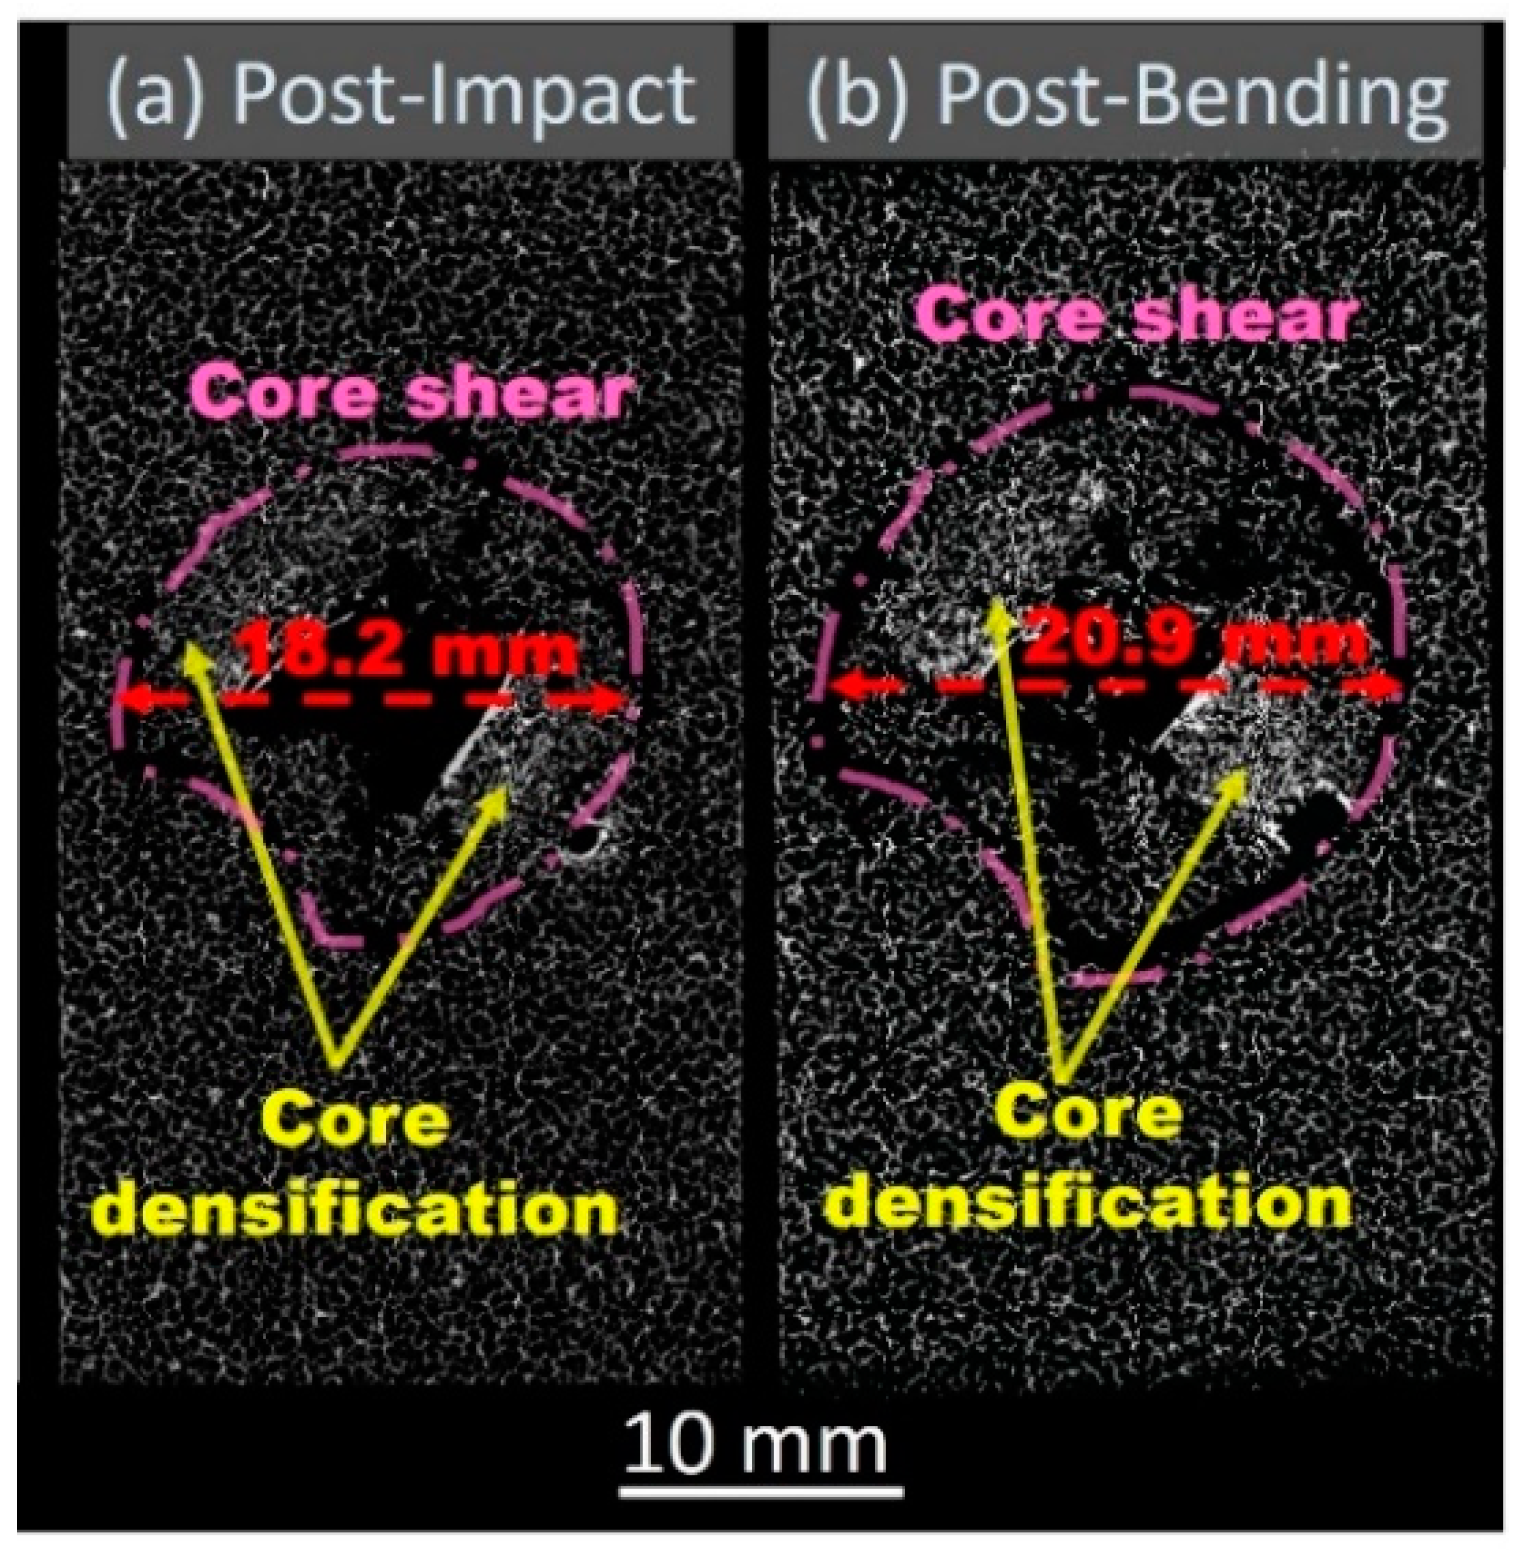
3.4. Post-Bending Micro-Computed Tomography
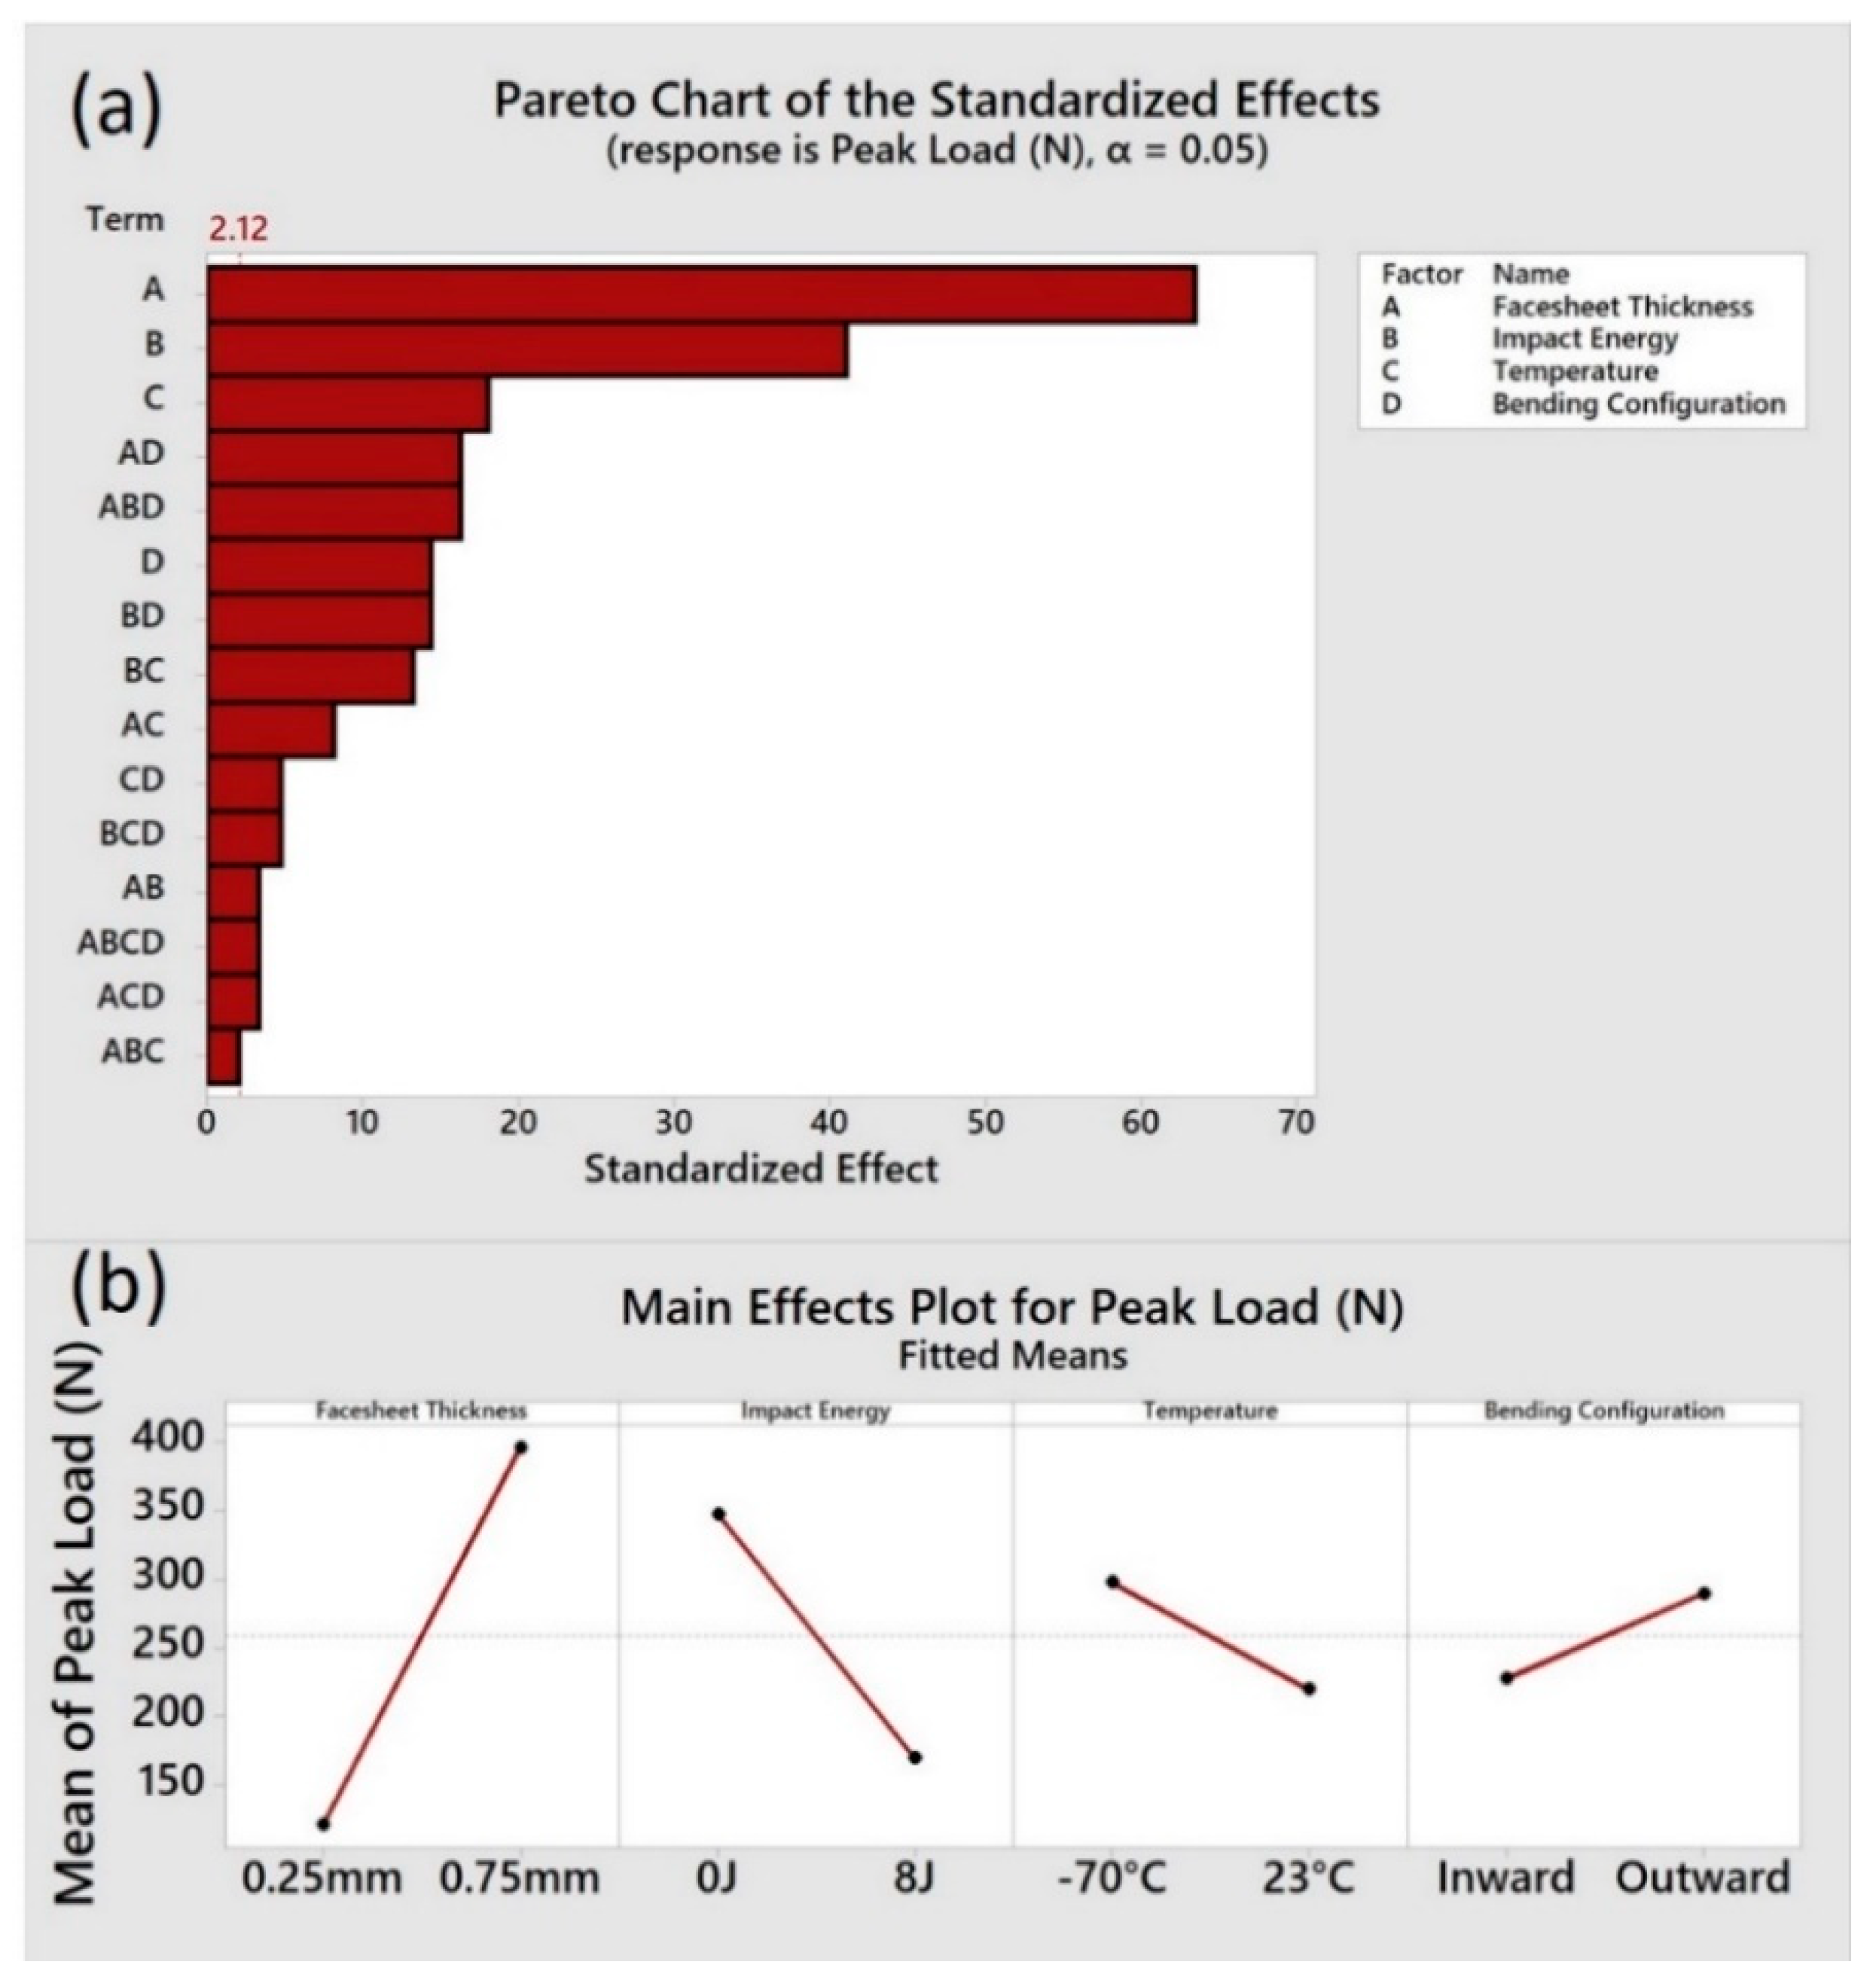
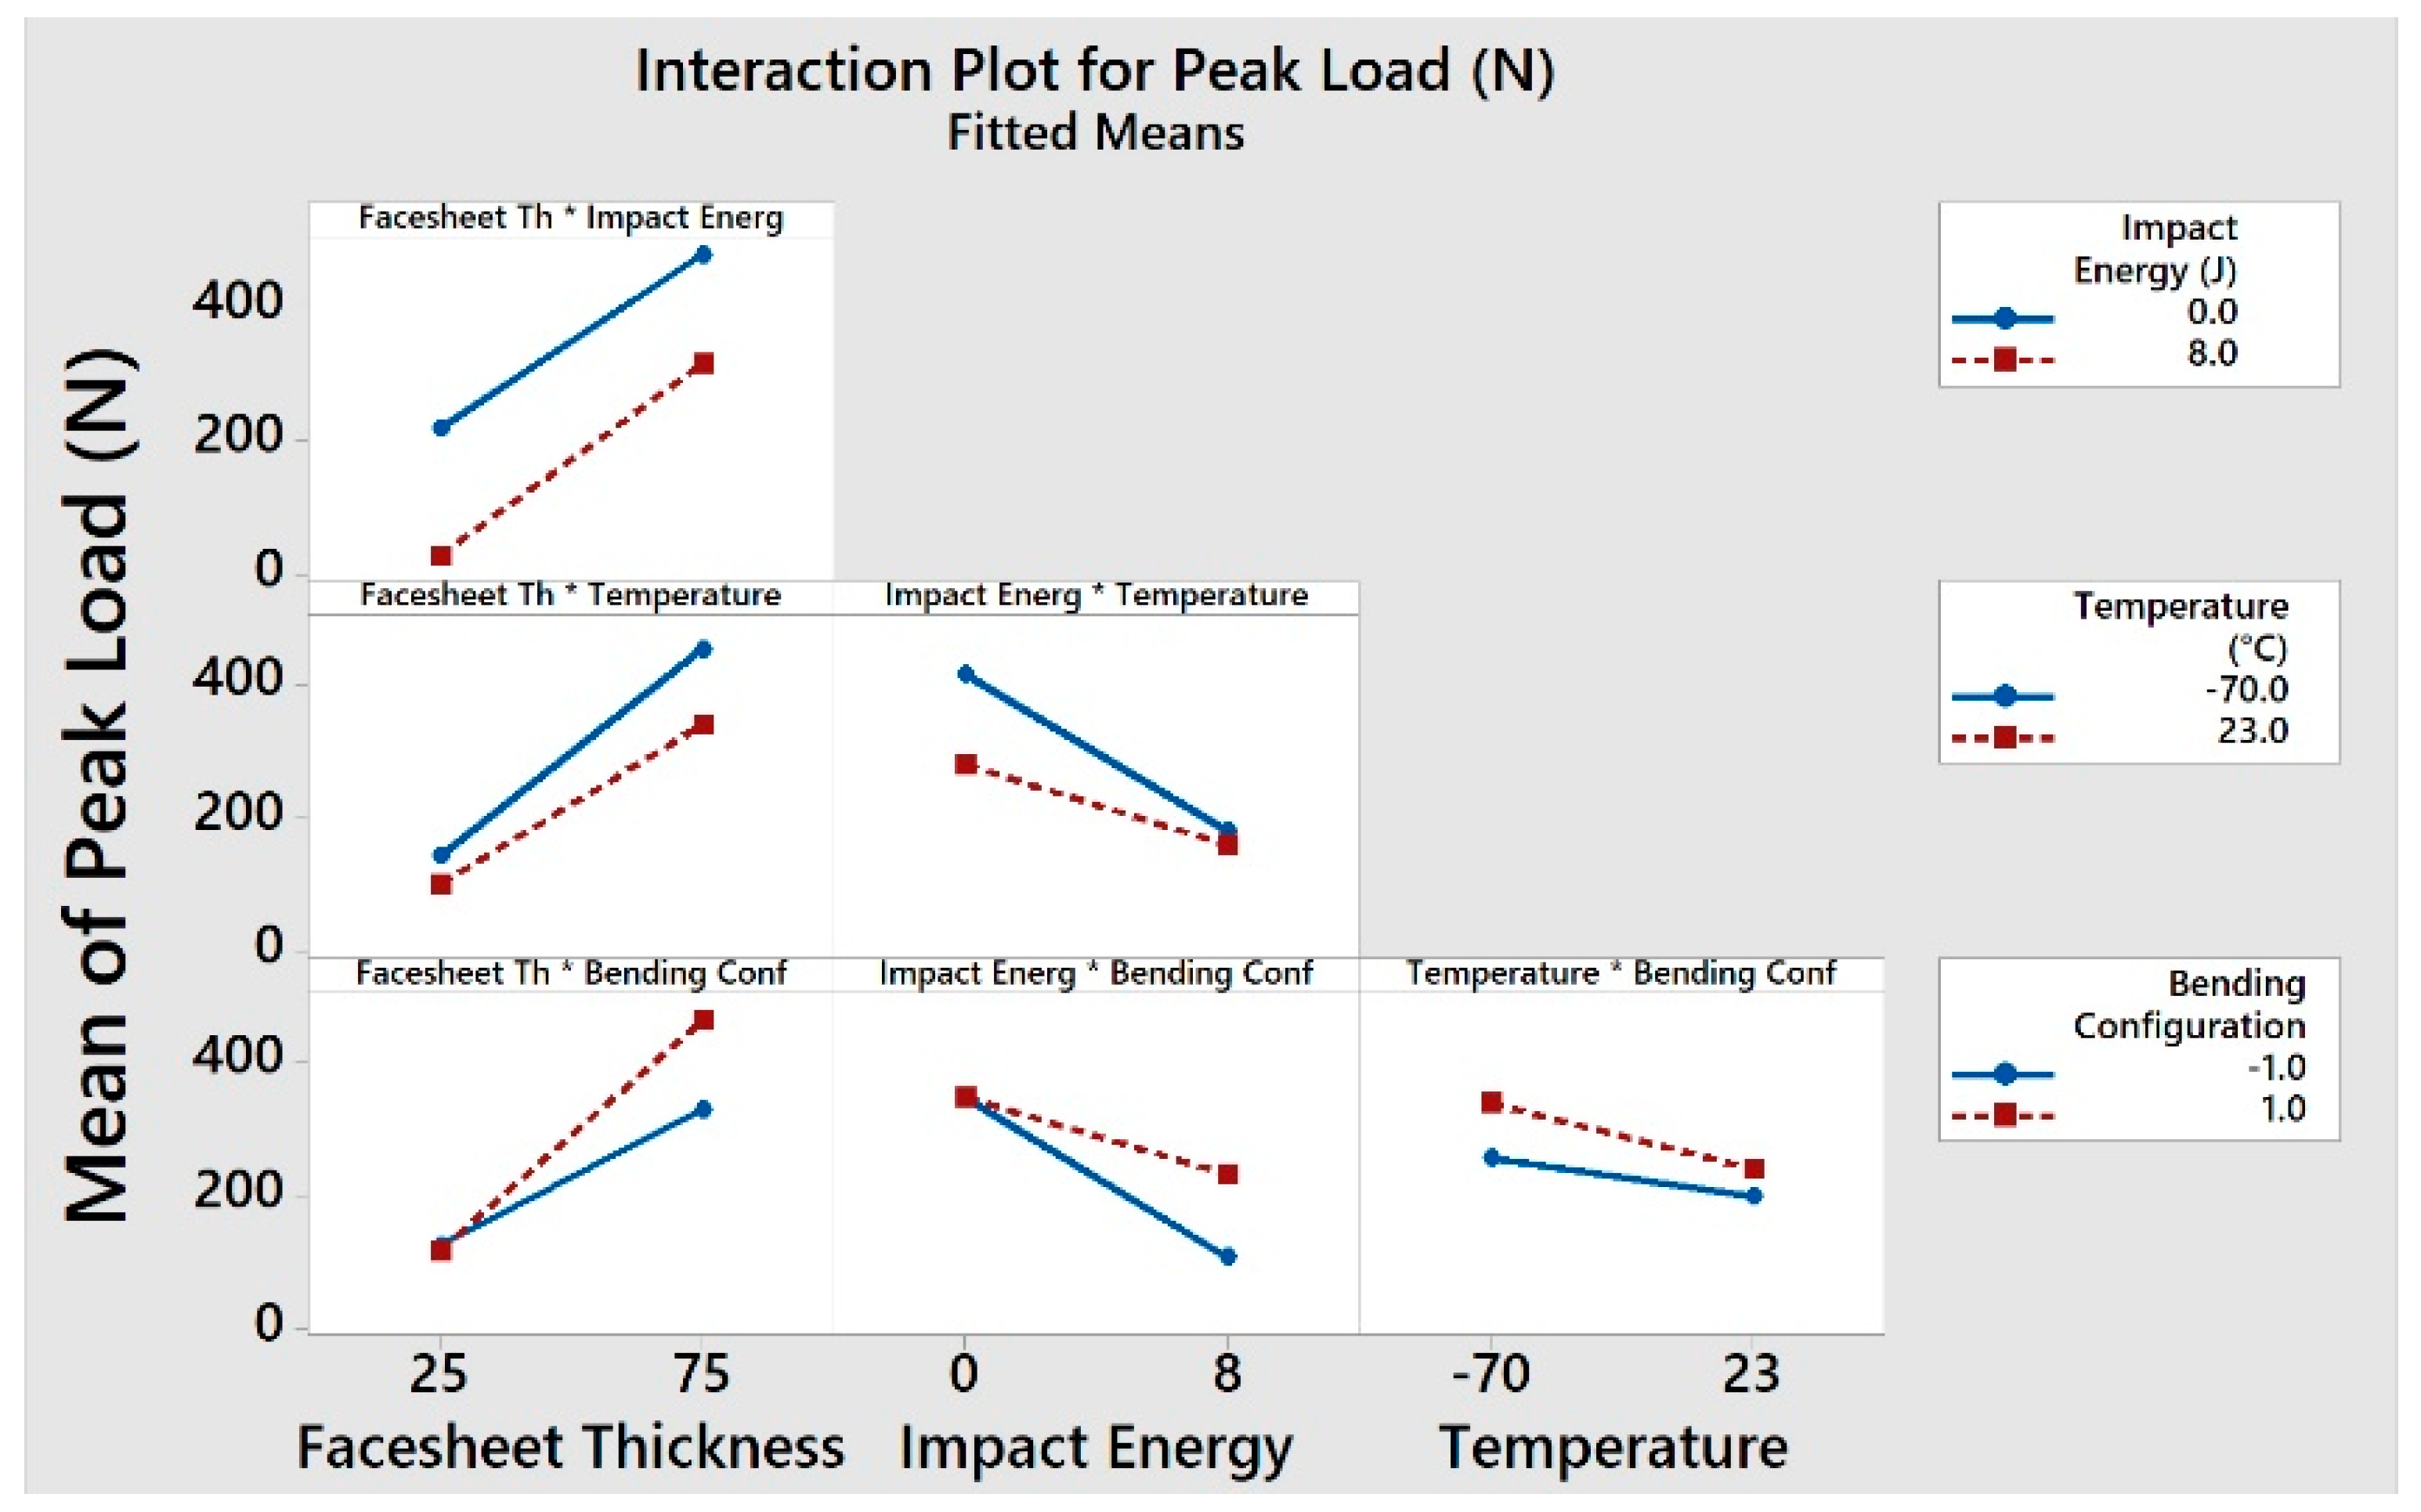
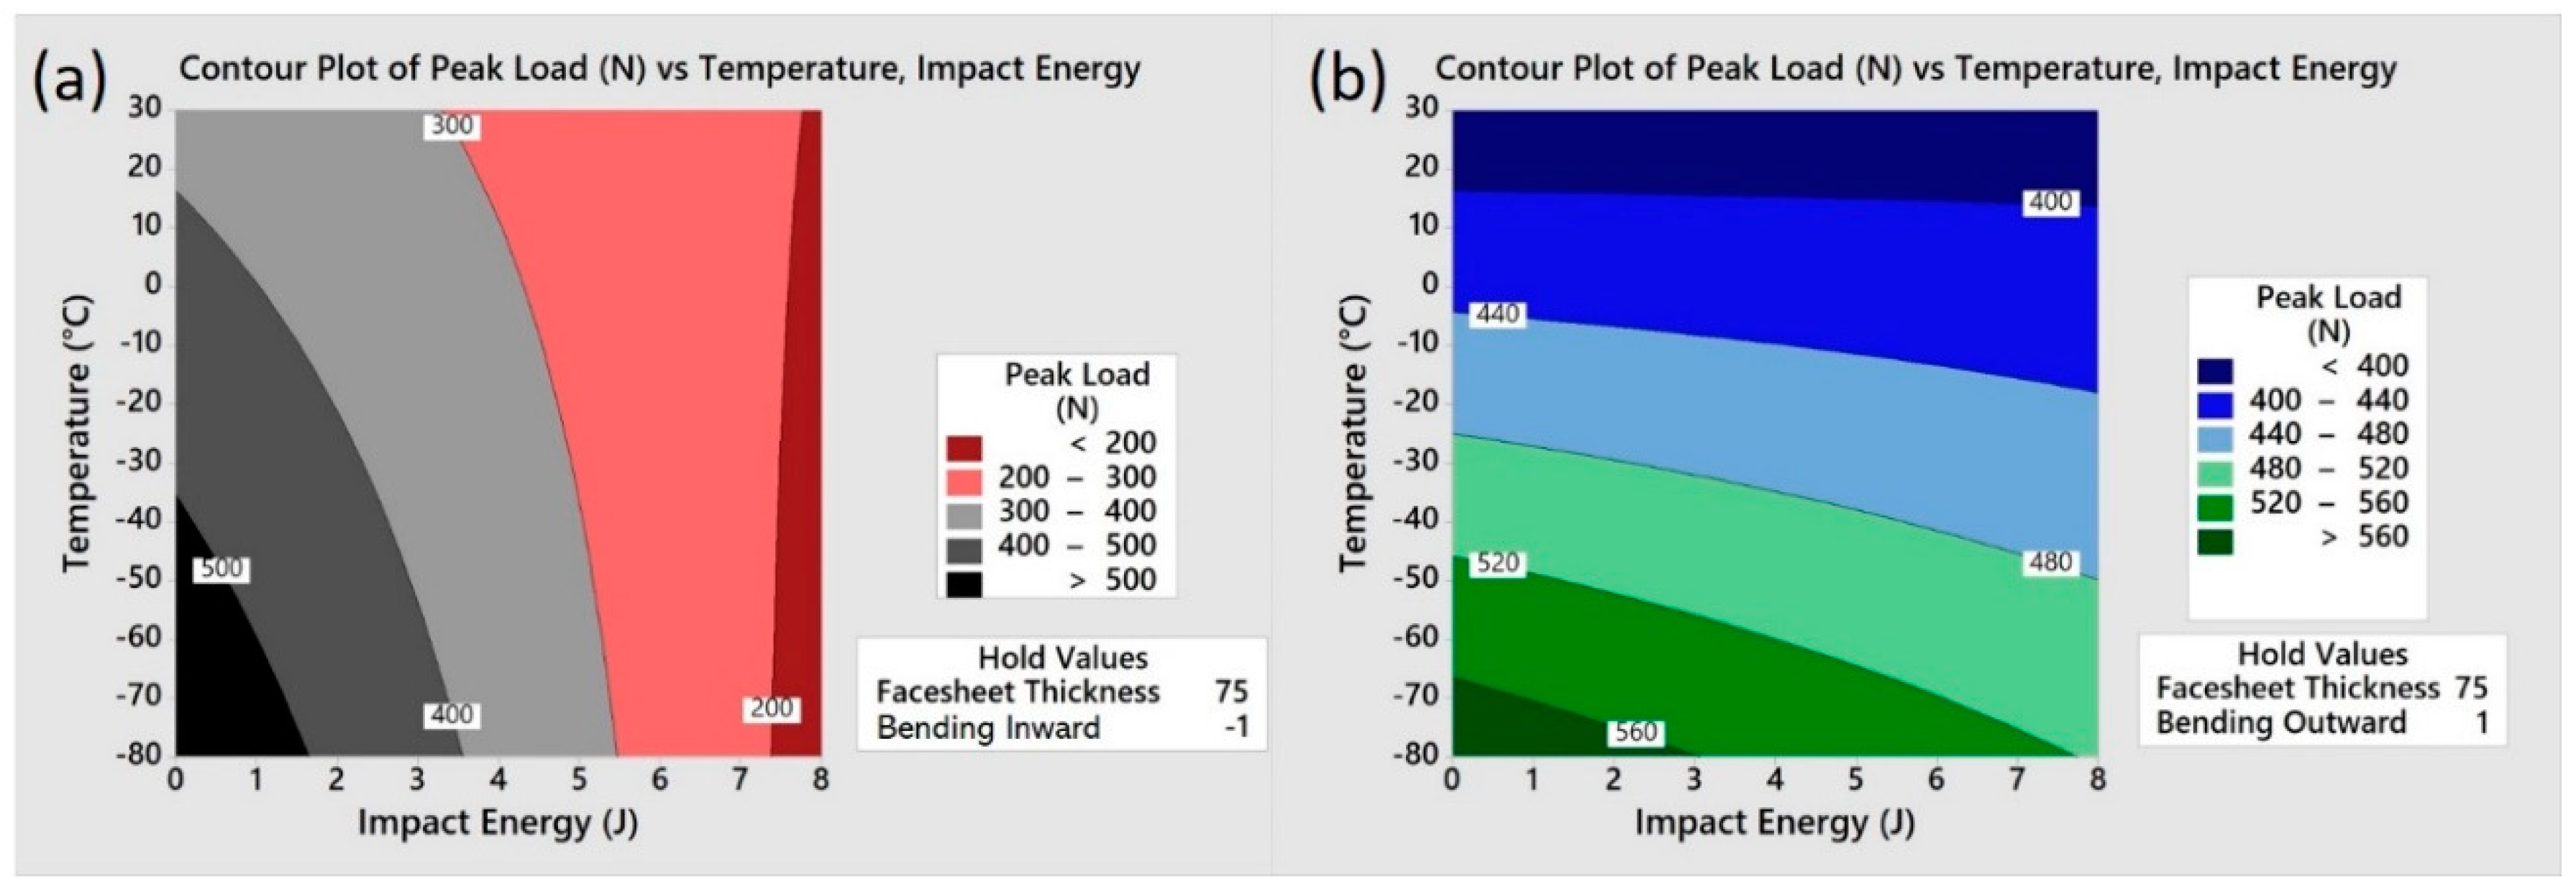
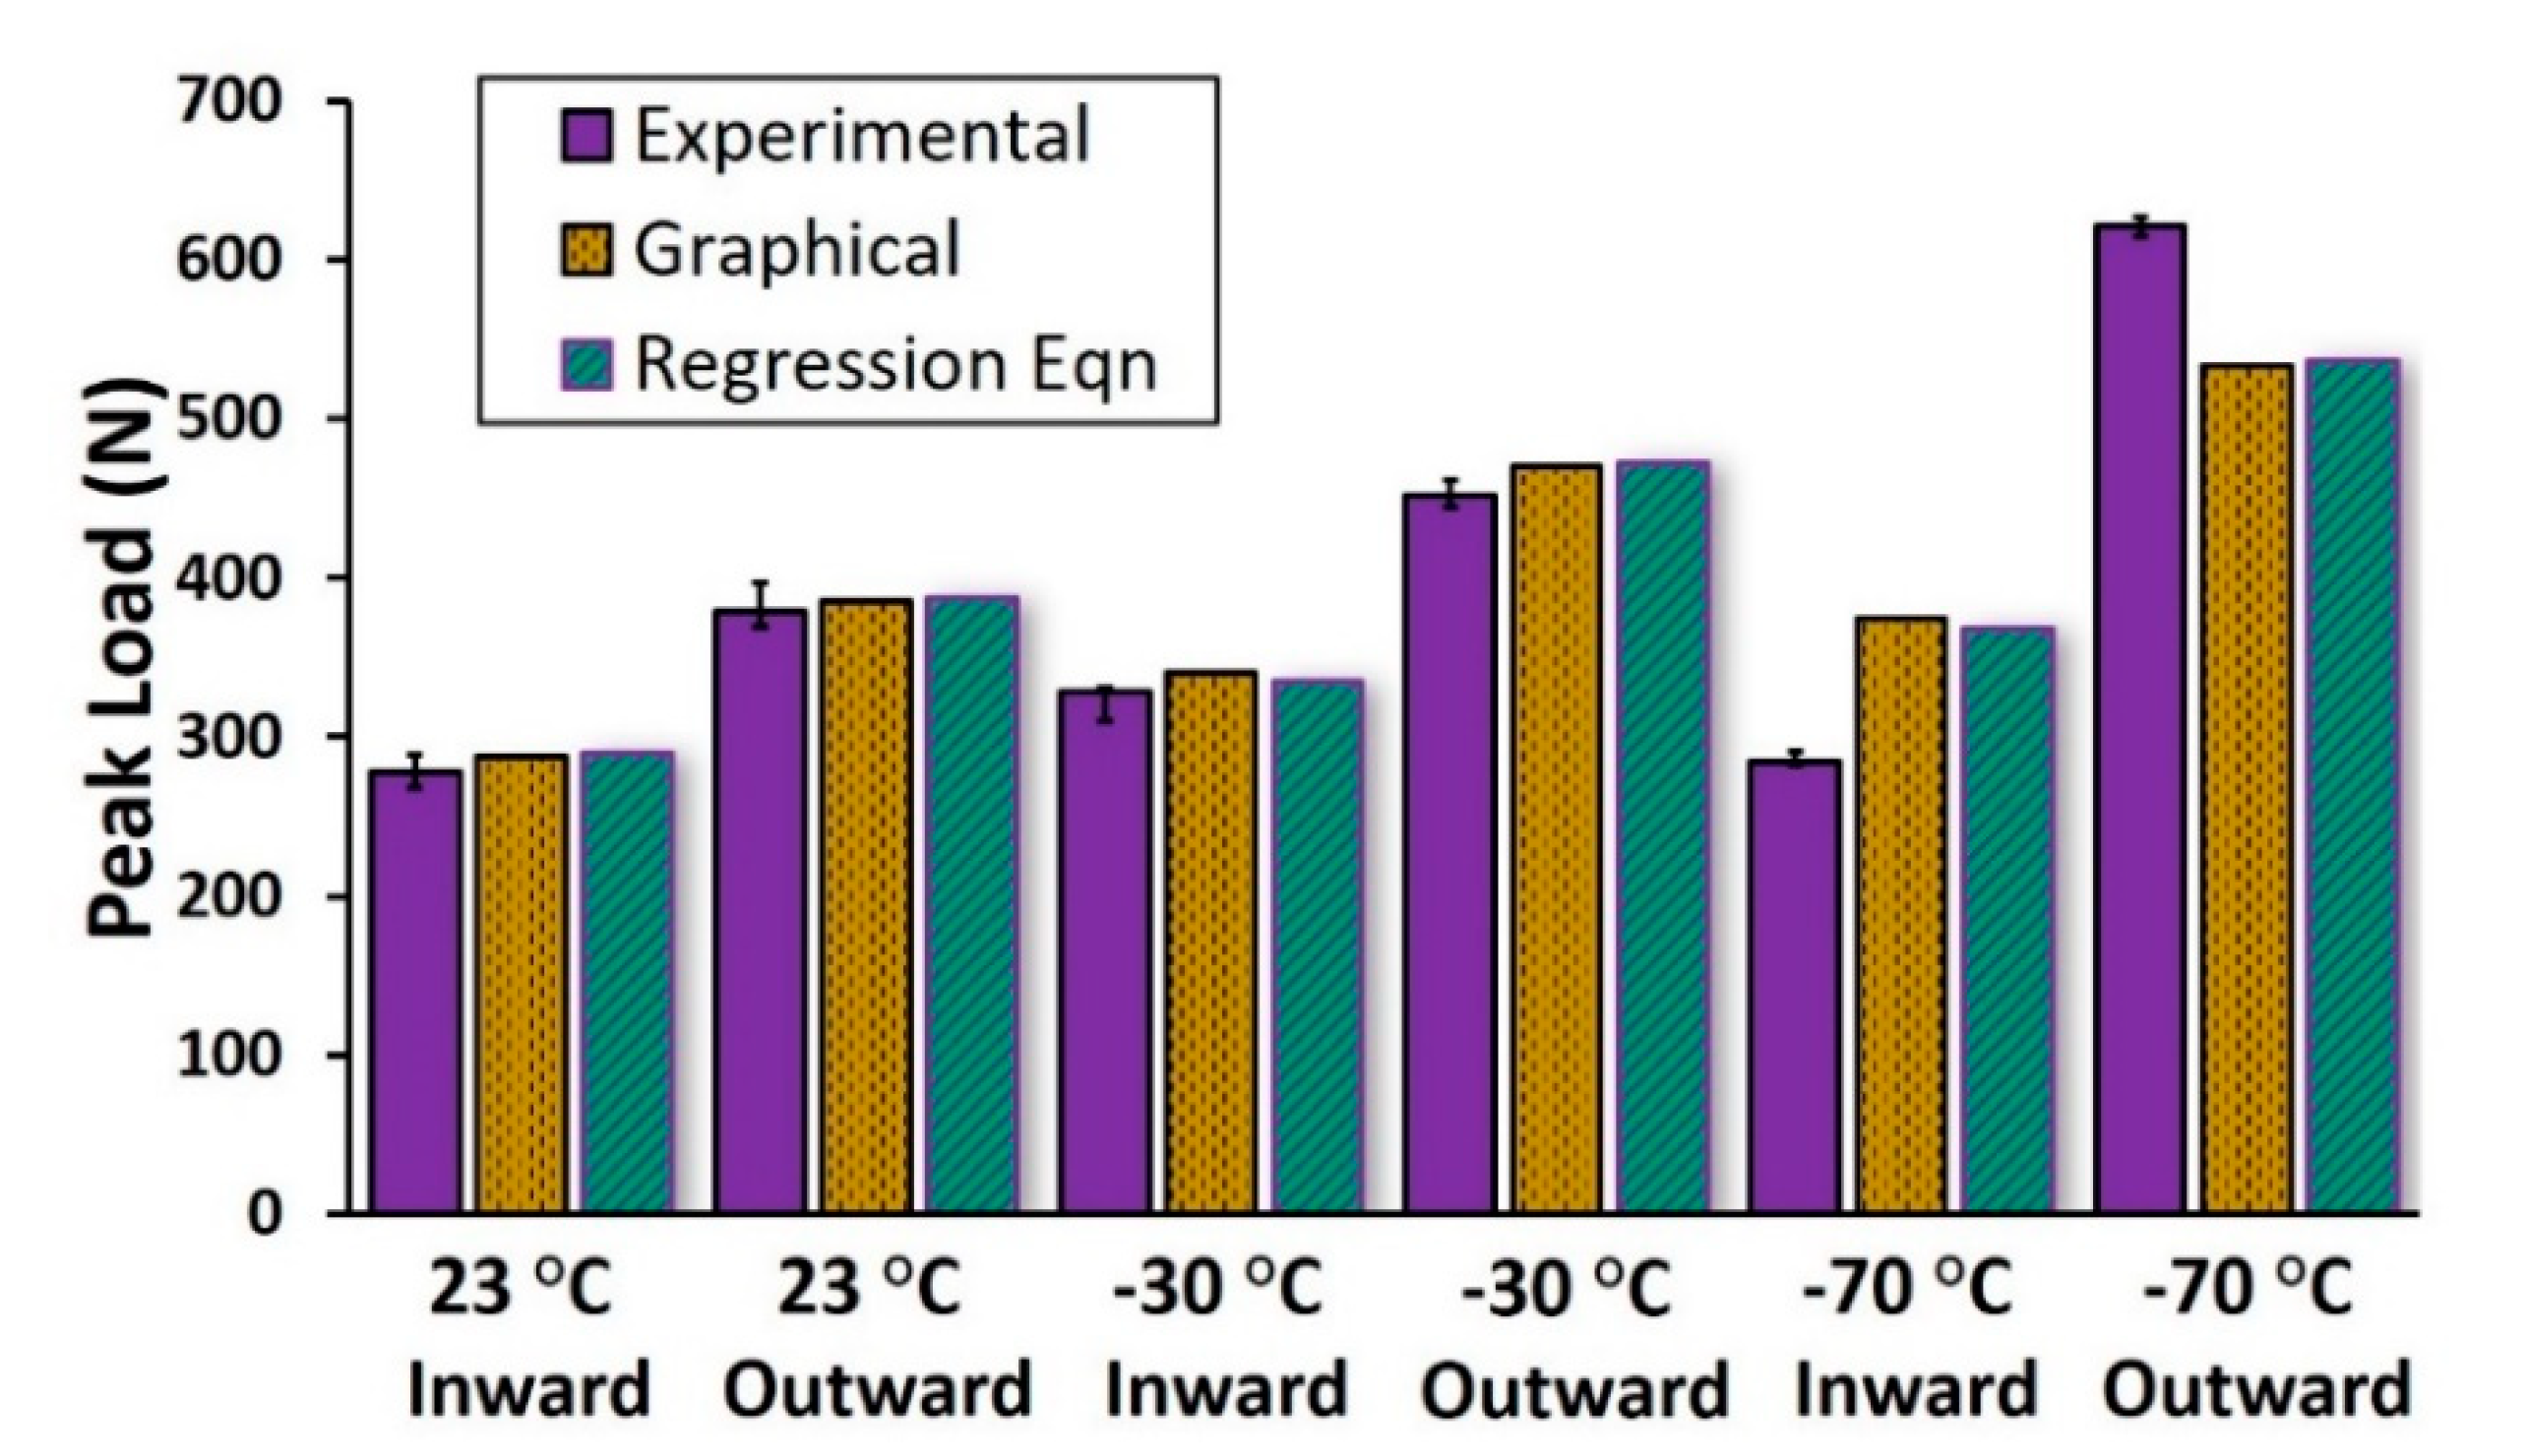
3.5. Statistical Analysis for Understanding the Influence of Factors
4. Conclusions
Author Contributions
Funding
Acknowledgments
Conflicts of Interest
References
- Vihma, T. Effects of arctic sea ice decline on weather and climate: A review. Surv. Geophys. 2014, 35, 1175–1214. [Google Scholar] [CrossRef] [Green Version]
- Sabah, S.A.; Kueh, A.B.H.; Al-Fasih, M. Comparative low-velocity impact behavior of bio-inspired and conventional sandwich composite beams. Compos. Sci. Technol. 2017, 149, 64–74. [Google Scholar] [CrossRef]
- Feng, D.; Aymerich, F. Finite element modelling of damage induced by low-velocity impact on composite laminates. Compos. Struct. 2014, 108, 161–171. [Google Scholar] [CrossRef]
- Raju, K.; Smith, B.; Tomblin, J.; Liew, K.; Guarddon, J. Impact damage resistance and tolerance of honeycomb core sandwich panels. J. Compos. Mater. 2008, 42, 385–412. [Google Scholar] [CrossRef]
- Xue, X.; Zhang, C.; Chen, W.; Wu, M.; Zhao, J. Study on the impact resistance of honeycomb sandwich structures under low-velocity/heavy mass. Compos. Struct. 2019, 226. [Google Scholar] [CrossRef]
- Atas, C.; Potoğlu, U. The effect of face-sheet thickness on low-velocity impact response of sandwich composites with foam cores. J. Sandw. Struct. Mater. 2015, 18, 215–228. [Google Scholar] [CrossRef]
- James, R.; Giurgiutiu, V.; Flores, M.; Mei, H.; Haider, M.F. Challenges of generating controlled one-inch impact damage in thick CFRP composites. In AIAA Scitech 2020 Forum; American Institute of Aeronautics and Astronautics (AIAA): Reston, VA, USA, 2020; p. 0723. [Google Scholar]
- Zhang, C.; Tan, K. Low-velocity impact response and compression after impact behavior of tubular composite sandwich structures. Compos. Part B Eng. 2020, 193, 108026. [Google Scholar] [CrossRef]
- Huo, X.; Liu, H.; Luo, Q.; Sun, G.; Li, Q. On low-velocity impact response of foam-core sandwich panels. Int. J. Mech. Sci. 2020, 181, 105681. [Google Scholar] [CrossRef]
- Xin, Y.; Yan, H.; Cheng, S.; Li, H. Drop weight impact tests on composite sandwich panel of aluminum foam and epoxy resin. Mech. Adv. Mater. Struct. 2019, 1–14. [Google Scholar] [CrossRef]
- Papa, I.; Boccarusso, L.; Langella, A.; LoPresto, V. Carbon/glass hybrid composite laminates in vinylester resin: Bending and low velocity impact tests. Compos. Struct. 2020, 232, 111571. [Google Scholar] [CrossRef]
- Long, S.; Yao, X.; Wang, H.; Zhang, X. A dynamic constitutive model for fiber-reinforced composite under impact loading. Int. J. Mech. Sci. 2020, 166, 105226. [Google Scholar] [CrossRef]
- Jia, Z.; Li, T.; Chiang, F.-P.; Wang, L. An experimental investigation of the temperature effect on the mechanics of carbon fiber reinforced polymer composites. Compos. Sci. Technol. 2018, 154, 53–63. [Google Scholar] [CrossRef]
- Khan, M.; Elamin, M.; Li, B.; Tan, K. X-ray micro-computed tomography analysis of impact damage morphology in composite sandwich structures due to cold temperature arctic condition. J. Compos. Mater. 2018, 52, 3509–3522. [Google Scholar] [CrossRef]
- Schubel, P.M.; Luo, J.-J.; Daniel, I.M. Low velocity impact behavior of composite sandwich panels. Compos. Part A: Appl. Sci. Manuf. 2005, 36, 1389–1396. [Google Scholar] [CrossRef]
- Yang, P.; Shams, S.S.; Slay, A.; Brokate, B.; Elhajjar, R. Evaluation of temperature effects on low velocity impact damage in composite sandwich panels with polymeric foam cores. Compos. Struct. 2015, 129, 213–223. [Google Scholar] [CrossRef]
- Erickson, M.D.; Kallmeyer, A.R.; Kellogg, K.G. Effect of temperature on the low-velocity impact behavior of composite sandwich panels. J. Sandw. Struct. Mater. 2005, 7, 245–264. [Google Scholar] [CrossRef]
- National Geographic Arctic. Available online: https://www.nationalgeographic.org/encyclopedia/arctic/ (accessed on 28 March 2018).
- Sutherland, L. The effects of test parameters on the impact response of glass reinforced plastic using an experimental design approach. Compos. Sci. Technol. 2003, 63, 1–18. [Google Scholar] [CrossRef]
- Alonso, M.V.; Auad, M.L.; Nutt, S.R. Modeling the compressive properties of glass fiber reinforced epoxy foam using the analysis of variance approach. Compos. Sci. Technol. 2006, 66, 2126–2134. [Google Scholar] [CrossRef]
- De Vivo, B.; Lamberti, P.; Spinelli, G.; Tucci, V.; Guadagno, L.; Raimondo, M.; Vertuccio, L.; Vittoria, V. Improvement of the electrical conductivity in multiphase epoxy-based MWCNT nanocomposites by means of an optimized clay content. Compos. Sci. Technol. 2013, 89, 69–76. [Google Scholar] [CrossRef]
- Ibekwe, S.I.; Mensah, P.F.; Li, G.; Pang, S.-S.; Stubblefield, M.A. Impact and post impact response of laminated beams at low temperatures. Compos. Struct. 2007, 79, 12–17. [Google Scholar] [CrossRef]
- Salehi-Khojin, A.; Mahinfalah, M.; Bashirzadeh, R.; Freeman, B. Temperature effects on Kevlar/hybrid and carbon fiber composite sandwiches under impact loading. Compos. Struct. 2007, 78, 197–206. [Google Scholar] [CrossRef]
- Elamin, M.; Li, B.; Tan, K. Impact damage of composite sandwich structures in arctic condition. Compos. Struct. 2018, 192, 422–433. [Google Scholar] [CrossRef]
- Garcia, C.D.; Shahapurkar, K.; Doddamani, M.; Kumar, G.C.M.; Prabhakar, P. Effect of arctic environment on flexural behavior of fly ash cenosphere reinforced epoxy syntactic foams. Compos. Part B Eng. 2018, 151, 265–273. [Google Scholar] [CrossRef]


| Factors | Factor Levels | |
|---|---|---|
| Low Level (−1) | High Level (+1) | |
| Face sheet thickness | 0.25 mm | 0.75 mm |
| Temperature | −70 °C | 23 °C |
| Impact energy | 0 J | 8 J |
| Bending configuration | Inward | Outward |
© 2020 by the authors. Licensee MDPI, Basel, Switzerland. This article is an open access article distributed under the terms and conditions of the Creative Commons Attribution (CC BY) license (http://creativecommons.org/licenses/by/4.0/).
Share and Cite
Khan, M.H.; Li, B.; Tan, K.T. Impact Performance and Bending Behavior of Carbon-Fiber Foam-Core Sandwich Composite Structures in Cold Arctic Temperature. J. Compos. Sci. 2020, 4, 133. https://0-doi-org.brum.beds.ac.uk/10.3390/jcs4030133
Khan MH, Li B, Tan KT. Impact Performance and Bending Behavior of Carbon-Fiber Foam-Core Sandwich Composite Structures in Cold Arctic Temperature. Journal of Composites Science. 2020; 4(3):133. https://0-doi-org.brum.beds.ac.uk/10.3390/jcs4030133
Chicago/Turabian StyleKhan, M.H., Bing Li, and K.T. Tan. 2020. "Impact Performance and Bending Behavior of Carbon-Fiber Foam-Core Sandwich Composite Structures in Cold Arctic Temperature" Journal of Composites Science 4, no. 3: 133. https://0-doi-org.brum.beds.ac.uk/10.3390/jcs4030133