1. Introduction
Fiber reinforced polymers offer a number of advantages over the classic construction materials, such as their high specific stiffness or the potential to increase the stiffness of the component specifically in the direction of the loads that are encountered during operation. These materials consist of a fiber component, which is essentially responsible for the load-bearing properties and the stiffness and a plastic matrix, which stabilizes the fibers and is responsible for the load introduction into the fibers and the load transfer between the fibers. Thermosetting plastics are most commonly used as matrix materials, especially epoxy resin. During production, thermosetting plastics cure to their final shape and transform from a liquid monomer mixture into a solid polymer network.
The mechanical properties of fiber reinforced polymer structures depend on the degree of completion of the curing reaction. Incomplete curing may result in the structure having a lower cross-linking density, which impairs elastic modulus and strength. Monitoring of the production process is necessary for quality assurance, since errors during curing can lead to failure of the part during operation. The data obtained allows process parameters to be optimized so that fewer faulty parts are produced. In the future, it would also be conceivable to control production by selectively post-curing areas of the component where the curing reaction takes place more slowly.
The curing reaction can be monitored via various physical effects, since a wide variety of properties change during polymerization [
1,
2]. Structure-borne sound methods are based on the change of mechanical properties [
3], refractive methods use the change of the refractive index [
4], strain-based methods such as Fiber Bragg Gratings measure the chemical shrinkage during the curing reaction [
5], thermodynamic methods such as Differential Scanning Calorimetry measure the heat released during the exothermic reaction and dielectric methods are based on the change of dielectric properties of the epoxy resin [
6]. Dielectric monitoring of the curing reaction using film sensors has several advantages over the other methods mentioned. For example, dielectric measurement of the curing reaction allows a very fine spatial resolution of the curing reaction and is therefore not dependent on the global fiber volume content like structure-borne sound methods. Unlike strain-based methods, a dielectric method records the curing reaction even before the gel point, when the liquid epoxy resin is not yet able to transfer forces to the fibers. Compared to thermodynamic methods, dielectric measurement has the advantage that it works outside a laboratory environment. In addition, there are standard processes, like e.g., flexible circuit board technology for the production of film sensors which allow a reduction of the manufacturing costs as already used by Yang et al. for Polyimide (PI) substrates [
7].
The fact that the dielectric properties change during the curing of epoxy resins has been known and used to observe the curing reaction since the middle of the last century [
8]. The dielectric measurement of the curing reaction by means of film sensors became possible by using interdigital structures. Dielectric curing monitoring using 100 μm thin PI-copper sensors was already carried out in 1995 by Maistros and Partridge [
6]. Based on so-called flexible printed circuit boards made of a PI substrate with a copper coating, miniaturized interdigital sensors can be designed. The sensitivity of these sensors strongly depends on the geometry of the interdigital electrodes [
7]. Sensitivity and immunity to interference can be further enhanced by electrically shielding the sensor with a copper coating on the bottom of the PI film used [
9].
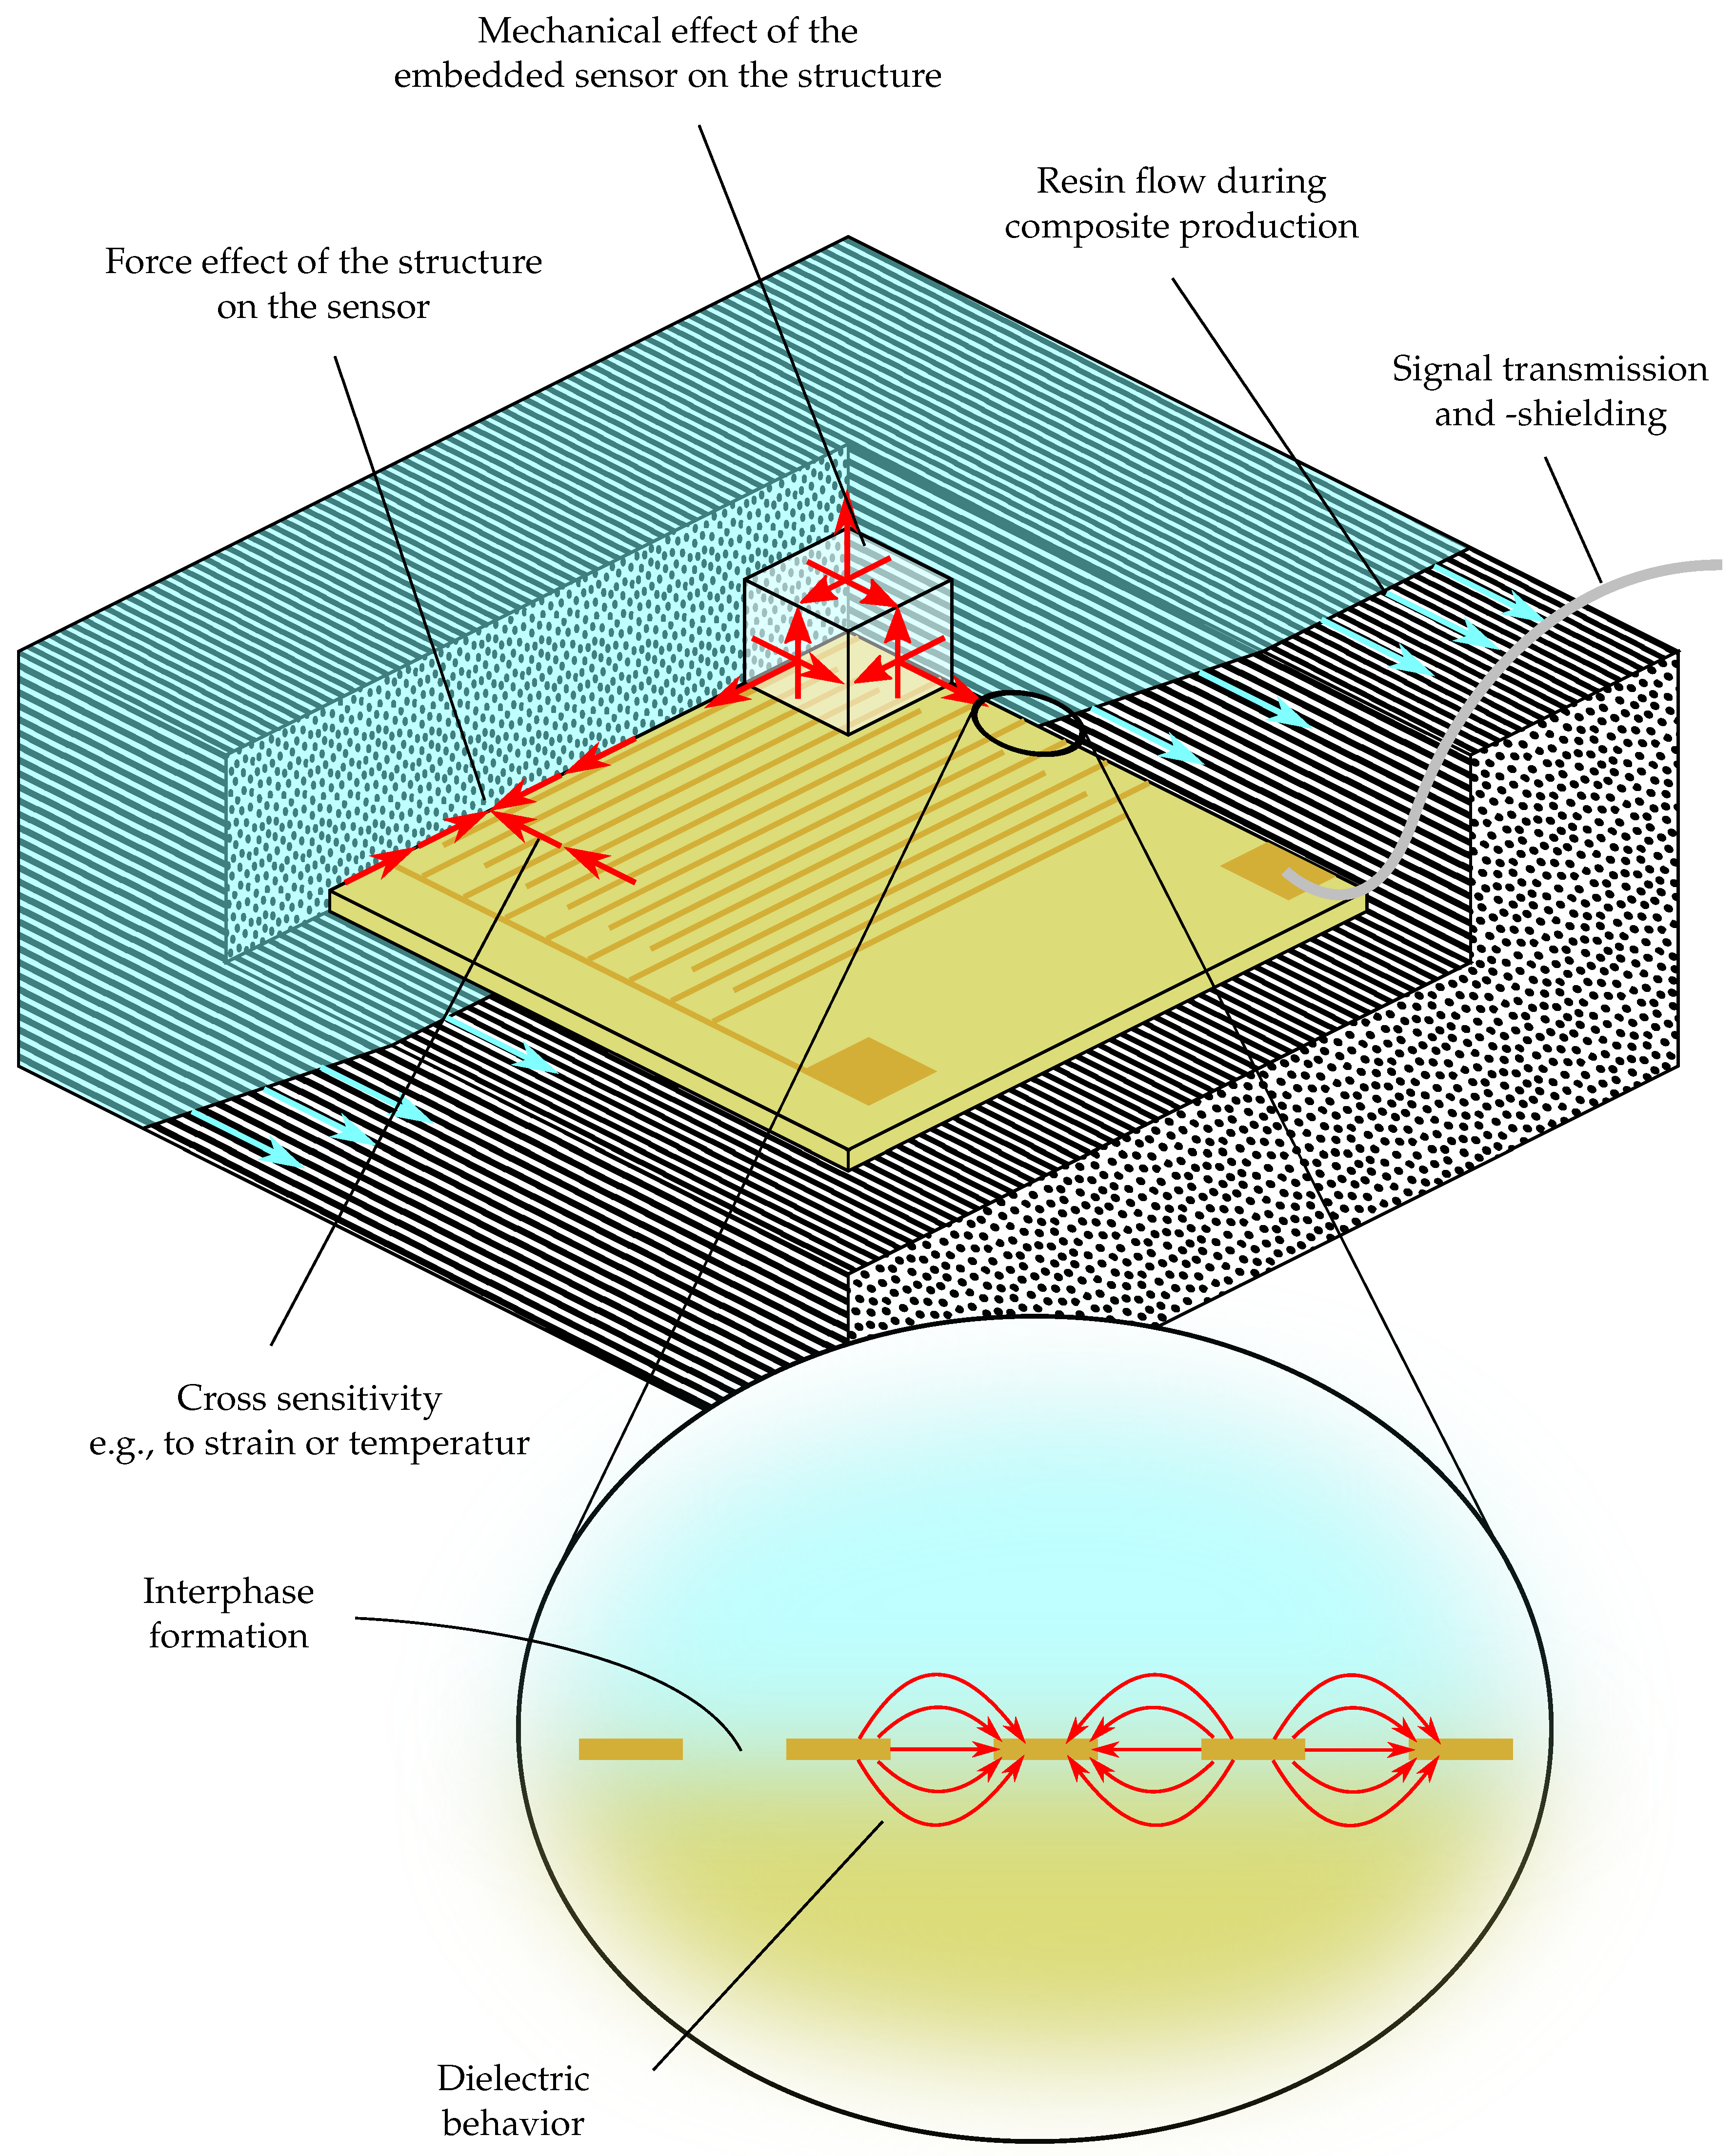
In order to use the full potential of film sensors, they should be integrated into the fiber composite polymer. The embedding of dielectric film sensors raises several questions, such as the influence on the resin flow, the signal transmission out of the fiber composite or the bonding of the sensors to the rest of the composite, see
Figure 1. The article at hand addresses the influence of the integrated thermoplastic films on the mechanical properties of the composite. The planar structure of the sensors poses a problem, since the sensors can promote delamination of the fiber composite structure and subsequent crack propagation if the substrate is not suitable. Dumstorff et al. speak about a wound in the matrix material which can be reduced by a high adhesion strength between sensor and structure and an adapted stiffness between sensor and structure [
10]. Miniaturization of the sensors helps to reduce the wound effect. In addition to the miniaturization of the sensors, the insertion of holes in the substrate film also has improved the interlaminar shear strength [
11]. Here, the increase in adhesion strength is achieved by the microgeometry of the interface by creating a form closure. By replacing PI with plasticized RTM6, a doubling of the adhesive strength can be achieved [
12]. Because the already cured film does not cross-link with the epoxy matrix, the adhesion strength does not come close to the strength of the reference samples without a film.
As an alternative to form closure, the function of the bonding can also be achieved by material closure. For this purpose, sensor substrates have to be used which can cross-link with the epoxy resin or form a strong bond with the epoxy resin. If the selected substrates also have a similar stiffness as the surrounding bond, the wound effect can be avoided. One way to increase binding is a surface treatment of PI film, in which PI is superficially converted to polyamic acid by a chemical treatment, resulting in a broader interphase due to chain entanglement and chemical reactions [
13]. An increase in the critical energy release rate from 25
to 100
is reported [
14]. An alternative is to use substrates that show a good adhesion to epoxy without surface treatment. The thermoplastics polyetherimide (PEI) and polyethersulfone (PES) are known as partially soluble toughening modifiers and it has been proven that they form an interphase with the epoxy resin [
15]. Polyamide 6 (PA6) is used as a yarn filament in fiber layups and in this respect also has a practical significance in combination with fiber composites. In addition, chemical reactions, hydrogen bonding and mechanical entanglement of the polymer chains can result in high adhesion strength between epoxy resin and PA6 [
16].
The suitability of the above materials as a sensor substrate with minimal wound effect is tested using various mechanical testing methods. Tensile tests perpendicular to the fiber orientation are used to demonstrate that 25 μm thin thermoplastic films do not have a negative effect on the tensile strength of the matrix resin even if the thermoplastic could dissolve and diffuse into the epoxy matrix. The effects of the sensor edges are also investigated using tensile specimens by embedding strips of the film materials used. Interlaminar shear (ILS) tests serve both to determine the shear strength of the epoxy-thermoplastic compound and to evaluate the gold-epoxy compound and the effect of sensor edges. Double Cantilever Beam (DCB) samples are used to determine the effect of the films on the delamination tendency for the particularly critical Mode I crack propagation due to peel stresses. Compression After Impact (CAI) tests are used to determine the sensitivity of laminates with the above-mentioned film materials to impact damage. In addition to the area of damage caused by an impact, CAI tests also provide information about the residual strength of damaged fiber composite plastic structures.
2. Materials and Methods
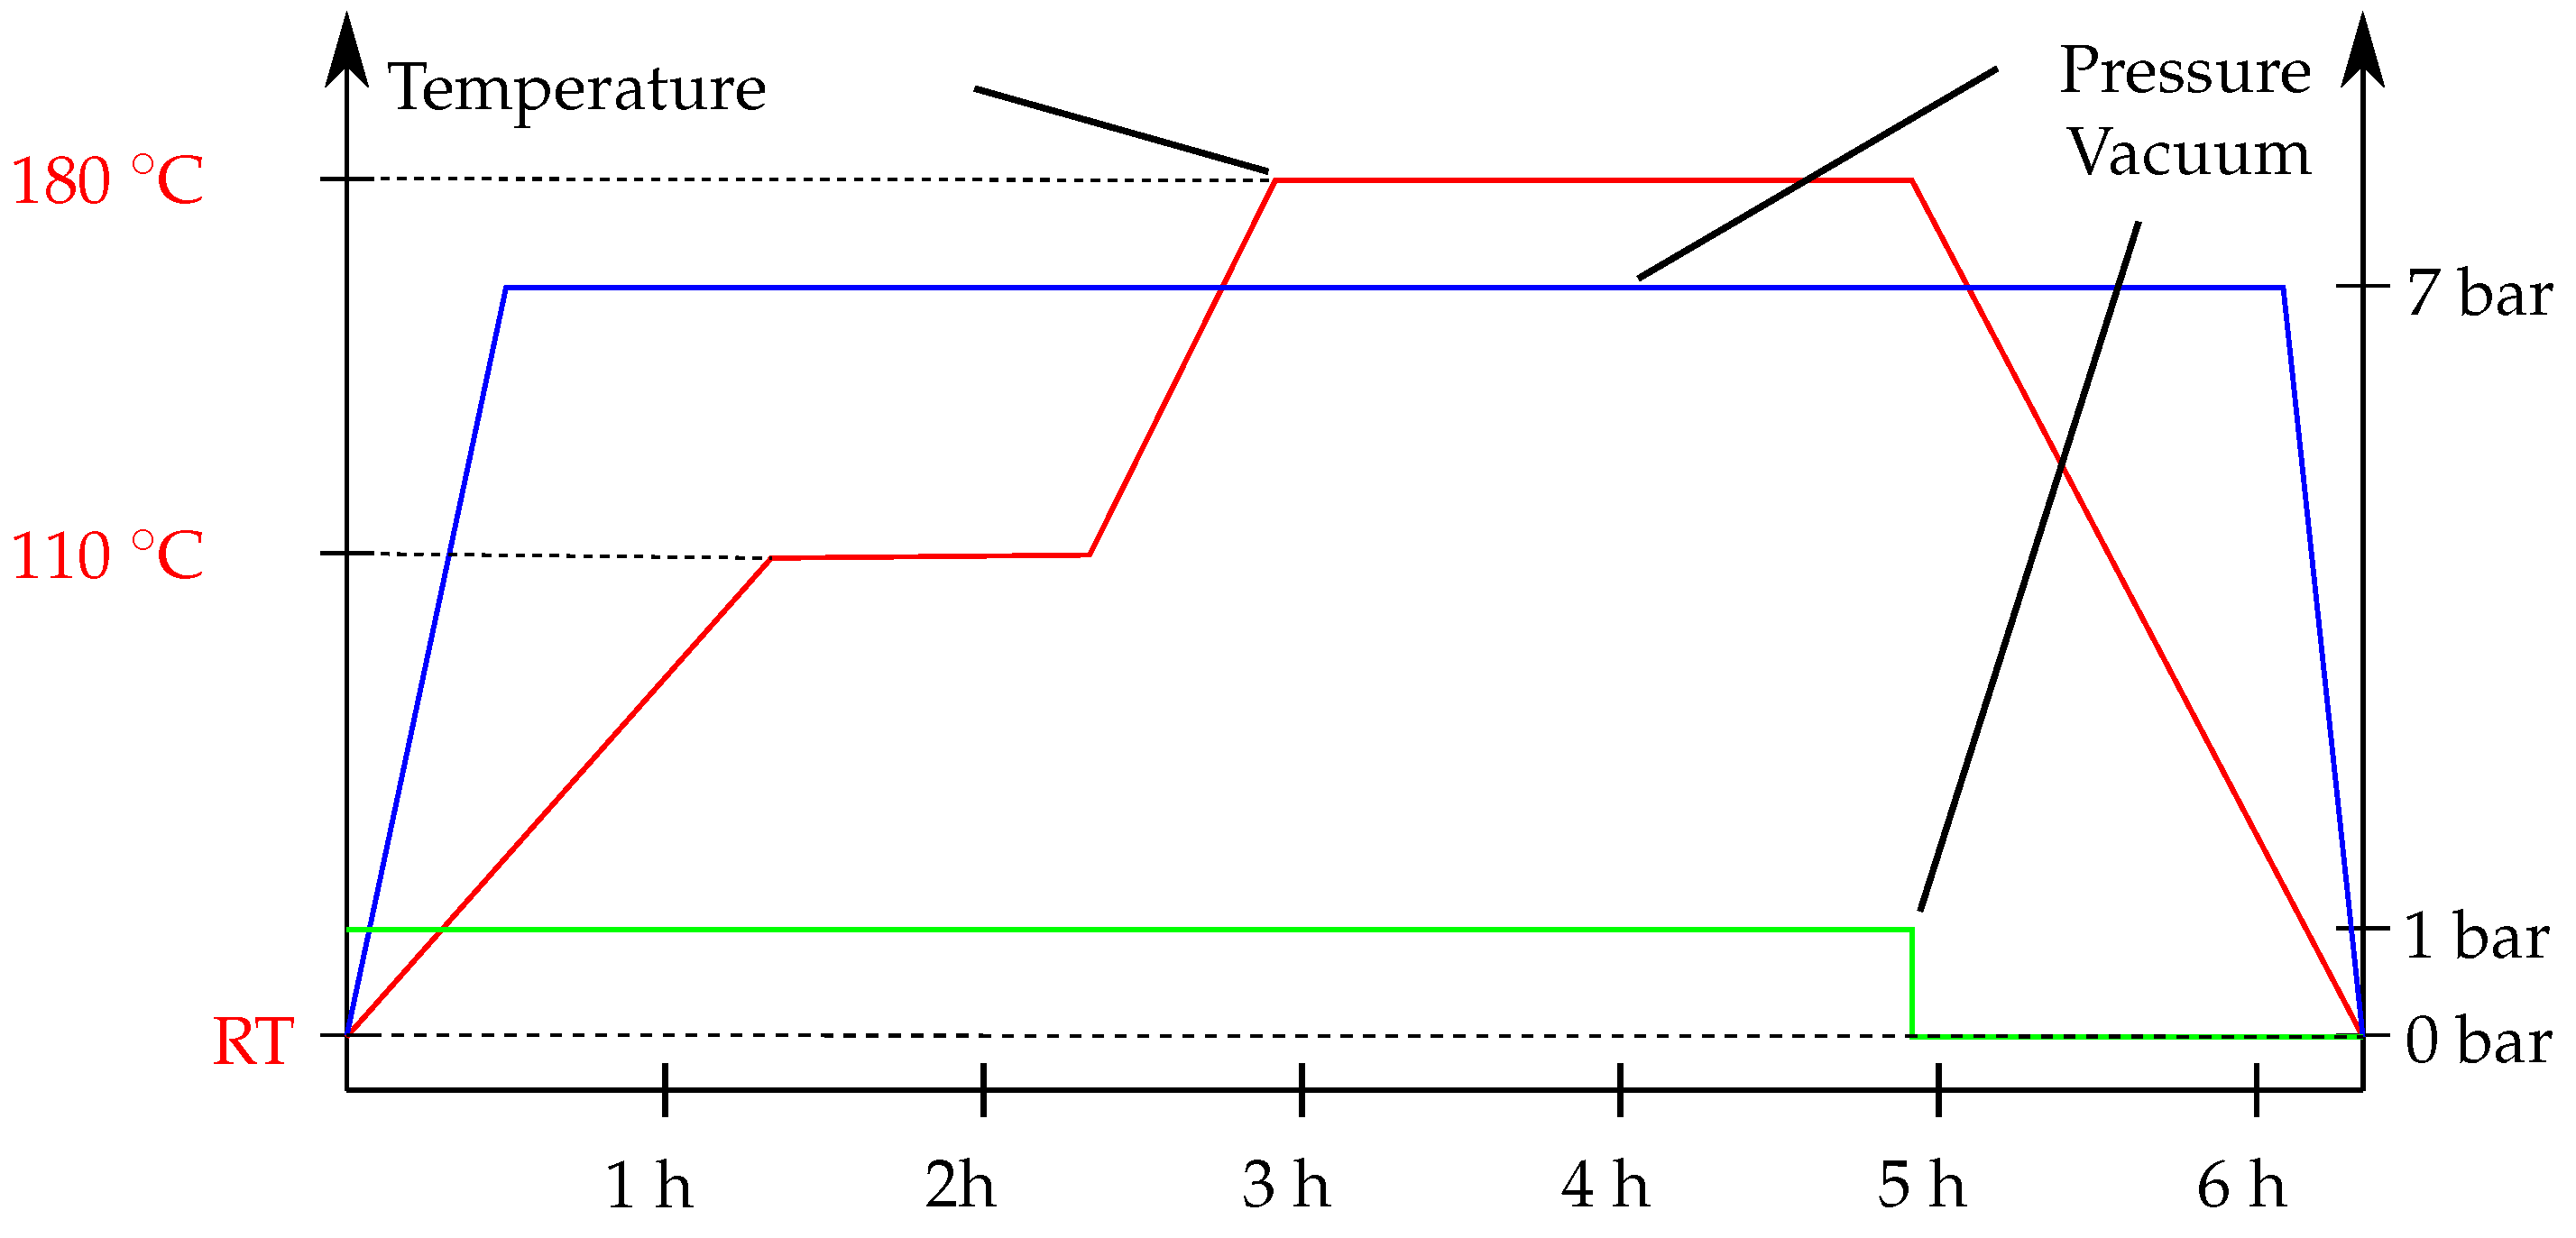
Commercial HexPly 8552 prepreg material from Hexcel with unidirectional AS4 carbon fibers with a filament count of 12 k was used for all specimens presented in this article. According to the manufacturer, it is an amine-curing, toughened epoxy resin system. The nominal thickness of a cured layer is 130 μm and the nominal fiber volume content is 57.42%. The cure cycle shown in
Figure 2 was used to cure all specimens. This differs from the curing cycle from the data sheet only in that the vacuum is not reduced to 0.2 bar after application of the autoclave pressure but is kept at 1 bar for technical reasons.
The thermoplastic films in this study were a PA6 film, a PEI film, a PES film and a PI film. The PA6 film used is a 25 μm thin cast polyamide film which was kindly provided by mf-folien GmbH. A 25 μm thin Ultem 1000 film from Goodfellow was selected as PEI. The PES film utilized is the 25 μm thin Lite S film from Lipp Terler. The PI film is a 50 μm thin Kapton film HN type from Dupont.
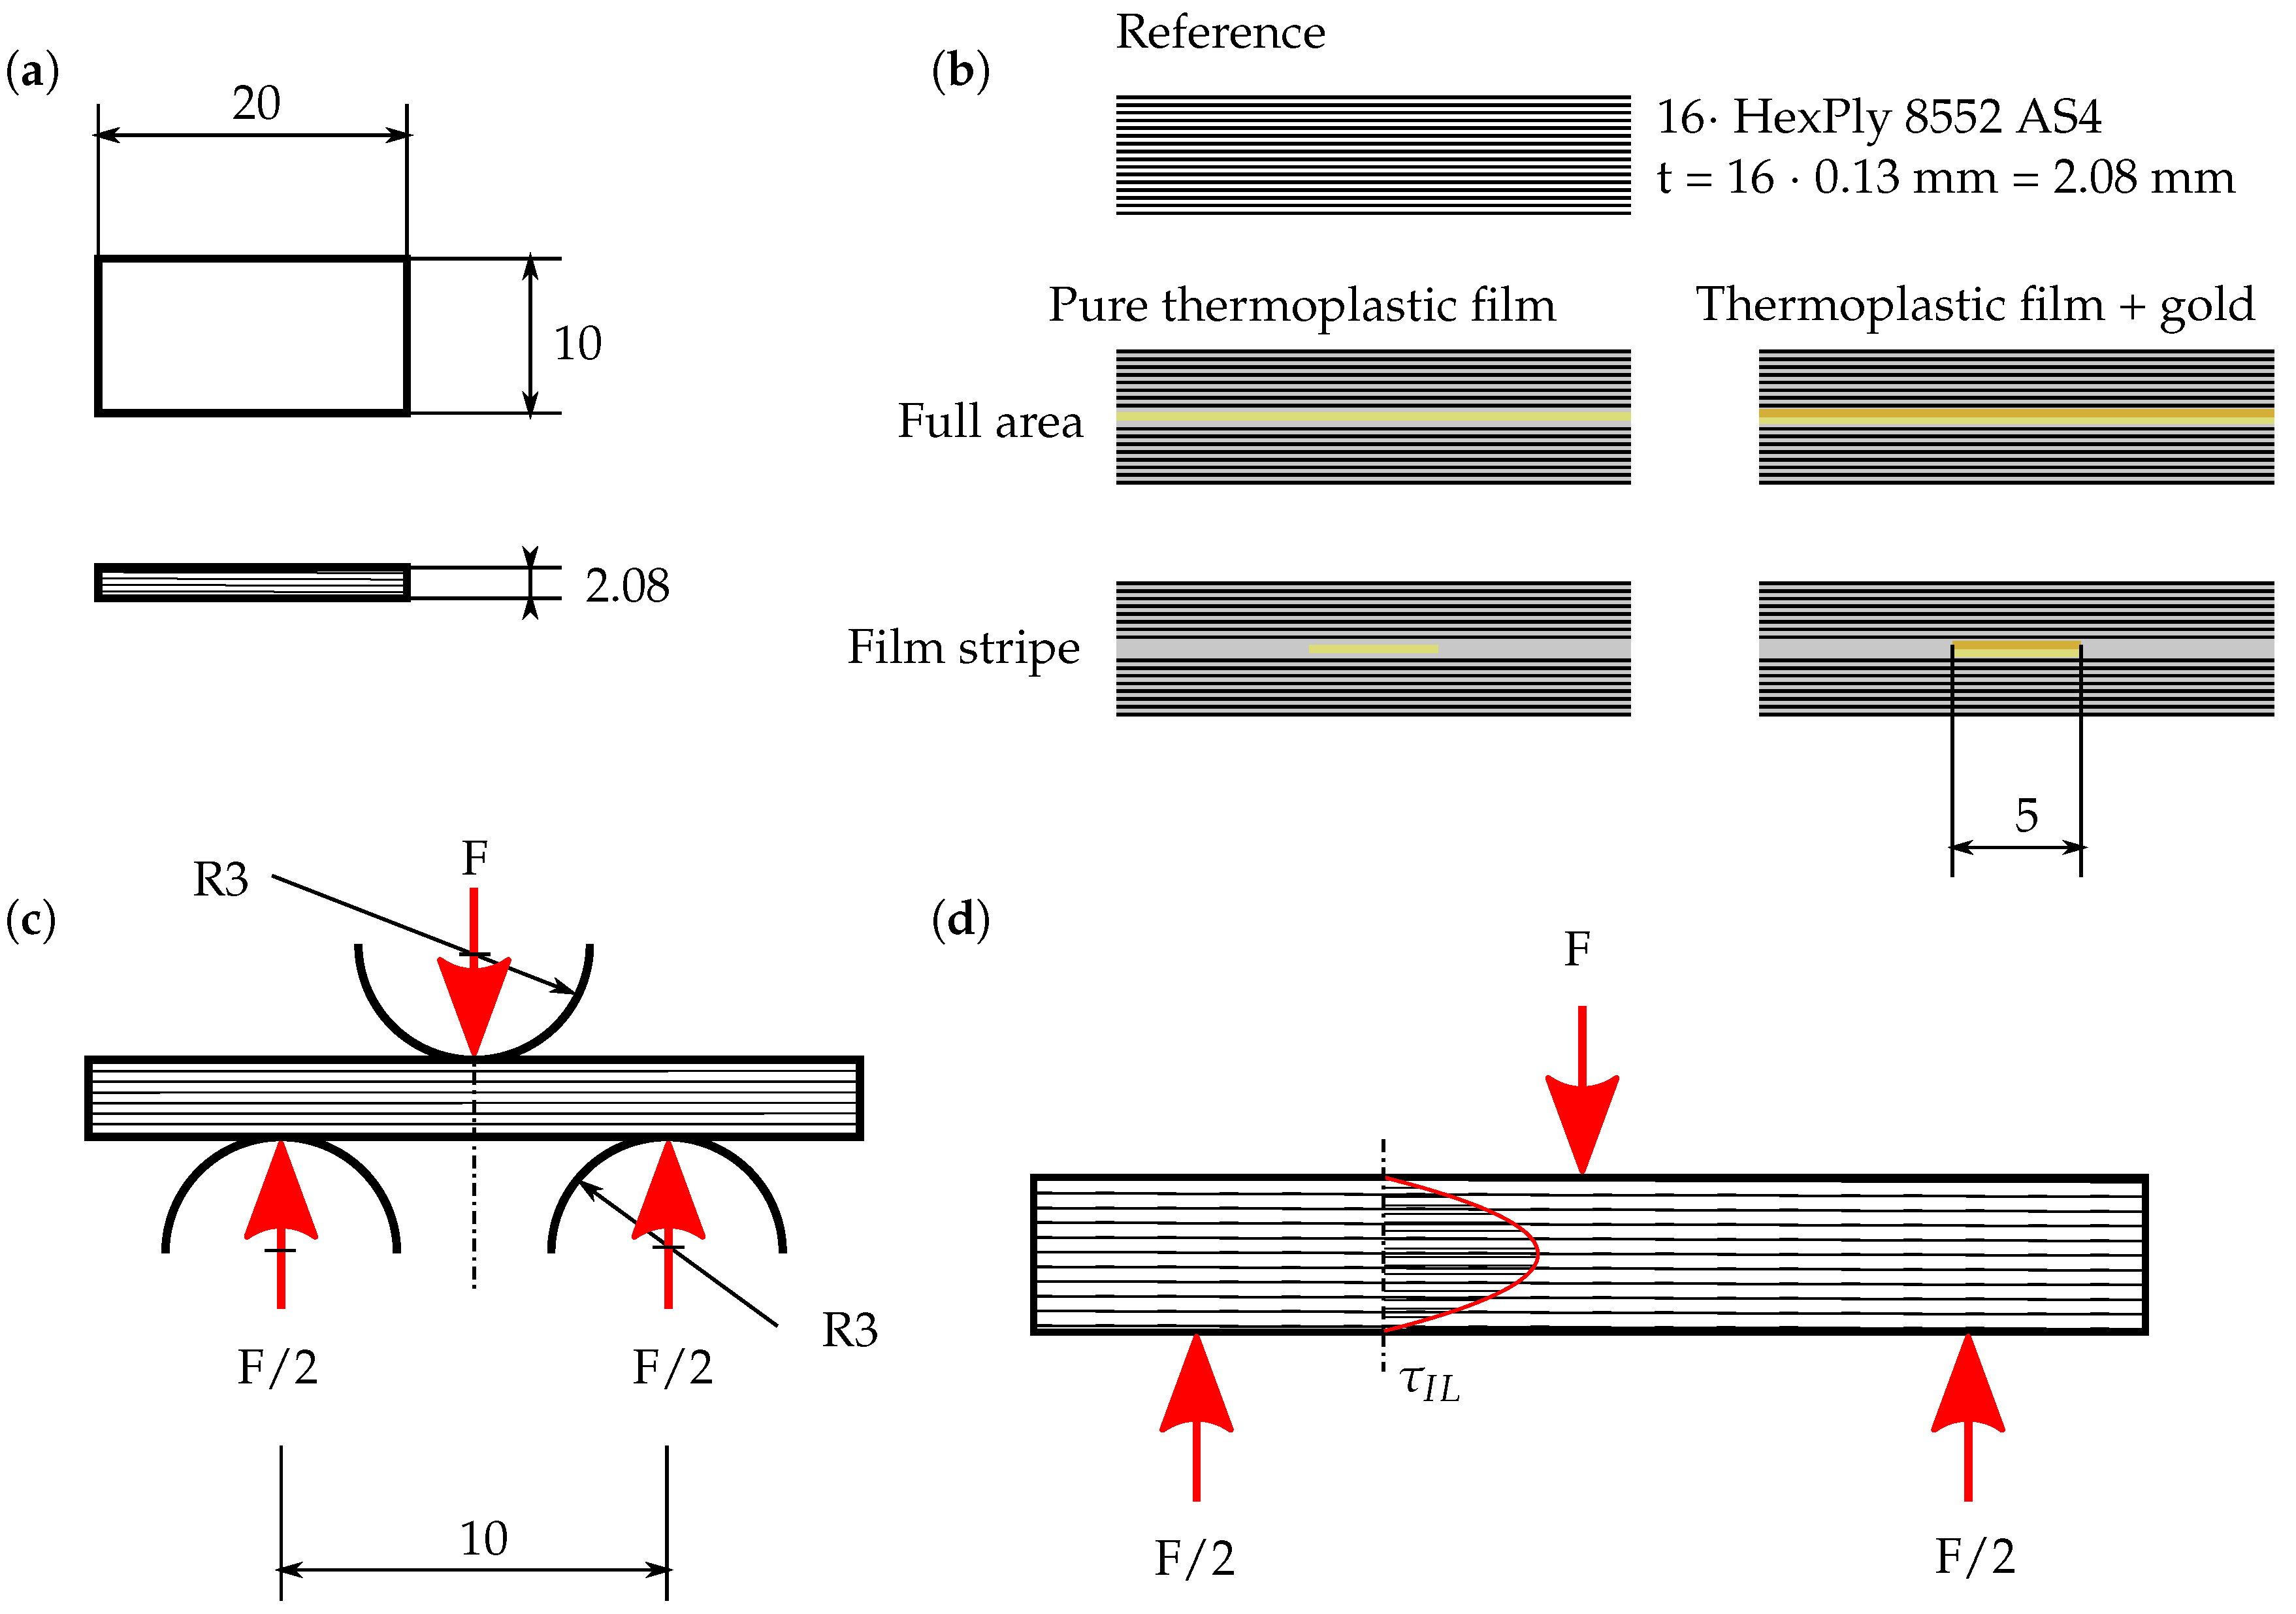
The ILS specimens are made of 16 layers of prepreg and manufactured according to DIN EN 2563 geometry with unidirectional fiber orientation in the length direction, see
Figure 3. Except for the reference sample, a 25 μm thick thermoplastic film of PEI, PES or PA6 is inserted between the eighth and ninth layer in the middle plane. The calculated thickness of the laminates is therefore
. To coat the thermoplastic films with gold, they are first sputtered with chromium for 50 s at a power of 50
and then with gold for 300 s. This creates a chromium adhesion layer on the thermoplastic film that is about 20
thin and a gold layer about 150
thin. The film stripes inserted in some of the test specimens have a length of 5
and a width of 10
. For each of the configurations in
Figure 3b, seven specimens were tested. According to DIN EN 2563, the test fixture has a bearing distance of 10
. The compression test is carried out on a Instron universal testing machine with a force range up to 30
and a load cell with a measuring range up to 10
.
From the measured force
F the acting interlaminar shear stress
is calculated according to DIN EN 2563 from the specimen width
b and the specimen thickness
h. The calculation formula proposed by the standard is given in the following and is basically only valid for the case in which no plastic deformations occur. Because the epoxy matrix is very brittle and the volume content of the ductile thermoplastics is very low, the formula is assumed to be valid:
The differential compliance
is calculated by deriving the traverse path
x by the acting compressive force
F. It includes the compliance of the specimen as well as that of the testing machine, but this is small compared to the compliance of the specimen and is also the same for all specimens.
For the tensile tests, coupons are made from 8 layers of prepreg with a fiber orientation of 90° to the tensile direction respectively the longest dimension of the specimen, resulting in a laminate thickness of about 1
, see
Figure 4. Each plate is cut into seven specimens, which are 15
wide and correspond to the type A specimen described in DIN EN ISO 527. Between the fourth and fifth layer, 25 μm thin films of PEI, PES or PA6 are inserted over the entire surface or film strips of these thermoplastics with a width of 20 mm. To apply the loads in the tensile testing machine, GFRP cap strips about 1 mm thick with a +45°/−45° layer structure are glued onto the samples with a Loctite EA 9466 epoxy adhesive. For this purpose the specimens are manufactured with peel ply on the surface. In order to glue the cap strips to the laminates, the peel ply was removed from the laminate and the cap strip, then the adhesive was applied and the adhesive cured at room temperature for one day. No further sanding process was performed.
The specimens are tested using a universal testing machine with a force range up to 30 with a load cell with a measuring range up to 10 . The tensile stress is calculated in accordance with DIN EN ISO 527 as the force measured by the tensile testing machine in relation to the specimen cross-section measured before the test. The maximum tensile stress occurring in the test is specified as the tensile strength.
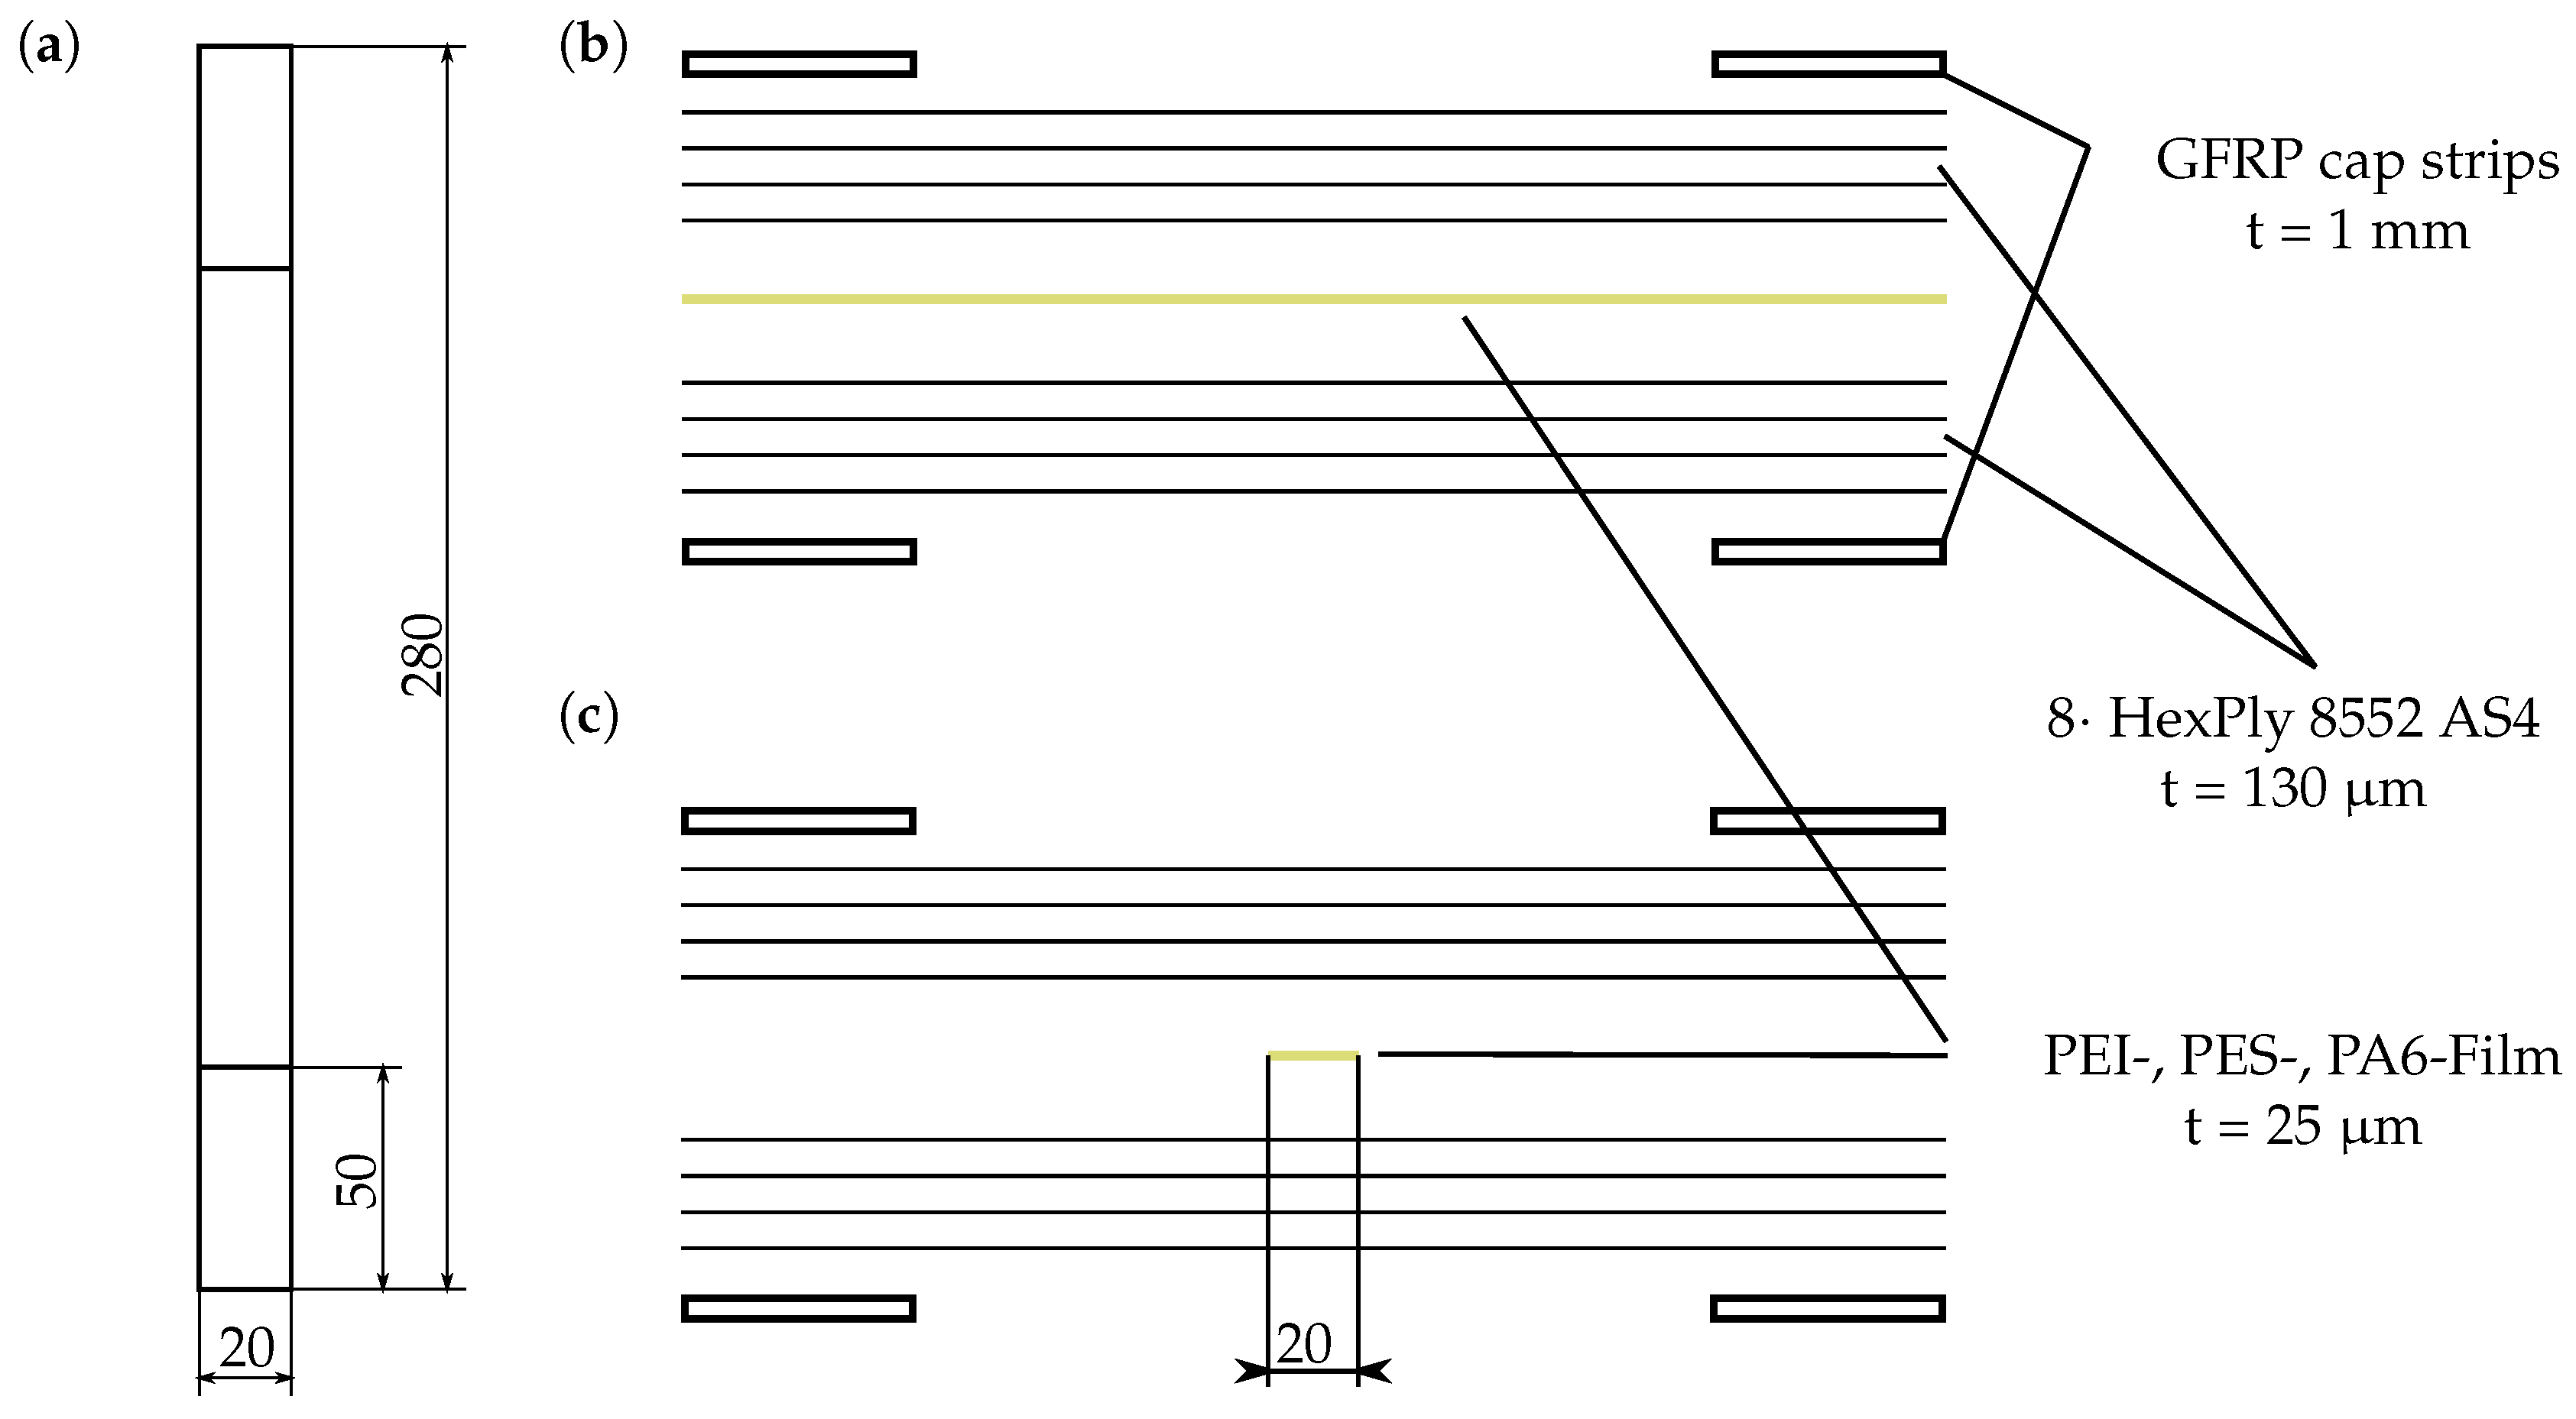
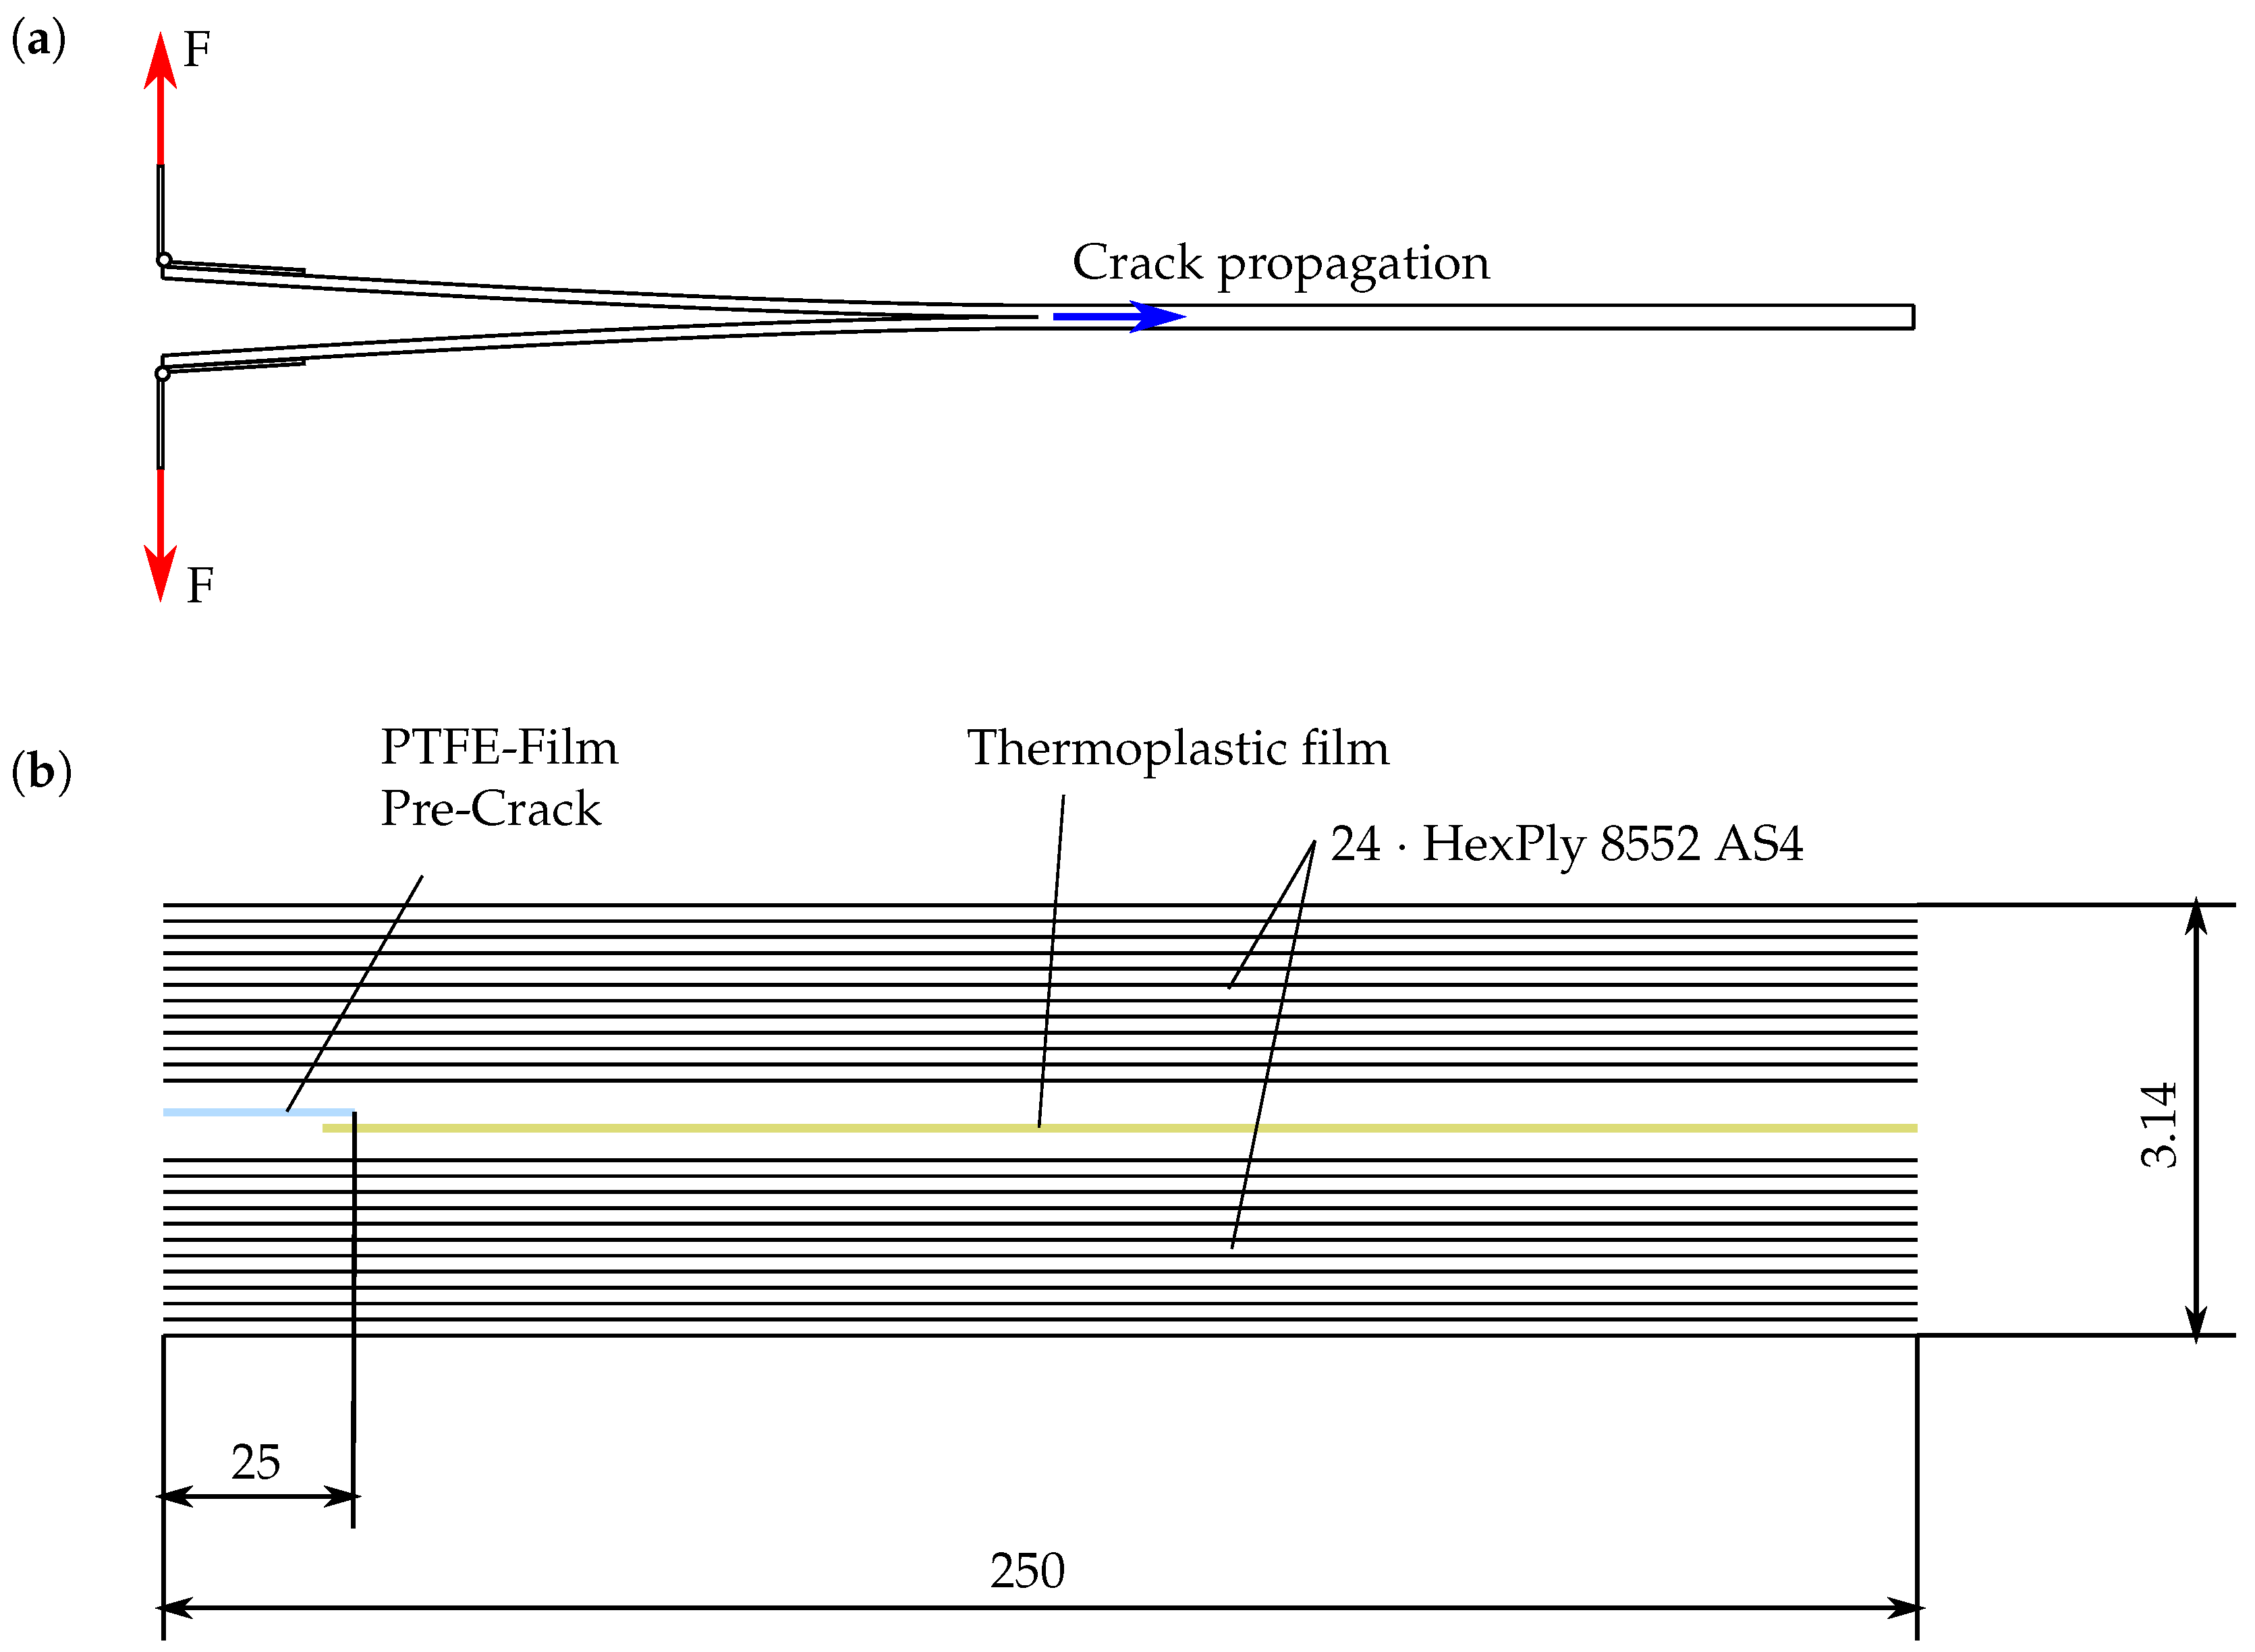
The manufacturing of the DCB specimens is carried out according to the dimensions and recommendations mentioned in DIN EN 6033, see
Figure 5. The specimens are 250
long, 25
wide and about 3
thick corresponding to 24 prepreg layers. The initial crack has a length of 25 mm, which is created by the insertion of a separating film. First of all, 12 layers of prepreg are laminated and then the thermoplastic film and the release film are introduced. After that, the remaining 12 layers are laminated and the whole specimen plate is cured in the autoclave. Seven specimens for each configuration are cut out of the manufactured plate and piano hinges (25 mm × 25 mm × 1 mm) are glued onto the samples as a load introduction using Loctite EA 9466 epoxy adhesive. On the laminate surfaces a peel ply was used to achieve a rough surface and the piano hinges were sanded with 180 grit sand paper. To ensure that the peel strength of the adhesive is not exceeded, the hinges are glued on in reverse in comparison to DIN EN 6033, see
Figure 5.
For the purpose of testing, a universal testing machine is used. The procedure for the testing process also complies with the recommendations of DIN EN 6033. Initially the testing machine is operated with a traverse speed of 2 mm for one minute to induce an initial crack of 10 to 15 mm length to prevent the effect of the precrack, then the length of the initial crack is marked. The testing machine is then driven at a traverse speed of 10 mm until a predetermined displacement value is reached. For the reference samples the displacement value was set to 22 , due to the higher crack resistance the displacement value was adjusted to 28 for the samples with PEI and PES film and 29 for the samples with integrated PA6 film. In the case of the samples with integrated PI film, the displacement value was adjusted several times so the maximum displacement values lie between 20 and 28 . After that the final crack length is marked. During the testing of the DCB specimens, force and traverse path are measured and a video of crack propagation is recorded.
The obtained data is evaluated according to both DIN EN 6033 and ASTM D5528. The purpose of using two different standards is to determine whether there may be a difference in the resulting
values. The ASTM D5528 considers large displacement effects, which influence the results and must be considered. The
value according to DIN EN 6033 is calculated using the following equation:
where
is the difference of the initial crack and the crack at the end of the experiment and
b is the width of the specimen.
W represents the energy under the force traverse path curve
during loading, crack propagation and unloading. It can be calculated from the following circulation integral:
ASTM D5528 calculates the
value via Modified Beam Theory (MBT), Compliance Calibration (CC) method or Modified Compliance Calibration (MCC) method. It should be noted here that the
value is a function of the crack length
a for all three methods of ASTM D5528, so it is necessary to take a video recording of the crack propagation through the specimens during the test procedure.
where
C is the compliance of the DCB specimens, calculated by dividing the traverse path
x by the force
F:
. The correction length
, the stiffness exponent
n and MCC coefficient
can be calculated from a linear regression of the calculated compliance over crack length curves.
To account for large displacement effects ASTM D5528 uses a correction factor
K, which was proposed by Williams [
17] and has to be multiplied with the calculated
value:
where
is defined as a quarter of the specimen thickness
h plus the thickness of the piano hinges
mm.
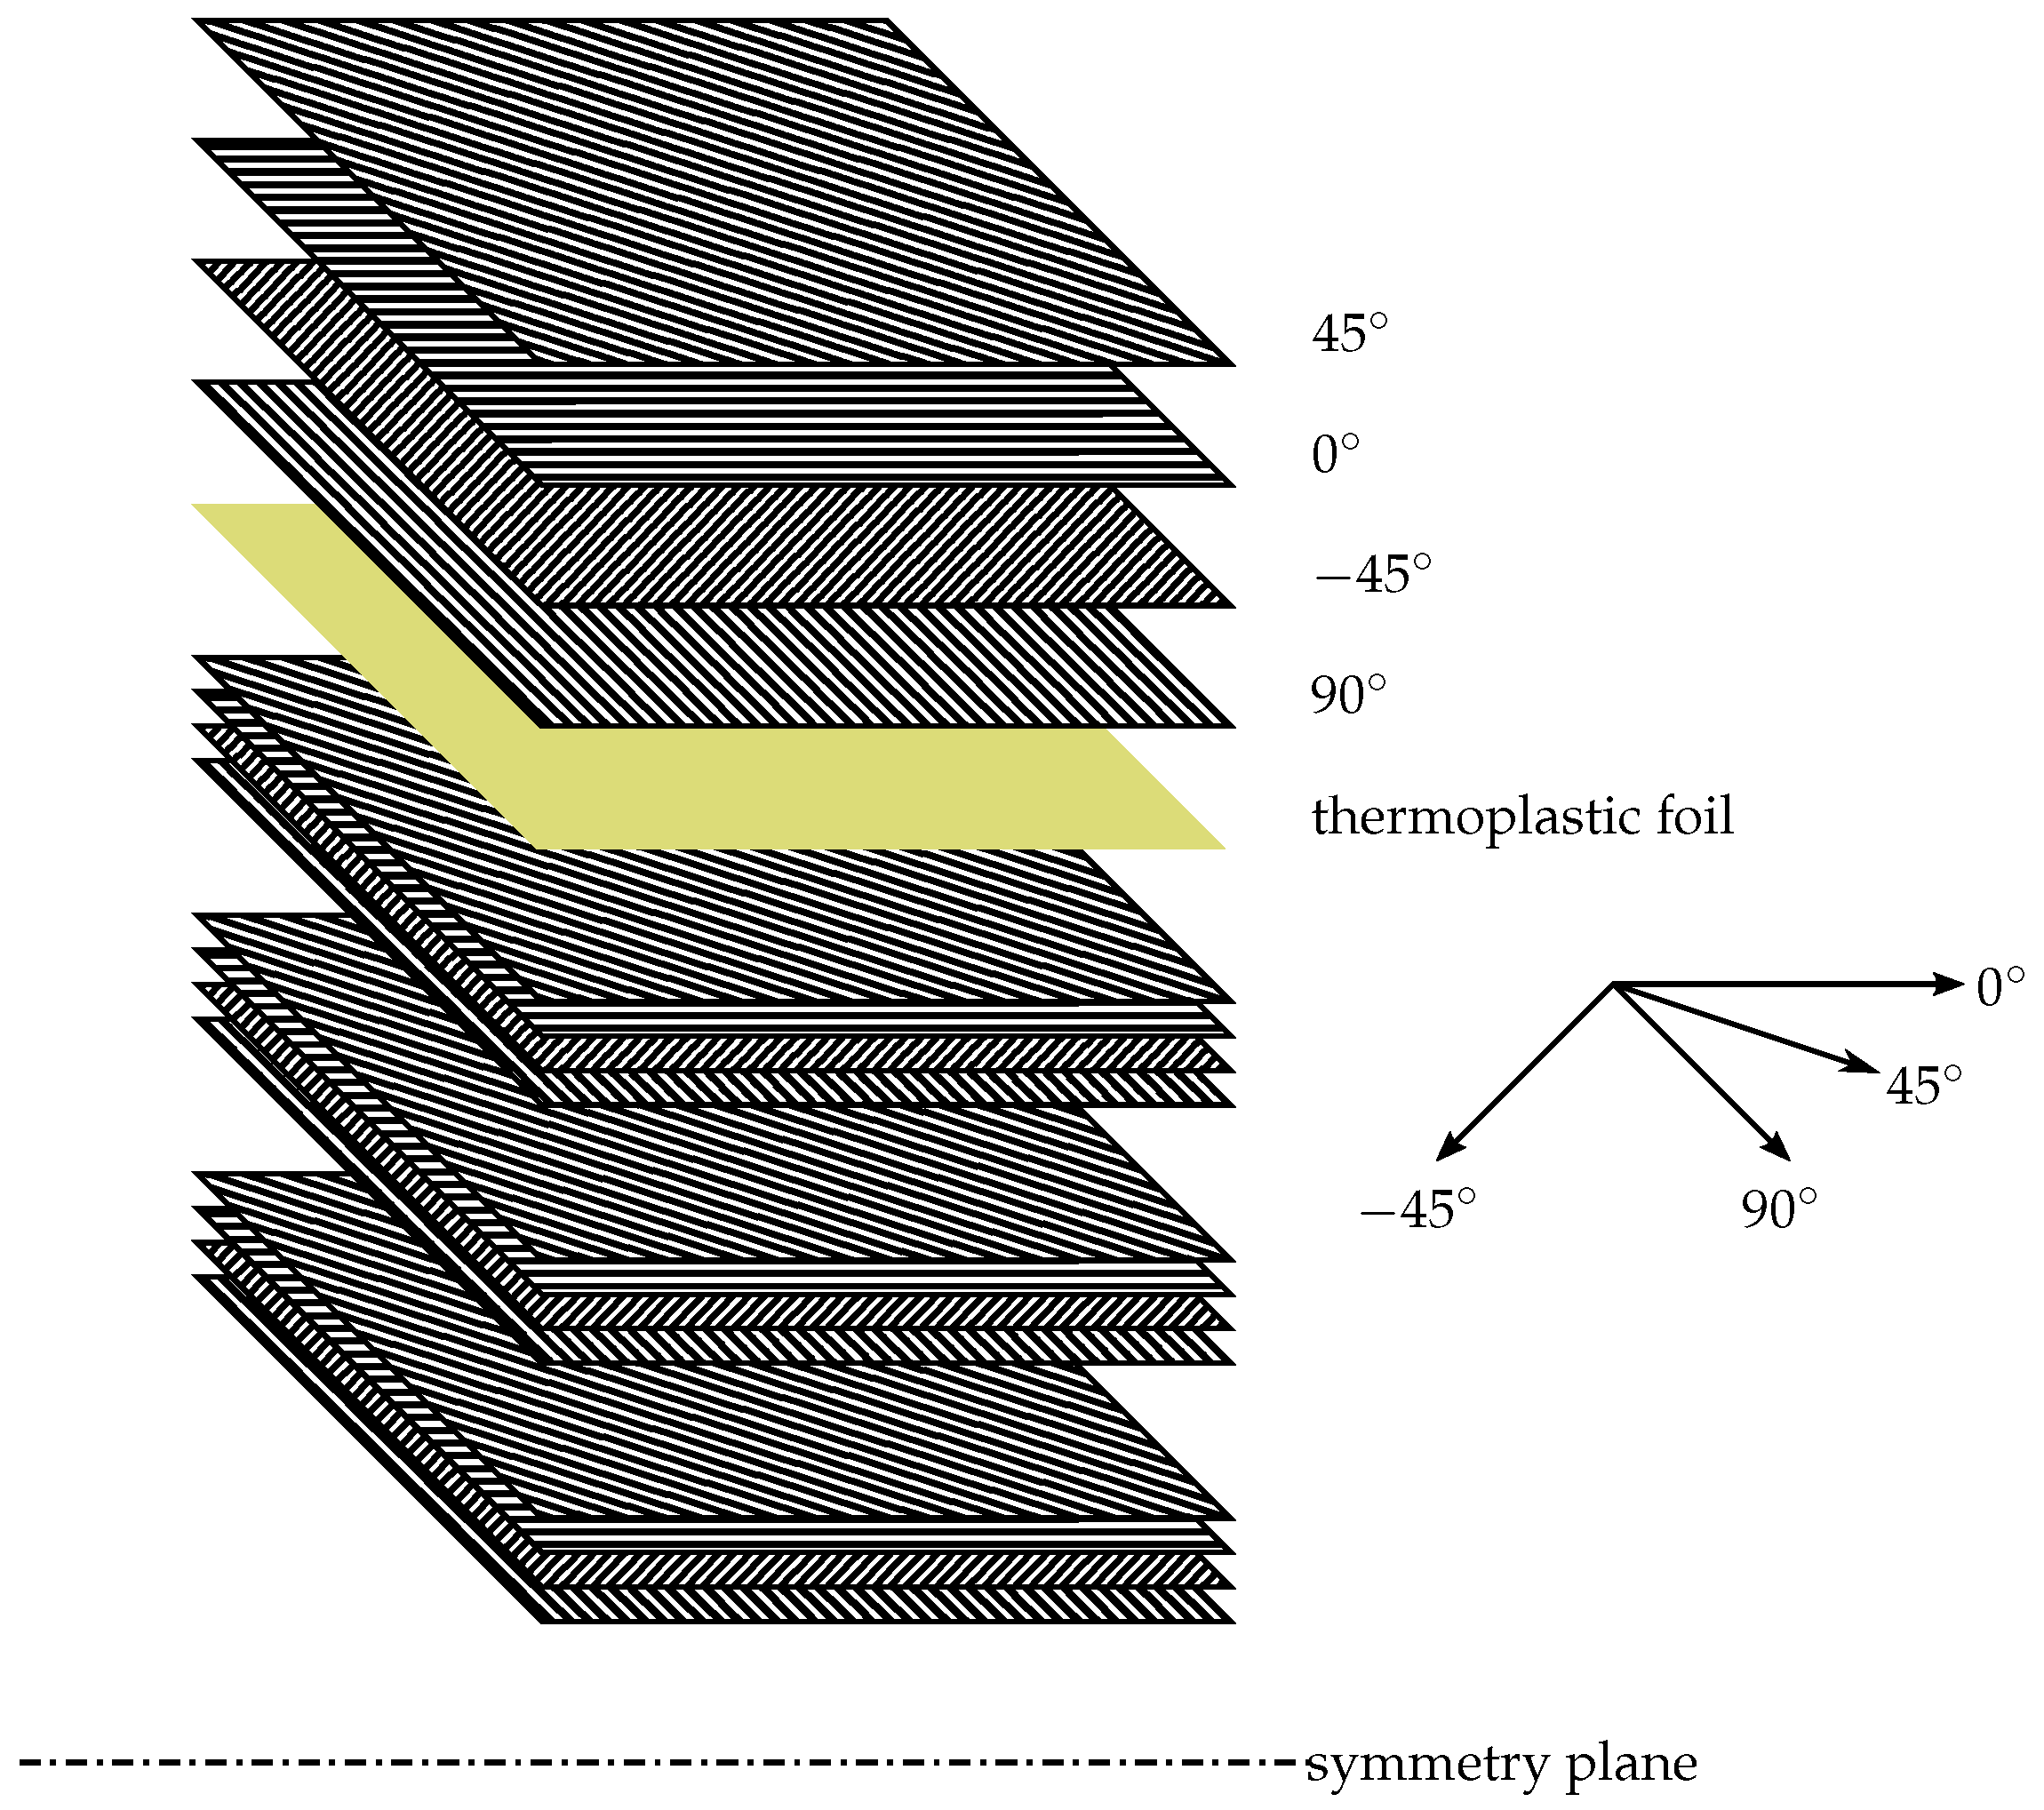
The CAI test specimens are sawn from a coupon made of 32 layers of prepreg. During production, 25 μm thick films of PEI, PES and PA6 are laminated over the entire surface between the fourth and fifth layer and between the 28th and 29th layer, so that the samples are symmetrical overall. To evaluate the influence, a reference sample without integrated films is also produced. The layer sequence is
sym, see
Figure 6. Calculated, this results in a coupon thickness of 4.16
for the reference sample or 4.21
for samples with integrated films. A thickness measurement shows that all coupons have a thickness of about 4.08
with a fluctuation range of 40 μm. From each of the four coupons, six specimens with an outer dimension of 102 mm × 152 mm are sawn out and then milled with a diamond cutter to the final dimension of 100 mm × 150 mm. According to DIN ISO 18352, close dimensional and parallelism tolerances between the edges must be fulfilled.
Three specimens for each configuration were subjected to an impact energy of 20 and the remaining three specimens for each configuration were subjected to an impact energy of 15 . The impacts were performed on an Amsler HIT600F drop tower from Zwick/Roell with a drop height and drop mass of 0.574 and 3.553 (20 ) and 0.604 and 2.533 (15 ) respectively. The resulting impact damage is first assessed optically and then measured with an ultrasonic examination. From the ultrasonic images the damage areas are determined. A Zwick 1484 universal testing machine with a load cell up to 250 is used for testing the residual compressive strength.
3. Results
The tests performed allow conclusions about the effects of the integrated thermoplastic films on the matrix tensile strength, adhesion strength under shear load, peel strength and damage tolerance of fiber composite laminates. The error bars in all diagrams shown throughout the following indicate the respective confidence interval for an assumed Gosset distribution.
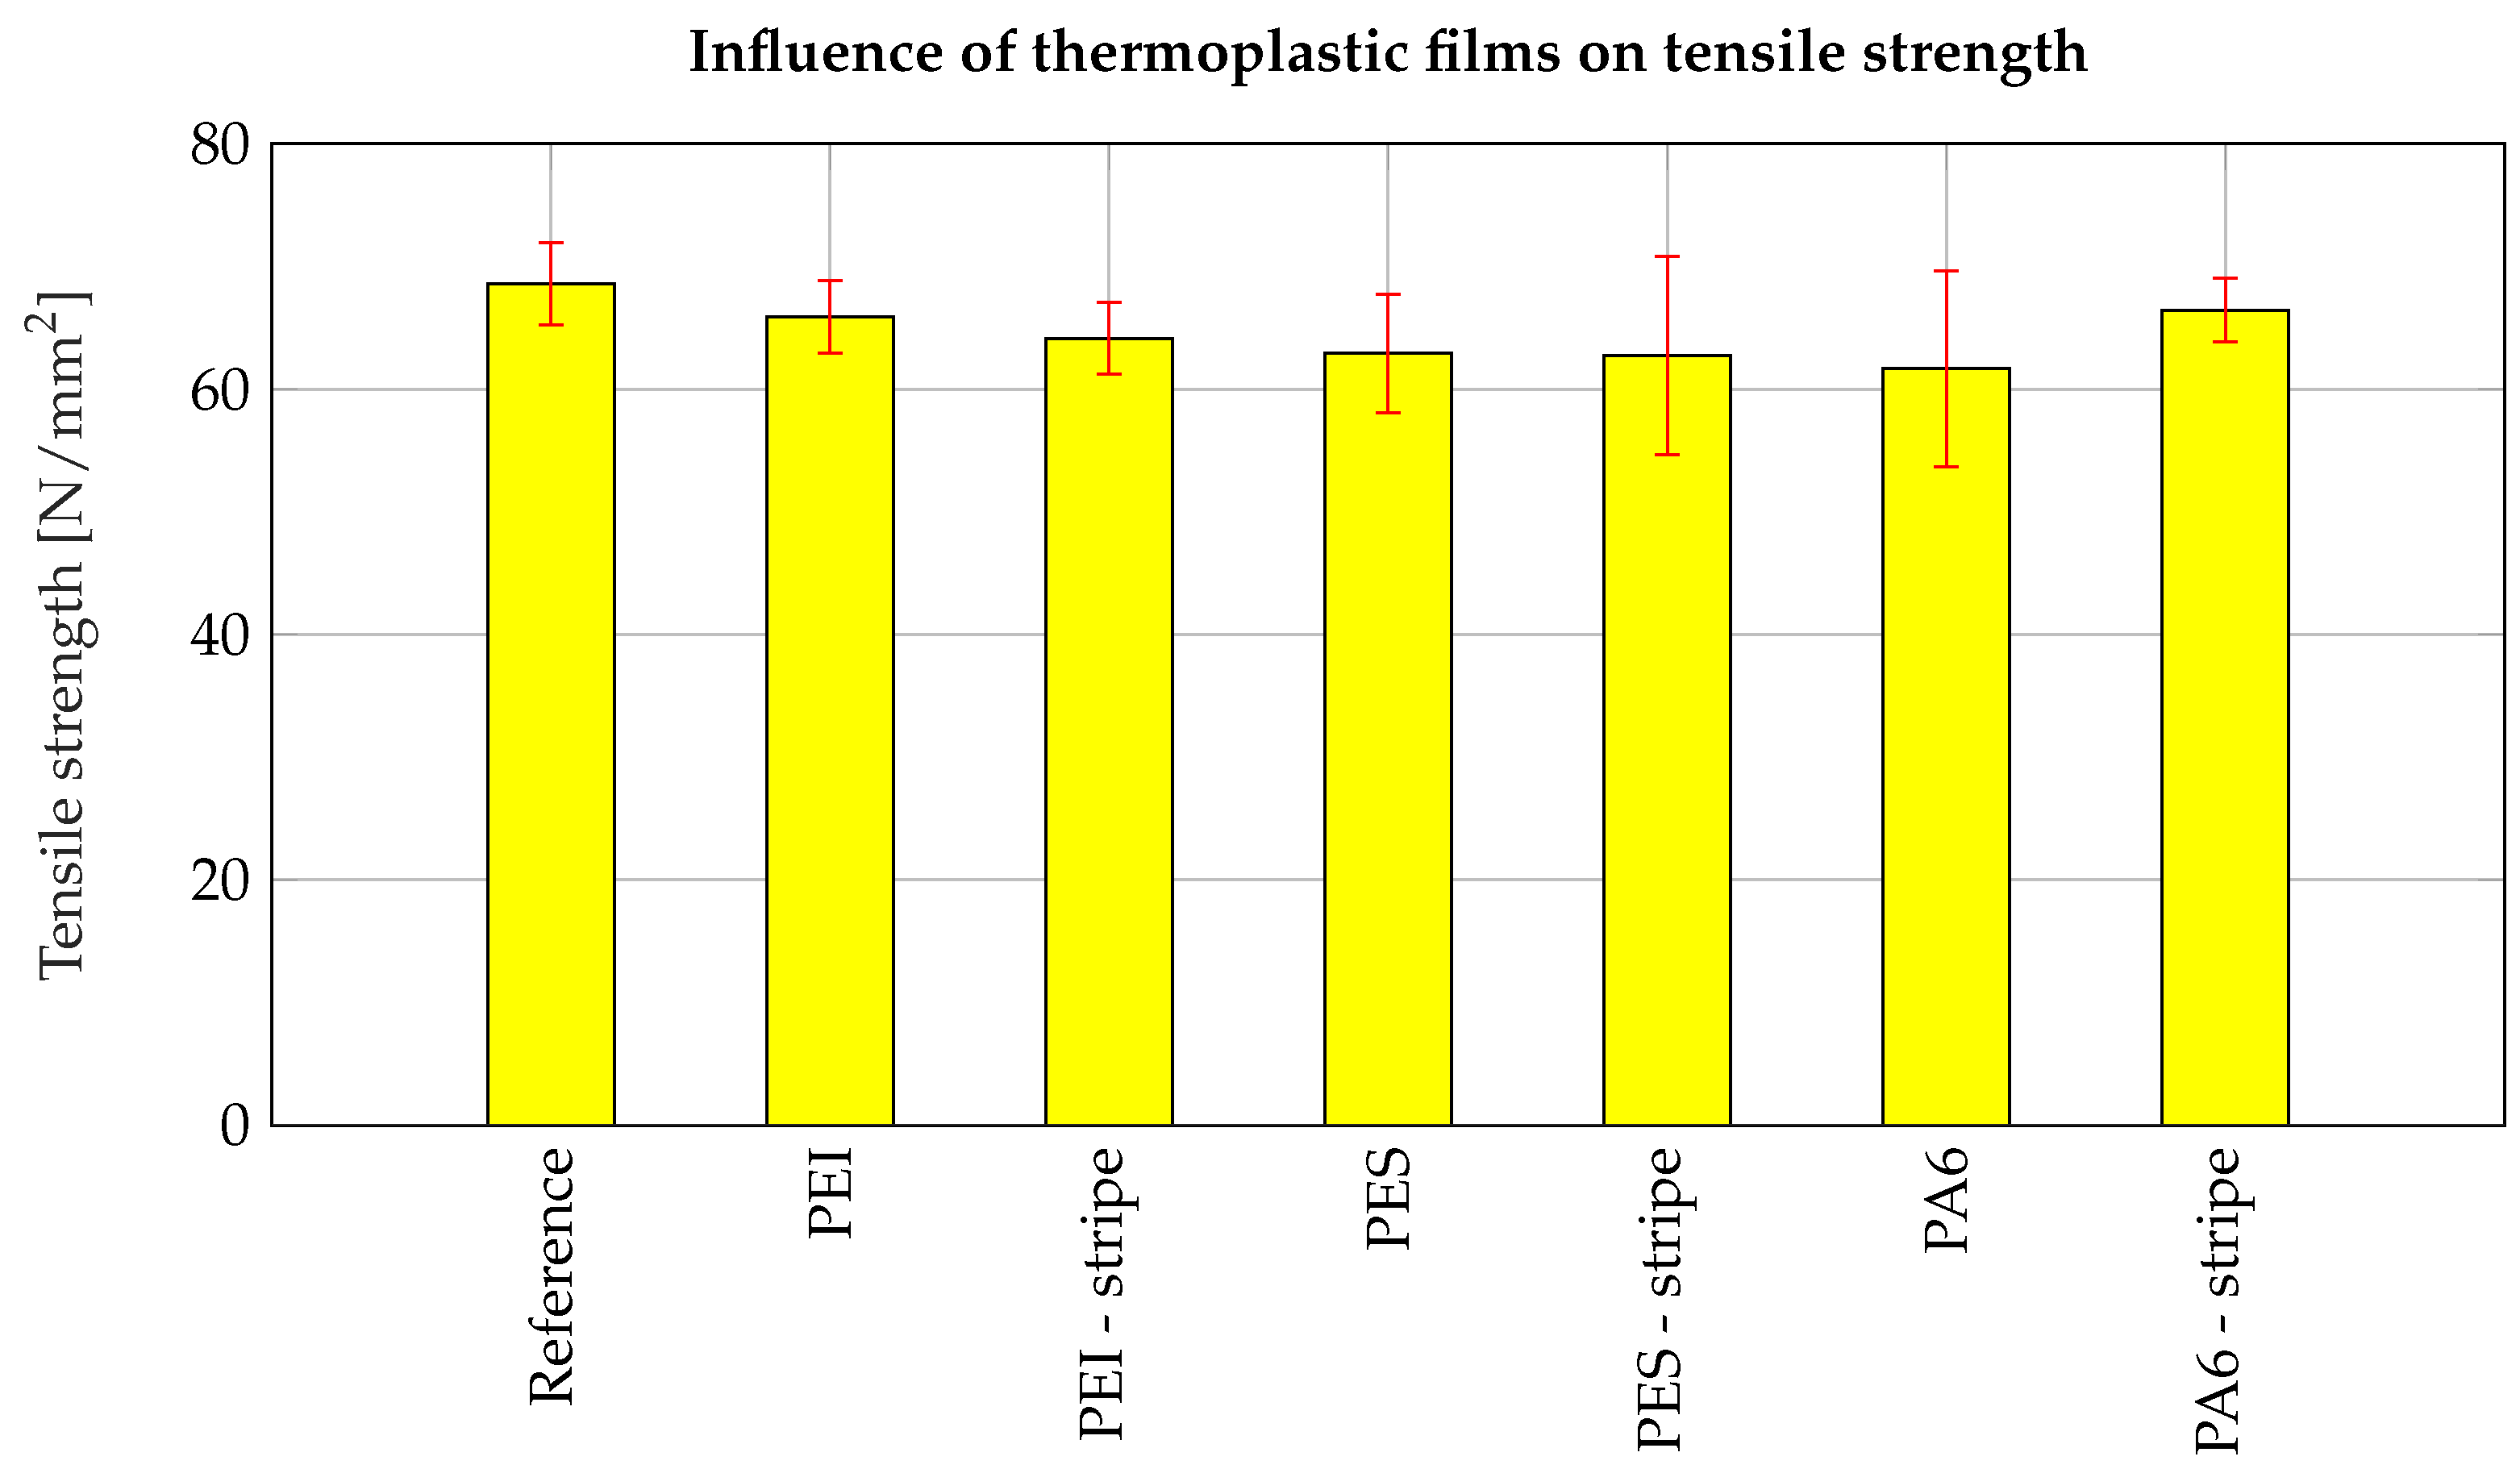
The tensile tests show no significant differences between the tensile strengths with and without the embedded thermoplastic films. Evenly integrated film strips and the associated edges have no significant influence on the matrix tensile strength. The nonsignificance can be observed in
Figure 7 on the basis of the overlapping of the confidence intervals. Taking into account an alpha error correction from the significance level 5% to 0.57% because of multiple comparisons, the nonsignificance of the differences can also be shown in a pairwise comparison with the reference sample in two sample t-tests.
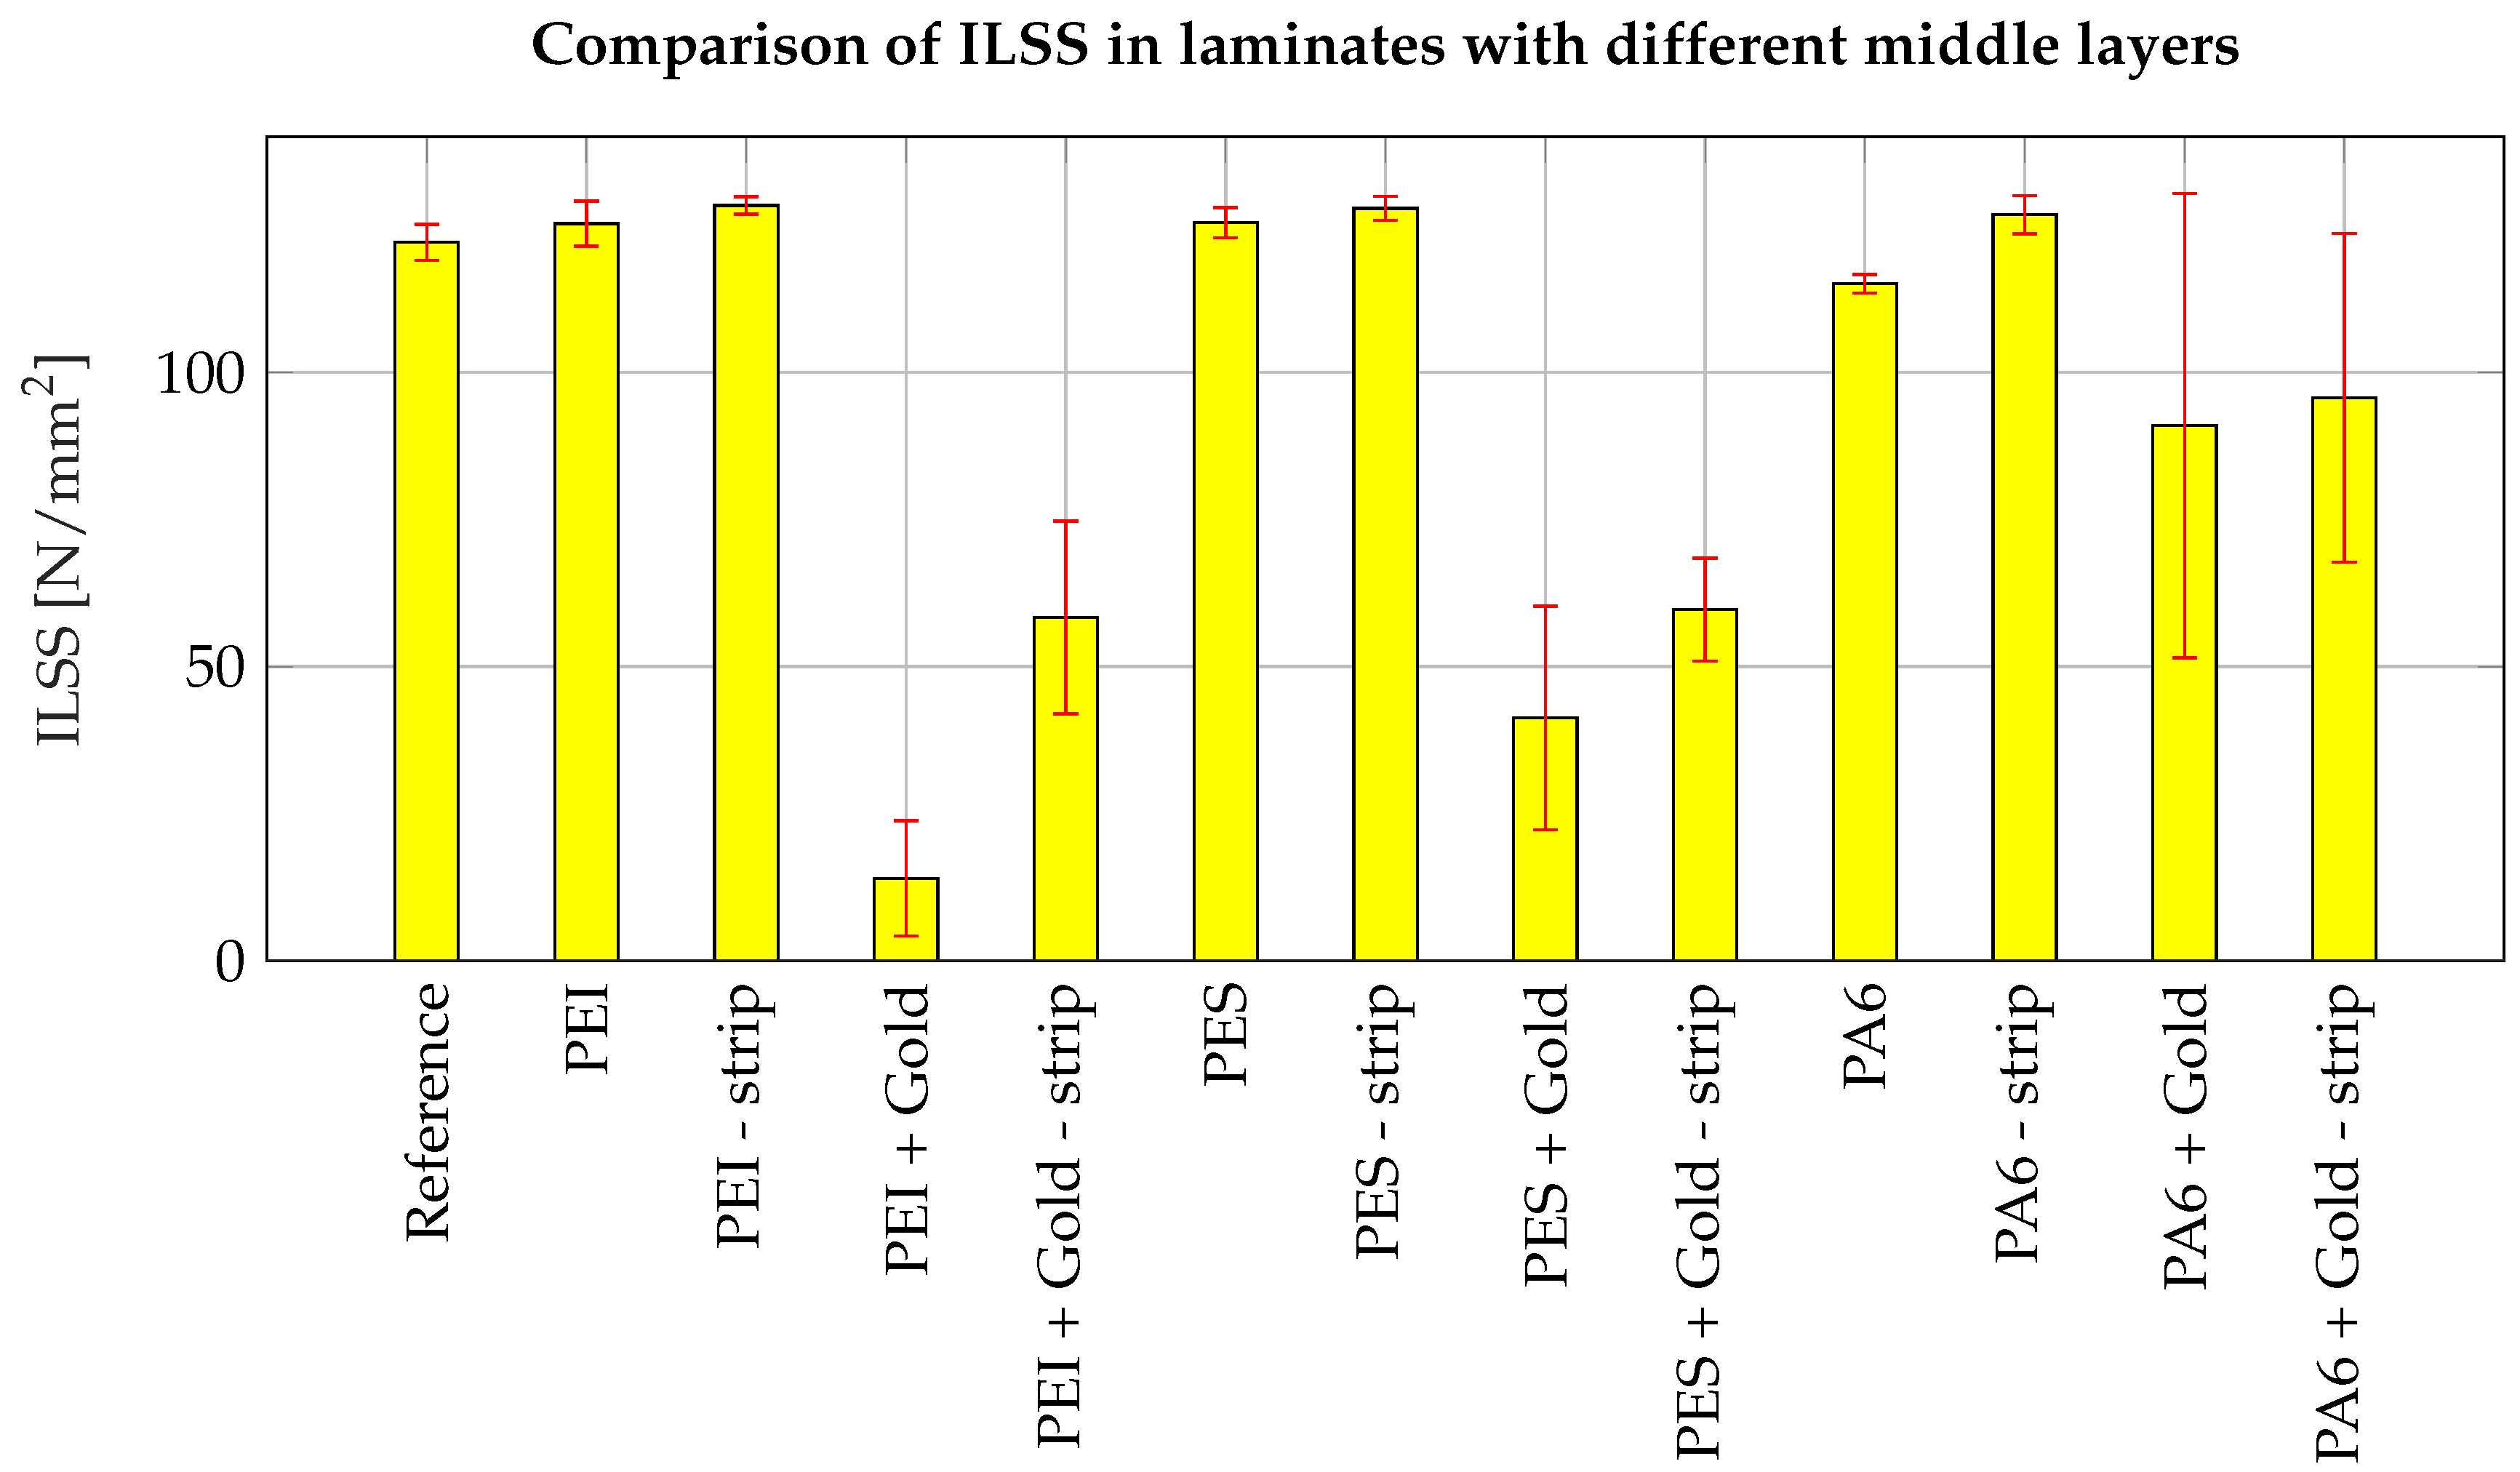
Figure 8 shows the influences of the pure thermoplastic film, the gold coating and integrated film stripes on the interlaminar shear strength (ILSS). When considering the influence of the film material, it is shown that PEI and PES do not result in a significant reduction of ILSS. In tendency the PEI and PES films seem to slightly improve the ILSS, but a statistical significance cannot be proven. For films made of PA6, a small but significant reduction of the interlaminar shear strength is observed.
The samples with full-surface film with gold coating show a considerable reduction and strong scattering in the measured ILSS. To calculate the ILSS, the force value at the first failure, i.e., before the first drop in the traverse path-force characteristic curve, is used in accordance with DIN EN 2563. For films without gold coating, no significant influence of the sensor edges can be observed. In the case of gold-coated film strips, there is an improvement in ILSS compared to the full-surface film, which is significant at least for PEI films.
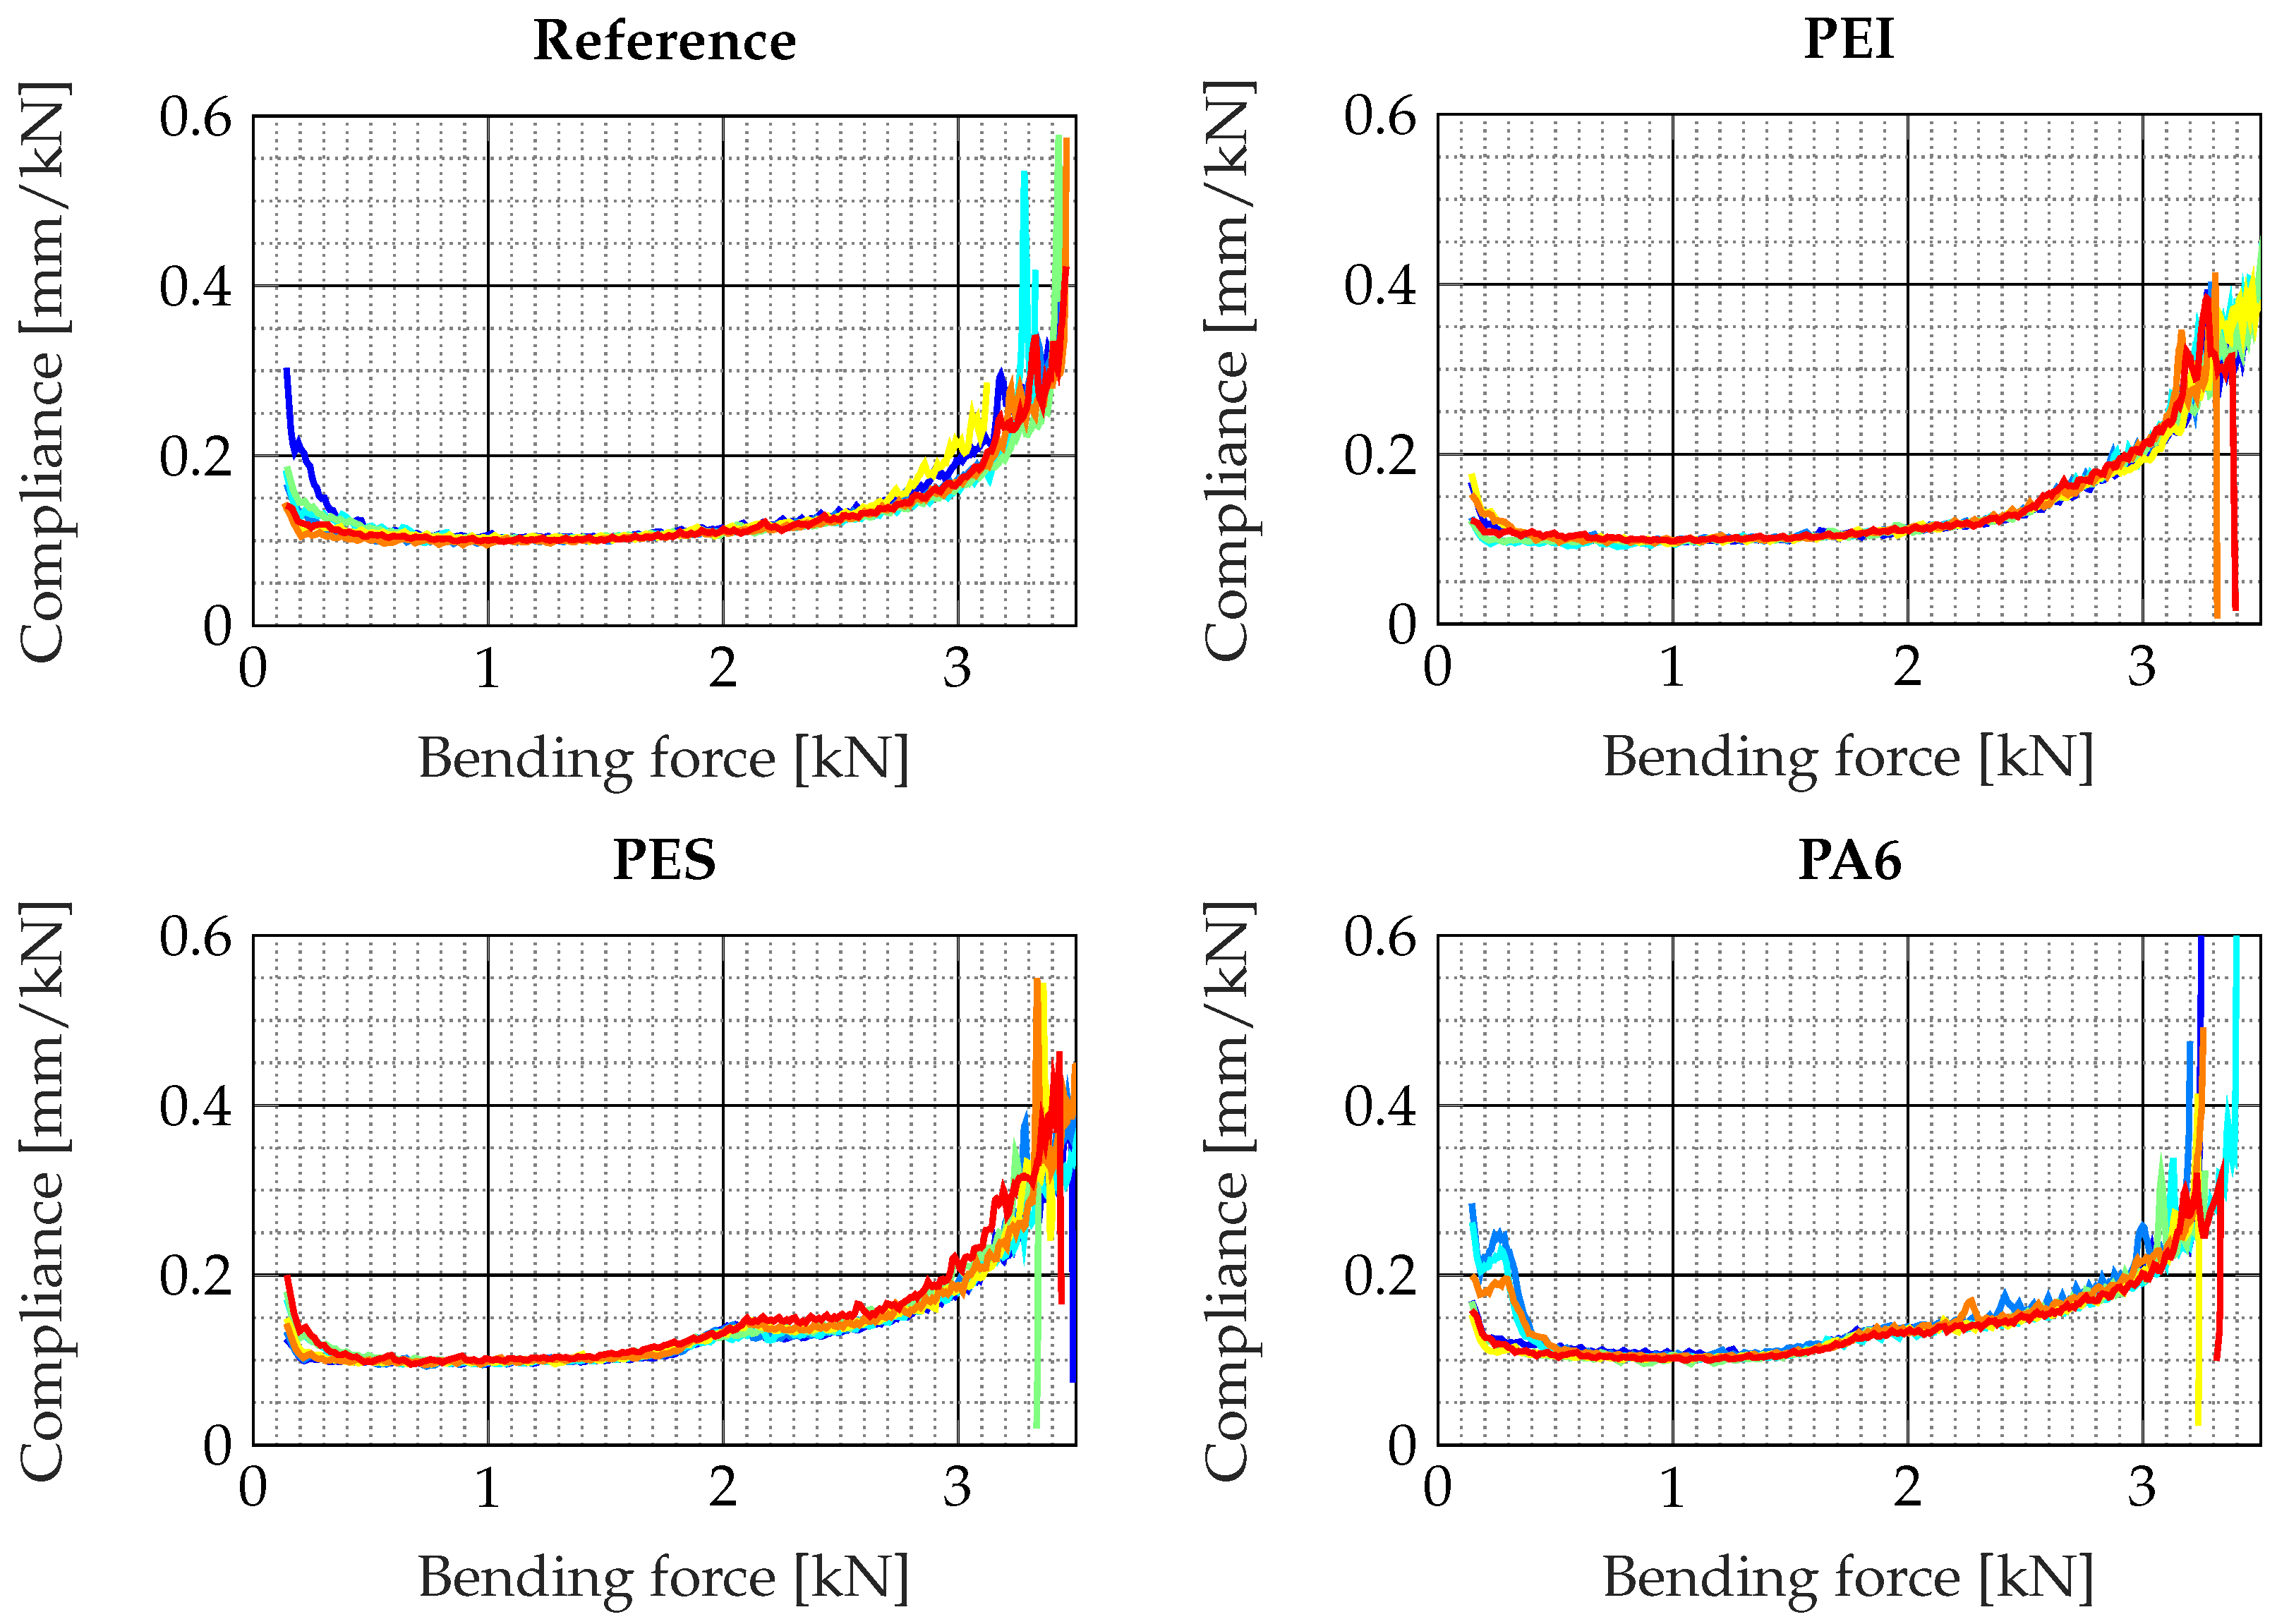
Further insights can be gained from the ILS data by calculating the differential compliance curves from the force-traverse movement curves. To obtain smooth curves, the
x and
F curves are each smoothed over 5 measurements and the course of
is also smoothed. This results in a compromise between low falsification of the measured data and smooth curves. In laminates with integrated PA6 films, a sigmoidal increase in differential compliance at low forces from 1.5
can be observed, in the case of PES from 1.7
, see
Figure 9. Laminates with PEI film do not show such a sigmoidal increase but achieve a slightly higher differential compliance at a force of 3
compared to the reference laminates.
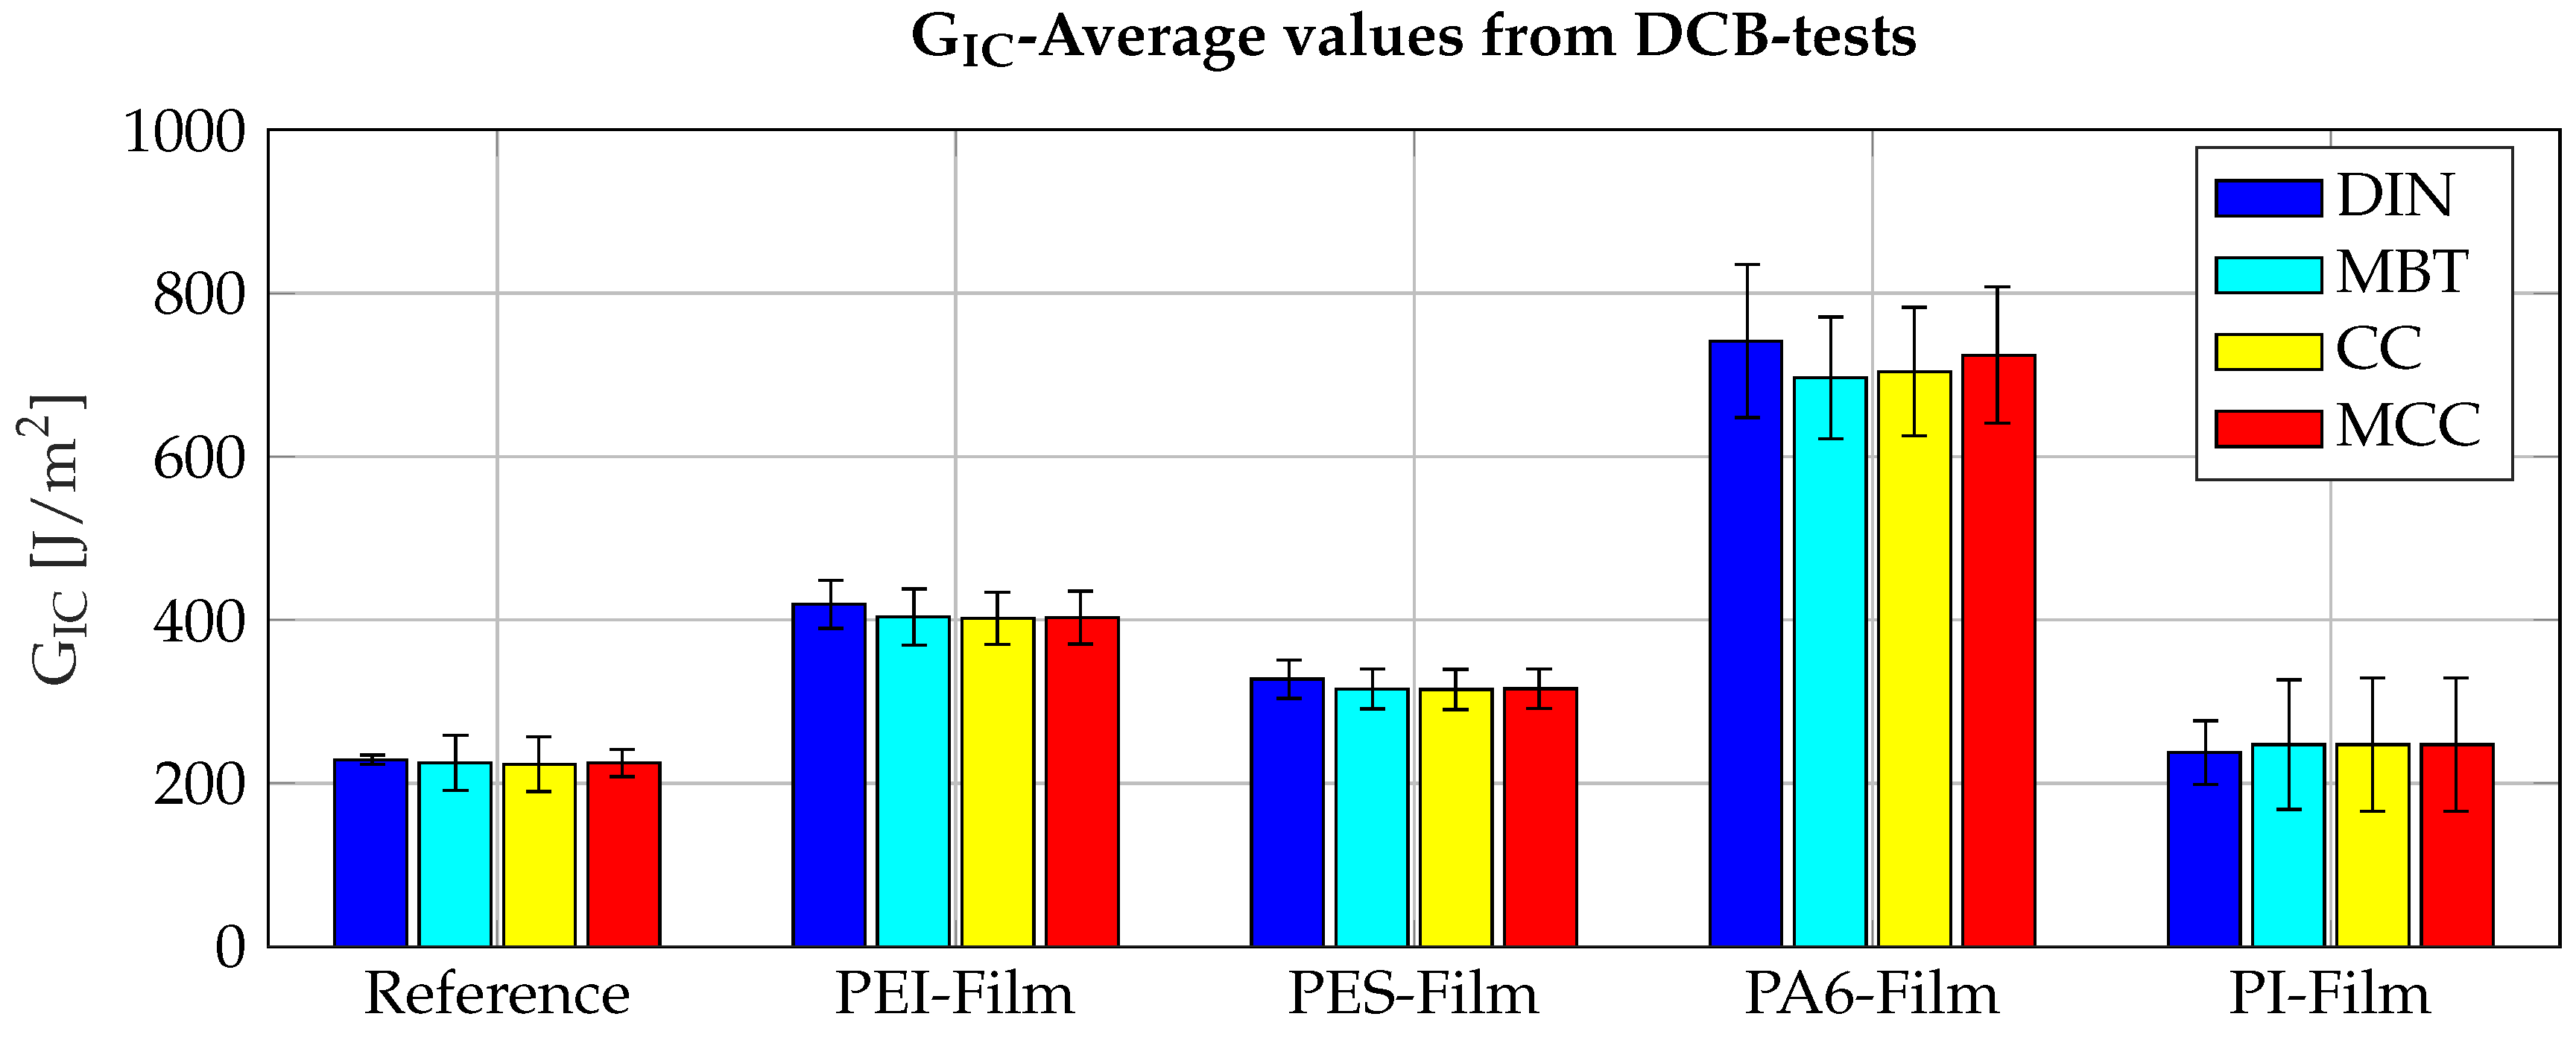
The critical energy release rate for mode I crack propagation is obtained from DCB tests. The results show a significant improvement in the energy release rate for specimens with PEI, PES and PA6 film compared to the reference specimens, whereas the specimens with PI film show no significant improvement in the energy release rate compared to the reference specimens, see
Figure 10.
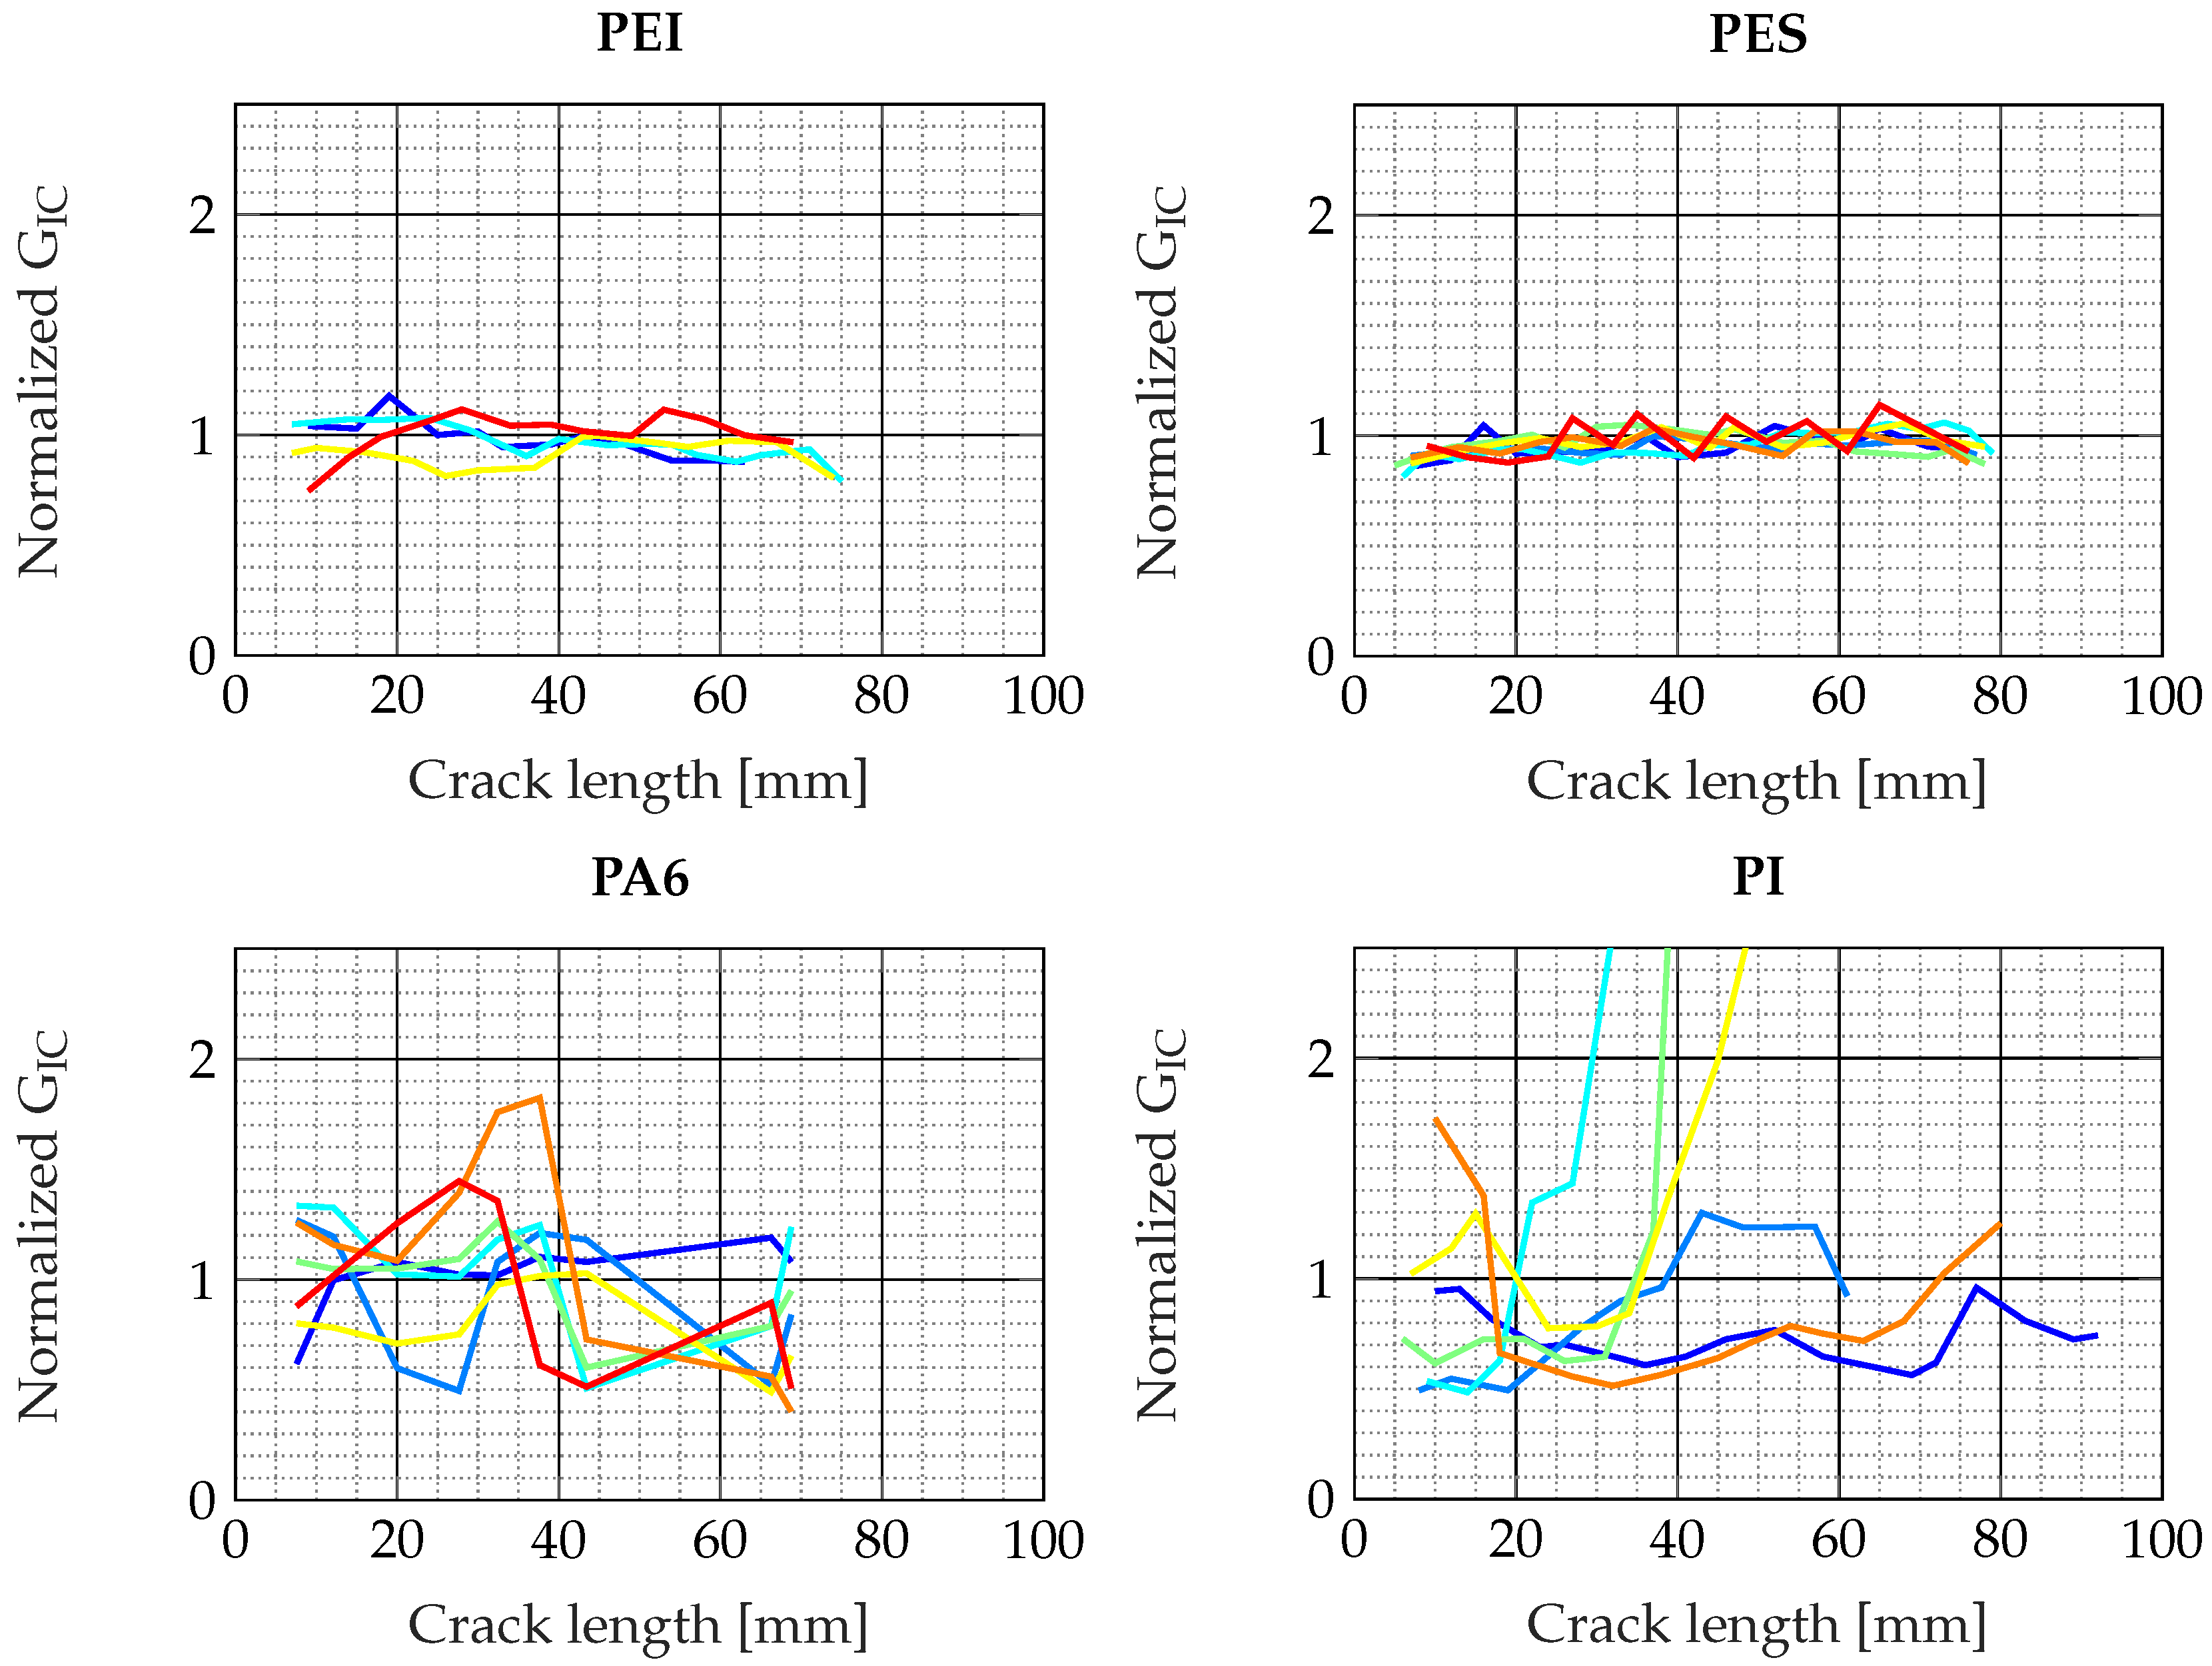
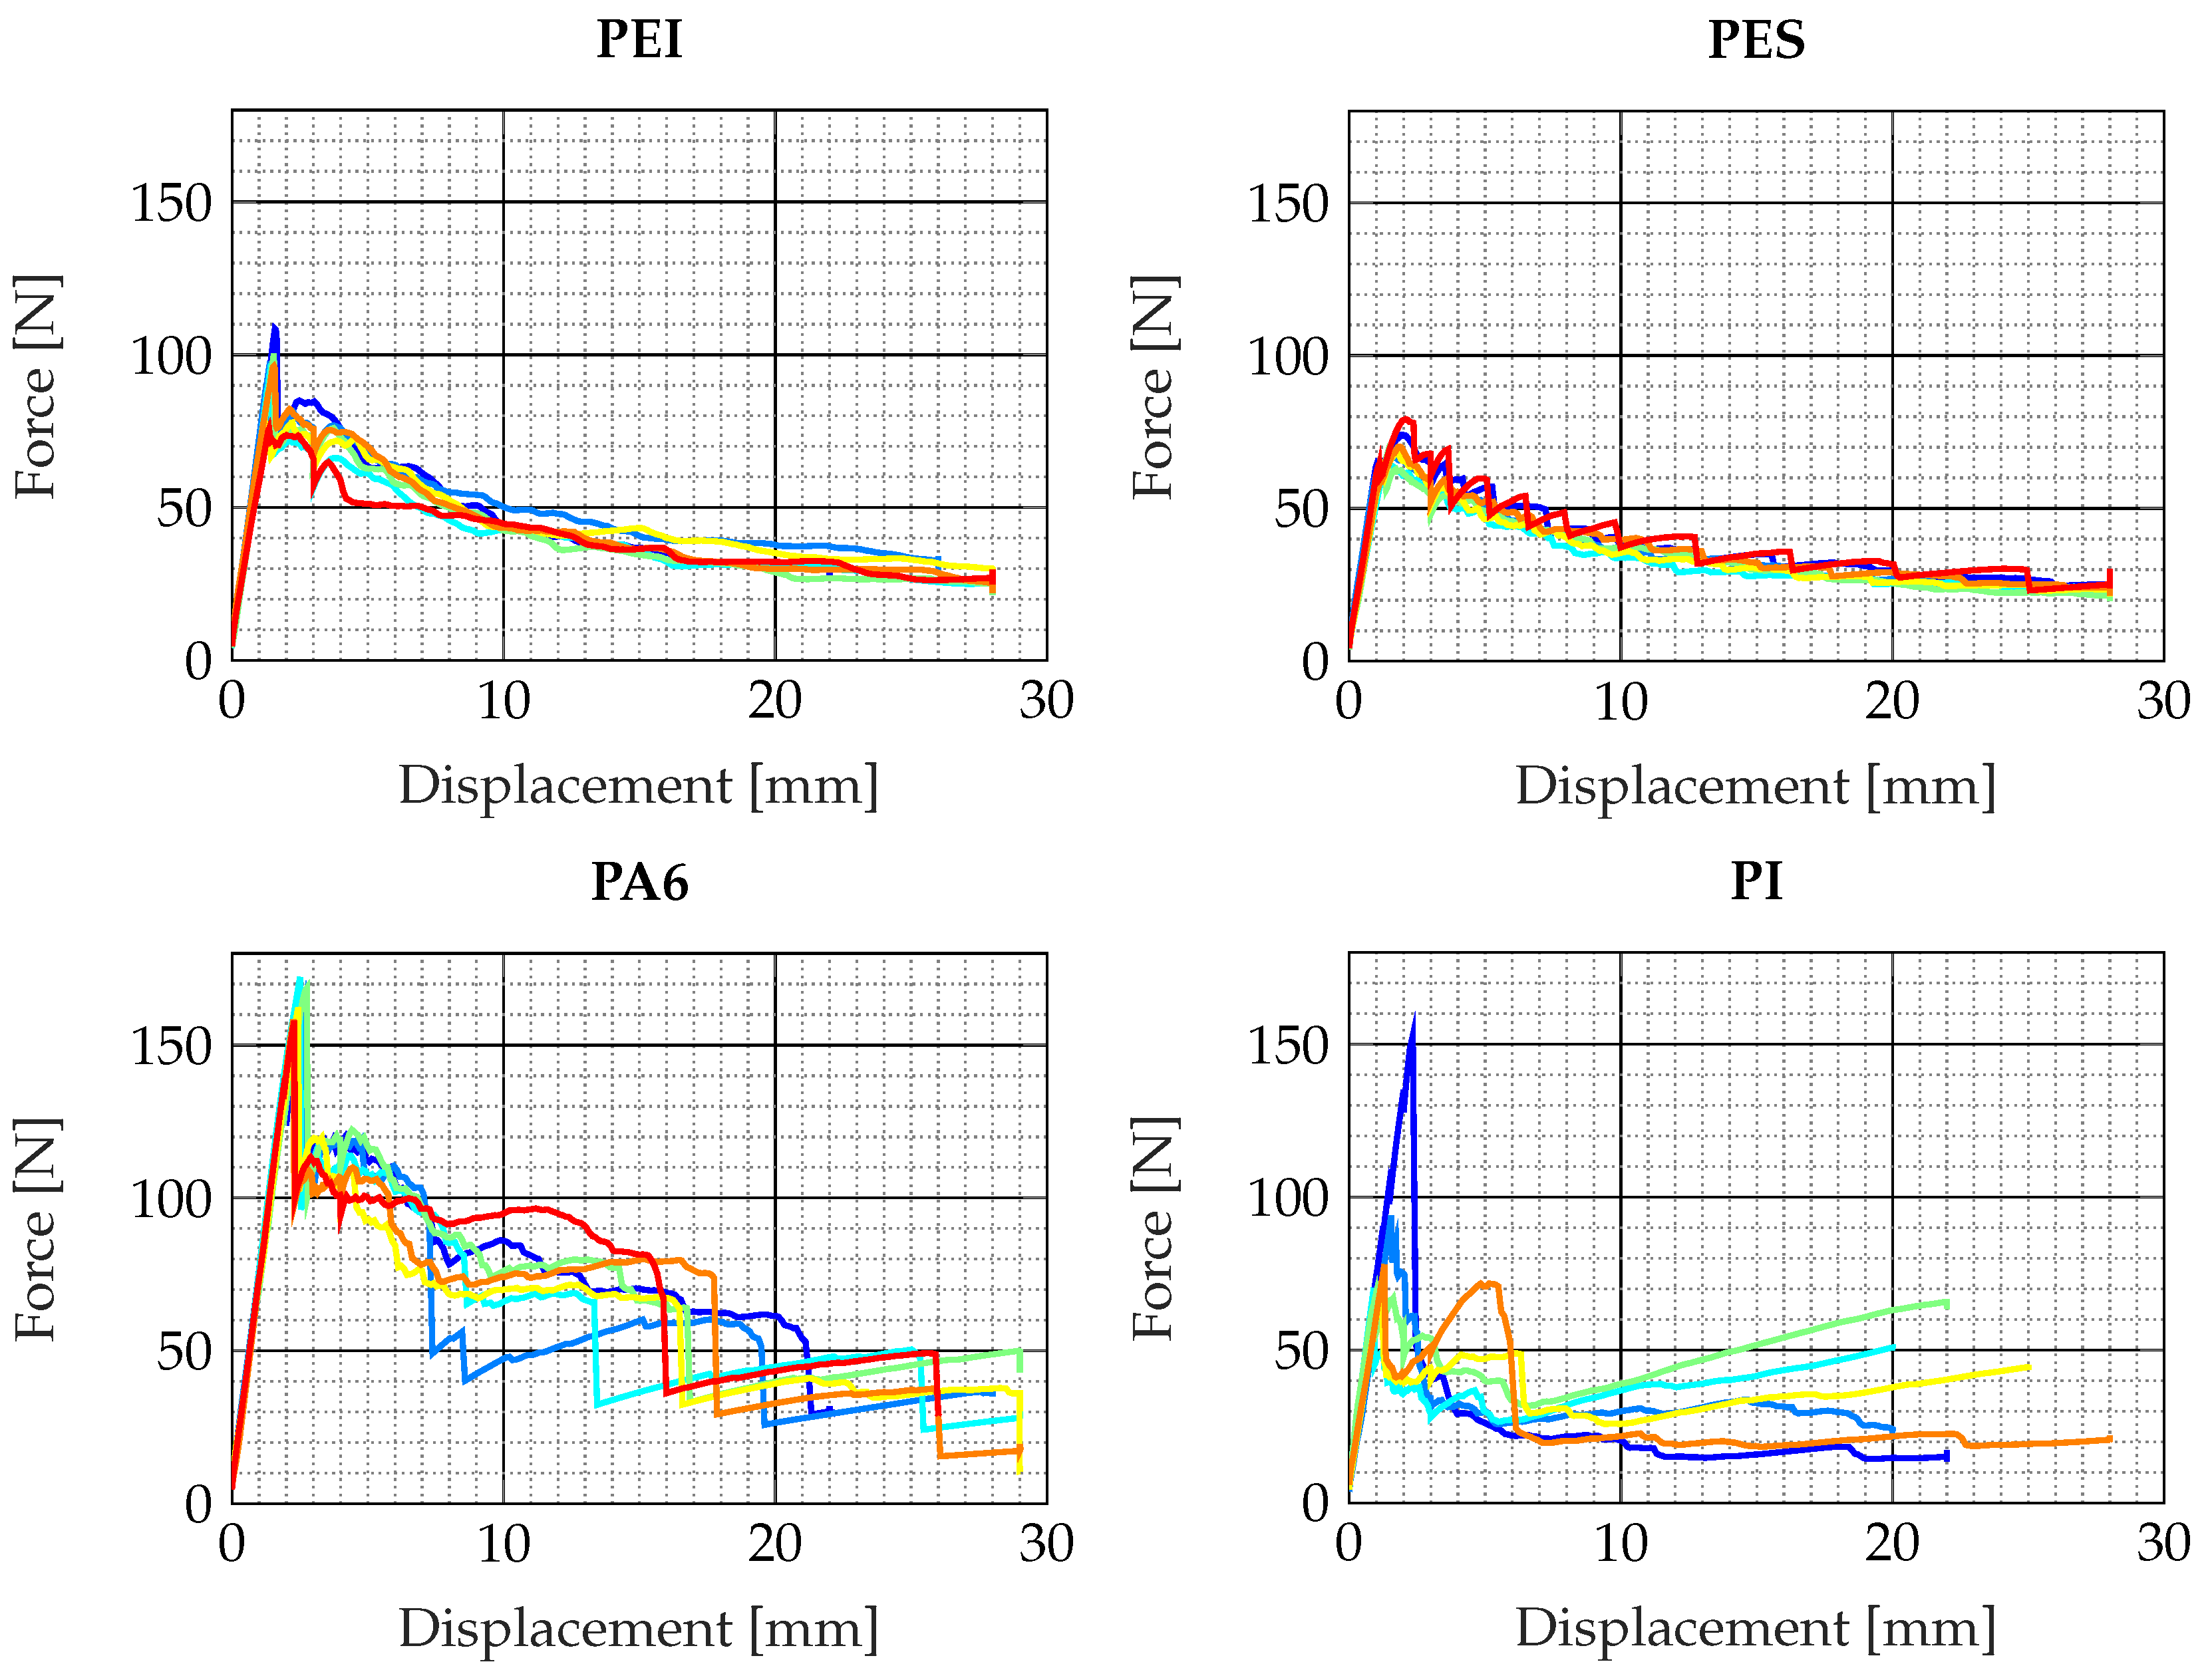
Video recordings of the crack propagation during the testing of the specimens show different scenarios of crack propagation. For example, the crack propagation in the reference specimens and the specimens with PEI film was quasi-stable and continuous, whereby in the PES specimens, the crack propagation had a stick-slip form. The crack growth in the PA6 specimens propagates via crack jumping. In the case of the specimens with PI film, the crack propagation had a different shape. It was found that the force increased for some specimens after the first drop in force (after the crack has been created). The optical investigations show zones in the fracture surface of PI specimens where very high adhesion occurs. This can be seen by a steep increase of the normalized
in the R-curves. For example, the green curve for the PI specimens in
Figure 11 indicates that the crack stops at a crack length of about 40
. In the force traverse path curve in
Figure 12, a stop in crack propagation can be recognized by the transition from a decreasing force curve to an increasing force curve. This progression is not only apparent for PI but also for the samples with integrated PA6 film, which show a pronounced crack jumping. The normalization in
Figure 11 is done by dividing the
values calculated according to MBT by the
values calculated according to DIN EN 6033, which are not a function of crack length a. The division gives unitless values that are a function of the crack length a.
In CAI tests on laminates with integrated PEI, PES and PA6 films, no significant influence of the integrated film compared to the reference can be demonstrated, neither when considering the damaged area nor when considering the residual compressive strength, see
Figure 13. Especially the damaged area does not seem to be strongly influenced by the impact energy or by the inserted films. On the basis of the available data, however, it seems unlikely that the films have led to a degradation of the CAI characteristics. An analysis of the data with ANOVA shows that no significant influence of the films can be proven, but the influence of the impact energy is as expected: higher impact energies lead to larger damage areas and lower residual compressive strengths. The PES sample series impacted at 20
is noticeable by a high scatter of residual compressive strengths. In contrast, the samples with integrated PEI films show the narrowest confidence interval.
4. Discussion
No influence of the integrated films on the matrix tensile strength can be deduced from the tensile test data obtained, see
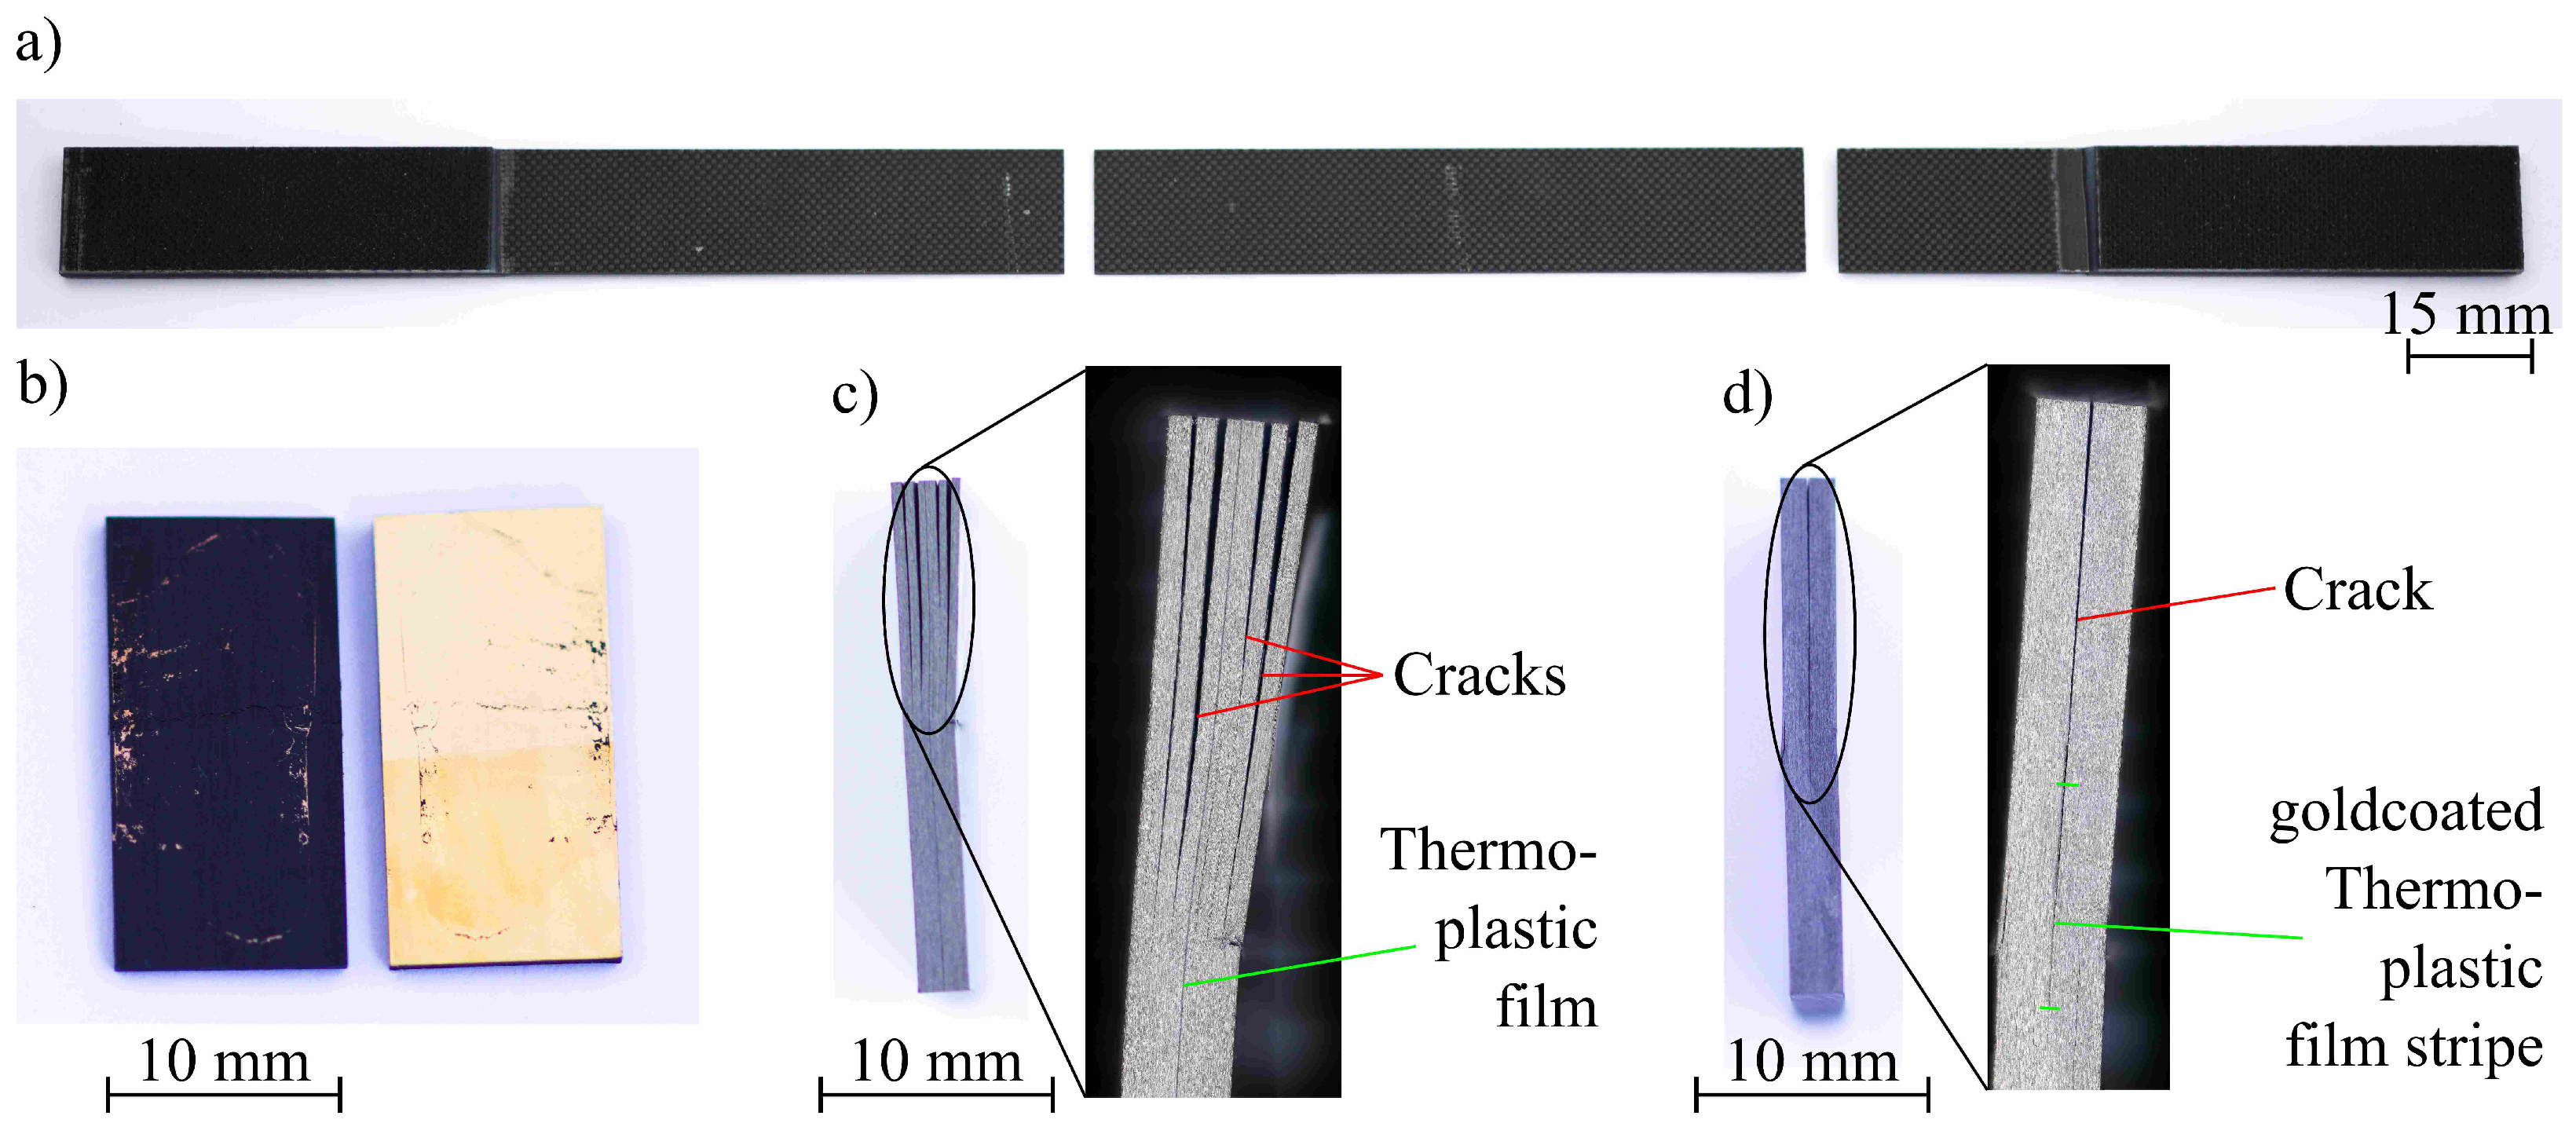
Figure 7. The tensile specimens are found to break almost ideally elastically without warning and to fragment into several small pieces, whereby no fibers are torn but only the matrix between the fibers, see
Figure 14a. This can be attributed to the fiber orientation of 90° with respect to the loading direction. It is believed that due to the peel ply, the surface roughness acts like an array of small notches, which lead to excessive stress in the surface. In combination with the extreme brittleness of the epoxy resin, it is plausible that both effects together lead to scattering of the breaking forces and thus of the strength values calculated from them. The tensile tests show that the film material used has no significant influence on the matrix tensile strength, even if it is partially soluble in the epoxy resin, and that even possible local stiffness jumps at sensor edges do not play a role in the tensile test. Since the stiffness jumps are small due to the low thickness of the films of 25 μm, the small influence of the sensor edges is not surprising.
ILS tests show that both PES and PEI do not compromise interlaminar shear strength, but PA6 causes a slight reduction in interlaminar shear strength. The adhesion of the gold layer to the epoxy resin is weaker than that to the thermoplastic substrate because a chromium adhesion layer is used as an additional bonding layer between the gold layer and the thermoplastic. While for the samples with gold coating a complete separation of the specimens in the middle plane can be observed, the samples without gold coating show a pronounced crack near the middle plane but continue to hold together in the area outside the force introduction, see
Figure 14b,c.
Figure 14b shows that the gold stayed almost completely on the thermoplastic film. This also indicates a very weak bond between the gold layer and the epoxy resin.
Figure 14c shows that in the specimens with fully integrated PEI film, the cracks avoided the interface between the thermoplastic and the epoxy matrix and spread through the surrounding epoxy matrix. The same behavior was observed with PES and PA6 films. This indicates that the ILSS obtained from the experiments only defines the lower limit for the true shear strength between thermoplastic and epoxy resin.
Figure 14d shows a crack that propagated between the stripe of the gold-coated PES film and the epoxy matrix, leading to delamination in the mid-plane. Since the crack propagated from the center into only one direction, the specimens continued to hold together. A mixed behavior was observed in the specimens with film stripes without gold coating. In some specimens the crack avoided the thermoplastic film as shown in
Figure 14c, but in other specimens the crack spread from the end of the thermoplastic film stripe similar to
Figure 14d. However, as no degradation of ILSS is observed, it seems unlikely that the edges of thermoplastic films will affect the shear strength.
The strong scattering of the ILSS in specimens with gold-coated film could be explained by the fact that stress concentration occurs during the experiment at statistically distributed microscopic bonding defects in the contact plane, which can hardly be compensated by plastic yielding. Since the weak interphase between gold and epoxy is not able to dissipate as high amounts of energy as the thermoplastic/epoxy interphase, it fails completely starting from stress concentrations. The proposed explanation also shows reasons why the measured ILSS of the gold coating is significantly higher for ductile PA6 films than for comparatively brittle PEI films, see
Figure 7. In the ductile PA6 film, stress concentrations are better reduced by plastic yielding than in PEI film, so the test specimens failed at higher external loads resulting in higher strengths. However, the results show that the interfaces between gold and epoxy are an issue for adhesion and form a weak point. These weak interfaces have to be compensated by the surrounding thermoplastic in an integrated sensor by plastic yielding and strong adhesion between thermoplastic and epoxy.
From the investigations on the thermoplastic film stripes without gold coating, it can be concluded that no impairment of the ILSS is to be expected from the edges of the sensors either. The investigations on gold-coated film stripes show that the surrounding compound even has a stabilizing effect on the sensors. The integration of the films leads to a reduction of the mechanical stiffness above a certain force level, see
Figure 9. This sigmoidal increase in compliance indicates a plastic flow of PES and PA6 that occurs well before the actual failure. In contrast, the strong scattering of the compliance curves in the lower force range is mainly due to the penetration of the test die into the irregular surface of the specimens. The investigations on full-area gold coating and pure film only cover unrealistic limiting cases of integrated sensor technology. To examine the influences of gold patterns that are typical for sensors, further investigations will be carried out. In these investigations the influence of PI on ILSS will also be compared with the results from this work.
For the DCB tests there are several hypotheses that can give an explanation to the results. The PA6-Film possesses the largest elongation at break among the considered thermoplastics. It is noteworthy that this mechanical property describes the ability of the material to dissipate mechanical energy into plastic deformation.
Another explanation is based on the polarity theory, which suggests that the polarity plays an important role in the quality of an adhesive because of the force between the dipoles of the atoms/molecules [
18]. According to Deng et al. [
16] covalent bonds, hydrogen bonds via the amide group and entanglements of the molecular chain contribute to strong adhesion between PA6 and epoxy. PA6 can form hydrogen bonds via the amide group and with the hydrogen atoms of the carbon chain. The combination of good adhesion as is shown in the ILS tests with high ductility yields the very high cricital energy release rate for PA6. Another mechanism that promotes high energy release rates is the uneven surface caused by curling of the PA6 film seen in
Figure 15a. Due to the larger surface area between PA6 and epoxy, the crack has to expose a larger area, which leads to higher crack energy consumption. The reason for crack jumping in PA6 specimens can be attributed to the fact that PA6 consists of amorphous and crystalline zones. The interface between these two areas is considered as a weak point in the structure, where cracks can easily spread.
Crack propagation in the form of stick-slip in specimens with PES film can be attributed to the phenomenon of fiber bridging. During the optical examination of the video recording, it was found that the fibers intertwine and form interface bridges, resulting in the curves seen in
Figure 10 and
Figure 12.
Figure 15b shows that the crack propagation in a stick-slip pattern has also left traces on the fracture surfaces. In the figure, alternating dark and light areas can be observed on both sides of the foil in the crack propagation direction. It is worth noting that the alternating pattern ends with the crack propagation in the experiment (red line in
Figure 15b). During manual peeling after the experiment, no such structures are observed in the surface.
PES and PEI which are able to dissolve in epoxy show a significant improvement of the
-value but compared to the PA6 film the improvement due to the PES and PEI films is far smaller. This can be attributed to the smaller plastic strain of PES and PEI. The better adhesion proved by the ILS tests is not decisive for the influence on the energy release rate. In
Figure 15c, residues (bright structures) of the film can be observed on both sides of the crack shore. Thus, the crack must have crossed the foil several times.
PI shows weak adhesion in some zones of the specimens and strong adhesion in other zones. The reasons for the strong variation are not completely understood. The observation of the fracture surfaces in
Figure 15d shows that three different zones can be distinguished. In the first zone directly behind the crack (right of the green line), the crack spreads between the PI film and the matrix. In the second zone, which starts about one centimetre before the end of the crack propagation in the experiment (1
left of the red line), the PI film still detaches itself from the matrix on one side but shows fine line-shaped structures, which make the area on the photo appear lighter. It is assumed that these line-shaped structures indicate a plastic deformation in the film. In the third zone to the right of the red line in
Figure 15d, film residues can be seen on both sides of the specimen, which suggests that the crack has spread through the PI film during manual peeling after the experiments. In this zone, similar alternating structures as observed in the samples with PES film in
Figure 15b are also visible in places. In the R-curves in
Figure 11, the difference between the zones can be seen from the fact that the crack propagation resistance increases greatly at the transition from the first zone to the second zone and the crack even stops completely at the transition to zone 3. What causes crack propagation into the thermoplastic film is an open question. In further investigations, thinner PI films from a spin coating process will be investigated. Spin-coating allows the production of thinner layers, which are more similar to those in integrated sensors. Whether crack propagation into the laminate can be observed for such thin films is an open question for follow-up investigations. However, the large scattering in the
value and the weak adhesion in the PI-epoxy interface indicate that integrating PI into carbon fiber reinforced polymers causes an increased crack propagation risk.
The examination of the CAI specimens shows that a deterioration of the damage tolerance due to the integrated films is improbable. However, for a statistically significant result, more than six specimens per film material would have to be examined. As the adhesion of the thermoplastic films to the epoxy resin is good, as already shown by the ILS and DCB tests, a negative effect of the pure films seems to be unlikely. For possible positive effects of the inserted thermoplastics, the volume fraction of the thermoplastic component is decisive. Since as little thermoplastic material as possible should be introduced in order to avoid a wound effect, no significant positive effect of the introduced thermoplastic films is to be expected. In order to choose a thermoplastic material as a sensor substrate, CAI tests are not relevant.
5. Conclusions
The ILS tests show that PEI and PES have excellent shear strength in combination with the prepreg used. In comparison, PA6 exhibits slightly but significantly lower binding but dissipates more energy during crack propagation in the DCB test. However, PEI and PES are also suitable for improving the crack propagation resistance of epoxy resin. The classically used PI shows a locally strongly differing adhesion in the DCB test. Overall, no significant influence of the PI film can be detected in the DCB tests due to the large scattering. Studies on the shear strength of the PI-epoxy interface are still to be carried out.
Neither in the tensile tests nor in the CAI tests a significant influence of any of the inserted film materials can be proven. In the case of the tensile tests, the nonsignificant influences show that the integration of thin thermoplastic films does not noticeably influence the tensile strength of the epoxy resin matrix. Scattering caused by notch effects due to the irregular surface due to the peel ply distinctly overweigh possible influences of the thermoplastic films. This result is not surprising, but it was important to exclude such an influence by means of the tests. In the CAI test, the nonsignificance can be attributed to the small amount of thermoplastic material introduced. If, for example, films were integrated between all prepreg layers, as is the case with interleafing, a significant influence could possibly be observed, but this case does not reflect the situation that occurs with sensor integration.
In further work it is planned to replace the integrated films by film sensors and thus measure the curing reaction. For this reason, the influence of sensor-typical gold patterns on the energy release rate and ILSS will have to be determined in future work. The mechanical influence of the interconnections will also be investigated in further work. Since some of the thermoplastics used in this article are soluble, the interphase formed between epoxy resin and the thermoplastic substrate during curing will also be the subject of further investigations. In addition, the integration of sensors raises manufacturing and electrical questions, which will also have to be addressed.

 ,
, 


